• Analyzes seal quality of pouches and flexible packages
• Characterizes bonded materials
• Works with all materials: film, alu, paper, or composite
• Process control
• Quality control
• Research and development
Seal-Scan™
• Produces a single linear scan in less than 1 second
• Digital pouch seal image in less than one minute
• Images and characterizes bonded materials
• Helps in process optimization
Seal-Scan™ Principle of Through Transmission
SEAL
Transmitter Receiver
Ultrasonic Signal
Pouch seal or package material is placed between ultrasonic transmitter and receiver
Ultrasonic Signal
• Ultrasonic waves propagate through single or multiple layers of well bonded materials.
• Transition through different mediums causes reflection of sound waves and reduces/eliminates signal strength.
Seal-Scan™ TechnologyUltrasonic signal is transmitted along the X-axis through seal and signal is recorded.
Signal measurement correlates to color gauge, creating high resolution image of seal structure and quality.
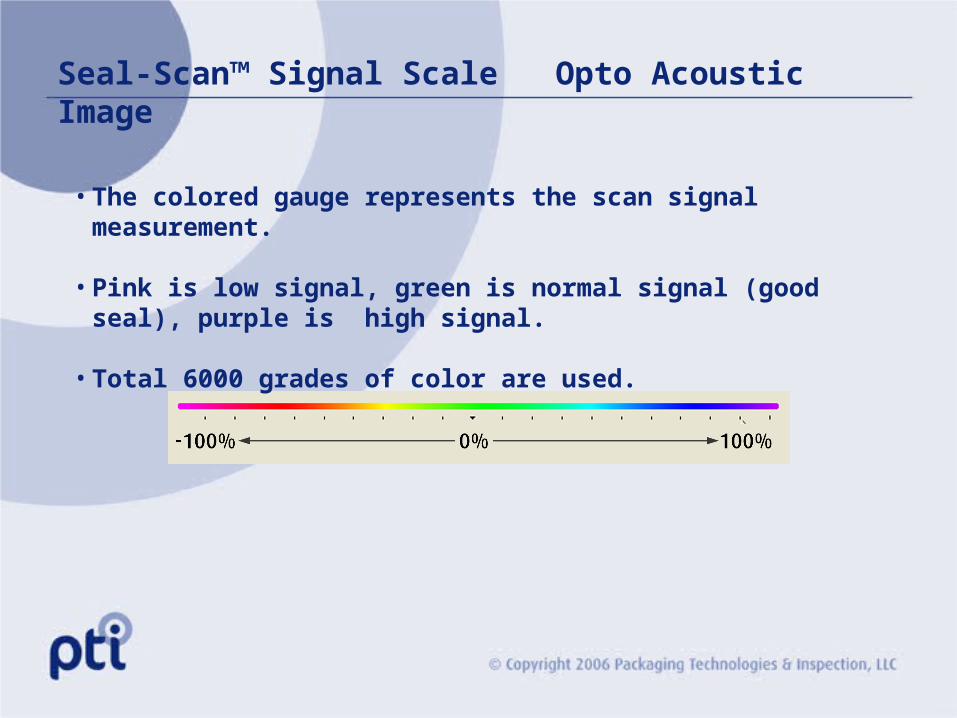
Seal-Scan™ Signal Scale Opto Acoustic Image
•The colored gauge represents the scan signal measurement.
•Pink is low signal, green is normal signal (good seal), purple is high signal.
•Total 6000 grades of color are used.
Scanning Modes
• C-Scan produces an
‘Opto-Acoustic’ image and summary data
• L-Scan produces a graph of the signal and summary data.
Pass – Fail Criteria and Data Integrity
Pass – Fail limits are set for
the average, minimum,
maximum, and standard
deviation of the signal
measurements,
All results are recorded
using the system’s data log.
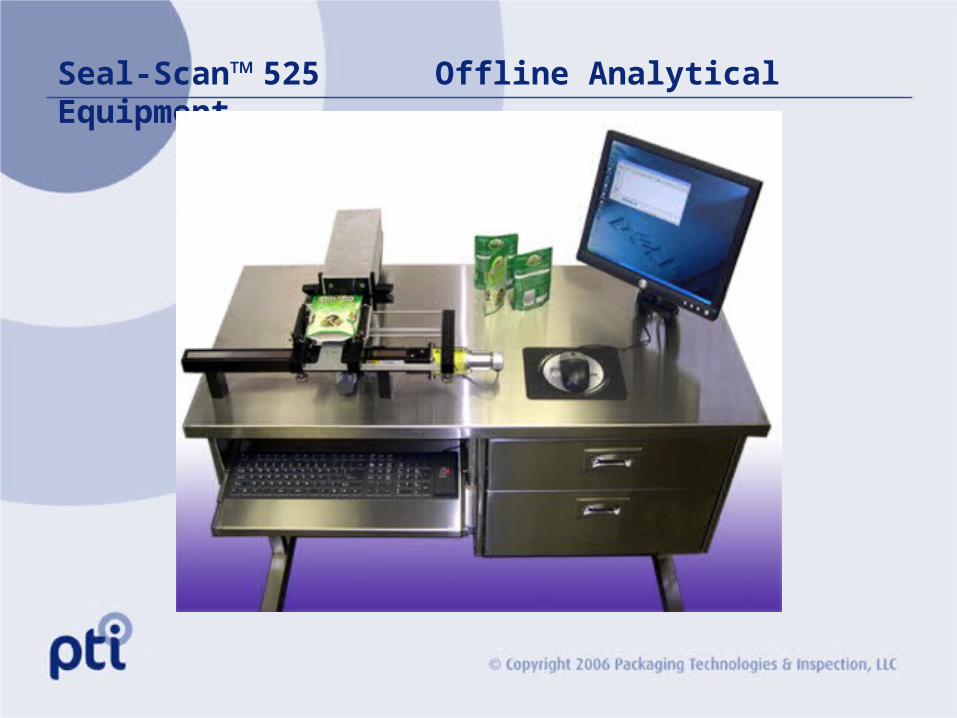
Seal-Scan™ 525 Offline Analytical Equipment
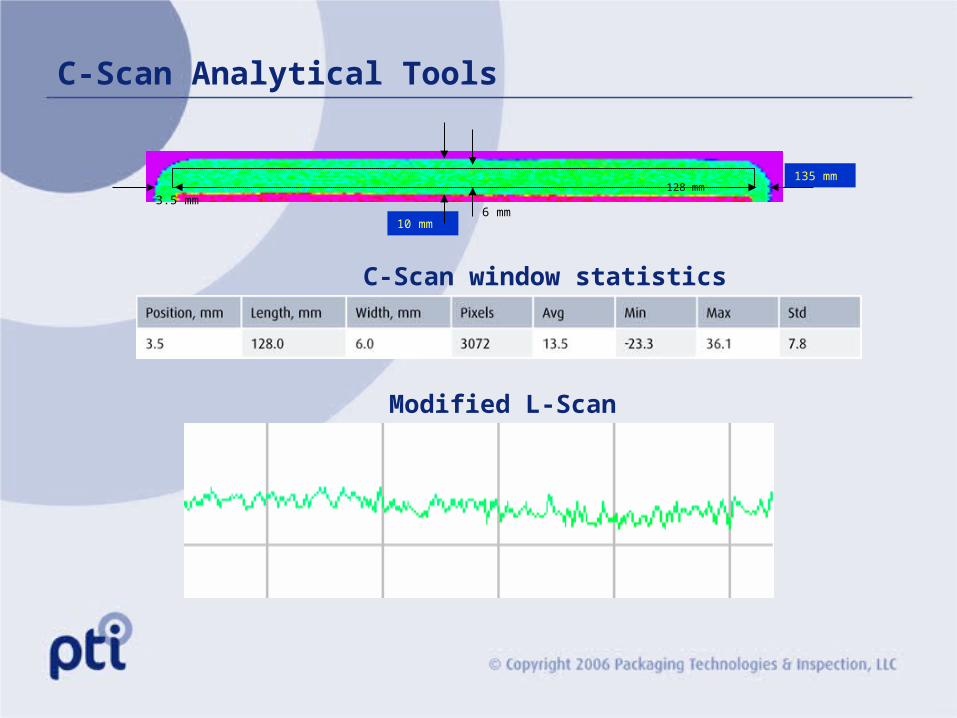
C-Scan Analytical Tools
10 mm
135 mm128 mm
6 mm3.5 mm
C-Scan window statistics
Modified L-Scan
C-Scan Analytical Tools
C-Scan statistics of moving window
10 mm
135 mm16 mm
6 mm3.5 mm
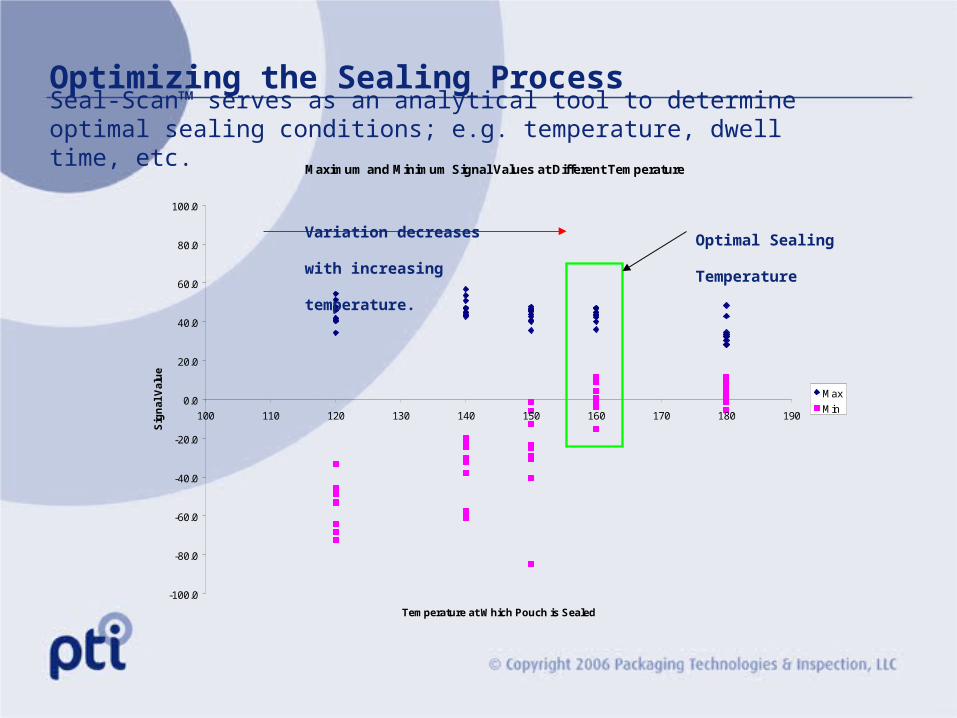
Optimizing the Sealing Process
Maximum and Minimum Signal Values at Different Temperature
-100.0
-80.0
-60.0
-40.0
-20.0
0.0
20.0
40.0
60.0
80.0
100.0
100 110 120 130 140 150 160 170 180 190
Temperature at Which Pouch is Sealed
Sig
na
l V
alu
e
Max
Min
As the the temperature at which the seal is created increases, the maximum signal values are not affected. However, the minimum values experienced increase with higher temperatures, producing optimum seals at 160 and 180.
Variation decreases
with increasing
temperature.
Optimal Sealing
Temperature
Seal-Scan™ serves as an analytical tool to determine optimal sealing conditions; e.g. temperature, dwell time, etc.
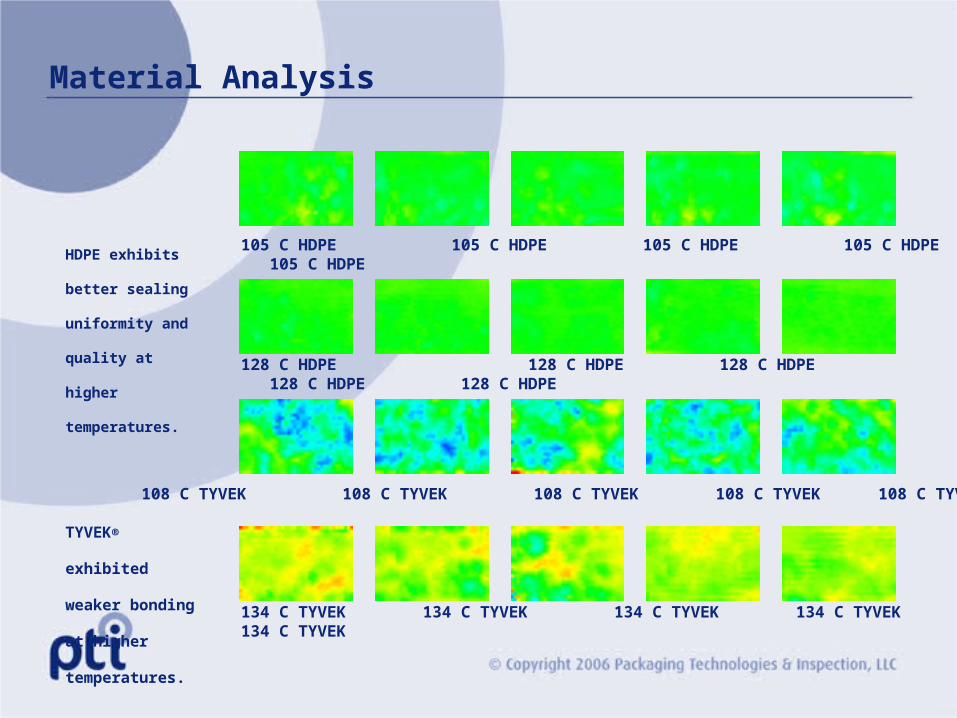
105 C HDPE 105 C HDPE 105 C HDPE 105 C HDPE 105 C HDPE
128 C HDPE 128 C HDPE 128 C HDPE 128 C HDPE 128 C HDPE
108 C TYVEK 108 C TYVEK 108 C TYVEK 108 C TYVEK 108 C TYVEK
134 C TYVEK 134 C TYVEK 134 C TYVEK 134 C TYVEK 134 C TYVEK
Material Analysis
HDPE exhibits
better sealing
uniformity and
quality at higher
temperatures.
TYVEK®
exhibited
weaker bonding
at higher
temperatures.
Background
• Pouches with peelable seals were tested.
• Peel strength test was performed on specific area of seal sample, approximately one-inch.
• Seal-Scan™ C-Scan mode analysis of entire length of seal was performed.
• Results confirm direct correlation of both methods.
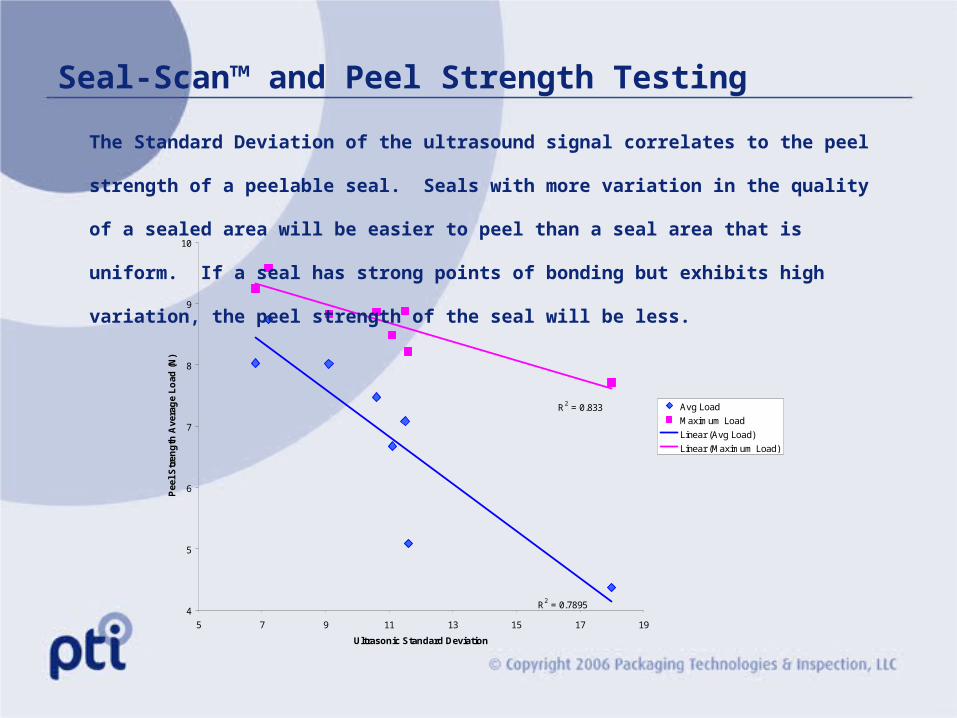
Seal-Scan™ and Peel Strength Testing
Seal-Scan™ and Peel Strength Testing
R2 = 0.7895
R2 = 0.833
4
5
6
7
8
9
10
5 7 9 11 13 15 17 19
Ultrasonic Standard Deviation
Pee
l S
tren
gth
Ave
rag
e L
oad
(N
)
Avg Load
Maximum Load
Linear (Avg Load)
Linear (Maximum Load)
The Standard Deviation of the ultrasound signal correlates to the peel
strength of a peelable seal. Seals with more variation in the quality of a
sealed area will be easier to peel than a seal area that is uniform. If a seal
has strong points of bonding but exhibits high variation, the peel strength
of the seal will be less.
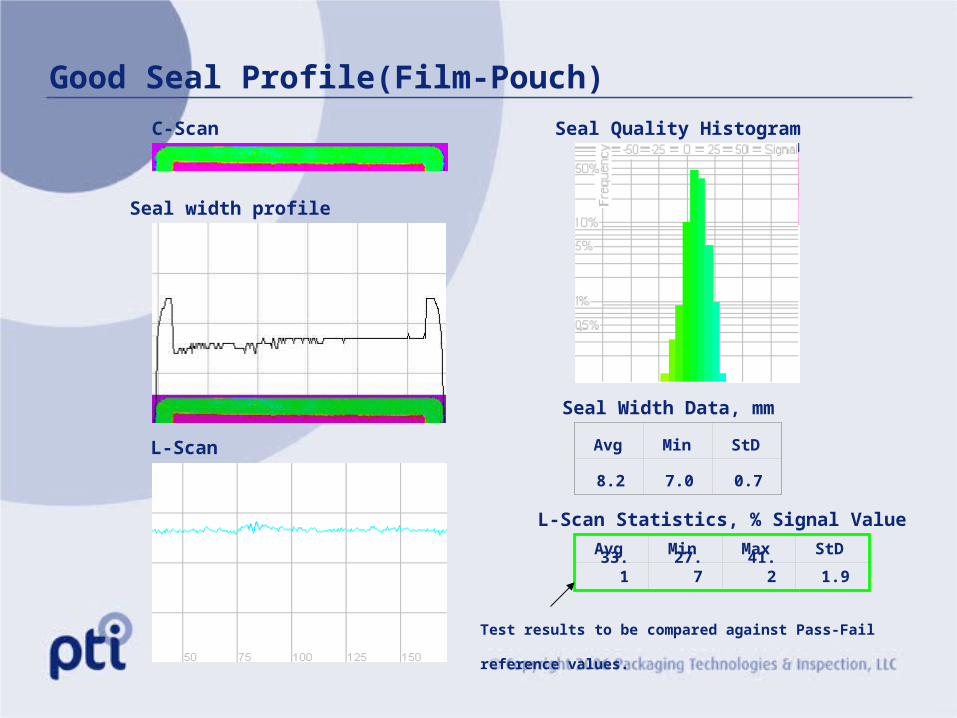
Good Seal Profile(Film-Pouch)
C-Scan
Seal width profile
L-Scan
Seal Width Data, mm
L-Scan Statistics, % Signal Value
Avg
Min
StD
8.2 7.0 0.7
Avg MinMax StD33.
127.
741.
2 1.9
Seal Quality Histogram
Test results to be compared against Pass-Fail
reference values.
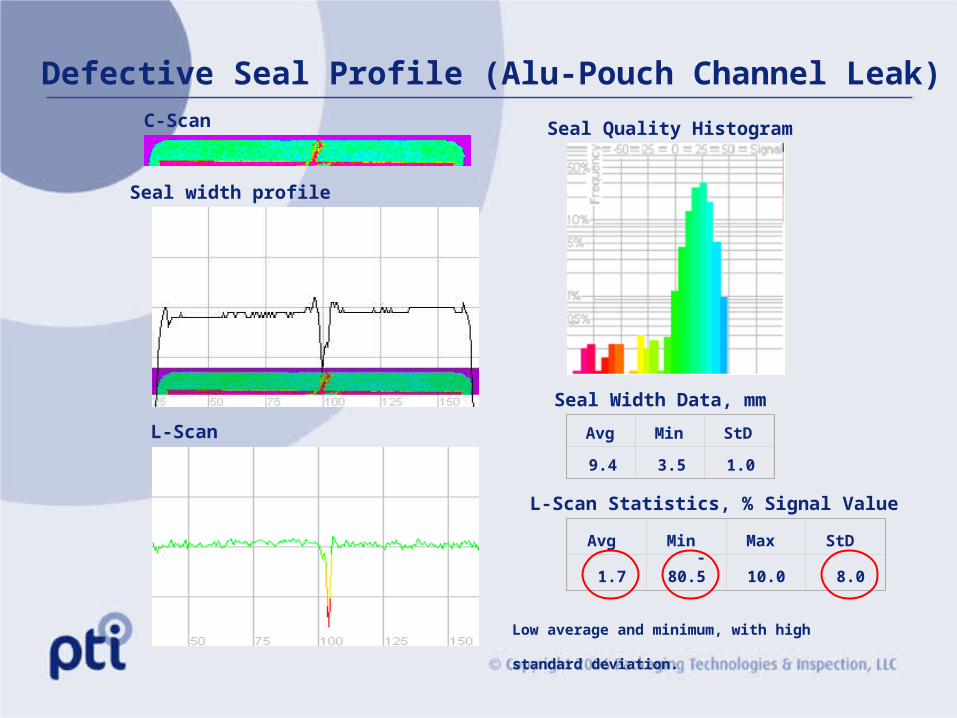
Defective Seal Profile (Alu-Pouch Channel Leak)
Avg
Min
StD
9.4 3.5 1.0
Avg Min Max StD
1.7
-80.
5 10.
0 8.0
C-Scan
Seal width profile
L-Scan
Seal Quality Histogram
Seal Width Data, mm
L-Scan Statistics, % Signal Value
Low average and minimum, with high
standard deviation.
Case Study Heinz Douarnenex, Fr
Defect Profile - 30,000 pouches were visually inspected 100%
Defect type Comment Number detected
Reject Rate
Leak Critical 3 .01%
Corner channel Major or critical 4 .01%
Wrinkle Depends on height 8 .03%
Inclusion Depends on height 4 .01%
Air bubbles Depends on size 19 .06%
Waves Usually minor 12 .04%
Blister Minor 86 .29%
Fold Minor 11 .04%
Total defects 147 .49%
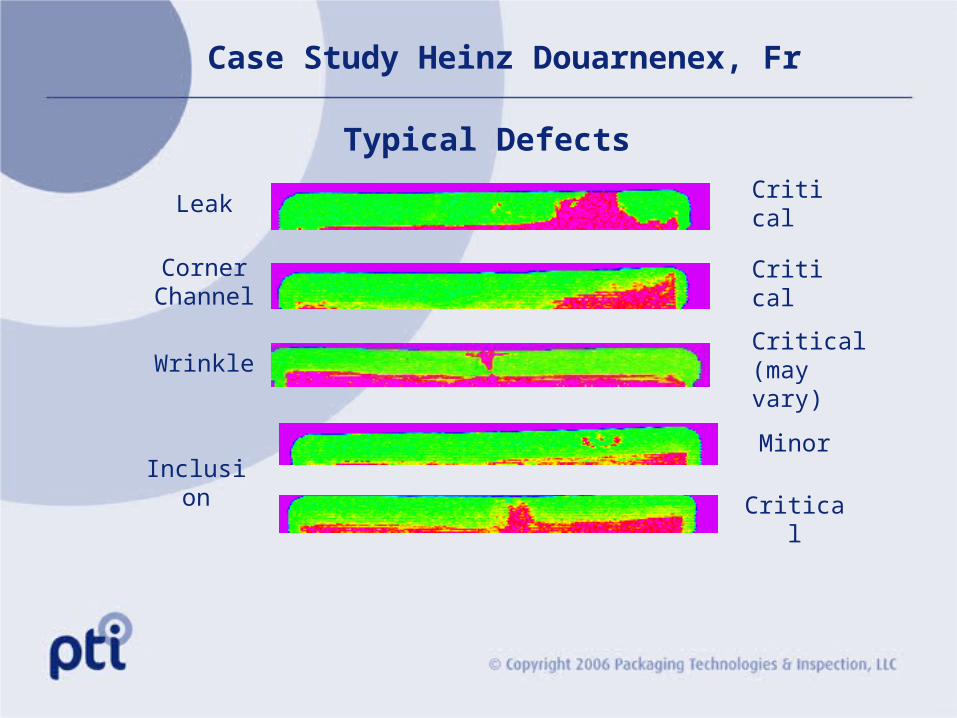
Case Study Heinz Douarnenex, Fr
Typical Defects
Leak Critical
Corner Channel Critical
Wrinkle Critical (may vary)
Inclusion
Minor
Critical
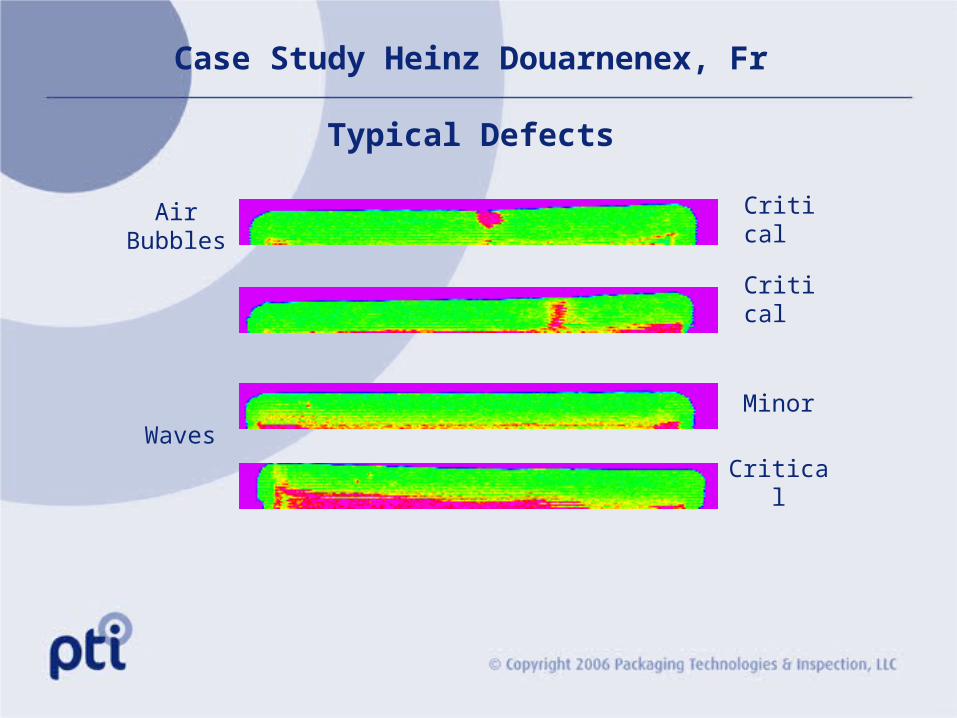
Case Study Heinz Douarnenex, Fr
Typical Defects
Air Bubbles
Critical
Waves
Critical
Minor
Critical
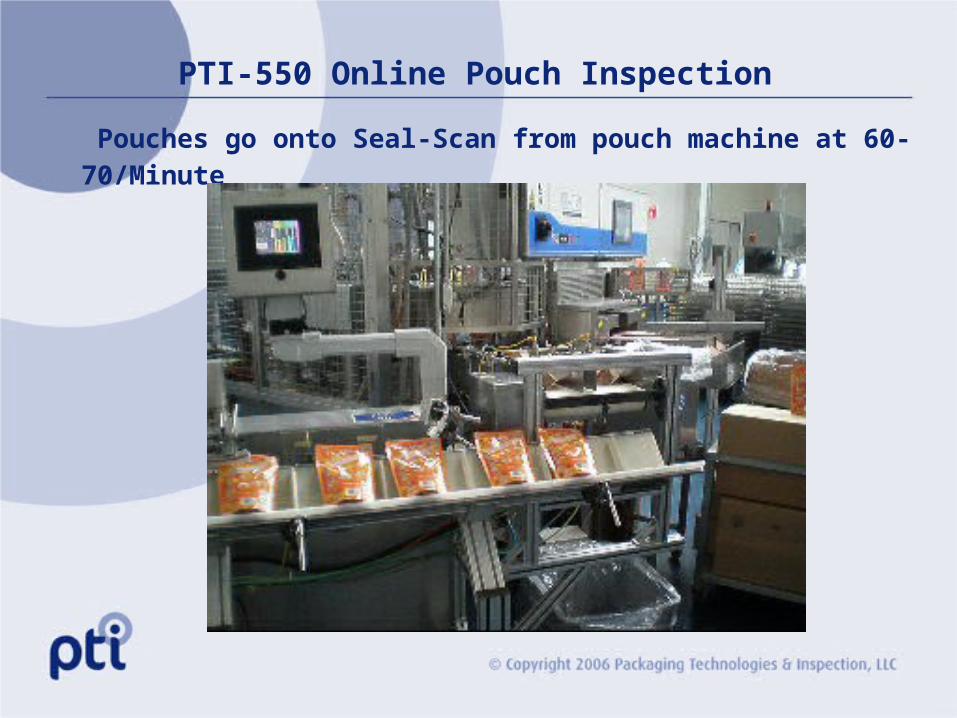
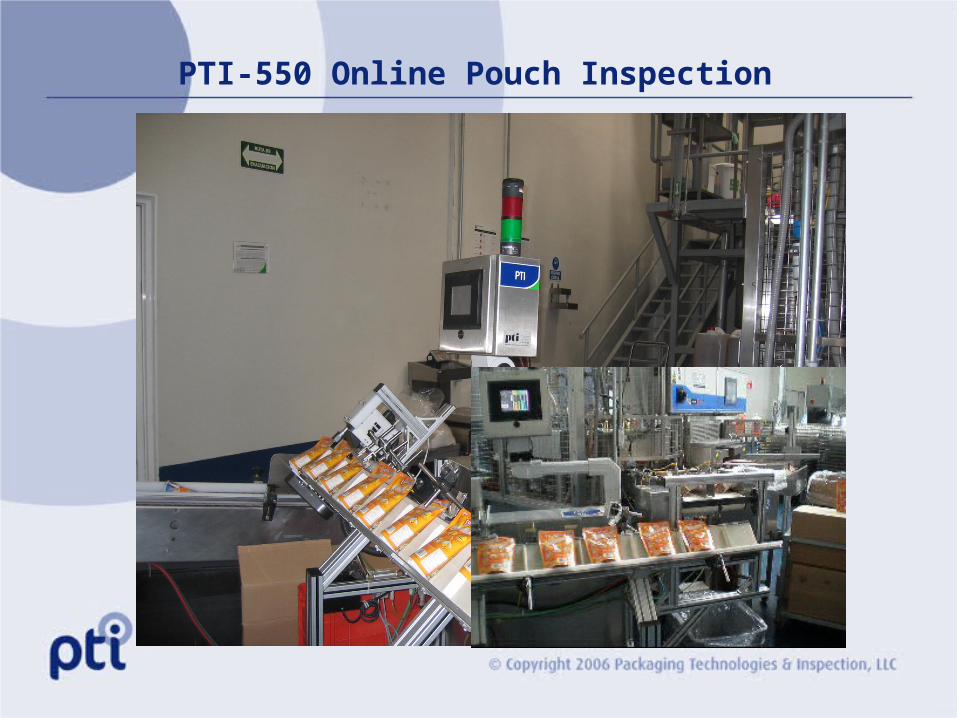
PTI-550 Online Pouch Inspection
Pouches go onto Seal-Scan from pouch machine at 60-70/Minute
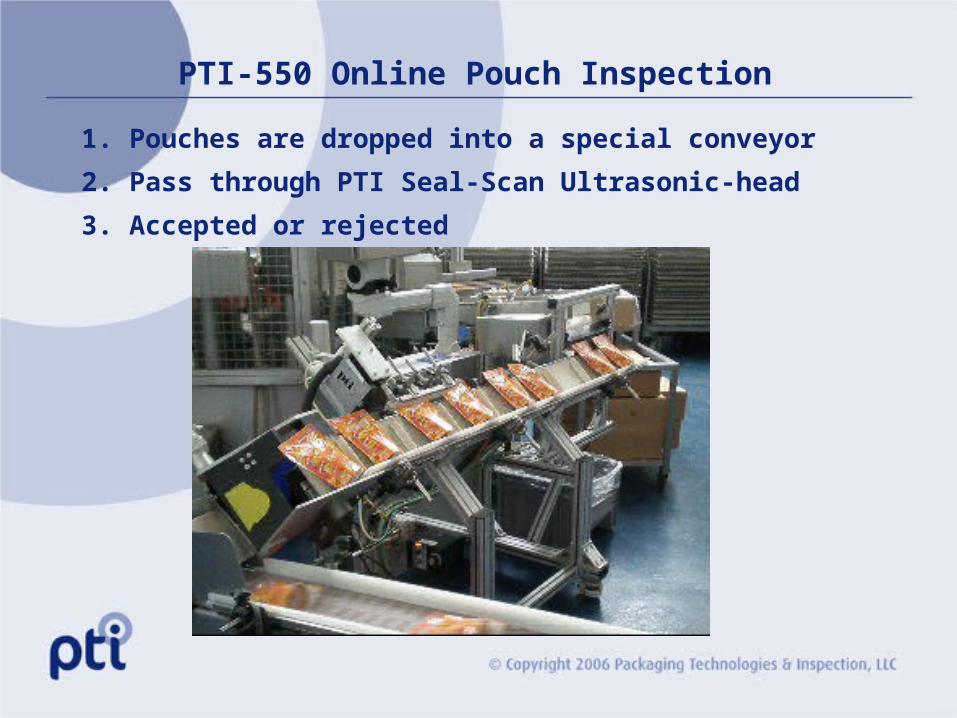
PTI-550 Online Pouch Inspection
1. Pouches are dropped into a special conveyor
2. Pass through PTI Seal-Scan Ultrasonic-head
3. Accepted or rejected
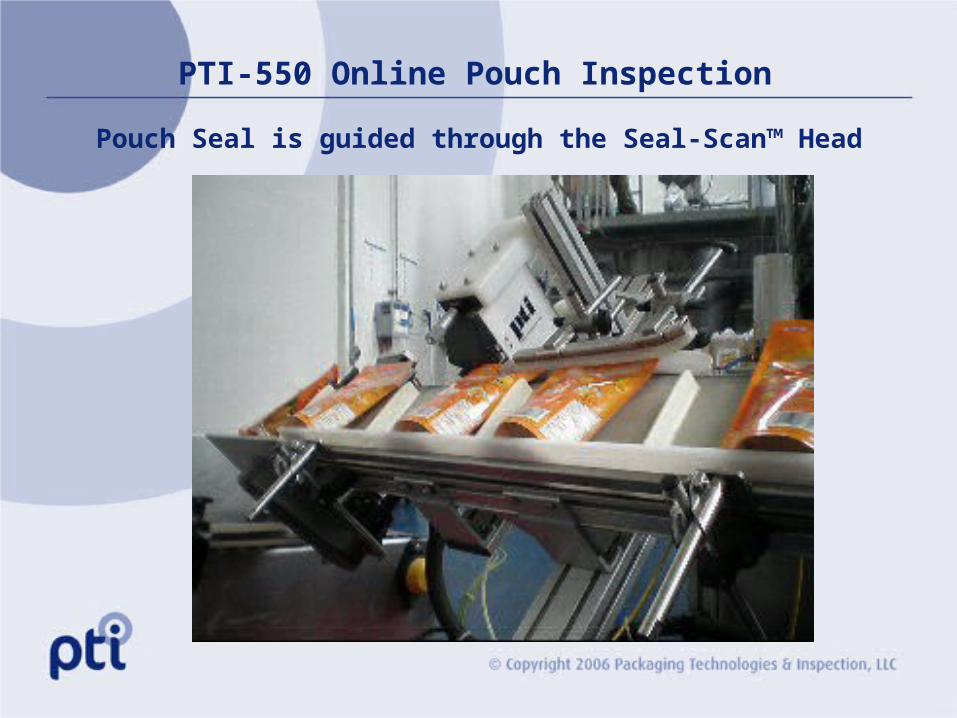
PTI-550 Online Pouch Inspection
Pouch Seal is guided through the Seal-Scan™ Head
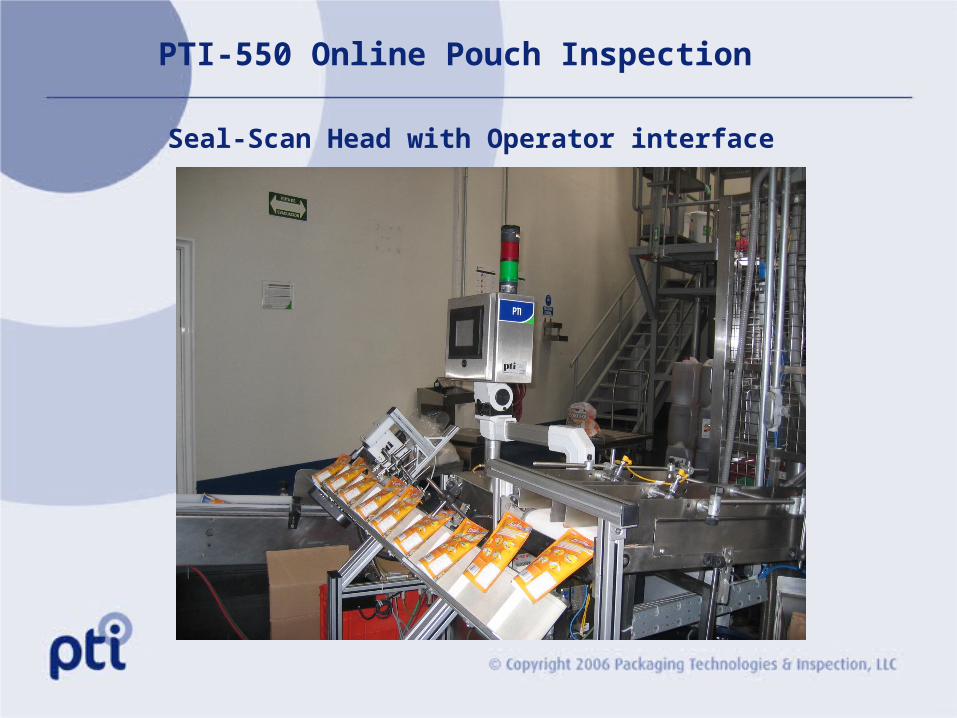
PTI-550 Online Pouch Inspection
Seal-Scan Head with Operator interface
PTI-550 Online Pouch Inspection
Packaging Technologies & Inspection
Seal-Scan™ 525 Defect Gallery
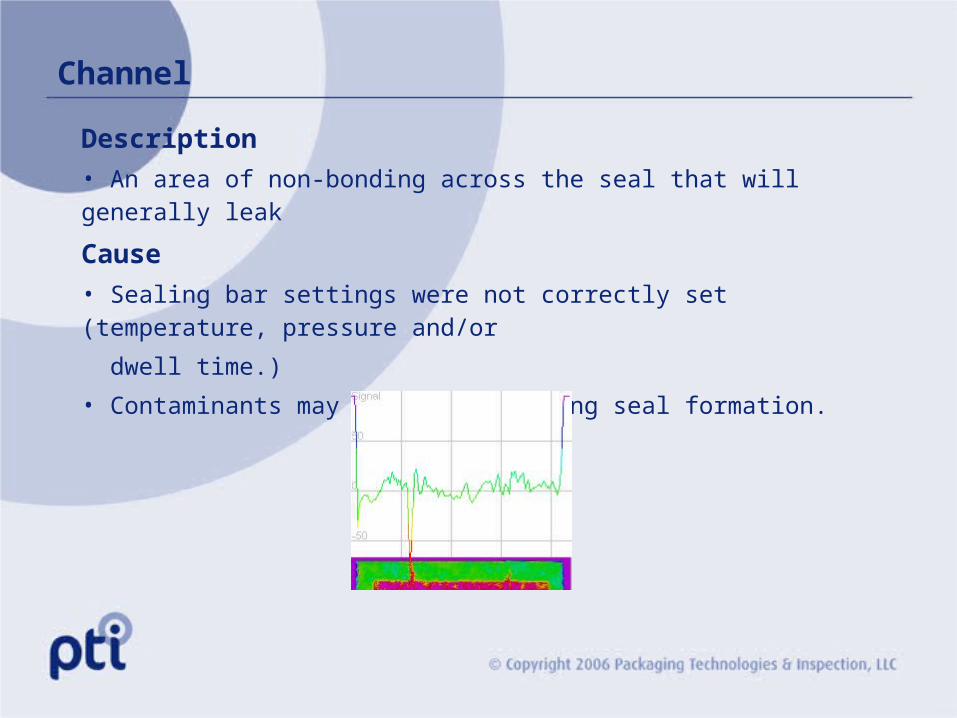
Channel
Description• An area of non-bonding across the seal that will generally leak
Cause• Sealing bar settings were not correctly set (temperature, pressure and/or
dwell time.)
• Contaminants may be present during seal formation.
Compressed Seal
Description• Any separation of laminates in seal area. Material bond strength is
questionable in defect area. Visual evidence of overheating such as
bubbles.
Cause• Sealing bars were too hot during seal formation.
• Material bond strength is inadequate.
Contamination
Description• Foreign material is trapped in seal. Retort pouches will have noticeable
raised areas in seal where sealing bar sealed over contamination.
Cause• Seal area was contaminated during filling stage.
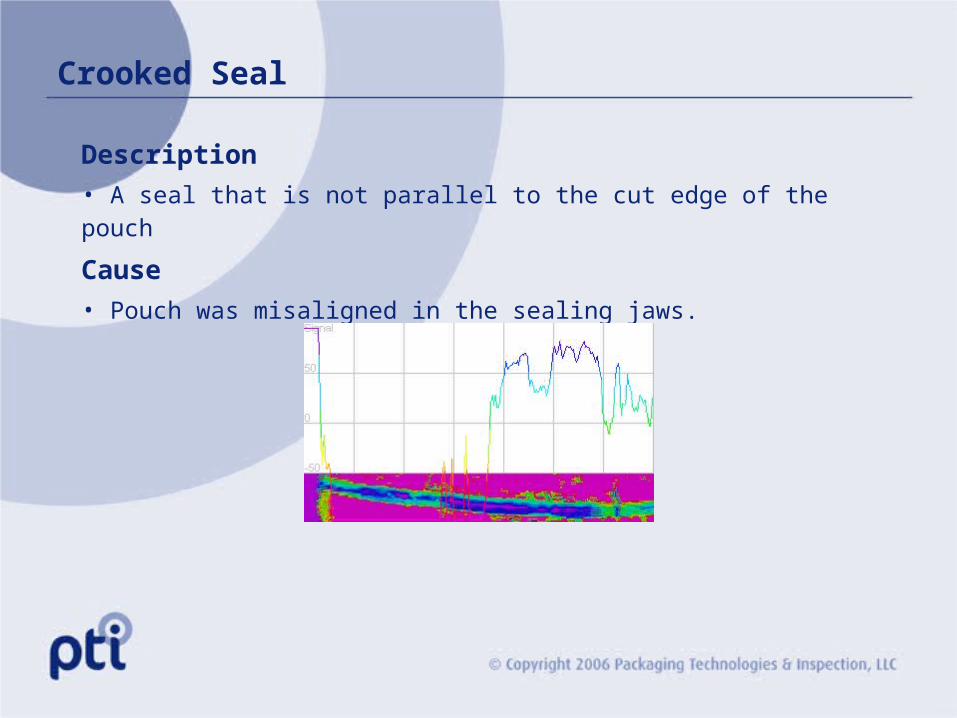
Crooked Seal
Description• A seal that is not parallel to the cut edge of the pouch
Cause• Pouch was misaligned in the sealing jaws.
Cut
Description• A breach of all layers of the laminate, where the hermetic integrity of the
package was compromised.
Cause• Equipment damage or “scrap” between laminate plies during formation.
• Pouch contacted sharp edges of other pouches or equipment.
• Pouches were abused during online or post-process handling.
Delamination
Description• Separation of laminated materials – can occur before or after retort
process. Delaminations ultimately affect seal strength through life
cycle/distribution process.
Cause• If occurring at the seal, bars were too hot during seal formation.
• If during retort process, residual air in the pouch was not controlled to
eliminate pouch expansion during retorting.
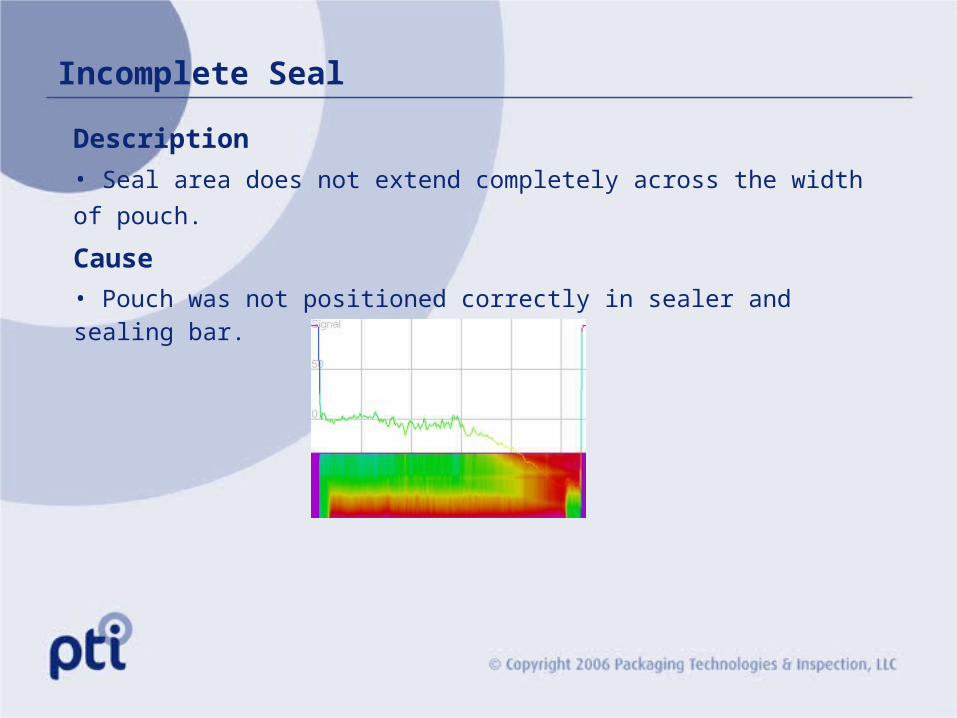
Incomplete Seal
Description
• Seal area does not extend completely across the width of
pouch.
Cause• Pouch was not positioned correctly in sealer and sealing bar.
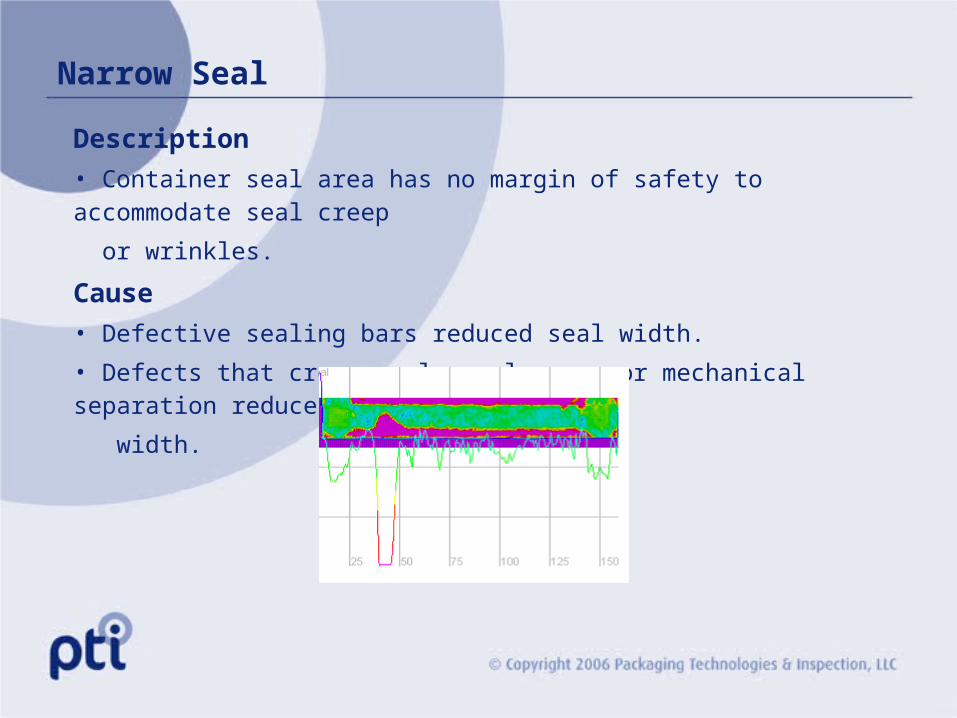
Narrow Seal
Description• Container seal area has no margin of safety to accommodate seal creep
or wrinkles.
Cause• Defective sealing bars reduced seal width.
• Defects that cross seal, seal creep or mechanical separation reduce seal
width.
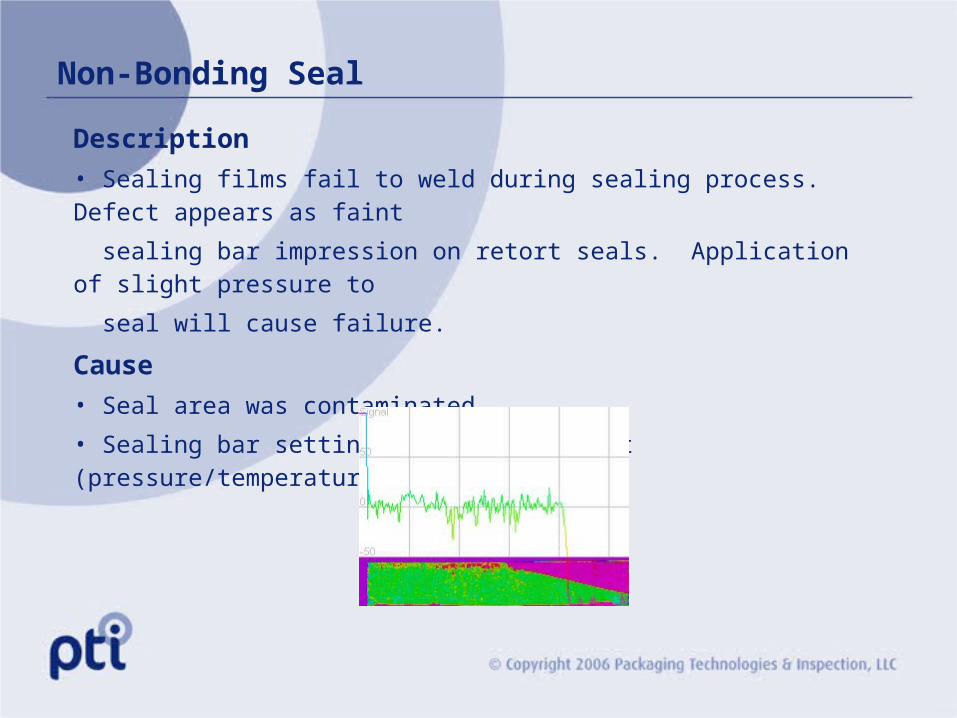
Non-Bonding Seal
Description• Sealing films fail to weld during sealing process. Defect appears as faint
sealing bar impression on retort seals. Application of slight pressure to
seal will cause failure.
Cause• Seal area was contaminated.
• Sealing bar settings were not correct (pressure/temperature/dwell time).
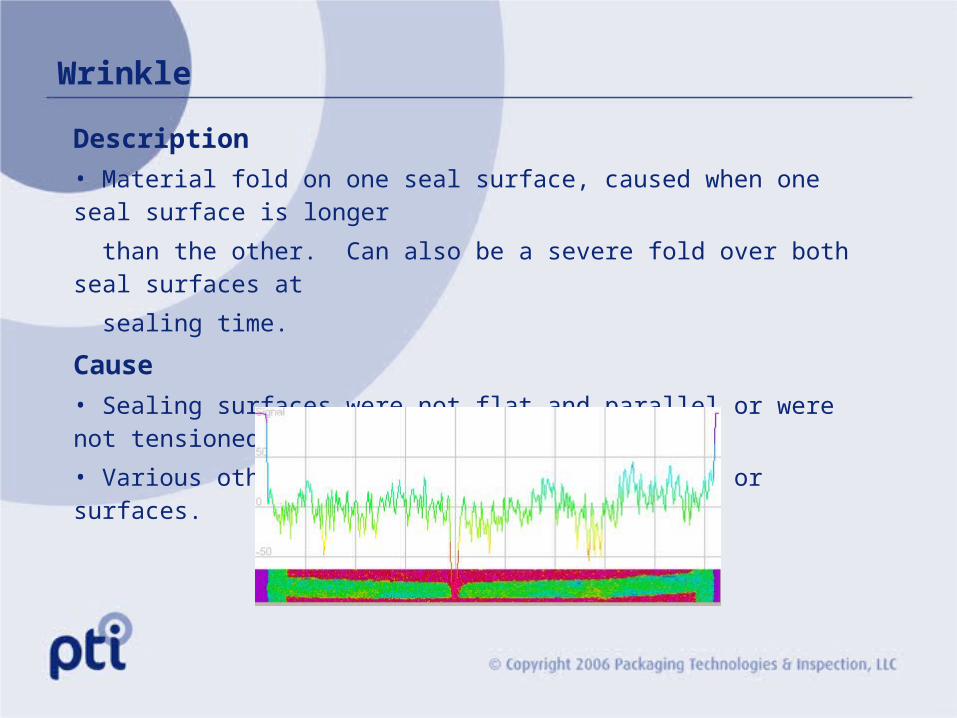
Wrinkle
Description• Material fold on one seal surface, caused when one seal surface is longer
than the other. Can also be a severe fold over both seal surfaces at
sealing time.
Cause• Sealing surfaces were not flat and parallel or were not tensioned.
• Various other irregularities in sealing bar or surfaces.
Pouch Inspection Economics
One technology useable for all materials
Non-Destructive, Non-Invasive
No sample preparation,
No special Inks, no added variable costs
Replaces costly, low efficiency manual Inspection
Reduces/eliminates Incubation
Saves product & packages
Long term quality tracking
Integrates into most pouch sealing machines
Real Time Process Control - allows immediate corrective action