Seals as collectors of oceanographic data in the coastal zone Diego del Villar-Guerra a, * , Michelle Cronin b , Tomasz Dabrowski c , Darius Bartlett d a National Institute of Aquatic Resources, Technical University of Denmark, Vejlsøvej 39, 8600 Silkeborg, Denmark b Coastal and Marine Research Centre, ERI, University College Cork, Ireland c Marine Institute, Oranmore, Galway, Ireland d Department of Geography, University College Cork, Ireland article info Article history: Received 1 November 2011 Accepted 23 September 2012 Available online 5 October 2012 Keywords: seals oceanographic platforms oceanic models thermocline Irish coastal shelf waters abstract Understanding spatial and temporal variation in water temperatures in the coastal zone is generally limited, as conventional monitoring platforms often prove problematic in these areas, e.g. shallow depths limit access by research vessels, and issues of accuracy and resolution can affect the use of remotely sensed sea-surface temperature data. As a result most currently available data on sea temperature are from offshore waters while coastal areas have remained relatively unexplored. Water temperature is an important parameter to study in these coastal waters, considering its impact and influence on the timing and frequency of harmful algal blooms and their associated impacts on aquaculture. It is a significant factor in the timing of the spring bloom and primary productivity, with consequent influences on the entire marine food web. Advances in bio-logging technologies in recent years have provided opportu- nities for sensor deployment on a variety of marine animals, including marine mammals, sea birds, fish and turtles, to gather data from inaccessible areas. In this study, we explored the use of telemetry- derived data from instrumented seals in Kenmare Bay in southwest Irish waters to ascertain if seals can be used as sampling platforms in oceanographic studies in the coastal zone and to examine fine scale changes in water temperatures. High spatial and temporal measurements allowed the characterisation of the water dynamics in the estuarine area by the identification of processes such as thermal stratification, up/downwellings and the onset of the thermocline, and provide unique insights into the marine envi- ronment in and around the bay, where no previous oceanographic studies have been conducted. Strong correlation between the seal-derived temperature data and in situ temperature recorders and modelled data validates the use of seals as oceanographic platforms on different spatial scales. Ó 2012 Elsevier Ltd. All rights reserved. 1. Introduction Bio-logging studies on marine mammals have traditionally been undertaken either to examine behaviour of the animals (e.g. McConnell et al., 1999; Block et al., 2003; Biuw et al., 2007) or to use the animals as sensors to collect data to advance our understanding of the physical structure of the oceans, especially by accessing areas of the water column or seabed not easily reached by other means (e.g. Campagna et al., 2000; Boehlert et al., 2001; Costa et al., 2007; Boehme et al., 2008; Charrassin et al., 2008). More recently, advances in sampling and data retrieval devices have made it possible to combine both types of investigation, allowing a synergy between biological and oceanographic studies (e.g. Fedak et al., 2002; Lydersen et al., 2004). The present study explores the use of telemetry-derived data from instrumented seals (harbour and grey seals) in Irish waters to ascertain if they can be used as sampling platforms in oceano- graphic studies, and to examine fine scale changes in water temperatures in southwest Ireland. To effectively assess the feasi- bility of using seals as oceanographic platforms it has to be ensured that the temperature values recorded by tags on individual animals truly reflect thermal properties of the studied water masses, rather than differences in the animal’s diving behaviour or tag’s perfor- mance. Seals diving behaviour is therefore a principal component to consider in oceanography studies using instrumented animals. As a diving seal moves irregularly both in time and space, the sensors attached to the animal do not sample in regular patterns, thus it is a real challenge to determine whether an observed change in the water column is spatial or temporal. The study area comprises an embayment in southwest Ireland, Kenmare Bay, Co. Kerry. Average sea-surface temperatures for coastal waters to the west and south of Ireland range from 8e10 C in winter to 14e17 C in summer and tend to be several degrees higher in comparison with the Irish Sea. Those differences are related to the warm Atlantic water on the western Irish Shelf (Lee * Corresponding author. E-mail address: [email protected](D. del Villar-Guerra). Contents lists available at SciVerse ScienceDirect Estuarine, Coastal and Shelf Science journal homepage: www.elsevier.com/locate/ecss 0272-7714/$ e see front matter Ó 2012 Elsevier Ltd. All rights reserved. http://dx.doi.org/10.1016/j.ecss.2012.09.010 Estuarine, Coastal and Shelf Science 115 (2012) 272e281
Transcript
at SciVerse ScienceDirect
Estuarine, Coastal and Shelf Science 115 (2012) 272e281
Contents lists available
Estuarine, Coastal and Shelf Science
journal homepage: www.elsevier .com/locate/ecss
Seals as collectors of oceanographic data in the coastal zone
Diego del Villar-Guerra a,*, Michelle Cronin b, Tomasz Dabrowski c, Darius Bartlett d
aNational Institute of Aquatic Resources, Technical University of Denmark, Vejlsøvej 39, 8600 Silkeborg, DenmarkbCoastal and Marine Research Centre, ERI, University College Cork, IrelandcMarine Institute, Oranmore, Galway, IrelanddDepartment of Geography, University College Cork, Ireland
a r t i c l e i n f o
Article history:Received 1 November 2011Accepted 23 September 2012Available online 5 October 2012
* Corresponding author.E-mail address: [email protected] (D. del Villar-Gu
0272-7714/$ e see front matter � 2012 Elsevier Ltd.http://dx.doi.org/10.1016/j.ecss.2012.09.010
a b s t r a c t
Understanding spatial and temporal variation in water temperatures in the coastal zone is generallylimited, as conventional monitoring platforms often prove problematic in these areas, e.g. shallow depthslimit access by research vessels, and issues of accuracy and resolution can affect the use of remotelysensed sea-surface temperature data. As a result most currently available data on sea temperature arefrom offshore waters while coastal areas have remained relatively unexplored. Water temperature is animportant parameter to study in these coastal waters, considering its impact and influence on the timingand frequency of harmful algal blooms and their associated impacts on aquaculture. It is a significantfactor in the timing of the spring bloom and primary productivity, with consequent influences on theentire marine food web. Advances in bio-logging technologies in recent years have provided opportu-nities for sensor deployment on a variety of marine animals, including marine mammals, sea birds, fishand turtles, to gather data from inaccessible areas. In this study, we explored the use of telemetry-derived data from instrumented seals in Kenmare Bay in southwest Irish waters to ascertain if sealscan be used as sampling platforms in oceanographic studies in the coastal zone and to examine fine scalechanges in water temperatures. High spatial and temporal measurements allowed the characterisation ofthe water dynamics in the estuarine area by the identification of processes such as thermal stratification,up/downwellings and the onset of the thermocline, and provide unique insights into the marine envi-ronment in and around the bay, where no previous oceanographic studies have been conducted. Strongcorrelation between the seal-derived temperature data and in situ temperature recorders and modelleddata validates the use of seals as oceanographic platforms on different spatial scales.
� 2012 Elsevier Ltd. All rights reserved.
1. Introduction
Bio-logging studies onmarine mammals have traditionally beenundertaken either to examine behaviour of the animals (e.g.McConnell et al., 1999; Block et al., 2003; Biuw et al., 2007) or to usethe animals as sensors to collect data to advance our understandingof the physical structure of the oceans, especially by accessing areasof the water column or seabed not easily reached by other means(e.g. Campagna et al., 2000; Boehlert et al., 2001; Costa et al., 2007;Boehme et al., 2008; Charrassin et al., 2008). More recently,advances in sampling and data retrieval devices have made itpossible to combine both types of investigation, allowing a synergybetween biological and oceanographic studies (e.g. Fedak et al.,2002; Lydersen et al., 2004).
The present study explores the use of telemetry-derived datafrom instrumented seals (harbour and grey seals) in Irish waters to
erra).
All rights reserved.
ascertain if they can be used as sampling platforms in oceano-graphic studies, and to examine fine scale changes in watertemperatures in southwest Ireland. To effectively assess the feasi-bility of using seals as oceanographic platforms it has to be ensuredthat the temperature values recorded by tags on individual animalstruly reflect thermal properties of the studied water masses, ratherthan differences in the animal’s diving behaviour or tag’s perfor-mance. Seals diving behaviour is therefore a principal componentto consider in oceanography studies using instrumented animals.As a diving seal moves irregularly both in time and space, thesensors attached to the animal do not sample in regular patterns,thus it is a real challenge to determinewhether an observed changein the water column is spatial or temporal.
The study area comprises an embayment in southwest Ireland,Kenmare Bay, Co. Kerry. Average sea-surface temperatures forcoastal waters to the west and south of Ireland range from 8e10 �Cin winter to 14e17 �C in summer and tend to be several degreeshigher in comparison with the Irish Sea. Those differences arerelated to the warm Atlantic water on the western Irish Shelf (Lee
D. del Villar-Guerra et al. / Estuarine, Coastal and Shelf Science 115 (2012) 272e281 273
and Ramster, 1981; Elliott, 1991). In winter Irish coastal and shelfwaters are vertically well mixed with little differences in thesurface-to-bottom distribution of temperature within the watercolumn. As the water column stratifies in summer, a surfaceeto-bottom temperature difference of up to 6 �C is typical of watersalong the Atlantic Shelf and Celtic Sea (Cooper, 1967; Raine andMcMahon, 1998). Southwest coastal waters are characterized byepisodic occurrence of coastal upwelling (Edwards et al., 1996),which is primarily wind-driven but can also occur as a result of thebottom topography (O’Boyle and Silke, 2010). Wind-drivenupwelling observed around the southwest coast of Ireland isoften associated with elevated biomass levels and changes inphytoplankton composition (Raine et al., 1990a,b, 1993c, 2010;O’Boyle and Silke, 2010). Such episodes are highly variable inperiodicity and magnitude. During periods of relaxation ofupwelling, the water surface of this area stabilizes, and is verysimilar to that of the stratified Atlantic Shelf (Edwards et al., 1996).Such events have a profound effect on the ecology of these areas(O’Boyle and Silke, 2010).
Understanding spatial and temporal variation in watertemperatures in the coastal zone is generally limited, as conven-tional monitoring platforms prove problematic in these areas e.g.shallow depths limit access by research vessels, and there are issuesof accuracy and resolution with remotely sensed sea-surfacetemperature data in the coastal zone (Malthus and Mumby, 2003;Hedger et al., 2007). Although near shore boys and pier basedmeasurements sites contribute to understanding near coastalprocesses these gauges are usually rather sparse, and restricted tocertain water bodies (Dwyer, 2009).
As a result most currently available data on temperature in Irishwaters are from further offshore, while coastal areas have remainedrelatively unexplored. Water temperature is an important param-eter to study in these coastal waters, considering its impact andinfluence on the timing and frequency of harmful algal blooms andtheir associated impacts on aquaculture. It is a significant factor inthe timing of the spring bloom and primary productivity, withconsequent influences on the entire marine food web.
Due to a high degree of site-fidelity and coastal foraging Ire-lands’ two seal species, the grey seal (Halichoerus grypus) andharbour seal (Phoca vitulina vitulina) are ideal for the study ofcoastal/estuarine water masses by means of bio-logging. Seals haveestablished themselves at terrestrial colonies along the coastline ofIreland (Ó Cadhla et al., 2005; Cronin et al., 2007) where they comeashore to breed and moult, thus being available for capture andsensor deployment. Both species of seal have different foragingranges and distributions: harbour seals generally make small-scalelocal foraging trips, whilst grey seals range over much wider areas(Cronin et al., in press), providing platforms for monitoring watertemperature at two different spatial scales.
The present study assesses the feasibility of using seals asplatforms for monitoring water temperature in waters off thesouthwest and west coasts of Ireland on two spatial scales bycomparing the seal-acquired data to in situ temperature recordingsin a bay in southwest Ireland, and to predicted temperatures ofwater masses off the entire west coast of Ireland derived froma global ocean model (Olbert et al., 2011). Detailed examination ofthe thermal characteristics of water masses within Kenmare Bay, insouthwest Ireland, was conducted and temporal variation in theoccurrence of the thermocline during the study period examinedusing the data acquired by the seal-deployed sensors. Someoceanographic studies have previously been conducted in BantryBay, immediately to the south of Kenmare Bay (Raine et al., 1990a,b,1993a,b,c; Edwards et al., 1996; McMahon and Silke, 1997; Gribbleet al., 2007). However, this research constitutes the first attempt tostudy seasonal water temperature change in Kenmare Bay.
2. Material and methods
Between 2006 and 2009, 8 grey seals (Halichoerus grypus) and17 harbour seals (Phoca vitulina vitulina) on the southwest coast ofIreland were tagged with GSM/GPS tags with temperature sensors(Sea Mammal Research Unit, 2008). For details of capture anddeployment of tags on the harbour seals in 2006 and 2007 seeCronin and McConnell (2008). Capture of grey seals and deploy-ment of 8 GPS/GSM tags was carried out at haul-out sites on An TráBán on the Great Blasket Island, Co. Kerry (52.08�Ne10.62�W) inFebruary 2009. Grey seals use the beach as a moult site betweenDecember and May each year. Tags were glued to the seals furbehind the head, tagging therefore took place post-moult to ensurea maximum period of tag attachment. The site was chosen becauseof its national importance and its location in southwest Irelandwhere previous tagging efforts on harbour seals had been con-ducted (Cronin et al., 2007; Cronin and McConnell, 2008).Temperature data collected by the tags during the period ofFebruary to December 2009 were compared to temperature dataprovided by ocean models of the western Irish shelf (Olbert et al.,2011). The temperature data collected by the tags deployed onthe harbour seals during themonths of April to August for the years2006 and 2007were examined for temporal and spatial variation inwater temperatures within the outer regions of Kenmare Bay, Co.Kerry (51.78�Ne9.94�W) (Fig. 1.)
2.1. Tag hardware and data acquisition
The GSM/GPS tags attached to the seals combine the advantagesof GPS positioning with mobile telephone technologies for efficientdata transmission. They also incorporated a hybrid fast acquisitionGPS system Fastloc (Wildtrack Telemetry Systems, Leeds) (see Rutzand Hays, 2009), providing up to 12 at-sea positions per day. Thetag also processes data from wet/dry, pressure and temperaturesensors, to form detailed individual dive and haul-out records alongwith temperature profiles.
The thermal sensor in the tag recorded temperature values inCelsius with a resolution of 0.01 �C. The ranges of readings were5 �C to 35.95 �C, in increments of 0.01 �C. The temperature sensorwas triggered if a dive was one of the two deepest dives in each 2-hperiod. Temperature datawere recorded at one-second intervals onthe ascent. Filtering and compression were performed by conven-tional broken-stick method (Fedak et al., 2002), producing 12temperatureedepth pairs. The GPS locations, dive, haul-out recordsand temperature data were stored on board the tag. Every 6 h thetag attempted to register with a local GSM mobile phone serviceprovider. Once GSM coverage was obtained, normally when a sealcame near shore, the entire set of data records stored in memorywas relayed via the mobile phone system to the receiving database(McConnell et al., 2004).
2.2. Variation in temperature data between individual tags
Kernel analysis (Silverman, 1986) was used in order to selecthigh-density sampled areas, where there is greater probability offinding different individual seals sampling within the same waterbody, across the same period of time. Tests were conducted todetermine if there were differences in the data collected bydifferent seals in the same area (clusters), within the same period oftime, to examine if there was variability in thermal sensor sensi-tivities and/or tag performance. Clusters were defined as those 95%Kernel areas where two or more individuals were recordingtemperature data at the same time. A ManneWhitney U test wasused to determine variation in the temperature data between twoindividuals in the same cluster, and KruskaleWallis test when the
Fig. 1. (a) Sampling area of grey seals on continental shelf (FebruaryeDecember 2009), tagging site at Blasket Islands, Co Kerry and outline of area compared to ocean model datashown. (b) Sampling area of harbour seals in Kenmare Bay (AprileAugust 2007 and 2008), tagging site shown.
D. del Villar-Guerra et al. / Estuarine, Coastal and Shelf Science 115 (2012) 272e281274
comparison involved more than two individuals. Temperaturerecords were examined from 5 m depth to 40e60 m. Subsequentanalyses were only carried out on data from tags that did not differsignificantly from other tags in the same cluster, indicating reliabletag performance.
2.3. Thermal variations in Kenmare Bay and thermoclineidentification
Temperature data collected by harbour seals during the monthsApril to August for two consecutive years, 2006 and 2007, wereexamined. During this time, seals spent over 90% of the deploymentperiod in lowerKenmareBayapproximatinganarea of 50 km2 (Fig.1).
The thermal variations in Kenmare Bay were mapped usingOcean Data View v.4 (ODV) software (Schlitzer, 2009) and DIVAgridding interpolation was applied (DIVA-Interpolation, 2009). Toidentify the variation in the thermocline in the waters of KenmareBay, across the tagging period, we used threshold methods(Thomson and Fine, 2003) using a depth-to-depth temperaturedifference (e.g. Defant, 1961; Wijffels et al., 1994; Kara et al., 2000,2001). The derivative of the temperatureedepth function wascalculated at each pair of consecutive depth points through eachtemperatureedepth profile, for all the profiles as follows:
y ¼ DT ¼ jTzb � Tzaj (1)
where Tzb is the temperature at depth zb and Tza the temperature atdepth za, za and zb ranging from a minimum of 5 m to a maximumof 200 m. The maximum rate of temperature change over a smalldepth increment equated with those points where the minimumslope, Min slope, of the temperatureedepth profile was observed,and this was considered to indicate the presence of the hypothet-ical existence of thermocline for each profile.
Min slope ¼ max�
Dyzb� za
�(2)
The average of temperatures Tza and Tzb where the minimumslope was observed constituted the TMin slope. To study thermal
variations through all the temperatureedepth profiles in a monthlybasis the simple moving average method (SMA) was performed tothe TMin slope. It was assumed that this is where the relevantinformation in terms of the study of the thermocline is presented.The moving average for a specific time was computed as follows:
SMAðtÞ ¼ SMAðt�1Þ �TMin slopeðt�nÞ þ T Min slopeðtÞ
n(4)
where T Min slope ðtÞ represents the value of temperature ofminimum slope at particular time, t and n is the number ofobservations.
The data were examined for evidence of up/downwelling,stratification and temporal variation in the thermocline during thestudy period in the Kenmare Bay between the months April andAugust for two consecutive years (2006 and 2007). A KruskaleWallis test was performed to examine the differences on thethermocline across the study period.
2.4. Tag-derived temperature data validation
Validation of the tag-derived temperature data was carried outat two spatial scales. First temperature data from a seal tagged inthe Kenmare Bay that spent a significant proportion of time inBantry Bay (approximately 20 km south of Kenmare Bay) wascompared with temperature records provided by internal loggingtemperature sensors (Tidbits) deployed by the Irish Marine Insti-tute in Bantry Bay. The Tidbit sensor is a completely sealedunderwater temperature logger with optic communication,providing hourly temperature data at several depths (1 m, 8 m and12 m) in the water column (Onset� Hobo�, Data loggers). Tag-derived temperature data sampled from points within the 100 mbuffer surrounding the station were selected for comparison anda non-parametric linear regression of tag and Tidbit derivedtemperature data was conducted. A total of 287 seal-derivedtemperature profiles were compared to Tidbit data.
D. del Villar-Guerra et al. / Estuarine, Coastal and Shelf Science 115 (2012) 272e281 275
Second, temperature data from 8 tags deployed on grey seals,which have a much wider at-sea distribution than harbour seals(Fig.1), approximating 60,000 km2were compared to temperaturespredicted by the MPI-OM global ocean model developed at theMax-Planck-Institute for Meteorology, Hamburg, Germany. Tech-nical details of the MPI-OMmodel and the model parameterizationcan be found in Marsland et al. (2003).
This model has been validated for Irish coastal waters (Olbertet al., 2011) and had been previously used in the study of regionalclimate changes in the Irish Sea (Olbert et al., 2012). The modelproduced vertical distributions of water temperatures off the westcoast of Ireland (see Olbert et al., 2011) facilitating comparisons tothe seal-derived temperature data. The model predictions werecompared to the temperature data recorded by the 8 seal-deployedsensors for the same geographical area (see Fig. 1) (52e57.9�N and6.2e11.2�W) between February 2009 and December 2009 usinga non-parametric linear regression. Mann-Whitney U tests wereused to determine differences between the two data sets whencomparisons of temperature at specific depths were made (at 10e30 m intervals between 5 and 205 m).
3. Results
Over 20,000 temperatureedepth profiles of the water columnwere recorded by the tags deployed on the 25 seals during thestudy period, totalling over 0.25 million separate temperaturereadings. A total of 10,904 temperature/depth profiles wereprovided by 17 harbour seals tagged during April 2006eMay 2008over 1233 days. During this period these tags recorded an averageof 2.64 temperature/depth profiles per day. A total of 11,556temperature/depth profiles were recorded by 8 grey seals taggedduring February to December 2009 over 1575 days, collecting anaverage of 7.19 temperature/depth profiles per day.
3.1. Tag validation
Cluster analysis revealed that 19 out of 25 tags showed nosignificant differences in the data collected by seals in the sameclusters within the same period of time and were considered forfurther analysis. In the cases where significant differences werefound between readings taken by tags attached to the seals withinthe same cluster these data were not used for subsequent analysisof temperature distribution.
3.2. Temperature distributions in Kenmare Bay
The median sea-surface temperature (0e10 dbars) increasedfrom 10.67�1.08 �C in April 2006 to over 18 �C by August 2006 incertain areas of the outer Kenmare Bay. Cold water from 9.0 to9.5 �C was observed in April at a depth of 25 dbars and in May at40 dbars. The decrease in depth of the 9e9.5 �C isotherm suggesteda progressive solar heating of the water column. Coinciding withthis warming, a continuous stratification process was observedduring June, July and August 2006 (Fig. 2).
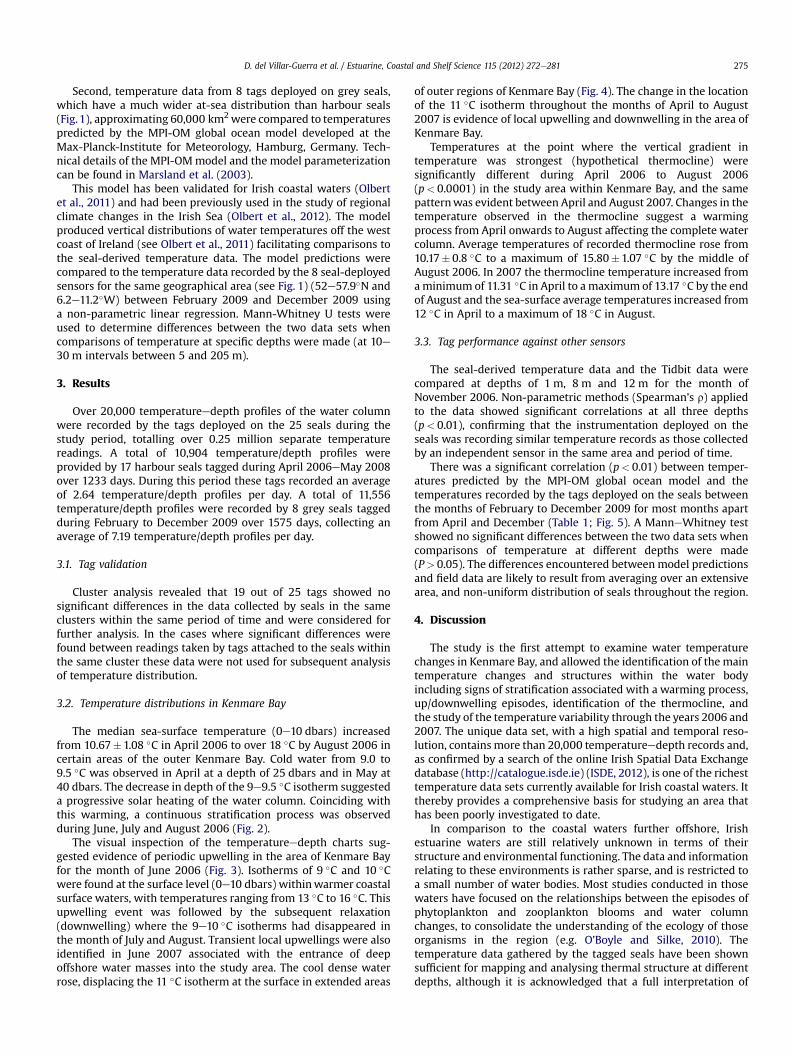
The visual inspection of the temperatureedepth charts sug-gested evidence of periodic upwelling in the area of Kenmare Bayfor the month of June 2006 (Fig. 3). Isotherms of 9 �C and 10 �Cwere found at the surface level (0e10 dbars) withinwarmer coastalsurface waters, with temperatures ranging from 13 �C to 16 �C. Thisupwelling event was followed by the subsequent relaxation(downwelling) where the 9e10 �C isotherms had disappeared inthe month of July and August. Transient local upwellings were alsoidentified in June 2007 associated with the entrance of deepoffshore water masses into the study area. The cool dense waterrose, displacing the 11 �C isotherm at the surface in extended areas
of outer regions of Kenmare Bay (Fig. 4). The change in the locationof the 11 �C isotherm throughout the months of April to August2007 is evidence of local upwelling and downwelling in the area ofKenmare Bay.
Temperatures at the point where the vertical gradient intemperature was strongest (hypothetical thermocline) weresignificantly different during April 2006 to August 2006(p< 0.0001) in the study area within Kenmare Bay, and the samepatternwas evident between April and August 2007. Changes in thetemperature observed in the thermocline suggest a warmingprocess from April onwards to August affecting the complete watercolumn. Average temperatures of recorded thermocline rose from10.17� 0.8 �C to a maximum of 15.80�1.07 �C by the middle ofAugust 2006. In 2007 the thermocline temperature increased fromaminimum of 11.31 �C in April to a maximum of 13.17 �C by the endof August and the sea-surface average temperatures increased from12 �C in April to a maximum of 18 �C in August.
3.3. Tag performance against other sensors
The seal-derived temperature data and the Tidbit data werecompared at depths of 1 m, 8 m and 12 m for the month ofNovember 2006. Non-parametric methods (Spearman’s r) appliedto the data showed significant correlations at all three depths(p< 0.01), confirming that the instrumentation deployed on theseals was recording similar temperature records as those collectedby an independent sensor in the same area and period of time.
There was a significant correlation (p< 0.01) between temper-atures predicted by the MPI-OM global ocean model and thetemperatures recorded by the tags deployed on the seals betweenthe months of February to December 2009 for most months apartfrom April and December (Table 1; Fig. 5). A ManneWhitney testshowed no significant differences between the two data sets whencomparisons of temperature at different depths were made(P> 0.05). The differences encountered betweenmodel predictionsand field data are likely to result from averaging over an extensivearea, and non-uniform distribution of seals throughout the region.
4. Discussion
The study is the first attempt to examine water temperaturechanges in Kenmare Bay, and allowed the identification of the maintemperature changes and structures within the water bodyincluding signs of stratification associated with a warming process,up/downwelling episodes, identification of the thermocline, andthe study of the temperature variability through the years 2006 and2007. The unique data set, with a high spatial and temporal reso-lution, contains more than 20,000 temperatureedepth records and,as confirmed by a search of the online Irish Spatial Data Exchangedatabase (http://catalogue.isde.ie) (ISDE, 2012), is one of the richesttemperature data sets currently available for Irish coastal waters. Itthereby provides a comprehensive basis for studying an area thathas been poorly investigated to date.
In comparison to the coastal waters further offshore, Irishestuarine waters are still relatively unknown in terms of theirstructure and environmental functioning. The data and informationrelating to these environments is rather sparse, and is restricted toa small number of water bodies. Most studies conducted in thosewaters have focused on the relationships between the episodes ofphytoplankton and zooplankton blooms and water columnchanges, to consolidate the understanding of the ecology of thoseorganisms in the region (e.g. O’Boyle and Silke, 2010). Thetemperature data gathered by the tagged seals have been shownsufficient for mapping and analysing thermal structure at differentdepths, although it is acknowledged that a full interpretation of
Fig. 2. Summer water stratification in lower Kenmare Bay during August 2006. Cross-section of bay represented is indicated on map.
D. del Villar-Guerra et al. / Estuarine, Coastal and Shelf Science 115 (2012) 272e281276
these water masses cannot be made solely from these data alone(e.g. lack of salinity measurements). Nevertheless, the results ob-tained in the present study are in line with current understandingof estuarine waters more generally, and provide unique insights tothe marine environment in and around Kenmare Bay, where noprevious oceanographic studies have been conducted.
The present study characterized the estuarine waters of Ken-mare Bay as rapid changeablewaters (scales of days) with their ownstructure, defining those water bodies as partially mixed estuarywaters (e.g. O’Boyle and Silke, 2010). High spatial and temporalmeasurements used in the study allowed for the characterisation ofthe water dynamics in the estuarine areas by the identification ofprocesses such as thermal stratification, up/downwellings and theonset of the thermocline. Although evidence for mesoscaleupwelling in the Ireland’s southwest coastal waters is equivocal(Edwards et al., 1996), the measurements and analyses presented inthis study reveal for the first time the existence of transient coastalupwelling in the area of Kenmare Bay. Both up- and downwellingappeared in the bay, over several timescales, during the month ofJune in two consecutive years, 2006 and 2007. In the adjacent bay,Bantry Bay, such episodes have been associated with the prevailing
winds at the time, which drive offshore Ekman transport of coastalsurface water, with a compensating injection of deeper offshorewaters into the bays (Edwards et al., 1996).
In the area of Kenmare Bay, the upwellings were associated withshallow areas in which inlets are predominant, and also with themiddle parts of the bay where the topography facilitates thevertical water movements (Meunier et al., 2010). The area of Sneemharbour was characterized by transient recurrent upwellingsassociated with the bottom bathymetry of the area as derived frombathymetry elevation models provided by the Admiralty charts ofthe area (Admiralty Charts and Publications. Sheet Number 2495,1997). The anticipated future availability of finer-scale bathymetrydata, e.g. when the area is surveyed as part of the Irish NationalSeabed Survey (INSS) will contribute to a better understanding ofthe local upwellings in the area.
Atlantic atmospheric depressions during June favoured sometransport of colder offshore water towards the coast at depth.During July and August south-westerly winds returned, associatedwith the beginning of the stratification process within outer Ken-mare Bay. The duration and intensity of the atmospheric depres-sions, as well as the gradient of temperatures between the surface
Fig. 3. Evidences of transient local upwelling in the area of Kenmare Bay during June 2006. Cross-section of bay represented is indicated on map.
D. del Villar-Guerra et al. / Estuarine, Coastal and Shelf Science 115 (2012) 272e281 277
and the bottom water masses, facilitated by and in combinationwith the bathymetry and prevailing local winds, are factors whichinfluence water column dynamics. Data collected by seals, togetherwith the techniques for their analysis as described in this paper,should provide a good methodological foundation for furtherdetailed study of these ocean-atmosphere processes andrelationships.
Mapping the temperature distributions of sea-surface tempera-ture, did not allow identification of upwelling when the data wereaveraged intomonthlygroupings, but these episodeswere observedwhen creating time series at finer, daily timescales. Throughexperimentation, itwasobserved that timescales ranging from1dayto 10e15 days maximum were optimal for inferring the existenceand locations of upwelling in the bay. Although the present researchhas not included any specific analysis to assess the riverine inputs inthe area of Kenmare Bay, more general observation during theresearch period would indicate that, in general terms, riverineinputs in the area of Kenmare Bayare not significant enough to drivethe dynamics of the bay themselves. The identified water masses inthe area of Sneem harbour had the same thermal structure as thosepresented in themiddle parts of the bay. It could be considered thatthe interaction of tidal range (2e4 m) and strength of tidal current
(see Simpson andHunter,1974) allows a thermal stratification in thebay, while the tidal force is sufficiently strong to prevent the riverflow from dominating the circulation.
The stratification of the water column observed in Kenmare Bayappears to be largely due to temperature variations, in line with theearlier conclusion of Raine et al. (1990a) that salinity is not assignificant as temperature in determining water column structurein Bantry Bay, adjacent to and immediately south of Kenmare Bay(Raine et al., 1990a).
Starting in June and fully developed by August (the onset of thethermocline), the development of thermal stratification throughspring and summer controls the annual cycle of the plankton(zooplankton and phytoplankton) in temperate waters (Tett andEdwards, 1984).
The present study suggests a likely increase in the primaryproductivity in June, July and August during 2006 and 2007, coin-ciding with the up/downwellings and the onset of thermocline inthe area. Further studies, using retrospective data on primaryproductivity, e.g. using chlorophyll measurements from satelliteimagery as a proxy (if high enough spatial resolution data could beobtained), might help establish the relationships between thetiming of the main water changes events and any corresponding
Fig. 4. Evidences of local upwelling in the area of Kenmare Bay during June 2007. Cross-section of bay represented is indicated on map.
D. del Villar-Guerra et al. / Estuarine, Coastal and Shelf Science 115 (2012) 272e281278
primary productivity in the bay during the period of time coveredby the study.
The sensitivity of the thermal sensors deployed on the seals(resolution 0.01 �C) was adequate to measure water temperature
Table 1Correlation coefficients of comparison of seal-derivedtemperature data and modelled temperature data (MPI-OMglobal ocean model) FebruaryeDecember 2009.
*Correlation is significant at the level of 0.01 (two-tailed).**Correlation is highly significant at the level of 0.01 (two-tailed).
properties in Kenmare Bay as the observed changes in the watercolumn were in the range of 0.5e1 �C. However a shortcoming ofthe sensor is its inability to record sub-sea-surface geographicallocations with any certainty or accuracy, since GPS fixes cannot beobtained while the sensor is submerged, due to the inability ofradio signals to travel under water. For the purposes of thisresearch, a straight line between two consecutive GPS-fixedlocations recorded at the surface, and the maximum notionalspeed recorded for the seals while submerged, were used toapproximate the locations at which the tags deployed on the sealsmost probably obtained their data measurements. While a prag-matic and effective way of data collection and relay (the data canbe accessed in near real time), this methodology introducesuncertainties in the sampling process. The availability of GPSlocations therefore determined the number of the underwatergeographical locations sampled, and the positional accuracy of theunderwater parameters such as thermal properties and depth. Inthe present study differences ranging up to 3e4 h were observedbetween some pairs of consecutive GPS fixes, and during thisperiod of time the seal could have dived in any direction withinthe bay, and could have travelled over distances of up toa maximum of 10 km from point of submergence, according to the
Fig. 5. Profiles of grey seal recorded and modelled water temperatures (MPI-OM global ocean model) off west coast of Ireland during JuneeAugust 2009.
D. del Villar-Guerra et al. / Estuarine, Coastal and Shelf Science 115 (2012) 272e281 279
maximum notional speed determined for these animals. Thisstudy sought to assess the possible implications of this compli-cation by using kernel analysis to identify and analyse tempera-ture data in those areas where there was high-to-mediumprobability of finding a temperatureeedepth record. It wasthought that those areas present high fidelity in relation with thewater masses below. No previous studies have adequatelyaddressed the accuracy issues in relation to the locations oftemperature readings obtained from tagged animals, possiblybecause most studies to date deal with large geographical scalesand therefore positional accuracy of temperature readingsbecomes less important, e.g. Southern Ocean (Costa et al., 2007). Itis recommended that any future analysis using data derived fromtagged seals (particularly if assessing thermal properties of watermasses on a relatively fine scale, e.g. within an estuary/bay, coastalzone) should consider these aspects in greater detail, examiningeach temperatureedepth profile individually and giving qualityflags according to the criteria described above. Further analysisbased on Markov chain methodologies (Collins, 1975) couldpotentially introduce a more accurate estimation of the animals’behavioural component when calculating underwater locations,and might be a fruitful line for future investigation.
The authors acknowledge the importance of validating the dataprovided by the instrumented seals, as an essential step inassessing the feasibility of the technique compared to more
traditional methods. Significant correlation between the watertemperature data collected by the tagged seals and the in situtemperature probe loggers (Tidbits) was found. Multisamplingpoints around the bay (e.g. from seals) capture more water vari-ability than a single point, enabling a more comprehensivedescription of the water circulation within the bay. Autonomoussamplers such as instrumented seals, when correctly calibrated andvalidated, therefore provide better approximations of the mainwater temperature changes than the information supplied byinstruments such as Tidbits alone. Looking beyond the confines ofsouthwest Ireland, temperature data from the continental shelf offthe Irish west coast were captured by instrumented grey seals.Analyses of these data were compared with the predictionsprovided by the oceanic numerical model and significant correla-tion was found between the two data sets in all months apart fromApril and December 2009; in these months a small number ofrecords of the seals’ temperature/depth data coincided with thesame depths for which the model calculated temperatures. Anydifferences that were observed between model predictions andseal-derived data are likely to result from averaging over anextensive geographical area, and non-uniform distribution of sealsthroughout the region (Olbert et al., 2011). The strong correlationwith the temperature probes (Tidbits) as well as the modelled datavalidates the use of seals as oceanographic platforms on differentspatial scales. Grey seals generally have a larger foraging range than
D. del Villar-Guerra et al. / Estuarine, Coastal and Shelf Science 115 (2012) 272e281280
harbour seals (Thompson et al., 1996) and the scale of the study willinform the selection of species for sensor deployment.
The present study proposes that advances in techniques forcalibrating and validating data sets obtained from tagged seals mayshortly lead to the use of these data as inputs to oceanic models.The incorporation of reliable seal-derived data would alsocontribute to the improvement of the actual climate monitoringsystem in Ireland, while the incorporation of fluorometers andsalinity sensors within seal-deployed tags will further enhance thepotential of using seals as oceanographic platforms, and will openup a new field in oceanographic studies. Advances in data storage/compression and relay are needed in the field of bio-logging forthese benefits to be realised, and will possibly allow the estab-lishment of near real-time forecasting routines when combinedwith the ocean models in the area.
Acknowledgements
We would like to acknowledge the following for their valuablecontributions to the fieldwork elements of the project: DavidThompson (National Trust), Paddy Pomeroy, William Patterson,Bernie McConnell (SMRU), Clare Heardman, Declan O Donnell,Oliver O Cadhla, Frank McMahon, Tim O Donoghue and PascalDower (NPWS), Mark Jessopp, Mick Mackey, Alan Whittaker (UCC)and Simon Ingram (University of Plymouth). We would like tothank Martin White of NUIG (Ireland) and Jenny Ullgren of NIOZ(Netherlands) for their advice during the analysis of this particulardata set. Additional thanks to Clint Blight and Phil Lovell fromSMRU (Scotland) for their technical support throughout the project.Thanks to Anders Koed and Kim Aarestrup (DTU-Aqua, Denmark)for facilitating the editing process. The research was funded by theHigher Education Authority under the PRTLI4 funding mechanism.Elements of the research were partly funded by a Beaufort MarineResearch Award carried out under the Sea Change Strategy and theStrategy for Science Technology and Innovation (2006e2013), withthe support of the Marine Institute, funded under the MarineResearch Sub-Programme of the National Development Plan 2007e2013. Funding for the telemetry devices was provided by theNational Parks & Wildlife Service.
References
Biuw, M., Boehme, L., Guinet, C., Hindell, M., Costa, D., Charrassin, J.-B., Roquet, F.,Bailleul, F., Meredith, M., Thorpe, S., Tremblay, Y., McDonald, B., Park, Y.-H.,Rintoul, S., Bindoff, N., Goebel, M., Crocker, D., Lovell, P., Nicholson, J., Monks, F.,Fedak, M.A., 2007. Variations in behaviour and condition of a southern oceantop predator in relation to in situ oceanographic conditions. Proceedings of theNational Academy of Sciences of the United States of America 104, 13705e13710.
Boehlert, G.W., Costa, D.P., Crocker, D.E., Green, P., O’Brien, T., Levitus, S., Le Bœuf, J.,2001. Autonomous pinniped environmental samplers: using instrumentedanimals as oceanographic data collectors. Journal of Atmospheric and OceanicTechnology 18, 1882e1893.
Boehme, L., Meredith, M.P., Thorpe, S.E., Biuw, M., Fedak, M., 2008. The ACC frontalsystem in the South Atlantic: monitoring using merged Argo and animal-bornesensor data. Journal of Geophysical Research 113, C09012.
Campagna, C., Rivas, A.L., Marinn, M.R., 2000. Temperature and depth profilesrecorded during dives of elephant seals reflect distinct ocean environments.Journal of Marine Systems 24, 299e312.
Charrassin, J.-B., Hindell, M., Rintoul, S.R., Roquet, F., Sokolov, S., Biuw, M., Costa, D.,Boehme, L., Lovell, P., Coleman, R., Timmermann, R., Meijer, A., Meredith, M.,Park, Y.-H., Bailleul, F., Goebel, M., Tremblay, Y., Bost, C.-A., McMahon, C.R.,Field, I.C., Fedak, M.A., Guinet, C., 2008. Southern ocean frontal structure andsea-ice formation rates revealed by elephant seals. Proceedings of the NationalAcademy of Sciences of the United States of America 105, 11634e11639.
Collins, L., 1975. An Introduction to Markov Chain Analysis. Institute of BritishGeographers Study Group in Quantitative Methods. Geo Abstracts Ltd, Norwich.CATMOG No. 1.
Cooper, L.H.N., 1967. The physical oceanography of the Celtic Sea. OceanographyMarine Biology: An Annual Review 5, 99e110.
Costa, D.P., Klinck, J.M., Hofmann, E.E., Dinniman, M.S., Burns, J.M., 2007. Upperocean variability in west Antarctic Peninsula continental shelf waters asmeasured using instrumented seals. Deep Sea Research Part II: Topical Studiesin Oceanography 55 (3e4), 323e337. Dynamics of Plankton, Krill, and Predatorsin Relation to Environmental Features of the Western Antarctic Peninsula andRelated Areas: SO GLOBEC Part II, February 2008.
Cronin, M.A., McConnell, B.J., 2008. SMS seal: a new technique to measure haul-outbehaviour in marine vertebrates. Journal of Experimental Marine Biology andEcology 362, 43e48.
Cronin, M., Duck, C., Ó Cadhla, O., 2007. Aerial surveying of grey seal breedingcolonies on the Blasket Islands, Co. Kerry, the Inishkea Group, Co. Mayo and theDonegal coast, Ireland. Journal for Nature Conservation 15, 1e11.
Cronin, M., Jessopp, M., Pomeroy, P. Size and seasonal influences on the foragingrange of female grey seals in the northeast Atlantic. Marine Biology, in press.
Defant, A., 1961. Physical Oceanography, Vol. 1. Pergamon, New York, p. 729.DIVA-Interpolation, 2009. SeaDataNet-ULg. 2009. Data-Interpolating Variational
Analysis.Dwyer, N., 2009. Current Status and Required Actions for National Climate
Edwards, A., Jones, K., Graham, J.M., 1996. Transient coastal upwelling and watercirculation in Bantry Bay, a ria on the southwest coast of Ireland. EstuarineCoastal and Shelf Science 42, 213e230.
Elliott, S.A.J., 1991. Monthly distributions of surface to bottom temperatures in thenorthwest European shelf sea. Continental Shelf Research 11, 453e466.
Fedak, M., Lovell, P., McConnell, B., Hunter, C., 2002. Overcoming the constraints oflong range radio telemetry from animals: getting more useful data from smallerpackages. Integrative and Comparative Biology 42, 3e10.
Gribble, K.E., Nolan, G., Anderson, D.M., 2007. Biodiversity, biogeography, andpotential trophic impact of Protoperidinium spp. (Dinophyceae) off the south-western coast of Ireland. Journal of Plankton Research 29, 931e947.
Hedger, R.D., Malthus, T.J., Folkard, A.M., Atkinson, P.M., 2007. Spatial dynamics ofestuarine water surface temperature from airborne remote sensing. Estuarine,Coastal and Shelf Science 71 (3e4), 608e615.
Irish Spatial Data Exchange data base (ISDE), 2012. Available from: http://catalogue.isde.ie.
Kara, A.B., Rochford, P.A., Hurlburt, H.E., 2000. An optimal definition for oceanmixed layer depth. Journal of Geophysical Research C 105, 16803e16821.
Kara, A.B., Rochford, P.A., Hurlburt, H.E., 2001. Naval Research Laboratory MixedLayer Depth (NMLD) Climatologies. Naval Research Laboratory, Washington, DC.7330-01-9995.
Lee, A.J., Ramster, J.W., 1981. Atlas of the Seas around the British Isles. Ministry ofAgriculture Fisheries and Food, Directorate of Fisheries Research.
Lydersen, C., Nøst, O.A., Kovacs, K.M., Fedak, M.A., 2004. Temperature data fromNorwegian and Russian waters of the northern Barents Sea collected by free-living ringed seals. Journal of Marine Systems 46, 99e108.
Malthus, T.J., Mumby, P.J., 2003. Remote sensing of the coastal zone: an overviewand priorities for future research. International Journal of Remote Sensing 24(13), 2805e2815.
Marsland, S.J., Haak, H., Jungclaus, J.H., Latif, M., Roske, F., 2003. The Max-Planck-Institute global ocean sea/ice model with orthogonal curvilinear coordinates.Ocean Modelling 5, 91e127.
McConnell, B.J., Fedak, M.A., Lovell, P., Hammond, S., 1999. Movements and foragingareas of grey seals in the North Sea. Journal of Applied Ecology 36, 1e19.
McConnell, B.J., Beaton, R., Bryant, E., Hunter, C., Lovell, P., Hall, A., 2004. Phoninghome e a new GSM mobile phone telemetry system to collect mark-recapturedata. Marine Mammal Science 20, 274e283.
McMahon, T., Silke, J., 1997. Algal blooms and algal toxicity in Irish coastal waters.In: Wilson, J.G. (Ed.), Eutrophication in Irish waters. Royal Irish Academy,Dublin, Ireland.
Meunier, T., Rossi, V., Morel, Y., Carton, X., 2010. Influence of bottom topography onan upwelling current: Generation of long trapped filaments. Ocean Modelling35 (4), 277e303.
Ó Cadhla, O., Strong, D., O’Donnell, G., 2005. Grey Seal Population Status in the SlyneHead SAC/SPA and Hen Island, Co. Galway as Determined from Breeding GroundSurveys in 2004. Report to the Department of the Environment. Heritage andLocal Government, 7 pp.
Olbert, A., Hartnett, M., Dabrowski, T., Mikolajewicz, U., 2011. Long-term inter-annual variability of a cyclonic gyre in the western Irish Sea. ContinentalShelf Research 31 (13), 1343e1356. http://dx.doi.org/10.1016/j.csr.2011.05.010.
Olbert, A.I., Dabrowski, T., Nash, S., Hartnett, M., 2012. Regional modelling of the 21stcentury climate changes in the Irish Sea. Continental Shelf Research 41, 48e60.
O’Boyle, S., Silke, J., 2010. A review of phytoplankton ecology in estuarine andcoastal waters around Ireland. Journal of Plankton Research 32 (1), 99e118.
Onset� Hobo�. Data loggers.TidBit v2 Water Temperature Data Logger - UTBI-001.Retrieved on 25.08.2011. Available from: http://www.onsetcomp.com/products/data-loggers/utbi-001ref.
Raine, R., McMahon, T., 1998. Physical dynamics on the continental shelf offsouthwestern Ireland and their influence on coastal phytoplankton blooms.Continental Shelf Research 18, 883e914.
Raine, R., O’Mahony, J., McMahon, T., 1990a. Hydrography and phytoplankton ofwaters off south-west Ireland. Estuarine, Coastal and Shelf Science 30, 579e592.
Raine, R., McMahon, T., O’Mahony, J., 1990b. Water circulation and phytoplanktonpopulations in two estuaries on the west coast of Ireland. In: Chambers, P.L.,Chambers, C.M. (Eds.), Estuarine Ecotoxicology. JAPAGA, Wicklow, pp. 19e28.
D. del Villar-Guerra et al. / Estuarine, Coastal and Shelf Science 115 (2012) 272e281 281
Raine, R., McMahon, T., Roden, C.M., 1993a. A review of the summer phytoplanktondistribution in Irish coastal waters, a biogeography related to physical ocean-ography. In: Costello, M.J., Kelly, K.S. (Eds.), Biogeography of Ireland, Past,Present and Future. Occasional Publications of the Irish Biogeographical Society,vol. 2. Irish Biogeographical Society, pp. 99e111.
Raine, R., Joyce, B., Richard, J., 1993b. The development of an exceptional bloom ofthe dinoflagellate Gyrodinium aureolum on the southwest Irish coast. ICESJournal of Marine Science 50, 461e469.
Raine, R., Joyce, B., Patching, J.W., 1993c. Upwelling and the phytoplankton ecologyof southwest Irish coastal waters. ICES Biological Oceanography Committee.(ICES CM 1993/L:18).
Raine, R., McDermott, G., Silke, J., Lyons, K., Nolan, G., Cusack, C., 2010. A simpleshort range model for the prediction of harmful algal events in the bays ofsouthwestern Ireland. Journal of Marine Systems 83 (3e4), 150e157.
Rutz, C., Hays, G.C., 2009. New frontiers in biologging science. Biological Letters 5,289e292.
Schlitzer, R., 2009. Ocean Data View, Available from: http://odv.awi.de.Sea Mammal Research Unit, 2008. GPS Phone Tags. http://www.smru.st-and.ac.uk/
Instrumentation/pageset.aspx?psr¼287. Retrieved on 25.08.2011. Available from:Silverman, B.W., 1986. Density Estimation for Statistics and Data Analysis, Mono-
graphs on Statistics and Applied Probability. Chapman and Hall, London, UK.Simpson, J.H., Hunter, J.R., 1974. Fronts in the Irish Sea. Nature 250, 404e406.Tett, P., Edwards, A., 1984. Mixing and plankton, an interdisciplinary theme in
oceanography. Oceanography and Marine Biology: An Annual Review 22,99e123.
Thompson, P., McConnell, B., Tollit, D., Mackay, A., Hunter, C., Racey, P., 1996.Comparative distribution, movements and diet of harbour and grey seals fromthe Moray Firth N.E. Scotland. Journal of Applied Ecology 33, 1572e1584.
Thomson, R.E., Fine, I.V., 2003. Estimating mixed layer depth from oceanic profiledata. Journal of Atmospheric and Oceanic Technology 20, 319e329.
Wijffels, S., Firing, E., Bryden, H., 1994. Direct observations of the Ekman balance at108N in the Pacific. Journal of Physical Oceanography 24, 1666e1679.