71
gulf states marine fisheries commission number 262 february 2017 seamap environmental and biological atlas of the gulf of mexico 2014
gulf states marine fisheries commission
number 262 february 2017seam
apenvironmental and biological atlas ofthe gulf of mexico2014

SEAMAP ENVIRONMENTAL AND BIOLOGICAL ATLAS OF THE GULF OF MEXICO, 2014
Edited by
Jeffrey K. Rester Gulf States Marine Fisheries Commission
Manuscript Design and Layout
Ashley P. Lott Gulf States Marine Fisheries Commission
GULF STATES MARINE FISHERIES COMMISSION FEBRUARY 2017
NUMBER 262 This project was supported in part by the National Oceanic and Atmospheric Administration, National Marine Fisheries Service, under State/Federal Project Number NA16NMFS4350111.

GULF STATES MARINE FISHERIES COMMISSION COMMISSIONERS
ALABAMA N. Gunter Guy, Jr. Alabama Department of Conservation and Natural Resources 64 North Union Street Montgomery, AL 36130-1901 Steve McMillan P.O. Box 337 Bay Minette, AL 36507 Chris Nelson Bon Secour Fisheries, Inc. P.O. Box 60 Bon Secour, AL 36511 FLORIDA Nick Wiley, Executive Director FL Fish and Wildlife Conservation Commission 620 South Meridian Street Tallahassee, FL 32399-1600 Senator Thad Altman State Senator, District 24 6767 North Wickham Road, Suite 211 Melbourne, FL 32940 TBA LOUISIANA Jack Montoucet, Secretary LA Department of Wildlife and Fisheries P.O. Box 98000 Baton Rouge, LA 70898-9000 Senator R.L. “Bret” Allain, II 600 Main Street, Suite 1 Franklin, LA 70538
John Roussel 1221 Plains Port Hudson Road Zachary, LA 70791 MISSISSIPPI Jamie Miller, Executive Director Mississippi Department of Marine Resources 1141 Bayview Avenue Biloxi, MS 39530 Senator Brice Wiggins 1501 Roswell Street Pascagoula, MS 39581
Joe Gill, Jr. Joe Gill Consulting, LLC 910 Desoto Street Ocean Springs, MS 39566-0535 TEXAS Carter Smith, Executive Director Texas Parks and Wildlife Department 4200 Smith School Road Austin, TX 78744 Troy B. Williamson, II P.O. Box 967 Corpus Christi, TX 78403 Representative Wayne Faircloth Texas House of Representatives 2121 Market Street, Suite 205 Galveston, TX 77550
STAFF David M. Donaldson Executive Director
Nancy K. Marcellus Cheryl R. Noble Steven J. VanderKooy Jeffrey K. Rester Gregory S. Bray
Joseph P. Ferrer, III Douglas J. Snyder Deanna L. Valentine Donna B. Bellais James R. Ballard
Lloyd W. Kirk Debora K. McIntyre Alyce A. Ryan Angela R. Rabideau Ashley P. Lott

SEAMAP SUBCOMMITTEE
Dr. Ted Switzer, Chairman Florida Fish and Wildlife Conservation Commission
Florida Fish and Wildlife Research Institute
Ms. Chloe´ Dean Louisiana Department of Wildlife and Fisheries Dr. Read Hendon USM/Gulf Coast Research Laboratory Dr. Fernando Martinez-Andrade Texas Parks and Wildlife Department Dr. John Froeschke Gulf of Mexico Fishery Management Council
Dr. Christian Jones
National Marine Fisheries Service Pascagoula Laboratory
Mr. John Mareska
Alabama Department of Conservation and Natural Resources/ Marine Resources Division
Mr. Jeff Rester
SEAMAP Coordinator Gulf States Marine Fisheries Commission
DATA COORDINATING WORK GROUP
Mr. Lloyd Kirk, Leader Gulf States Marine Fisheries Commission
Dr. Christian Jones National Marine Fisheries Service Pascagoula Laboratory Mr. Charles Weber National Marine Fisheries Service Pascagoula Laboratory Mr. Michael Harden Louisiana Department of Wildlife and Fisheries
Mr. John Anderson
USM/Gulf Coast Research Laboratory
Mr. Michael Murphy Florida Fish and Wildlife
Conservation Commission Florida Fish and Wildlife Research Institute

INTRODUCTION The Southeast Area Monitoring and Assessment Program (SEAMAP) is a State/Federal/university program for the collection, management, and dissemination of fishery-independent data (information collected without direct reliance on statistics reported by commercial or recreational fishermen) in United States waters of the Gulf of Mexico (Eldridge 1988). A major SEAMAP objective is to provide a large, standardized database needed by management agencies, industry, and scientists to make sound management decisions and further develop fishery resources in a cost-efficient manner. To accomplish this goal, survey data must be disseminated in a useful format to SEAMAP participants, cooperators, and other interested organizations.
The SEAMAP Program began in March 1981 when the National Marine Fisheries Service (NMFS), Southeast Fisheries Science Center (SEFSC), presented a SEAMAP Strategic Plan (1981) to the Gulf States Marine Fisheries Commission (GSMFC). This strategic plan outlined the proposed program organization (goals, objectives, procedures, resource requirements, etc.). A SEAMAP Subcommittee was then formed within the existing framework of the GSMFC. The Subcommittee consists of one representative from each state fishery management agency [Florida Fish and Wildlife Conservation Commission (FWC); Alabama Department of Conservation and Natural Resources (ADCNR); Mississippi Department of Marine Resources (MDMR) represented by the University of Southern Mississippi, Gulf Coast Research Laboratory (USM/GCRL); Louisiana Department of Wildlife and Fisheries (LDWF); and Texas Parks and Wildlife Department (TPWD)], one from NMFS SEFSC and a non-voting member representing the Gulf of Mexico Fishery Management Council (GMFMC). The Subcommittee has organized and successfully coordinated numerous resource surveys from 1982 through 2014 (Table 1). The resultant data are published in atlases for the surveys in 1982 (Stuntz et al. 1985); 1983 (Thompson and Bane 1986a); 1984 (Thompson and Bane 1986b); 1985 (Thompson et al. 1988); 1986 (Sanders et al. 1990a); 1987 (Sanders et al. 1990b); 1988 (Sanders et al. 1991a); 1989 (Sanders et al. 1991b); 1990 (Sanders et al. 1992); 1991 (Donaldson et al. 1993); 1992 (Donaldson et al. 1994); 1993 (Donaldson et al. 1996); 1994 (Donaldson et al. 1997a); 1995 (Donaldson et al. 1997b); 1996 (Donaldson et al. 1998); 1997 (Rester et al. 1999); 1998 (Rester et al. 2000); 1999 (Rester et al. 2001); 2000 (Rester et al. 2002); 2001 (Rester et al. 2004); 2002 (Rester et al. 2008); 2003 (Rester et al. 2009); 2004 (Rester 2009); 2005 (Rester 2010); 2006 (Rester 2010); 2007 (Rester 2010); 2008 (Rester 2011); 2009 (Rester 2011); 2010 (Rester 2012); 2011 (Rester 2014); 2012 (Rester 2014), and 2013 (Rester 2015). Environmental assessment activities that occurred with each of the surveys can be found in Table 1. All data are available to researchers or interested individuals. Details about how to obtain SEAMAP data can be found in the Data Request section of this document. In early 2014, the SEAMAP Subcommittee identified and began to plan the year's SEAMAP survey activities for the Gulf of Mexico. In keeping with the program goal of establishing a coordinated long-term resource database, it was decided to continue the same types of survey activities conducted in 1982 through 2013. Overall survey objectives in 1982 to 2014 were to assess the distribution and abundance of recreational and commercial organisms collected by plankton, trap/video, bottom longlines, hook and line, and trawl gears, and document environmental factors that might affect their distribution and abundance. Data from plankton surveys are used for detection and assessment of fishery resources; in the determination of spawning seasons and areas; in investigations of early survival and recruitment mechanisms; and in estimation of the abundance of a stock based on its spawning production (Sherman et al. 1983). Assessment of the Texas Closure (Nichols 1982, 1984; Nichols and Poffenberger 1987) was the
1

rationale for the establishment of the trawl surveys and to establish a seasonal database to assess the abundance and distribution of the shrimp and groundfish stocks across the northern Gulf of Mexico. The Reef Fish Survey is designed to determine the relative abundance of reef fish populations and habitat using a fish trap/video recording system (Russell, unpublished report). A major purpose of SEAMAP is to provide resource survey data to State and Federal management agencies and universities participating in SEAMAP activities. This thirty-second in a series of SEAMAP environmental and biological atlases presents such data, in a summarized form, collected during the 2014 SEAMAP surveys.
MATERIALS AND METHODS Methodology for the 2014 SEAMAP surveys is similar to that of the 1982 through 2013 surveys. Sampling was conducted within the U.S. Exclusive Economic Zone (EEZ) and state territorial waters. The NOAA Ship OREGON II collected plankton and environmental data during the Spring Plankton Survey from May 4-30, while the USM/GCRL vessel TOMMY MUNRO sampled on May 5 and May 6, and the Louisiana vessel BLAZING SEVEN sampled from May 2-9. Vessels that participated in collecting plankton and environmental data during the Fall Plankton Survey included the NOAA Ship GORDON GUNTER (August 25 - September 28), the Alabama vessel DISCOVERY (September 8), the Louisiana vessel ACADIANA (September 3-4), and USM/GCRL vessel TOMMY MUNRO (September 3-4). Vessels that participated in the Summer Shrimp/Groundfish Survey and concurrently sampled plankton and environmental data included the USM/GCRL vessel TOMMY MUNRO (July 11-13), Florida using the TOMMY MUNRO (June 8-29), and the NOAA Ship OREGON II (June 10 – July 17). The Alabama vessel DISCOVERY (July 12) and Texas vessels MATAGORDA BAY, TRINITY BAY, SAN JACINTO, SABINE, and COPANO BAY (June 2-24) did not sample plankton in conjunction with the summer survey. The NOAA ship PISCES participated in the Reef Fish Survey from May 29 – June 24 while the CARETTA sampled from July 8 – August 5. Florida made multiple sampling trips aboard the R/V GULF MARINER from June 16 through August 22. Florida sampled reef fish onboard the R/V WEATHERBIRD II from September 5 – 12 and the R/V NO FRILLS on September 16. Vessels that participated in the Fall Shrimp/Groundfish Survey and concurrently sampled plankton and environmental data included the NOAA Ships OREGON II (October 9 – November 18), the USM/GCRL vessel TOMMY MUNRO (October 1-3), the Louisiana vessel PELICAN (October 6-10), and Florida using the TOMMY MUNRO (October 8-30). The Alabama vessel DISCOVERY (October 23) and Texas vessels SABINE, MATAGORDA BAY, TRINITY BAY, NUECES BAY, and SAN ANTONIO BAY (November 8-26) did not sample plankton in conjunction with the fall survey. Mississippi conducted bottom longline sampling monthly from March to October as part of the Bottom Longline Survey. Alabama sampled from March through October. Louisiana sampled from May through September. Texas conducted bottom longline sampling from June through September.
2

Alabama sampled reef fish over artificial and natural reefs during the Vertical Line Survey in May and September. Louisiana sampled reef fish over artificial reefs, oil and gas platforms, and natural habitat from June through October. PLANKTON SURVEYS Since 1982, SEAMAP resource surveys have been conducted by the National Marine Fisheries Service in cooperation with the states of Florida, Alabama, Mississippi, Louisiana, and Texas. Plankton sampling is carried out during these surveys at predetermined SEAMAP stations arranged in a fixed, systematic grid pattern across the entire Gulf of Mexico. Most but not all SEAMAP stations (designated by a unique SEAMAP number) are located at ~56 km or ½-degree intervals along this grid. Some SEAMAP stations are located at < 56 km intervals especially along the continental shelf edge, while others have been moved to avoid obstructions, navigational hazards, or shallow water. Most SEAMAP plankton samples are taken during either dedicated plankton or shrimp/bottomfish (trawl) surveys, but over the years additional samples were taken using SEAMAP gear and collection methods at locations other than designated SEAMAP stations and/or outside established SEAMAP surveys, e.g. during Louisiana seasonal trawl surveys, SEAMAP Squid/Butterfish survey; and other serendipitous or special projects. The sampling gear and methodology used to collect SEAMAP plankton samples are similar to those recommended by Kramer et al. (1972), Smith and Richardson (1977) and Posgay and Marak (1980). A 61 cm bongo net fitted with 0.333 (0.335)1 mm mesh netting is fished in an oblique tow path from a maximum depth of 200 m or to 2-5 m off the bottom at depths less than 200 m. A mechanical flowmeter is mounted off-center in the mouth of each bongo net to record the volume of water filtered. Volume filtered ranges from ~20 to 600 m3, but is typically 30 to 40 m3 at the shallowest stations and 300 to 400 m3 at the deepest stations. A single or double 2x1 m pipe frame neuston net fitted with 0.947 (0.950)1 mm mesh netting is towed at the surface with the frame half-submerged for 10 minutes. Samples are taken upon arrival on station regardless of time of day. At each station either a bongo and/or neuston tow are made depending on the specific survey. Samples are routinely preserved in 5 to 10% formalin and later transferred after 48 hours to 95% ethanol for long-term storage. During some surveys, selected samples are preserved initially in 95% ethanol and later transferred to fresh ethanol. Initial processing of one bongo sample and one neuston sample from each SEAMAP station was accomplished at the Sea Fisheries Institute, Plankton Sorting and Identification Center (ZSIOP), in Szczecin, Poland, under a Joint Studies Agreement with NMFS. Wet plankton volumes of bongo net samples were measured by displacement to estimate net-caught zooplankton biomass (Smith and Richardson 1977). Fish eggs and larvae were removed from bongo net samples, and fish larvae only from neuston net samples. Fish eggs were not identified further, but larvae were identified to the lowest possible taxon (to family in most cases). Body length (either notochord or standard length) was measured. Sorted ichthyoplankton specimens from ZSIOP were sent to the SEAMAP Archiving Center, managed in conjunction with the FWC, for long-term storage under museum conditions. Sorted ichthyoplankton samples from 1982 through 2012 are available for loan to researchers throughout the country. The alternate bongo and neuston samples from each station are retained at USM/GCRL as a backup for those samples transshipped to ZSIOP in case of loss or damage during
1 Mesh size change in database does not represent an actual change in gear but only a change in the accuracy at which plankton mesh aperture size can be measured by the manufacturer.
3

transit. These backup unsorted plankton samples are curated and housed at the SEAMAP Invertebrate Plankton Archiving Center, managed in conjunction with USM/GCRL, and are available for use by researchers. See the SEAMAP Operations Manual for a more detailed description of sampling methods and protocols. You can also refer to the vessel cruise reports for more specific information on the individual SEAMAP Plankton Surveys conducted during 2014. ENVIRONMENTAL DATA Standardized methodology was used although the actual parameters measured varied among vessels participating in each survey. These parameters were measured based on equipment availability. The following parameters were recorded: Vessel: Vessel code for each vessel. Station: Station identifiers varied by state and vessel. Cruise: Cruise numbers varied by state and vessels. Date: Month/Day/Year. Time: Local time and time zone, recorded at the start of sampling. Latitude/longitude: Recorded to seconds. Barometric pressure: Recorded in millibars. Wave height: Estimated visually in meters. Wind speed and direction: Recorded in knots with direction recorded in compass degrees from which the wind was blowing. Air temperature: Recorded in degrees Celsius. Cloud cover: Estimated visually in percent cloud cover. Secchi depth: Secchi depth in meters, estimated at each daylight station. Standard oceanographic 30-cm white discs were lowered until no longer visible, and then raised until visible. If different depths were recorded, an average was used. Water Color: Forel-Ule data was recorded. The following parameters were measured at the surface, mid-depth, and bottom; for bottom depths greater than 200 m, samples were taken at surface, 100 m and 200 m: Water temperature: Temperatures were measured by a hand-held thermometer or by in situ
electronic sensors onboard ship. No attempt was made to intercalibrate the various instruments used on individual vessels although several vessels did sample together to calibrate other sampling gear. Some error can be expected.
Salinity: Salinity samples were collected by Niskin bottles and stored for laboratory analysis with a salinometer. Conductivity probes or refractometers were used on some vessels. Salinity samples were also measured with in situ electronic sensors.
Chlorophyll: Chlorophyll samples were collected and frozen for later laboratory analysis. The general procedure for shipboard collection of chlorophyll was to collect more than 9 liters of water from the surface. This was kept stirred by bubbling air through it while filtration was being done. Three samples, to each of which a 1 ml, 1% (W/V), suspension of MgCO3 was added, of up to 3 liters of water from the 9 liter sample were filtered through GF/C filters. The three filters were placed individually in Petri dishes, wrapped in opaque material and frozen until analysis. Each of the three samples was analyzed separately in the laboratory.
4

Laboratory analyses for chlorophyll a and phaeophytin a (chlorophyll degradation product) were conducted by fluorometry and spectrophotometry. The general extraction procedures prior to measurement were similar. Samples analyzed by spectrophotometer included other chlorophyllous products, but these have not been included as data in this report. The methodology used is described in Strickland and Parsons (1972) and Jeffrey and Humphrey (1975). Some of the values have been deleted from the database because of analytical errors. In addition, chlorophyll samples data were also collected using a CTD. This method only obtains measures of chlorophyll a and is a measure of fluorescence (FL).
Dissolved oxygen: Dissolved oxygen values were measured by electronic probes or by the Winkler titration method. No attempts were made to intercalibrate the methods. When oxygen was measured in samples collected from a Niskin sampler, the oxygen bottles were allowed to overflow a minimum of 10 seconds to eliminate oxygen contamination. The tubing which delivered the water sample was inserted to the bottom of the bottle and withdrawn while the sample was still flowing. The oxygen bottles were sealed with a ground-glass stopper and analyzed onboard the vessels.
Turbidity: Turbidity values were measured by electronic probes when equipment was available. TRAWL SURVEYS Summer Shrimp/Groundfish Survey In the fall of 2008, NMFS changed their method of selecting sampling sites. The states adopted this change beginning in 2010. Diurnal stratifications were dropped in the selection process, and geographic strata (which were mostly 2 to 3 statistical zone groupings) were changed to single statistical zones (Figure 1). Both station selection methods, the old and the new, are probability based designs. With probability sampling, each unit in the survey population has a known, positive probability of selection. This property of probability sampling avoids selection bias and enables one to use statistical theory to make valid inferences from the sample to the survey population. More specifically, the new method employs probability proportional to size sampling. In this type of sampling, a unit’s selection probability is proportional to its size measure which in this case is geographical surface area. For example, if Unit A has twice the surface area of Unit B, then Unit A will have twice the probability of having a sample selected from it than B. The end result is that Unit A will have about twice the number of samples as B. Even though diurnal strata were dropped in the sampling site selection process, this information is not lost since samples can be post-stratified. Following is an example of how sampling sites are now selected. Bathymetry data were downloaded from the National Geophysical Data Center (NGDC) web site (Divins, D.L., and D. Metzger, NGDC Coastal Relief Model, http://www.ngdc.noaa.gov/mgg/coastal/coastal.html). Because of the magnitude of data, they were downloaded by single NMFS Shrimp Statistical Zones (Figure 1). The download process allows for the definition of a desired data block through user supplied latitude and longitude boundaries. Since the data definition process is controlled by latitude and longitude only, some undesired depths were included in downloads (i.e., for NMFS, depths less than five or greater than sixty fathoms). These records were deleted later through a Statistical Analysis System (SAS) program. Each bathymetric record represents a 3 arc-second element of data (≈ 0.05-by-0.05 minutes of latitude and longitude); therefore, the number of data records was used as a measure of size for each respective statistical zone. The bathymetry data were then used as input to a SAS program which performed three functions; defined the sampling universe, determined the sampling proportions according to sizes of statistical zones, and randomly selected the sample sites according to the defined proportions.
5

Thirty minutes was selected as a tow time standard that was long enough to obtain a good sample, but short enough to maintain the efficiency of the surveys. Therefore all SEAMAP vessels now use a standard tow time of 30 minutes except the Texas vessels. The Texas vessels tow 10 minutes parallel to the depth stratum. All Litopenaeus setiferus, Farfantepenaeus aztecus, and Farfantepenaeus duorarum were separated from the trawl catch at each station. Total count and weight by species were recorded for each station. A sample of up to 200 shrimp of each species from every trawl was sexed and measured to obtain length-frequency information. Estimated total numbers were derived from the total weights of those processed. Other species of fishes and invertebrates were identified, enumerated, and weighed. Weights and individual measurements on selected species, other than commercial shrimp, were also recorded. Fall Shrimp/Groundfish Survey The design of the Fall Survey was similar to the Summer Shrimp/Groundfish Survey. During the Fall Survey trawl stations were made with the standard 40-ft and 20-ft SEAMAP nets and covered NMFS shrimp statistical zones 2 through 21 (Figure 1). Catch rates on all the vessels sampling were treated in the same manner as the Summer Shrimp/Groundfish Survey, with the exception to shrimp catches, where only 20 shrimp of each species from every trawl were measured, although Louisiana and Texas measure a minimum of 50 shrimp. REEF FISH SURVEY The primary purpose of this survey is to assess relative abundance and compute population estimates of reef fish found on natural reef fish habitat in the Gulf of Mexico. For the NMFS portion of the Reef Fish Survey, a two-stage procedure was used to select sample sites. Sample blocks were first selected using stratified random sampling, with strata defined by region of the GOM and size. Reef sites within each block were then selected randomly from previously collected bathymetric data. Video gear was used to assess relative abundance and length frequencies and consisted of paired black-and-white Videre stereo cameras along with a color mpeg camera housed in cylindrical pressure housings. The camera array consisted of four housings positioned orthogonally and center mounted 51 cm above the bottom of the array. The camera array was baited with squid and was retrieved 40 minutes after deployment. For the Florida portion of the survey, a survey of bottom habitat was conducted using side-scan sonar that covered a distance of 1 nm east and west of each randomly-selected sampling site. Side-scan sonar data were analyzed to determine the quantity of reef habitat and number of targets where gear could be set within each 0.1 nm x 0.3 nm sampling unit. A target was defined as identified reef fish habitat with minimum of 100 m spacing between targets. Within each survey, a random selection procedure was followed to select transects from all transects containing at least two targets. Sampling occurred at a minimum for the first selected transect followed by other transects (alternates) if time allowed. All gears were separated from any other deployed gear by approximately 100 m. All traps and camera arrays were freshly baited with Atlantic mackerel prior to deployment. Chevron traps were built to standardized specifications (1.76m x 1.52m x 0.61m; 28cm throat diameter; 3.81cm vinyl-clad mesh). All traps were equipped with a blow-out panel fastened with magnesium timed-releases to minimize the potential of ghost fishing should traps be lost. Each chevron trap soaked at the bottom for a minimum of 90 minutes prior to retrieval. The stationary video camera array was equipped with a pair of underwater camera units
6

positioned at an angle of 180º from one another to maximize the total field of view. Each camera unit consisted of an underwater housing that contains both a digital camcorder to record video and a pair of stereo cameras to capture still images. The stationary video camera array was allowed to soak at the bottom for a minimum of forty-five minutes to assure that twenty minutes of continuous video and stereo images were recorded. All fish collected were identified, enumerated, and measured (standard length for non-exploited reef fishes and both standard and total lengths for all exploited reef fishes). Those individuals that could not be satisfactorily identified in the field were brought back to the laboratory for confirmation of identification. A subsample of collected individuals was sacrificed to provide biological material for the determination of age, sex, reproductive condition, diet, and mercury concentration. Additionally, any individual with evidence of gross external abnormalities was retained for a full fish health workup. Associated environmental data collected at each site usually includes profiles of salinity, temperature, and surface chlorophyll; and may include profiles of dissolved oxygen, light transmittance, and fluorescence. Additional environmental and meteorological observations taken on stations follow standard SEAMAP methodology. BOTTOM LONGLINE SURVEY This nearshore survey complements an existing long-term fisheries independent survey currently being conducted by NMFS offshore, by targeting shark and finfish species within the shallow waters of the north central Gulf of Mexico. The objectives of the survey were to collect information on coastal shark and finfish abundances and distribution with a 1-mile longline and to collect environmental data. During the 2014 Bottom Longline Survey, the survey design included several sampling regions off Alabama, Mississippi, Louisiana, and Texas. Stations were chosen randomly within each area and were stratified by depth. The stations were sampled during daylight hours each month. The sampling protocol follows the procedures established by the NMFS bottom longline survey. All equipment used in this bottom longline survey is identical to the equipment used by NMFS. The longline gear consisted of a 1.6 km (426 kg test monofilament) mainline with 100 gangions (3.66 m, 332 kg test monofilament) containing #15/0 circle hooks (0 offset) and baited with Atlantic mackerel, Scomber scomber. The mainline was weighted down with a midpoint and endpoint weight. Radar high-flyers with strobe bullet buoys were used to mark the longline locations. A hydraulic longline reel was used for setting and retrieving the mainline. The longline was fished for 1-hr and then retrieved.
VERTICAL LINE SURVEY In 2010, Alabama started a new vertical line survey to sample reef fish over natural and artificial reefs and other areas. The sampling gear used a typical commercial bandit rig that holds approximately 500 feet of clear 300 lb test mainline. A 24-ft. backbone (leader) was attached to the terminal end of the mainline. An approximately ten pound weight was attached to the terminal end of the backbone. The backbone was rigged with ten 18-inch long gangions at intervals of two feet. A total of 12 grids were fished per survey. Two structure and two non-structure areas were randomly chosen and equally allocated across three depth strata. Vertical line reels were baited with Atlantic mackerel. Soak time was five minutes. Fish were retained and processed for age
7
and fecundity. All fish were sacrificed for otoliths at stations deeper than 60 m. In water depth less than 60 m, stations were assigned as tag and release or collection sites. Louisiana started vertical line sampling in 2011. In Louisiana, the sampling frame is subdivided into 3 sampling blocks based on depth between 89 degrees longitude and 91 degrees longitude, with the water depth ranging from 60 to 360 feet. Each block is sampled quarterly in a rotation. Within these sampling blocks there is a possibility of randomly selecting 40 different corridors within the block. The actual sites are randomly selected within the corridor boundary and sampled at the chief scientist’s discretion. The sites roughly consist of artificial reefs, natural bottom, and petroleum production platforms.
RESULTS
PLANKTON SURVEYS Plankton stations for the Spring Plankton Survey are shown in Figure 2. Plankton stations for the Fall Plankton Survey are shown in Figure 3. TRAWL SURVEYS Summer Shrimp/Groundfish Survey Shrimp and groundfish sampling was conducted in June and July from south Florida to Brownsville, Texas. Figure 4 shows station locations. The Summer Shrimp/Groundfish Survey consisted primarily of biological trawl data and concomitant environmental and plankton data. A species composition listing from the 40-ft and 20-ft trawls is presented in Table 2, ranked in order of abundance, within the categories of finfish, crustaceans, and other invertebrates. Fall Shrimp/Groundfish Survey Shrimp and groundfish sampling was conducted from October through December from south Florida to Brownsville, Texas. Figure 5 shows the station locations. The Fall Shrimp/Groundfish Survey consisted of biological trawl data, concomitant environmental, and plankton data. A species composition listing from the 40-ft and 20-ft trawls is presented in Table 3, ranked in order of abundance, within the categories of finfish, crustaceans, and other invertebrates. REAL-TIME DATA MANAGEMENT The SEAMAP Subcommittee agreed it was imperative to the success of the SEAMAP Program to distribute data on a near real-time basis to the fishing industry and others interested in SEAMAP. Summarized data were distributed weekly to approximately 125 individuals during the Summer Shrimp/Groundfish Survey. The summarized data in the form of computer plots and data listings were sent to management agencies and industry members. These plots showed station locations, catches of Brown, Pink, and White Shrimp in lb/hr and count/lb, and total finfish catch in lb/hr. REEF FISH SURVEY Primary data collection and sampling for reef fish assessment were conducted from May through August by NMFS personnel and from June through September by Florida personnel. Station
8

locations are plotted in Figure 6. Video tapes from all sources were analyzed using NMFS standardized protocols. BOTTOM LONGLINE SURVEY Station locations for the Bottom Longline Survey are plotted in Figure 7. A species composition list is presented in Table 4. The species list is ranked in order of abundance. VERTICAL LINE SURVEY Station locations for the Vertical Line Survey are plotted in Figure 8. A species composition list, ranked in order of abundance, is presented in Table 5.
DISCUSSION
The quasisynoptic SEAMAP sampling program and the intended long-term nature of the sampling programs have been designed to provide the baseline data set needed for fishery management and conservation. In 1985, the SEAMAP long-term baseline data was disrupted by the loss of the Spring Plankton Survey and Fall Plankton Survey. In 1986, the SEAMAP Subcommittee renewed its commitment for the collection of baseline plankton data. These ichthyoplankton samples are and will continue to be used by researchers studying taxonomy, age and growth, bioenergetics, and other life history aspects, as well as spawning biomass and recruitment. Information on species’ relative distributions within the Gulf of Mexico can be analyzed with respect to environmental data to assess population abundance as a function of environmental change. Similar analyses and investigations are being undertaken with Summer and Fall Shrimp/Groundfish Survey data. These data sets are being utilized in resource management decisions, and because of the program’s ability to process data quickly, the capability exists to optimize some fisheries on a real-time basis. The long-term data set on all of the species collected, not just those of commercial and recreational importance, offers an opportunity to examine ecological relationships, with the eventual goal of developing management models that take into account the multi-species nature of most Gulf fisheries. The value of the SEAMAP program lies in its use for both immediate and long-range management goals. Much use has already been made of SEAMAP data. For example, during the past SEAMAP surveys an area of very low dissolved bottom oxygen was found off Louisiana in the summers of 1982, 1985-2014. The presence of this phenomenon and some of the related conditions and biological effects were reported by Leming and Stuntz (1984) and Hanifen et al. (1995), and during such occurrences, SEAMAP has distributed special environmental bulletins and news releases to management agencies and the shrimp industry. In addition, SEAMAP data were used to assist in the identification of the minimum 1997 reduction in Red Snapper shrimp trawl bycatch mortality rate that would enable the Red Snapper fishery to still recover to the 20% spawning potential ratio (SPR) by the year 2019 (Goodyear 1997). This analysis was requested and supported by the Gulf of Mexico Fishery Management Council to address the issue of Red Snapper bycatch. SEAMAP data were also used by some coastal states to determine the status of shrimp stocks and their movements just as the shrimping seasons were to be opened and SEAMAP data were used to develop a guide to the grouper species of the western North Atlantic Ocean (Grace et al. 1994). The primary purpose of the guide is for species identification with projects that deploy underwater video camera systems.
9

Since SEAMAP’s inception in 1982, the goal of plankton activities in the Gulf of Mexico has been to collect data on the early life stages of fishes and invertebrates that will complement and enhance the fishery-independent data gathered on the adult life-stage (Lyczkowski-Shultz and Brasher 1996). An annual larval index for Atlantic Bluefin Tuna and Skipjack Tuna is generated each year from the Spring Plankton Survey and is used by the International Commission for the Conservation of Atlantic Bluefin Tunas to estimate stock size (Scott et al. 1993). Larval indices generated from the Summer Shrimp/Groundfish and Fall Plankton Surveys have now become an integral part of the King Mackerel assessment in the Gulf (Gledhill and Lyczkowski-Shultz 2000). Larvae from SEAMAP collections have formed the basis for formal descriptions of larval development for fishes such as the snappers, Cobia, Tripletail, and Dolphin (Drass et al. 2000; Ditty and Shaw 1992; Ditty and Shaw 1993; Ditty et al. 1994). Data on distribution and relative abundance of larvae of all Gulf fishes captured during SEAMAP surveys have been summarized by Richards et al. 1984, Kelley et al. 1985, Kelley et al. 1990, and Kelley et al. 1993. The SEAMAP data collected during the Summer Shrimp/Groundfish Survey continues to be used extensively for fishery management purposes. In 1981, the Gulf of Mexico Fishery Management Council's plan for shrimp was implemented (Center for Wetland Resources 1980), with one management measure calling for the temporary closure to shrimping in the EEZ off Texas. This closure complements the traditional closure of the Texas territorial sea, normally May 15 through early July of each year. The GMFMC determined that this type of closure would allow small Brown Shrimp to be protected from harvest, but would still allow the taking of larger Brown Shrimp by fishermen in deeper waters. The National Marine Fisheries Service was charged with evaluating the effects of the Texas Closure and submitted a report to the GMFMC in January 2014. This report contained the results and an overview of the effect of the 2013 Texas Closure. After review of these data and other information, the GMFMC voted to continue the Texas Closure for 2014. Data from all SEAMAP surveys have been used in the SouthEast Data, Assessment, and Review (SEDAR) process. SEDAR is a cooperative Fishery Management Council process initiated in 2002 to improve the quality and reliability of fishery stock assessments. SEDAR seeks improvements in the scientific quality of stock assessments and greater relevance of quantities information available to address existing and emerging fishery management issues. SEAMAP data have been used in stock assessments for Greater Amberjack, Almaco Jack, Lesser Amberjack, Snowy Grouper, Speckled Hind, King Mackerel, Red Snapper, Vermillion Snapper, Gray Triggerfish, Gag Grouper, Red Grouper, Mutton Snapper, Lane Snapper, Wenchman, Blacknose Shark, Atlantic Sharpnose Shark, Bonnethead Shark, Smoothhound Sharks, small coastal sharks, and Blacktip Shark. DATA REQUESTS It is the policy of the SEAMAP Subcommittee that all verified non-confidential SEAMAP data, collected specimens, and samples shall be available to all SEAMAP participants, other fishery researchers, and management organizations. This atlas presents, to those individuals interested in the data or specimens, a chance to review the data in a summary form. Data and specimen requests from SEAMAP participants, cooperators and others will normally be handled on a first-come, first-served, and time-available basis. Because of personnel and funding limitations, however, certain priorities must be assigned to the data and specimen requests. These
10

priorities are reviewed by the SEAMAP Subcommittee. For further information on SEAMAP data management, see the Southeast Area Monitoring and Assessment Program (SEAMAP) Management Plan: 2011-2015 (ASMFC 2011). Data requests and inquiries, as well as requests for plankton samples, can be made by contacting Jeff Rester, the SEAMAP Coordinator, Gulf States Marine Fisheries Commission, 2404 Government Street, Ocean Springs, MS 39564; (228) 875-5912 or via e-mail at [email protected].
11

LITERATURE CITED Atlantic States Marine Fisheries Commission. 2011. SEAMAP Management Plan: 2011-2015.
Washington, DC: ASMFC. Center for Wetland Resources. 1980. Management plan and final environmental impact statement
for the shrimp fishery of the Gulf of Mexico, United States waters. Louisiana State Univ., Baton Rouge, Louisiana. 185 p.
Ditty, J.G. and R.F. Shaw. 1992. Larval development, distribution, and ecology of cobia
Rachycentron canadum (Family: Rachycentridae), in the northern Gulf of Mexico. Fishery Bulletin. Vol. 90:668-677.
Ditty, J.G. and R.F. Shaw. 1993. Larval development of tripletail, Lobotes surinamensis (Pisces:
Lobotidae), and their spatial and temporal distribution in the northern Gulf of Mexico. Fishery Bulletin. Vol. 92:33-45.
Ditty, J.G., R.F. Shaw, C.B. Grimes, and J.S. Cope. 1994. Larval development, distribution, and
abundance of common dolphin, Coryphaena hippurus, and pompano dolphin, C. equiselis (Family: Coryphaenidae), in the northern Gulf of Mexico. Fishery Bulletin. Vol. 94:275-291.
Donaldson, D.M., N.J. Sanders, and P.A. Thompson. 1993. SEAMAP environmental and
biological atlas of the Gulf of Mexico, 1991. Gulf States Marine Fisheries Commission. No. 29. 321 p.
Donaldson, D.M., N.J. Sanders, and P.A. Thompson. 1994. SEAMAP environmental and
biological atlas of the Gulf of Mexico, 1992. Gulf States Marine Fisheries Commission. No. 30. 293 p.
Donaldson, D.M., N.J. Sanders, P.A. Thompson and R. Minkler. 1996. SEAMAP environmental
and biological atlas of the Gulf of Mexico, 1993. Gulf States Marine Fisheries Commission. No. 34. 284 p.
Donaldson, D.M., N.J. Sanders, P.A. Thompson and R. Minkler. 1997a. SEAMAP environmental
and biological atlas of the Gulf of Mexico, 1994. Gulf States Marine Fisheries Commission. No. 40. 277 p.
Donaldson, D.M., N.J. Sanders, P.A. Thompson and R. Minkler. 1997b. SEAMAP environmental
and biological atlas of the Gulf of Mexico, 1995. Gulf States Marine Fisheries Commission. No. 41. 280 p.
Donaldson, D.M., N.J. Sanders, P.A. Thompson and D. Hanisko. 1998. SEAMAP environmental
and biological atlas of the Gulf of Mexico, 1996. Gulf States Marine Fisheries Commission. No. 52. 263 p.
Drass, D.M., K.L. Bootes, J. Lyczkowski-Shultz, B.H. Comyns, G.J. Holt, C.M. Riley, and R.P.
Phelps. 2000. Larval development of red snapper, Lutjanus campechanus, with comparisons to co-occurring snapper species. Fishery Bulletin. Vol. 98(3):507-527.
12

Eldridge, P.J. 1988. The Southeast Area Monitoring and Assessment Program (SEAMAP): A
state-federal-university program for collection, management and dissemination of fishery-independent data and information in the southeast United States. Mar. Fish. Rev. 50(2): 29-39.
Gledhill, C.T. and J. Lyczkowski-Shultz. 2000. Indices of larval king mackerel, Scomberomorus
cavalla, for use in population assessment in the Gulf of Mexico. Fishery Bulletin. Vol. 98(4):684-691.
Goodyear, C.P. 1997. An evaluation of the minimum reduction in the 1997 red snapper shrimp
bycatch mortality rate consistent with the 2019 recovery target. GMFMC. 14 p. + appendix. Grace, M., K.R. Rademacher and M. Russell. 1994. Pictorial guide to the groupers (Teleostei:
Serrenidae) of the western North Atlantic. NOAA Tech. Report. NMFS 118. 46 p. Hanifen, J.G., W.S. Perret, R.P. Allemand and T.L. Romaire. 1995. Potential impacts of hypoxia
on fisheries: Louisiana=s fishery-independent data. In Proceedings of Gulf of Mexico Program=s Hypoxia Conference. November 1995, New Orleans, LA.
Jeffrey, S.W. and G.F. Humphrey. 1975. New spectrophotometric equations for determining
chlorophylls a, b, c1 and c2 in higher plants, algae and natural phytoplankton. Biochem. Physiol. Pflanzer Bpp. 167: 191-194.
Kelley, S., T. Potthoff, W.J. Richards, L. Ejsymont and J.V. Gartner. 1985. SEAMAP 1983 -
Ichthyoplankton. Larval distribution and abundance of Engraulididae, Carangidae, Clupeidae, Lutjanidae, Serranidae, Sciaenidae, Coryphaenidae, Istiophoridae, Xiphiidae and Scombridae in the Gulf of Mexico. NOAA Tech. Mem., NMFS-SEFC -167.
Kelley, S., J.V. Gartner, Jr., W.J. Richards and L. Ejsymont. 1990. SEAMAP 1984 & 1985 -
Ichthyoplankton. Larval distribution and abundance of Carangidae, Clupeidae, Coryphaenidae, Engraulididae, Gobiidae, Istiophoridae, Lutjanidae, Scombridae, Serranidae, and Xiphiidae in the Gulf of Mexico. NOAA Tech. Mem., NMFS-SESC-317.
Kelley, S., J.V. Gartner, Jr., W.J. Richards and L. Ejsymont. 1993. SEAMAP 1986 -
Ichthyoplankton. Larval distribution and abundance of Engraulididae, Carangidae, Clupeidae, Gobiidae, Lutjanidae, Serranidae, Coryphaenidae, Istiophoridae and Scombridae in the Gulf of Mexico. NOAA Tech. Mem., NMFS-SESC-245.
Kramer, D., M.J. Kalin, E.G. Stevens, J.R. Thrailkill and J.R. Zweifel. 1972. Collecting and
processing data on fish eggs and larvae in the California Current region. NOAA Technical Report. NMFS Circular 370. 38 p.
Leming, T.D. and W.E. Stuntz. 1984. Zones of coastal hypoxia revealed by satellite scanning
have implications for strategic fishing. Nature. 310 (5973): 131-138. Lyczkowski-Shultz, J. and R. Brasher. 1996. Ichthyoplankton data summaries from SEAMAP
Summer Shrimp/Groundfish Surveys. Pages 27-42 in Uses of Fishery-Independent Data. General Session Proceedings, Gulf States Marine Fisheries Commission. No. 35.
13
Nichols, S. 1982. Impacts of the 1981 and 1982 Texas closure on brown shrimp yields. NOAA, NMFS-SEFC. 44 p.
Nichols, S. 1984. Impacts of the 1982 and 1983 closure of the Texas FCZ on brown shrimp yields.
Report to the Gulf of Mexico Fishery Management Council. Nichols, S. and J.R. Poffenberger. 1987. Analysis of alternative closures for improving brown
shrimp yield in the Gulf of Mexico. Report to the Gulf of Mexico Fishery Management Council.
Posgay, J.A. and R.R. Marak. 1980. The MARMAP bongo zooplankton samplers. J. Northw.
Atl. Fish. Sci. 1: 9-99. Rester, J.K. 2009. SEAMAP environmental and biological atlas of the Gulf of Mexico, 2004.
Gulf States Marine Fisheries Commission. No. 173. Rester, J.K. 2010. SEAMAP environmental and biological atlas of the Gulf of Mexico, 2005.
Gulf States Marine Fisheries Commission. No. 175. Rester, J.K. 2010. SEAMAP environmental and biological atlas of the Gulf of Mexico, 2006.
Gulf States Marine Fisheries Commission. No. 179. Rester, J.K. 2010. SEAMAP environmental and biological atlas of the Gulf of Mexico, 2007.
Gulf States Marine Fisheries Commission. No. 180. Rester, J.K. 2011. SEAMAP environmental and biological atlas of the Gulf of Mexico, 2008.
Gulf States Marine Fisheries Commission. No. 191. Rester, J.K. 2011. SEAMAP environmental and biological atlas of the Gulf of Mexico, 2009.
Gulf States Marine Fisheries Commission. No. 198. Rester, J.K. 2012. SEAMAP environmental and biological atlas of the Gulf of Mexico, 2010.
Gulf States Marine Fisheries Commission. No. 206. Rester, J.K. 2014. SEAMAP environmental and biological atlas of the Gulf of Mexico, 2011.
Gulf States Marine Fisheries Commission. No. 229. Rester, J.K. 2014. SEAMAP environmental and biological atlas of the Gulf of Mexico, 2012.
Gulf States Marine Fisheries Commission. No. 237. Rester, J.K. 2015. SEAMAP environmental and biological atlas of the Gulf of Mexico, 2013.
Gulf States Marine Fisheries Commission. No. 239. Rester, J.K., N.J. Sanders, P.A. Thompson and D. Hanisko. 1999. SEAMAP environmental and
biological atlas of the Gulf of Mexico, 1997. Gulf States Marine Fisheries Commission. No. 63. 254 p.
Rester, J.K., N.J. Sanders, G. Pellegrin, Jr. and D. Hanisko. 2000. SEAMAP environmental and
biological atlas of the Gulf of Mexico, 1998. Gulf States Marine Fisheries Commission. No. 75. 243 p.
14

Rester, J.K., N.J. Sanders, G. Pellegrin, Jr. and D. Hanisko. 2001. SEAMAP environmental and
biological atlas of the Gulf of Mexico, 1999. Gulf States Marine Fisheries Commission. No. 82. 247 p.
Rester, J.K., N.J. Sanders, G. Pellegrin, Jr. and D. Hanisko. 2002. SEAMAP environmental and
biological atlas of the Gulf of Mexico, 2000. Gulf States Marine Fisheries Commission. No. 101. Available on CD-ROM only.
Rester, J.K., N.J. Sanders, G. Pellegrin, Jr., and D. Hanisko. 2004. SEAMAP environmental and
biological atlas of the Gulf of Mexico, 2001. Gulf States Marine Fisheries Commission. No. 118. Available on CD-ROM only.
Rester, J.K., N.J. Sanders, and G. Pellegrin, Jr. 2008. SEAMAP environmental and biological
atlas of the Gulf of Mexico, 2002. Gulf States Marine Fisheries Commission. No. 156. Rester, J.K., N.J. Sanders, and G. Pellegrin, Jr. 2009. SEAMAP environmental and biological
atlas of the Gulf of Mexico, 2003. Gulf States Marine Fisheries Commission. No. 172. Richards, W.J., T. Potthoff, S. Kelley, M.F. McGowan, L. Ejsymont, J.H. Power and R.M. Olvera
L. 1984. SEAMAP 1982 - Ichthyoplankton. Larval distribution and abundance of Engraulididae, Carangidae, Clupeidae, Lutjanidae, Serranidae, Sciaenidae, Coryphaenidae, Istiophoridae, Xiphiidae and Scombridae in the Gulf of Mexico. NOAA Tech. Mem., NMFS-SEFC-167.
Russell, G.M. Unpublished report. Reef fish assessment methodology for SEAMAP surveys of
hardbottom areas. National Marine Fisheries Service. 25 p. Sanders, N.J., P.A. Thompson and T. Van Devender. 1990a. SEAMAP environmental and
biological atlas of the Gulf of Mexico, 1986. Gulf States Marine Fisheries Commission. No. 20. 328 p.
Sanders, N.J., P.A. Thompson and D.M. Donaldson. 1990b. SEAMAP environmental and
biological atlas of the Gulf of Mexico, 1987. Gulf States Marine Fisheries Commission. No. 22. 337 p.
Sanders, N.J., D.M. Donaldson and P.A. Thompson. 1991a. SEAMAP environmental and
biological atlas of the Gulf of Mexico, 1988. Gulf States Marine Fisheries Commission. No. 23. 320 p.
Sanders, N.J., D.M. Donaldson and P.A. Thompson. 1991b. SEAMAP environmental and
biological atlas of the Gulf of Mexico, 1989. Gulf States Marine Fisheries Commission. No. 25. 318 p.
Sanders, N.J., D.M. Donaldson and P.A. Thompson. 1992. SEAMAP environmental and
biological atlas of the Gulf of Mexico, 1990. Gulf States Marine Fisheries Commission. No. 27. 311 p.
15

Scott, G.P., S.C. Turner, C.B. Grimes, W.J. Richards, and E.B. Brothers. 1993. Indices of larval bluefin tuna, Thunnus thynnus, abundance in the Gulf of Mexico: modeling variability in growth, mortality, and gear selectivity. Bulletin of Marine Science. Vol. 53(2):912-929.
Sherman, K., R. Lasker, W. Richards and A.W. Kendall, Jr. 1983. Ichthyoplankton and fish
recruitment studies in large marine ecosystems. Mar. Fish. Rev. 45 (10, 11, 12): 1-25. Smith, P.E. and S.L. Richardson, eds. 1977. Standard techniques for pelagic fish egg and larva
surveys. FAO Fish. Tech. Paper 175. 100 p. Southeast Area Monitoring and Assessment Program (SEAMAP) Strategic Plan. 1981. Report to
the Gulf States Marine Fisheries Commission. 50 p. Strickland, J.D.H. and T.R. Parsons. 1972. A practical handbook of seawater analysis. Ottawa:
Fish. Res. Bd. Can. 310 p. Stuntz, W.E., C.E. Bryan, K. Savastano, R.S. Waller and P.A. Thompson. 1985. SEAMAP
environmental and biological atlas of the Gulf of Mexico, 1982. Gulf States Marine Fisheries Commission. 145 p.
Thompson, P.A. and N. Bane. 1986a. SEAMAP environmental and biological atlas of the Gulf
of Mexico, 1983. Gulf States Marine Fisheries Commission. No. 13. 179 p. Thompson, P.A. and N. Bane. 1986b. SEAMAP environmental and biological atlas of the Gulf
of Mexico, 1984. Gulf States Marine Fisheries Commission. No. 15. 171 p. Thompson, P.A., T. Van Devender and N.J. Sanders, Jr. 1988. SEAMAP environmental and
biological atlas of the Gulf of Mexico, 1985. Gulf States Marine Fisheries Commission. No. 17. 338 p.
16

WINTER SPRING SPRING SUMMER FALL YEAR SHRIMP/GROUNDFISH PLANKTON SHRIMP/GROUNDFISH SHRIMP/GROUNDFISH BUTTERFISH PLANKTON 1982 -- APRIL-MAY -- JUNE-JULY -- --1983 -- APRIL-MAY -- JUNE-JULY -- --1984 -- APRIL-MAY -- JUNE-JULY -- AUGUST1985 -- -- -- JUNE-JULY JULY-AUGUST SEPTEMBER1986 -- APRIL-MAY -- JUNE-JULY MAY-JUNE SEPTEMBER1987 -- APRIL-MAY -- JUNE-JULY -- SEPTEMBER1988 -- MARCH-MAY -- JUNE-JULY -- SEPTEMBER-OCTOBER1989 -- APRIL-MAY -- JUNE-JULY -- SEPTEMBER-OCTOBER1990 -- APRIL-MAY -- JUNE-JULY -- SEPTEMBER-OCTOBER1991 -- APRIL-MAY -- JUNE-JULY -- AUGUST-SEPTEMBER1992 -- APRIL-MAY -- JUNE-JULY -- AUGUST-OCTOBER1993 -- APRIL-MAY -- JUNE-JULY -- SEPTEMBER-OCTOBER1994 -- APRIL-MAY -- JUNE-JULY -- SEPTEMBER-OCTOBER1995 -- APRIL-JUNE -- JUNE-JULY -- SEPTEMBER1996 -- APRIL-JUNE -- JUNE-JULY -- SEPTEMBER-OCTOBER1997 -- APRIL-JUNE -- JUNE-JULY -- SEPTEMBER-OCTOBER1998 -- APRIL-JUNE -- JUNE-JULY -- SEPTEMBER-OCTOBER1999 -- APRIL-MAY -- JUNE-JULY -- SEPTEMBER-OCTOBER2000 -- APRIL-MAY -- JUNE-JULY -- SEPTEMBER-OCTOBER2001 -- APRIL-MAY -- JUNE-JULY -- AUGUST-OCTOBER2002 -- APRIL-MAY -- JUNE-JULY -- AUGUST-OCTOBER2003 -- MAY -- JUNE-JULY -- AUGUST-OCTOBER2004 -- APRIL-JUNE -- JUNE-JULY -- SEPTEMBER2005 -- APRIL-MAY -- JUNE-AUGUST -- --2006 -- APRIL-MAY -- JUNE-JULY -- AUGUST-SEPTEMBER2007 -- MARCH-JUNE -- JUNE-AUGUST -- AUGUST-SEPTEMBER2008 -- APRIL-JUNE APRIL JUNE-AUGUST -- SEPTEMBER2009 JANUARY-FEBRUARY APRIL-JUNE MARCH JUNE-JULY -- AUGUST-SEPTEMBER2010 FEBRUARY APRIL-MAY APRIL JUNE-AUGUST -- AUGUST-SEPTEMBER2011 FEBRUARY MAY -- JUNE-JULY -- AUGUST-SEPTEMBER2012 -- APRIL-MAY -- MAY-JULY -- AUGUST-SEPTEMBER2013 -- MAY -- JUNE-JULY -- AUGUST-SEPTEMBER2014 -- MAY -- JUNE-JULY -- AUGUST-SEPTEMBER
SEAMAP SURVEY ACTIVITIES
Table 1. List of SEAMAP survey activities from 1982 to 2014.
17

FALL WINTER BOTTOM VERTICAL REEFYEAR SHRIMP/GROUNDFISH PLANKTON LONGLINE LINE FISH1982 -- -- -- --1983 -- DECEMBER -- --1984 -- DECEMBER -- --1985 SEPTEMBER-DECEMBER -- -- --1986 OCTOBER-DECEMBER -- -- --1987 SEPTEMBER-DECEMBER -- -- --1988 OCTOBER-DECEMBER -- -- --1989 OCTOBER-DECEMBER -- -- --1990 OCTOBER-DECEMBER -- -- --1991 SEPTEMBER-DECEMBER -- -- --1992 OCTOBER-DECEMBER -- -- MAY-JUNE1993 OCTOBER-DECEMBER JAN.-FEB. -- MAY-JULY, SEPT., NOV.1994 OCTOBER-NOVEMBER -- -- MAY-JULY, AUG.-OCT., DEC.1995 OCTOBER-DECEMBER -- -- JAN., JUNE-AUG., DEC.1996 OCTOBER-DECEMBER DECEMBER -- JULY, AUGUST, NOVEMBER1997 OCTOBER-DECEMBER -- -- JUNE, JULY, AUG., NOV.1998 OCTOBER-NOVEMBER -- -- MAY, JULY, AUGUST1999 OCTOBER-NOVEMBER -- -- JAN., AUG., OCT., DEC.2000 OCTOBER-DECEMBER -- -- OCTOBER, NOVEMBER2001 OCTOBER-DECEMBER -- -- MAY, JUNE, OCTOBER2002 OCTOBER-DECEMBER -- -- FEBRUARY-MAY, OCTOBER2003 OCTOBER-DECEMBER -- -- OCTOBER-NOVEMBER2004 OCTOBER-DECEMBER JANUARY -- FEBRUARY-MARCH2005 OCTOBER-NOVEMBER -- -- FEBRUARY-JULY, OCTOBER2006 OCTOBER-DECEMBER -- -- FEBRUARY-AUGUST2007 OCTOBER-DECEMBER -- -- FEBRUARY-MAY2008 SEPTEMBER-NOVEMBER FEB.-MAR. MARCH-OCTOBER FEBRUARY-AUGUST2009 SEPTEMBER-NOVEMBER FEB.-MAR. MARCH-OCTOBER APRIL-AUGUST2010 SEPTEMBER-NOVEMBER FEB.-MAR. MARCH-OCTOBER APRIL-DECEMBER MARCH-SEPTEMBER2011 OCTOBER-NOVEMBER -- MARCH-OCTOBER MAY-DECEMBER APRIL-JULY2012 OCTOBER-NOVEMBER JANUARY-FEBRURY MARCH-OCTOBER MARCH-OCTOBER JANUARY-AUGUST2013 OCTOBER-DECEMBER FEBRUARY MARCH-OCTOBER FEBRUARY-OCTOBER FEBRUARY-OCTOBER2014 OCTOBER-NOVEMBER -- MARCH-OCTOBER MAY-OCTOBER MAY-SEPTEMBER
SEAMAP SURVEY ACTIVITIES
Table 1. List of SEAMAP survey activities from 1982 to 2014 (continued).
18

Table 2. 2014 Summer Shrimp/Groundfish Survey species composition list, 443 trawl stations, for those vessels that used either a 40-ft or 20-ft trawl.
Species with a total weight of less than 0.0227 kg (0.05 lb) are indicated on the table as 0.0 kg.
NUMBER OF
TOTAL NUMBER TOTAL WEIGHT TOWS WHERE % FREQUENCY
GENUS/SPECIES COMMON NAME CAUGHT CAUGHT (KG) CAUGHT OCCURRENCE
Finfishes
Micropogonias undulatus Atlantic croaker 76003 2534.6 159 35.9
Peprilus burti gulf butterfish 35975 736.3 195 44
Stenotomus caprinus longspine porgy 27148 440.9 160 36.1
Chloroscombrus chrysurus Atlantic bumper 22535 495.1 113 25.5
Lagodon rhomboides pinfish 19609 1179.1 119 26.9
Syacium papillosum dusky flounder 16554 373.7 163 36.8
Trachurus lathami rough scad 13214 230.6 117 26.4
Leiostomus xanthurus spot 8831 535 111 25.1
Mullus auratus red goatfish 7010 207.4 52 11.7
Prionotus longispinosus bigeye searobin 5605 90.2 140 31.6
Cynoscion nothus silver seatrout 4516 135.7 92 20.8
Eucinostomus gula silver jenny 4014 144.9 43 9.7
Trichiurus lepturus Atlantic cutlassfish 3703 118 111 25.1
Saurida brasiliensis largescale lizardfish 3240 14.5 123 27.8
Lutjanus synagris lane snapper 3107 363.5 99 22.3
Synodus foetens inshore lizardfish 2811 354.7 266 60
Haemulon aurolineatum tomtate 2547 152.4 100 22.6
Serranus atrobranchus blackear bass 2512 30.8 86 19.4
Orthopristis chrysoptera pigfish 2461 218.8 37 8.4
Haemulon plumierii white grunt 2433 232.5 38 8.6
Pristipomoides aquilonaris wenchman 2284 110.3 87 19.6
Synodus poeyi offshore lizardfish 2054 17.1 121 27.3
Selene setapinnis Atlantic moonfish 2007 78.2 107 24.2
Diplectrum formosum sand perch 1952 158.4 156 35.2
Cynoscion arenarius sand seatrout 1813 88.5 133 30
Upeneus parvus dwarf goatfish 1706 49.9 74 16.7
Prionotus stearnsi shortwing searobin 1672 21.7 72 16.3
19

Table 2. Species composition list (continued)
NUMBER OF
TOTAL NUMBER TOTAL WEIGHT TOWS WHERE % FREQUENCY
GENUS/SPECIES COMMON NAME CAUGHT CAUGHT (KG) CAUGHT OCCURRENCE
Syacium gunteri shoal flounder 1593 28 108 24.4
Scorpaena brasiliensis barbfish 1437 71.9 93 21
Harengula jaguana scaled sardine 1320 59.3 45 10.2
Scorpaena calcarata smoothhead scorpionfish 1319 24.2 57 12.9
Stephanolepis hispida 1218 47.7 129 29.1
Centropristis philadelphica rock sea bass 1096 42 122 27.5
Synodus macrostigmus 1092 81 73 16.5
Sphoeroides dorsalis marbled puffer 1087 42.2 109 24.6
Larimus fasciatus banded drum 1061 50.6 73 16.5
Bellator militaris horned searobin 959 16.4 67 15.1
Centropristis ocyurus bank sea bass 947 31 74 16.7
Calamus arctifrons grass porgy 946 80.8 18 4.1
Trichopsetta ventralis sash flounder 866 18.7 44 9.9
Calamus proridens littlehead porgy 779 185.6 64 14.4
Acanthostracion quadricornis 753 113.6 122 27.5
Saurida normani shortjaw lizardfish 703 73.1 20 4.5
Serranus notospilus saddle bass 697 2 39 8.8
Trachinocephalus myops snakefish 669 46.5 82 18.5
Serranus phoebe tattler 628 22.3 47 10.6
Sphoeroides spengleri bandtail puffer 627 26.7 86 19.4
Rhomboplites aurorubens vermilion snapper 591 61.5 53 12
Equetus lanceolatus jackknife fish 519 66 71 16
Diplectrum bivittatum dwarf sand perch 509 10.4 57 12.9
Etrumeus teres round herring 497 5.1 21 4.7
Urophycis floridana southern hake 497 30 56 12.6
Lutjanus campechanus red snapper 489 145.4 102 23
Anchoa hepsetus striped anchovy 462 7.5 34 7.7
Prionotus alatus spiny searobin 462 8.1 43 9.7
Scorpaena agassizii longfin scorpionfish 453 17.4 26 5.9
Bothus robinsi twospot flounder 452 13.5 72 16.3
Brevoortia patronus gulf menhaden 448 17.4 43 9.7
20

Table 2. Species composition list (continued)
NUMBER OF
TOTAL NUMBER TOTAL WEIGHT TOWS WHERE % FREQUENCY
GENUS/SPECIES COMMON NAME CAUGHT CAUGHT (KG) CAUGHT OCCURRENCE
Halieutichthys 438 2.9 54 12.2
Steindachneria argentea luminous hake 435 1.2 3 0.7
Prionotus scitulus leopard searobin 434 17.3 33 7.4
Etropus crossotus fringed flounder 415 4.8 60 13.5
Opisthonema oglinum Atlantic thread herring 407 19.3 45 10.2
Lepophidium jeannae mottled cusk-eel 393 20.2 23 5.2
Chaetodipterus faber Atlantic spadefish 388 28.8 25 5.6
Pterois volitans lion fish 387 103.1 56 12.6
Etropus cyclosquamus shelf flounder 378 3.1 10 2.3
Monacanthus ciliatus fringed filefish 336 6.5 63 14.2
Prionotus roseus bluespotted searobin 333 11.3 66 14.9
Lepophidium brevibarbe blackedge cusk-eel 327 11 45 10.2
Prionotus paralatus Mexican searobin 316 5.9 25 5.6
Etropus rimosus gray flounder 311 5.6 23 5.2
Ariopsis felis hardhead catfish 286 40.1 31 7
Cyclopsetta chittendeni Mexican flounder 284 29.2 68 15.3
Decapterus punctatus round scad 277 10.3 34 7.7
Lepophidium spp. cusk-eels 277 3.1 3 0.7
Sphoeroides parvus least puffer 257 2.1 38 8.6
Prionotus rubio blackwing searobin 251 18.4 38 8.6
Synodus intermedius sand diver 250 28.9 55 12.4
Prionotus martis barred searobin 233 6.3 24 5.4
Lutjanus griseus grey snapper 231 65.8 43 9.7
Pagrus pagrus red porgy 230 10.1 26 5.9
Stellifer lanceolatus star drum 225 4.5 27 6.1
Eucinostomus mojarras 212 2.1 2 0.5
Prionotus tribulus bighead searobin 208 7.6 48 10.8
Eucinostomus argenteus spotfin mojarra 208 6.6 7 1.6
Ancylopsetta ommata ocellated flounder 203 14.4 64 14.4
Halieutichthys aculeatus pancake batfish 200 2.2 62 14
Ophidion holbrookii bank cusk-eel 195 14 32 7.2
21

Table 2. Species composition list (continued)
NUMBER OF
TOTAL NUMBER TOTAL WEIGHT TOWS WHERE % FREQUENCY
GENUS/SPECIES COMMON NAME CAUGHT CAUGHT (KG) CAUGHT OCCURRENCE
Ogcocephalus declivirostris slantbrow batfish 192 4.3 27 6.1
Citharichthys macrops spotted whiff 189 5.3 36 8.1
Bairdiella chrysoura silver perch 186 9.2 16 3.6
Prionotus ophryas bandtail searobin 185 8.8 49 11.1
Pareques umbrosus cubbyu 173 10.9 31 7
Aluterus schoepfii orange filefish 172 92.6 57 12.9
Haemulon striatum striped grunt 172 10.4 5 1.1
Menticirrhus americanus southern kingfish 170 22.5 29 6.5
Lagocephalus laevigatus smooth puffer 165 5.2 50 11.3
Porichthys plectrodon Atlantic midshipman 157 4.2 57 12.9
Urophycis cirrata gulf hake 151 2.5 31 7
Cynoscion spp. seatrouts 143 0.3 12 2.7
Peprilus paru harvestfish 136 9.3 22 5
Eucinostomus harengulus tidewater mojarra 129 4 22 5
Gymnothorax saxicola honeycomb moray 128 10.3 53 12
Anchoa lyolepis dusky anchovy 122 0.3 3 0.7
Chaetodon ocellatus spotfin butterflyfish 122 10 42 9.5
Kathetostoma albigutta lancer stargazer 119 4.5 34 7.7
Ancylopsetta dilecta three-eye flounder 114 3.4 34 7.7
Nicholsina usta emerald parrotfish 113 7.1 26 5.9
Sardinella aurita Spanish sardine 111 7.8 20 4.5
Epinephelus morio red grouper 109 99.8 38 8.6
Antennarius radiosus singlespot frogfish 104 0.7 31 7
Hemipteronotus novacula pearly razorfish 102 5.2 29 6.5
Balistes capriscus gray triggerfish 100 14.6 28 6.3
Apogon affinis bigtooth cardinalfish 99 0.5 9 2
Bollmannia communis ragged goby 95 0.3 20 4.5
Lachnolaimus maximus hogfish 94 17.3 17 3.8
Symphurus diomedeanus spottedfin tonguefish 90 2.7 28 6.3
Hippocampus erectus lined seahorse 78 0.5 39 8.8
Synodus lizard fishes 72 5 10 2.3
22

Table 2. Species composition list (continued)
NUMBER OF
TOTAL NUMBER TOTAL WEIGHT TOWS WHERE % FREQUENCY
GENUS/SPECIES COMMON NAME CAUGHT CAUGHT (KG) CAUGHT OCCURRENCE
Ogcocephalus parvus roughback batfish 72 0.7 31 7
Citharichthys spilopterus bay whiff 69 0.9 19 4.3
Echeneis neucratoides whitefin sharksucker 68 17.9 18 4.1
Symphurus plagiusa blackcheek tonguefish 68 1.9 23 5.2
Ocyurus chrysurus yellowtail snapper 67 5.5 11 2.5
Paralichthys squamilentus broad flounder 64 11 20 4.5
Calamus nodosus knobbed porgy 59 15.6 17 3.8
Otophidium omostigmum polka-dot cusk-eel 53 0.4 10 2.3
Brotula barbata bearded brotula 52 8.6 24 5.4
Pterois lion fishes 51 14.6 11 2.5
Rhizoprionodon terraenovae Atlantic sharpnose shark 51 19.6 22 5
Chilomycterus schoepfii striped burrfish 50 11.1 37 8.4
Raja texana roundel skate 50 17.3 39 8.8
Chromis enchrysura yellowtail reeffish 49 0.8 19 4.3
Ophidion beani longnose cusk-eel 49 2.9 12 2.7
Ogcocephalus cubifrons 48 14.4 28 6.3
Engyophrys senta spiny flounder 47 0.2 16 3.6
Gastropsetta frontalis shrimp flounder 46 4.2 25 5.6
Chaetodon sedentarius reef butterflyfish 46 2.5 15 3.4
Polydactylus octonemus Atlantic threadfin 44 1.6 12 2.7
Calamus leucosteus whitebone porgy 40 12.5 10 2.3
Aluterus heudelotii dotterel filefish 39 12.3 25 5.6
Pareques iwamotoi blackbar drum 38 1.4 11 2.5
Echiophis intertinctus spotted spoon-nose eel 38 7.3 19 4.3
Sphoeroides nephelus southern puffer 38 2.8 13 2.9
Paralichthys albigutta gulf flounder 37 10.1 17 3.8
Hoplunnis diomedianus blacktail pike-conger 36 0.2 2 0.5
Cyclopsetta fimbriata spotfin flounder 36 5.2 25 5.6
Symphurus civitatium offshore tonguefish 35 0.6 10 2.3
Centropristis striatus black sea bass 34 4.5 7 1.6
Pomacanthus arcuatus gray angelfish 30 13.3 14 3.2
23

Table 2. Species composition list (continued)
NUMBER OF
TOTAL NUMBER TOTAL WEIGHT TOWS WHERE % FREQUENCY
GENUS/SPECIES COMMON NAME CAUGHT CAUGHT (KG) CAUGHT OCCURRENCE
Neomerinthe hemingwayi spinycheek scorpionfish 29 3 8 1.8
Bellator egretta streamer searobin 29 0.2 2 0.5
Raja eglanteria clearnose skate 29 16.4 18 4.1
Bregmaceros atlanticus antenna codlet 28 0 11 2.5
Narcine brasiliensis lesser electric ray 28 7.7 7 1.6
Canthigaster rostratus 28 0.3 9 2
Halichoeres bivittatus slippery dick 28 2.4 10 2.3
Apogon pseudomaculatus twospot cardinalfish 27 0.2 7 1.6
Rhinobatos lentiginosus Atlantic guitarfish 27 15.7 15 3.4
Ogcocephalus pantostictus spotted batfish 26 0.7 3 0.7
Holocentrus bullisi deepwater squirrelfish 26 1.1 3 0.7
Caulolatilus intermedius anchor tilefish 25 3 9 2
Anchoa mitchilli bay anchovy 25 0 11 2.5
Ogcocephalus corniger longnose batfish 25 0.3 15 3.4
Rhynchoconger flavus yellow conger 24 1.1 11 2.5
Apogon quadrisquamatus sawcheek cardinalfish 24 0.1 11 2.5
Achirus lineatus lined sole 24 0.5 8 1.8
Astrapogon alutus bronze cardinalfish 24 0.1 15 3.4
Calamus campechanus Campeche porgy 23 4.1 1 0.2
Pseudupeneus maculatus spotted goatfish 22 2.7 9 2
Rypticus bistrispinus freckled soapfish 21 0.3 16 3.6
Caranx crysos blue runner 21 2.8 11 2.5
Priacanthus arenatus bigeye 21 2.4 8 1.8
Symphurus urospilus spottail tonguefish 21 0.5 7 1.6
Urophycis regia spotted hake 20 0.8 6 1.4
Ophidion josephi crested cusk-eel 20 0.9 11 2.5
Holacanthus bermudensis blue angelfish 20 6.9 11 2.5
Citharichthys gymnorhinus anglefin whiff 20 0 10 2.3
Archosargus probatocephalus sheepshead 19 4.6 5 1.1
Antennarius ocellatus ocellated frogfish 18 1 15 3.4
Citharichthys cornutus horned whiff 18 0.1 4 0.9
24

Table 2. Species composition list (continued)
NUMBER OF
TOTAL NUMBER TOTAL WEIGHT TOWS WHERE % FREQUENCY
GENUS/SPECIES COMMON NAME CAUGHT CAUGHT (KG) CAUGHT OCCURRENCE
Rypticus maculatus whitespotted soapfish 18 0.7 10 2.3
Selar crumenophthalmus bigeye scad 18 2.1 9 2
Urophycis earlli Carolina hake 18 1.3 10 2.3
Pristigenys alta short bigeye 18 1.5 15 3.4
Ogcocephalidae batfishes 17 0.1 2 0.5
Hoplunnis macrura freckled pike-conger 17 0.1 11 2.5
Paralichthys lethostigma southern flounder 17 3.7 12 2.7
Hypoplectrus 17 0.4 5 1.1
Calamus penna sheepshead porgy 16 3.9 7 1.6
Sphyrna tiburo bonnethead 16 14.9 7 1.6
Bairdiella batabana blue croaker 16 1.1 2 0.5
Gymnachirus texae fringed sole 15 0.2 8 1.8
Sphyraena borealis northern sennet 14 1.2 4 0.9
Bagre marinus gafftopsail catfish 14 3 5 1.1
Stephanolepis setifer pygmy filefish 14 0.8 5 1.1
Selene vomer lookdown 14 1.1 8 1.8
Menticirrhus saxatilis northern kingfish 14 2.3 5 1.1
Canthigaster jamestyleri 12 0.2 5 1.1
Bothus ocellatus eyed flounder 11 0.3 7 1.6
Mustelus sinusmexicanus Gulf smoothhound 11 12.6 8 1.8
Rhinoptera bonasus cownose ray 11 65.6 7 1.6
Decodon puellaris red hogfish 11 0.4 6 1.4
Hemicaranx amblyrhynchus bluntnose jack 11 1.4 5 1.1
Ophichthus gomesii shrimp eel 10 1.2 3 0.7
Apogon aurolineatus bridle cardinalfish 10 0 4 0.9
Scomber japonicus chub mackerel 10 0.3 3 0.7
Cryptotomus roseus bluelip parrotfish 10 0.1 8 1.8
Myctophidae lanternfishes 10 0.1 1 0.2
Schultzea beta school bass 9 0 2 0.5
Carcharhinus acronotus blacknose shark 9 5.6 5 1.1
Foetorepus goodenbeani palefin dragonet 9 0.1 2 0.5
25

Table 2. Species composition list (continued)
NUMBER OF
TOTAL NUMBER TOTAL WEIGHT TOWS WHERE % FREQUENCY
GENUS/SPECIES COMMON NAME CAUGHT CAUGHT (KG) CAUGHT OCCURRENCE
Calamus bajonado jolthead porgy 9 5.4 5 1.1
Ophidion grayi blotched cusk-eel 9 0.8 6 1.4
Opsanus pardus leopard toadfish 8 0 5 1.1
Ogcocephalus cubifrons polka-dot batfish 8 3.5 7 1.6
Seriola dumerili greater amberjack 8 1.6 7 1.6
Squatina dumeril Atlantic angel shark 8 15.9 7 1.6
Ophidion cusk-eels 8 0.2 4 0.9
Serranus tortugarum chalk bass 8 0.1 2 0.5
Serraniculus pumilio pygmy sea bass 7 0 6 1.4
Carcharhinus limbatus blacktip shark 7 1.1 3 0.7
Antennarius striatus striated frogfish 7 0.2 6 1.4
Echeneis naucrates sharksucker 7 3.3 7 1.6
Serranus subligarius belted sandfish 7 0 4 0.9
Aluterus scriptus scrawled filefish 7 0.5 4 0.9
Mycteroperca phenax scamp 7 8.2 5 1.1
Ophidion selenops mooneye cusk-eel 6 0 2 0.5
Bathyanthias mexicanus yellowtail bass 6 0.1 2 0.5
Ophichthus puncticeps palespotted eel 6 0.9 4 0.9
Seriola zonata banded rudderfish 6 0.7 2 0.5
Gymnothorax nigromarginatus blackedge moray 6 0.5 4 0.9
Scomber colias 6 0.2 1 0.2
Mustelus canis smooth dogfish 6 3.1 5 1.1
Bregmaceros 6 0 2 0.5
Gobiesox strumosus skilletfish 6 0 5 1.1
Anisotremus virginicus porkfish 5 1 3 0.7
Rhynchoconger gracilior 5 0.2 2 0.5
Ariosoma balearicum bandtooth conger 5 0.2 3 0.7
Dorosoma petenense threadfin shad 5 0.1 4 0.9
Sphyraena guachancho guaguanche 5 0.9 4 0.9
Stephanolepis hispida planehead filefish 5 0 3 0.7
Dasyatis americana southern stingray 4 9.7 4 0.9
26

Table 2. Species composition list (continued)
NUMBER OF
TOTAL NUMBER TOTAL WEIGHT TOWS WHERE % FREQUENCY
GENUS/SPECIES COMMON NAME CAUGHT CAUGHT (KG) CAUGHT OCCURRENCE
Uroconger syringinus threadtail conger 4 0.1 2 0.5
Etropus 4 0 1 0.2
Caulolatilus cyanops blackline tilefish 4 0.4 3 0.7
Bollmannia boqueronensis white-eye goby 4 0 1 0.2
Lonchopisthus micrognathus swordtail jawfish 4 0 1 0.2
Bregmaceros cantori striped codlet 4 0 3 0.7
Diodon holocanthus balloonfish 4 0.9 3 0.7
Rachycentron canadum cobia 4 1.7 3 0.7
Opsanus beta gulf toadfish 4 0.5 3 0.7
Scorpaena spp. scorpionfishes 4 0 1 0.2
Peristedion gracile slender searobin 3 0.1 1 0.2
Histrio histrio sargassum frogfish 3 0 2 0.5
Gobiidae gobies 3 0 2 0.5
Syngnathus pelagicus sargassum pipefish 3 0 2 0.5
Chilomycterus antillarum web burrfish 3 0 2 0.5
Gymnachirus melas naked sole 3 0.1 3 0.7
Ariomma regulus spotted driftfish 3 0.4 2 0.5
Mycteroperca microlepis gag 3 1.1 3 0.7
Prognathodes aya bank butterflyfish 3 0.1 3 0.7
Astrapogon puncticulatus blackfin cardinalfish 3 0 3 0.7
Pomacentrus variabilis cocoa damselfish 3 0 2 0.5
Phaeoptyx conklini freckled cardinalfish 3 0 1 0.2
Fistularia petimba red cornetfish 3 0.5 3 0.7
Diplodus holbrooki spottail pinfish 3 0.3 2 0.5
Dasyatis sabina Atlantic stringray 2 0.6 2 0.5
Scomberomorus cavalla king mackerel 2 1.6 2 0.5
Parablennius marmoreus seaweed blenny 2 0 2 0.5
Ginglymostoma cirratum nurse shark 2 11.3 2 0.5
Paraconger caudilimbatus margintail conger 2 0.1 2 0.5
Foetorepus agassizii spotfin dragonet 2 0 1 0.2
Heteropriacanthus cruentatus glasseye snapper 2 0.1 2 0.5
27

Table 2. Species composition list (continued)
NUMBER OF
TOTAL NUMBER TOTAL WEIGHT TOWS WHERE % FREQUENCY
GENUS/SPECIES COMMON NAME CAUGHT CAUGHT (KG) CAUGHT OCCURRENCE
Acanthostracion polygonius honeycomb cowfish 2 0.7 2 0.5
Lophius americanus goosefish 2 0 1 0.2
Symphurus minor largescale tonguefish 2 0 2 0.5
Gobiosoma macrodon tiger goby 2 0 1 0.2
Gymnura micrura smooth butterfly ray 2 0.6 2 0.5
Hypoplectrus unicolor butter hamlet 2 0.1 1 0.2
Menticirrhus littoralis gulf kingfish 2 0.3 2 0.5
Myliobatis freminvillii Bullnose ray 2 7.7 1 0.2
Mustelus smooth hound sharks 2 0.7 2 0.5
Lophius 2 0.2 1 0.2
Oligoplites saurus leatherjack 2 0.2 2 0.5
Caranx hippos crevalle jack 2 8.9 2 0.5
Cynoscion nebulosus spotted seatrout 2 0.6 2 0.5
Trachinotus carolinus Florida pompano 2 0.6 2 0.5
Hemanthias aureorubens streamer bass 2 0 2 0.5
Urolophus jamaicencis 2 0.8 2 0.5
Ogcocephalus nasutus shortnose batfish 2 0 1 0.2
Gymnothorax kolpos blacktail moray 2 0.7 2 0.5
Gobiosoma xanthiprora yellowprow goby 1 0 1 0.2
Trinectes maculatus hogchoker 1 0 1 0.2
Chromis scotti purple reeffish 1 0 1 0.2
Paralichthys southern flounders 1 0 1 0.2
Pronotogrammus martinicensis roughtongue bass 1 0 1 0.2
Conger oceanicus conger eel 1 0 1 0.2
Hyporthodus flavolimbatus 1 0 1 0.2
Gobiesox punctulatus stippled clingfish 1 0 1 0.2
Diplogrammus pauciradiatus spotted dragonet 1 0 1 0.2
Holocentrus adscensionis squirrelfish 1 0.3 1 0.2
Lagocephalus rabbitfishes 1 0 1 0.2
Gymnothorax moringa spotted moray 1 0.7 1 0.2
Epinephelus itajara goliath grouper 1 81.1 1 0.2
28
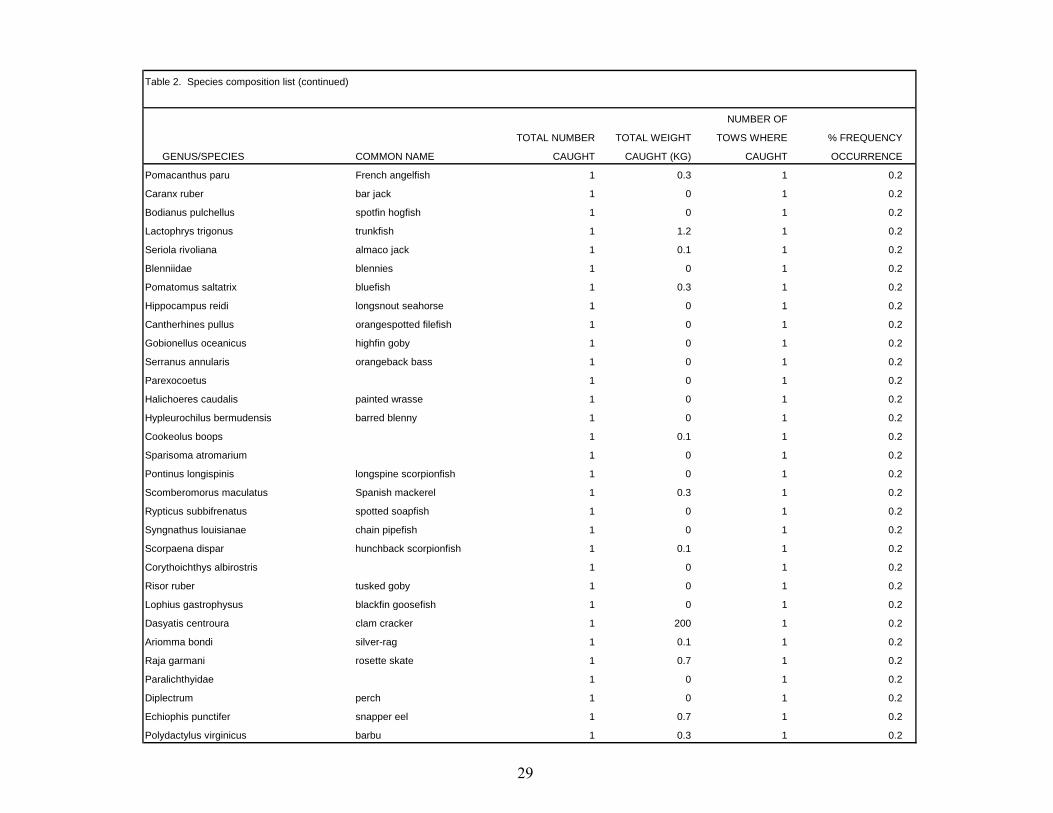
Table 2. Species composition list (continued)
NUMBER OF
TOTAL NUMBER TOTAL WEIGHT TOWS WHERE % FREQUENCY
GENUS/SPECIES COMMON NAME CAUGHT CAUGHT (KG) CAUGHT OCCURRENCE
Pomacanthus paru French angelfish 1 0.3 1 0.2
Caranx ruber bar jack 1 0 1 0.2
Bodianus pulchellus spotfin hogfish 1 0 1 0.2
Lactophrys trigonus trunkfish 1 1.2 1 0.2
Seriola rivoliana almaco jack 1 0.1 1 0.2
Blenniidae blennies 1 0 1 0.2
Pomatomus saltatrix bluefish 1 0.3 1 0.2
Hippocampus reidi longsnout seahorse 1 0 1 0.2
Cantherhines pullus orangespotted filefish 1 0 1 0.2
Gobionellus oceanicus highfin goby 1 0 1 0.2
Serranus annularis orangeback bass 1 0 1 0.2
Parexocoetus 1 0 1 0.2
Halichoeres caudalis painted wrasse 1 0 1 0.2
Hypleurochilus bermudensis barred blenny 1 0 1 0.2
Cookeolus boops 1 0.1 1 0.2
Sparisoma atromarium 1 0 1 0.2
Pontinus longispinis longspine scorpionfish 1 0 1 0.2
Scomberomorus maculatus Spanish mackerel 1 0.3 1 0.2
Rypticus subbifrenatus spotted soapfish 1 0 1 0.2
Syngnathus louisianae chain pipefish 1 0 1 0.2
Scorpaena dispar hunchback scorpionfish 1 0.1 1 0.2
Corythoichthys albirostris 1 0 1 0.2
Risor ruber tusked goby 1 0 1 0.2
Lophius gastrophysus blackfin goosefish 1 0 1 0.2
Dasyatis centroura clam cracker 1 200 1 0.2
Ariomma bondi silver-rag 1 0.1 1 0.2
Raja garmani rosette skate 1 0.7 1 0.2
Paralichthyidae 1 0 1 0.2
Diplectrum perch 1 0 1 0.2
Echiophis punctifer snapper eel 1 0.7 1 0.2
Polydactylus virginicus barbu 1 0.3 1 0.2
29

Table 2. Species composition list (continued)
NUMBER OF
TOTAL NUMBER TOTAL WEIGHT TOWS WHERE % FREQUENCY
GENUS/SPECIES COMMON NAME CAUGHT CAUGHT (KG) CAUGHT OCCURRENCE
Exocoetidae flyingfishes 1 0 1 0.2
Syngnathus springeri bull pipefish 1 0 1 0.2
Hippocampus zosterae pygmy seahorse 1 0 1 0.2
Hypsoblennius hentzi 1 0 1 0.2
Crustaceans
Callinectes similis lesser blue crab 19494 136.9 157 35.4
Farfantepenaeus aztecus brown shrimp 18139 249.9 218 49.2
Rimapenaeus constrictus roughneck shrimp 7269 25.2 42 9.5
Sicyonia brevirostris brown rock shrimp 5849 66.7 128 28.9
Rimapenaeus similis roughback shrimp 5634 26.3 98 22.1
Squilla empusa mantis shrimp 4139 36.1 107 24.2
Farfantepenaeus duorarum pink shrimp 3748 70.9 105 23.7
Portunus gibbesii irridescent swimming crab 3602 15.8 123 27.8
Portunus spinicarpus longspine swimming crab 3395 16.6 137 30.9
Sicyonia dorsalis lesser rock shrimp 2019 4.4 48 10.8
Litopenaeus setiferus white shrimp 1173 51.2 81 18.3
Parapenaeus politus deepwater rose shrimp 1147 3.1 20 4.5
Solenocera vioscai humpback shrimp 1141 4.8 47 10.6
Squilla chydaea mantis shrimp 807 4.5 63 14.2
Portunus spinimanus blotched swimming crab 610 25.9 77 17.4
Metapenaeopsis goodei Caribbean velvet shrimp 442 0.9 30 6.8
Anasimus latus stilt spider crab 392 1.9 61 13.8
Euryalidae 370 1.1 3 0.7
Scyllarus chacei chace slipper lobster 260 0.8 49 11.1
Solenocera atlantidis dwarf humpback shrimp 230 0.3 31 7
Munida forceps squat lobster 223 0.1 4 0.9
Raninoides louisianensis gulf frog crab 213 1.4 33 7.4
Callinectes sapidus blue crab 207 17.1 52 11.7
Munida irrasa 202 0 2 0.5
30

Table 2. Species composition list (continued)
NUMBER OF
TOTAL NUMBER TOTAL WEIGHT TOWS WHERE % FREQUENCY
GENUS/SPECIES COMMON NAME CAUGHT CAUGHT (KG) CAUGHT OCCURRENCE
Portunus sayi sargassum swimming crab 153 0.4 39 8.8
Stenorhynchus seticornis yellowline arrow crab 141 0.3 62 14
Calappa sulcata yellow box crab 128 22 57 12.9
Leiolambrus nitidus white elbow crab 125 0.3 37 8.4
Ovalipes floridanus Florida lady crab 111 0.8 32 7.2
Scyllarides nodifer ridged slipper lobster 96 29 38 8.6
Platylambrus granulata bladetooth elbow crab 95 0.2 40 9
Munida pusilla 93 0 5 1.1
Gibbesia neglecta mantis shrimp 87 0.8 13 2.9
Plesionika longicauda pandalid shrimp 64 0.1 7 1.6
Cryptodromiopsis antillensis hairy sponge crab 61 0.2 41 9.3
Mesopenaeus tropicalis salmon shrimp 59 0.2 13 2.9
Hepatus epheliticus calico crab 59 2 27 6.1
Pseudorhombila quadridentata flecked squareback crab 55 0.4 17 3.8
Stenocionops furcatus furcatus furcate crab 54 2.8 38 8.6
Leander tenuicornis brown glass shrimp 48 0 6 1.4
Paguristes triangulatus hermit crab 43 0.1 8 1.8
Podochela sidneyi shortfinger neck crab 43 0.1 23 5.2
Sicyonia burkenroadi spiny rock shrimp 41 0.1 10 2.3
Mithrax hispidus coral clinging crab 40 0.2 13 2.9
Mithrax pleuracanthus shaggy clinging crab 39 0.1 17 3.8
Pilumnus sayi spineback hairy crab 39 0.1 17 3.8
Persephona crinita pink purse crab 35 0.1 19 4.3
Metoporhaphis calcarata false arrow crab 33 0 9 2
Squilla rugosa 31 0.2 10 2.3
Libinia dubia longnose spider crab 31 0.3 16 3.6
Speocarcinus lobatus gulf squareback crab 31 0.1 15 3.4
Euphrosynoplax clausa craggy bathyal crab 26 0.2 13 2.9
Portunus ordwayii 26 0.3 13 2.9
Libinia emarginata portly spider crab 25 1.7 15 3.4
Pyromaia cuspidata dartnose pear crab 21 0.1 3 0.7
31

Table 2. Species composition list (continued)
NUMBER OF
TOTAL NUMBER TOTAL WEIGHT TOWS WHERE % FREQUENCY
GENUS/SPECIES COMMON NAME CAUGHT CAUGHT (KG) CAUGHT OCCURRENCE
Persephona mediterranea mottled purse crab 20 0.1 16 3.6
Myropsis quinquespinosa fivespine purse crab 19 0.1 11 2.5
Stenocionops spinimanus prickly spider crab 18 2 13 2.9
Calappa flammea flame box crab 18 3.7 12 2.7
Squilla deceptrix 18 0 6 1.4
Dardanus insignis red brocade hermit 17 0.2 12 2.7
Petrolisthes galathinus banded porcelain crab 17 0 10 2.3
Stenorhynchus 17 0 11 2.5
Hypoconcha arcuata granulate shellback crab 15 0 7 1.6
Pagurus pollicaris flatclaw hermit crab 14 0.3 11 2.5
Macrocoeloma trispinosum spongy decorator crab 14 0.1 9 2
Portunus floridanus 13 0.1 2 0.5
Petrochirus diogenes giant hermit crab 13 0.5 11 2.5
Lysmata wurdemanni peppermint shrimp 13 0 5 1.1
Porcellana sayana spotted porcelain crab 12 0 6 1.4
Paguristes spp. hermit crabs 12 0 7 1.6
Podochela lamelligera neck crab 12 0 7 1.6
Arenaeus cribrarius speckled swimming crab 11 0.3 6 1.4
Xiphopenaeus kroyeri seabob 10 0 2 0.5
Leiolambrus nitidus white elbow crab 10 0 4 0.9
Manucomplanus ungulatus 10 0 6 1.4
Lobopilumnus agassizii areolated hairy crab 10 0 8 1.8
Synalpheus 9 0 8 1.8
Collodes robustus spider crab 9 0 5 1.1
Menippe adina Gulf stone crab 9 0 3 0.7
Pilumnus floridanus plumed hairy crab 8 0 8 1.8
Parthenope agonus 8 0 7 1.6
Menippe mercenaria Florida stone crab 7 1 4 0.9
Macrocoeloma 7 0 5 1.1
Sicyonia typica kinglet rock shrimp 7 0 3 0.7
Solenocera spp. humpback shrimps 7 0 2 0.5
32

Table 2. Species composition list (continued)
NUMBER OF
TOTAL NUMBER TOTAL WEIGHT TOWS WHERE % FREQUENCY
GENUS/SPECIES COMMON NAME CAUGHT CAUGHT (KG) CAUGHT OCCURRENCE
Majidae spider crabs 7 0 3 0.7
Tozeuma serratum serrate arrow shrimp 6 0 2 0.5
Collodes trispinosus 6 0 5 1.1
Acanthilia intermedia granulose purse crab 6 0 4 0.9
Mithrax acuticornis sharphorn clinging crab 6 0.1 4 0.9
Paguristes sericeus blue-eyed hermit 6 0 6 1.4
Dromidia 6 0 3 0.7
Iliacantha subglobosa longfinger purse crab 5 0 4 0.9
Iliacantha liodactylus purse crab 5 0 3 0.7
Xanthidae mud crabs 5 0 2 0.5
Pilumnus dasypodus shortspine hairy crab 5 0 4 0.9
Stenopus scutellatus golden coral shrimp 5 0 5 1.1
Portunus depressifrons flatface swimming crab 4 0.1 3 0.7
Pseudomedaeus agassizii rough rubble crab 4 0 4 0.9
Glyptoxanthus erosus eroded mud crab 4 0.2 4 0.9
Callinectes ornatus shelligs 4 0.1 4 0.9
Scyllarus depressus scaled slipper lobster 4 0 3 0.7
Pinnotheridae pea crabs 4 0 4 0.9
Pagurus impressus dimpled hermit 3 0 3 0.7
Squilla spp. mantis shrimps 3 0 2 0.5
Raninoides loevis furrowed frog crab 3 0 1 0.2
Porcellana sigsbeiana striped porcelain crab 3 0 2 0.5
Axiopsis hirsutimana lobster shrimps 3 0 2 0.5
Palicus alternata 3 0 3 0.7
Hypoconcha spinosissima spiny shellback crab 3 0 3 0.7
Lysmata 3 0 3 0.7
Sicyonia laevigata rock shrimp 3 0 2 0.5
Carpoporus papulosus narrowfront rubble crab 3 0 3 0.7
Alpheus formosus striped snapping shrimp 3 0 1 0.2
Parthenope elbow crabs 3 0 1 0.2
Alpheus snapping shirmps 3 0 2 0.5
33
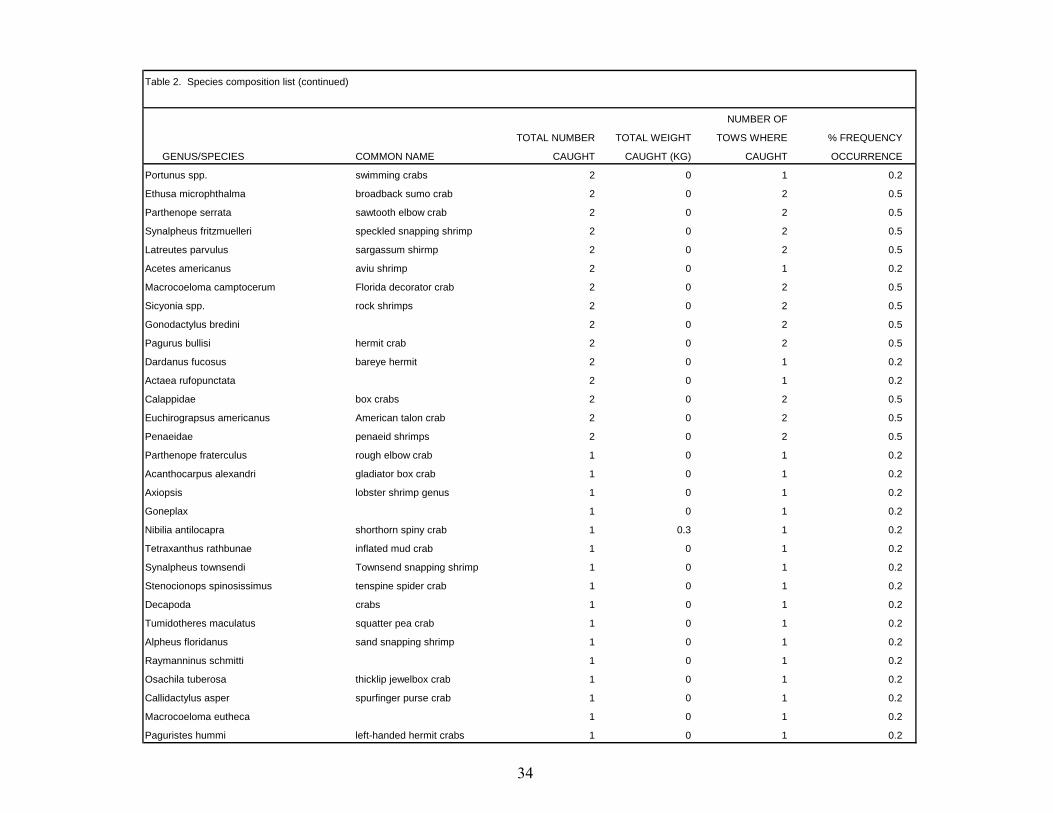
Table 2. Species composition list (continued)
NUMBER OF
TOTAL NUMBER TOTAL WEIGHT TOWS WHERE % FREQUENCY
GENUS/SPECIES COMMON NAME CAUGHT CAUGHT (KG) CAUGHT OCCURRENCE
Portunus spp. swimming crabs 2 0 1 0.2
Ethusa microphthalma broadback sumo crab 2 0 2 0.5
Parthenope serrata sawtooth elbow crab 2 0 2 0.5
Synalpheus fritzmuelleri speckled snapping shrimp 2 0 2 0.5
Latreutes parvulus sargassum shirmp 2 0 2 0.5
Acetes americanus aviu shrimp 2 0 1 0.2
Macrocoeloma camptocerum Florida decorator crab 2 0 2 0.5
Sicyonia spp. rock shrimps 2 0 2 0.5
Gonodactylus bredini 2 0 2 0.5
Pagurus bullisi hermit crab 2 0 2 0.5
Dardanus fucosus bareye hermit 2 0 1 0.2
Actaea rufopunctata 2 0 1 0.2
Calappidae box crabs 2 0 2 0.5
Euchirograpsus americanus American talon crab 2 0 2 0.5
Penaeidae penaeid shrimps 2 0 2 0.5
Parthenope fraterculus rough elbow crab 1 0 1 0.2
Acanthocarpus alexandri gladiator box crab 1 0 1 0.2
Axiopsis lobster shrimp genus 1 0 1 0.2
Goneplax 1 0 1 0.2
Nibilia antilocapra shorthorn spiny crab 1 0.3 1 0.2
Tetraxanthus rathbunae inflated mud crab 1 0 1 0.2
Synalpheus townsendi Townsend snapping shrimp 1 0 1 0.2
Stenocionops spinosissimus tenspine spider crab 1 0 1 0.2
Decapoda crabs 1 0 1 0.2
Tumidotheres maculatus squatter pea crab 1 0 1 0.2
Alpheus floridanus sand snapping shrimp 1 0 1 0.2
Raymanninus schmitti 1 0 1 0.2
Osachila tuberosa thicklip jewelbox crab 1 0 1 0.2
Callidactylus asper spurfinger purse crab 1 0 1 0.2
Macrocoeloma eutheca 1 0 1 0.2
Paguristes hummi left-handed hermit crabs 1 0 1 0.2
34

Table 2. Species composition list (continued)
NUMBER OF
TOTAL NUMBER TOTAL WEIGHT TOWS WHERE % FREQUENCY
GENUS/SPECIES COMMON NAME CAUGHT CAUGHT (KG) CAUGHT OCCURRENCE
Parthenope pourtalesii spinous elbow crab 1 0 1 0.2
Podochela gracilipes unicorn neck crab 1 0 1 0.2
Dardanus 1 0 1 0.2
Alpheidae snapping shrimps 1 0 1 0.2
Alpheus heterochelis 1 0 1 0.2
Stenopus 1 0 1 0.2
Palicus faxoni finned stilt crab 1 0 1 0.2
Synalpheus longicarpus 1 0 1 0.2
Galathea rostrata 1 0 1 0.2
Meiosquilla quadridens 1 0 1 0.2
Phimochirus holthuisi red-striped hermit 1 0 1 0.2
Euryplax nitida glabrous broadface crab 1 0 1 0.2
Others
Amusium papyraceum paper scallop 13070 136.8 77 17.4
Loligo plei arrow squid 12326 160 216 48.8
Loligo pealeii longfin squid 4736 91.1 107 24.2
Lolliguncula brevis Atlantic brief squid 2806 25.4 120 27.1
Argopecten gibbus calico scallop 1753 12.9 18 4.1
Pitar cordatus Schwengel's pitar 517 11 35 7.9
Anadara baughmani Baughman's ark 231 3.5 17 3.8
Loligo spp. squids 97 0.2 6 1.4
Macoma brevifrons short macoma 58 0.5 6 1.4
Polystira albida white giant turris 57 0.8 15 3.4
Octopus joubini Atlantic pygmy octopus 53 4 36 8.1
Nassarius acutus sharp nassa 50 0.1 1 0.2
Semirossia tenera lesser shining bobtail 46 0.5 14 3.2
Aplysia brasiliana mottled seahare 40 2 13 2.9
Lirophora clenchi Clench venus 36 0.3 14 3.2
Arca zebra turkey wing 31 3.1 5 1.1
35

Table 2. Species composition list (continued)
NUMBER OF
TOTAL NUMBER TOTAL WEIGHT TOWS WHERE % FREQUENCY
GENUS/SPECIES COMMON NAME CAUGHT CAUGHT (KG) CAUGHT OCCURRENCE
Aplysia morio sooty seahare 25 1.9 14 3.2
Octopus vulgaris common Atlantic octopus 17 1.6 13 2.9
Ficus communis Atlantic figsnail 17 1.4 9 2
Conus austini cone shell 16 0.2 4 0.9
Sconsia striata royal bonnet 13 0.2 6 1.4
Laevicardium mortoni yellow eggcockle 12 0.2 4 0.9
Armina 9 0 1 0.2
Narcissia trigonaria 9 0.7 6 1.4
Atrina rigida stiff penshell 8 4.1 5 1.1
Pleurobranchus slugs 7 1.1 5 1.1
Laevicardium laevigatum egg cockle 6 0.3 4 0.9
Evola bivalves 6 0.1 3 0.7
Distorsio mcgintyi 5 0.1 4 0.9
Neverita duplicata shark eye 5 0.1 4 0.9
Aequipecten muscosus rough scallop 5 0.1 5 1.1
Tonna galea giant tun 5 1 4 0.9
Nudibranchia nudibranchs 5 0 1 0.2
Euvola raveneli Ravenel's scallop 4 0 4 0.9
Anadara ovalis blood ark 4 0 4 0.9
Cassis tuberosa Caribbean helmet 4 15 4 0.9
Semirossia equalis greater shining bobtail 4 0 2 0.5
Aplysia opistobranchs 4 0.3 2 0.5
Chama macerophylla leafy jewelbox 4 0.7 3 0.7
Nodipecten 4 0.6 4 0.9
Distorsio clathrata Atlantic distorsio 4 0 4 0.9
Calliostoma 3 0 3 0.7
Turritella exoleta eastern turretsnail 3 0 2 0.5
Neverita 3 0 3 0.7
Agriopoma texasianum Texas venus 3 0 2 0.5
Cypraea 3 0 1 0.2
Pecten laurenti 3 0 2 0.5
36

Table 2. Species composition list (continued)
NUMBER OF
TOTAL NUMBER TOTAL WEIGHT TOWS WHERE % FREQUENCY
GENUS/SPECIES COMMON NAME CAUGHT CAUGHT (KG) CAUGHT OCCURRENCE
Astrea phoebia 3 0 2 0.5
Busycon plagosus 2 4.6 2 0.5
Aplysia willcoxi 2 0 2 0.5
Atrina spp. penshells 2 0 1 0.2
Chlamys benedicti Benedict scallop 2 0 1 0.2
Busycon sinistrum lightning whelk 2 0.2 2 0.5
Stramonita rocksnails 2 0 1 0.2
Anadara floridana cut-ribbed ark 2 0 1 0.2
Macrocallista maculata calico clam 2 0.1 2 0.5
Stramonita haemastoma rocksnail 2 0 1 0.2
Fasciolaria lilium banded tulip 2 0.1 2 0.5
Cypraea cervus atlantic deer cowrie 2 0.2 2 0.5
Laevicardium pictum painted eggcockle 2 0 2 0.5
Strombus alatus Florida fighting conch 2 0.2 1 0.2
Hiatella arctica Arctic hiatella 2 0 1 0.2
Cerithium atratum dark cerith 2 0 2 0.5
Sphenia fragilis 2 0 1 0.2
Cypraea cinera 2 0 2 0.5
Chicoreus florifer-dilectus 2 0 2 0.5
Cassis madagascariensis cameo helmet 2 0.2 2 0.5
Ctenoides 2 0 1 0.2
Oliva fulgurator 2 0 2 0.5
Cymatium 1 0 1 0.2
Hexaplex fulvescens giant eastern murex 1 0 1 0.2
Murex 1 0.2 1 0.2
Noetia ponderosa ponderous ark 1 0 1 0.2
Natica canrena colorful moonsnail 1 0 1 0.2
Turritella acropora boring turretsnail 1 0 1 0.2
Aplysia badistes 1 0.2 1 0.2
Cantharus cancellarius cancellate cantharus 1 0 1 0.2
Fasciolhunter mollusks 1 0 1 0.2
37

Table 2. Species composition list (continued)
NUMBER OF
TOTAL NUMBER TOTAL WEIGHT TOWS WHERE % FREQUENCY
GENUS/SPECIES COMMON NAME CAUGHT CAUGHT (KG) CAUGHT OCCURRENCE
Gastropoda snails 1 5.2 1 0.2
Tugurium caribaeum 1 0 1 0.2
Pleuroploca gigantea horse conch 1 4 1 0.2
Atrina serrata sawtooth penshell 1 0 1 0.2
Pectinidae bivalves 1 0.2 1 0.2
Cassis 1 0 1 0.2
Semirossia mollusks 1 0 1 0.2
Chione latilirata imperial venus 1 0 1 0.2
Trachycardium 1 0 1 0.2
Hypselodoris edenticulata florida regal doris 1 0 1 0.2
Cypraea spurca 1 0 1 0.2
Octopus 1 0 1 0.2
Chama congregata corrugate jewelbox 1 0.3 1 0.2
Xenophora conchyliophora American carriersnail 1 0.1 1 0.2
Cyphoma 1 0 1 0.2
Limaria 1 0 1 0.2
Busycon lyonsi 1 3 1 0.2
Cerodrillia 1 0 1 0.2
Spondylus americanus Atlantic thorny oyster 1 0 1 0.2
Cypraeidae 1 0 1 0.2
Ostrea equestris crested oyster 1 0 1 0.2
Fusinus eucosmius apricot spindle 1 0 1 0.2
Arcinella cornuta Florida spiny jewelbox 1 0 1 0.2
Felimare 1 0 1 0.2
38

Table 3. 2014 Fall Shrimp/Groundfish Survey species composition list, 404 trawl stations, for those vessels that used either a 40-ft or 20-ft trawl.
Species with a total weight of less than 0.0227 kg (0.05 lb) are indicated on the table as 0.0 kg.
NUMBER OF
TOTAL NUMBER TOTAL WEIGHT TOWS WHERE % FREQUENCY
GENUS/SPECIES COMMON NAME CAUGHT CAUGHT (KG) CAUGHT OCCURRENCE
Finfishes
Micropogonias undulatus Atlantic croaker 91221 3666.2 199 49.3
Chloroscombrus chrysurus Atlantic bumper 22161 725.5 120 29.7
Stenotomus caprinus longspine porgy 22118 600.7 153 37.9
Leiostomus xanthurus spot 10735 930.7 123 30.4
Peprilus burti gulf butterfish 6252 302.9 118 29.2
Trachurus lathami rough scad 5249 180.5 93 23
Lagodon rhomboides pinfish 4872 331.6 162 40.1
Lutjanus synagris lane snapper 4824 592.3 151 37.4
Syacium papillosum dusky flounder 4585 255.6 134 33.2
Serranus atrobranchus blackear bass 3916 37.6 71 17.6
Haemulon aurolineatum tomtate 3865 217.9 89 22
Syacium gunteri shoal flounder 3805 64.7 136 33.7
Prionotus longispinosus bigeye searobin 3623 91.5 139 34.4
Synodus foetens inshore lizardfish 2845 308.1 238 58.9
Cynoscion nothus silver seatrout 2575 113.5 119 29.5
Mullus auratus red goatfish 2438 144.4 46 11.4
Rhomboplites aurorubens vermilion snapper 2331 91.3 70 17.3
Lutjanus campechanus red snapper 2300 115.6 154 38.1
Centropristis philadelphica rock sea bass 2243 75.7 127 31.4
Diplectrum formosum sand perch 2156 137.2 128 31.7
Larimus fasciatus banded drum 2072 110.1 68 16.8
Bellator militaris horned searobin 2044 40.2 64 15.8
Scorpaena calcarata smoothhead scorpionfish 1718 27.2 49 12.1
Decapterus punctatus round scad 1608 24.3 56 13.9
Anchoa hepsetus striped anchovy 1605 21.3 41 10.1
Upeneus parvus dwarf goatfish 1543 58.7 64 15.8
Stephanolepis hispida 1529 53.4 95 23.5
39

Table 3. Species composition list (continued)
NUMBER OF
TOTAL NUMBER TOTAL WEIGHT TOWS WHERE % FREQUENCY
GENUS/SPECIES COMMON NAME CAUGHT CAUGHT (KG) CAUGHT OCCURRENCE
Saurida brasiliensis largescale lizardfish 1516 6.7 67 16.6
Pristipomoides aquilonaris wenchman 1456 76.9 51 12.6
Harengula jaguana scaled sardine 1259 31.7 49 12.1
Ariopsis felis hardhead catfish 1221 125 64 15.8
Cynoscion arenarius sand seatrout 1167 121.4 112 27.7
Synodus poeyi offshore lizardfish 1088 8.5 72 17.8
Centropristis ocyurus bank sea bass 991 51.3 61 15.1
Steindachneria argentea luminous hake 971 3 2 0.5
Scorpaena brasiliensis barbfish 961 41.8 76 18.8
Sphoeroides dorsalis marbled puffer 959 40.6 84 20.8
Prionotus stearnsi shortwing searobin 951 11.7 35 8.7
Saurida normani shortjaw lizardfish 934 87.2 25 6.2
Selene setapinnis Atlantic moonfish 920 48.5 87 21.5
Trichiurus lepturus Atlantic cutlassfish 885 34.8 62 15.3
Haemulon plumierii white grunt 880 176.2 21 5.2
Diplectrum bivittatum dwarf sand perch 874 13.7 67 16.6
Calamus proridens littlehead porgy 851 158.8 67 16.6
Eucinostomus gula silver jenny 841 31 45 11.1
Sphoeroides parvus least puffer 793 4 76 18.8
Synodus macrostigmus 765 57.2 61 15.1
Eucinostomus mojarras 720 25.7 4 1
Trachinocephalus myops snakefish 716 47.1 77 19.1
Stellifer lanceolatus star drum 705 7.7 44 10.9
Scorpaena agassizii longfin scorpionfish 701 26.2 31 7.7
Chaetodipterus faber Atlantic spadefish 675 26.5 100 24.8
Lepophidium jeannae mottled cusk-eel 655 25.9 33 8.2
Trichopsetta ventralis sash flounder 598 12.8 26 6.4
Prionotus rubio blackwing searobin 555 24.8 33 8.2
Anchoa mitchilli bay anchovy 528 0.5 16 4
Orthopristis chrysoptera pigfish 513 50.3 52 12.9
Lepophidium brevibarbe blackedge cusk-eel 507 18.1 54 13.4
40

Table 3. Species composition list (continued)
NUMBER OF
TOTAL NUMBER TOTAL WEIGHT TOWS WHERE % FREQUENCY
GENUS/SPECIES COMMON NAME CAUGHT CAUGHT (KG) CAUGHT OCCURRENCE
Acanthostracion quadricornis 489 78.6 88 21.8
Sphoeroides spengleri bandtail puffer 483 17.8 57 14.1
Cyclopsetta chittendeni Mexican flounder 477 41.9 88 21.8
Etropus crossotus fringed flounder 419 5.6 88 21.8
Sardinella aurita Spanish sardine 406 9.3 34 8.4
Bothus robinsi twospot flounder 397 10.2 61 15.1
Prionotus paralatus Mexican searobin 380 12.4 22 5.4
Balistes capriscus gray triggerfish 371 31 81 20
Prionotus alatus spiny searobin 363 12.1 36 8.9
Prionotus roseus bluespotted searobin 350 11.1 56 13.9
Opisthonema oglinum Atlantic thread herring 340 19.8 36 8.9
Citharichthys spilopterus bay whiff 338 5.1 56 13.9
Serranus phoebe tattler 321 12.1 37 9.2
Equetus lanceolatus jackknife fish 318 23.4 46 11.4
Halieutichthys aculeatus pancake batfish 311 2.9 61 15.1
Bagre marinus gafftopsail catfish 310 19.6 32 7.9
Eucinostomus argenteus spotfin mojarra 286 4.5 13 3.2
Anchoviella perfasciata Poey's anchovy 284 3.6 2 0.5
Eucinostomus harengulus tidewater mojarra 277 11.9 23 5.7
Prionotus scitulus leopard searobin 263 8.1 24 5.9
Halieutichthys 256 1.5 46 11.4
Brevoortia patronus gulf menhaden 242 11.9 23 5.7
Calamus arctifrons grass porgy 230 37.2 15 3.7
Aluterus schoepfii orange filefish 226 68.1 41 10.1
Serranus notospilus saddle bass 202 0.8 25 6.2
Ophidion holbrookii bank cusk-eel 195 16.9 34 8.4
Urophycis regia spotted hake 191 12.9 11 2.7
Pterois volitans lion fish 190 52.5 38 9.4
Monacanthus ciliatus fringed filefish 189 3 51 12.6
Prionotus ophryas bandtail searobin 173 7 65 16.1
Symphurus diomedeanus spottedfin tonguefish 168 4.9 38 9.4
41

Table 3. Species composition list (continued)
NUMBER OF
TOTAL NUMBER TOTAL WEIGHT TOWS WHERE % FREQUENCY
GENUS/SPECIES COMMON NAME CAUGHT CAUGHT (KG) CAUGHT OCCURRENCE
Haemulon striatum striped grunt 168 7.7 5 1.2
Synodus intermedius sand diver 143 13.8 36 8.9
Porichthys plectrodon Atlantic midshipman 142 2.4 56 13.9
Lutjanus griseus grey snapper 137 45.3 38 9.4
Apogon affinis bigtooth cardinalfish 126 1.4 14 3.5
Caranx crysos blue runner 124 8 32 7.9
Pagrus pagrus red porgy 121 9.9 26 6.4
Ogcocephalus declivirostris slantbrow batfish 121 2.4 31 7.7
Diplodus holbrooki spottail pinfish 117 11.6 2 0.5
Gymnachirus texae fringed sole 110 1 38 9.4
Ancylopsetta ommata ocellated flounder 105 15.8 45 11.1
Prionotus martis barred searobin 102 4.1 19 4.7
Lagocephalus laevigatus smooth puffer 101 4.7 40 9.9
Ogcocephalidae batfishes 101 0.6 8 2
Kathetostoma albigutta lancer stargazer 100 4.7 38 9.4
Pristigenys alta short bigeye 100 1.3 31 7.7
Cyclopsetta fimbriata spotfin flounder 98 6 45 11.1
Peprilus paru harvestfish 95 4.8 28 6.9
Urophycis floridana southern hake 93 10.5 17 4.2
Etropus rimosus gray flounder 87 1.1 10 2.5
Gymnothorax saxicola honeycomb moray 84 8.4 38 9.4
Chaetodon ocellatus spotfin butterflyfish 84 6.7 36 8.9
Lachnolaimus maximus hogfish 83 24.7 10 2.5
Ophidion josephi crested cusk-eel 80 2.9 24 5.9
Centropristis striatus black sea bass 78 8.2 4 1
Neomerinthe hemingwayi spinycheek scorpionfish 77 4.1 8 2
Serranus tortugarum chalk bass 77 0.8 4 1
Pareques umbrosus cubbyu 74 4.5 29 7.2
Prionotus tribulus bighead searobin 73 7.3 24 5.9
Epinephelus morio red grouper 72 65.1 27 6.7
Ogcocephalus parvus roughback batfish 71 0.6 29 7.2
42

Table 3. Species composition list (continued)
NUMBER OF
TOTAL NUMBER TOTAL WEIGHT TOWS WHERE % FREQUENCY
GENUS/SPECIES COMMON NAME CAUGHT CAUGHT (KG) CAUGHT OCCURRENCE
Schultzea beta school bass 69 1 3 0.7
Ancylopsetta dilecta three-eye flounder 67 4.1 21 5.2
Ariomma regulus spotted driftfish 66 2.6 14 3.5
Cynoscion spp. seatrouts 64 0.2 3 0.7
Nicholsina usta emerald parrotfish 63 7.7 18 4.5
Symphurus civitatium offshore tonguefish 62 1.2 16 4
Engyophrys senta spiny flounder 61 0.2 15 3.7
Citharichthys macrops spotted whiff 58 2.2 25 6.2
Gastropsetta frontalis shrimp flounder 57 5.2 27 6.7
Apogon pseudomaculatus twospot cardinalfish 55 0.3 15 3.7
Pseudupeneus maculatus spotted goatfish 51 4.7 10 2.5
Brotula barbata bearded brotula 51 3.7 20 5
Menticirrhus americanus southern kingfish 50 6.2 27 6.7
Calamus nodosus knobbed porgy 48 9.8 14 3.5
Ophidion beani longnose cusk-eel 47 3 13 3.2
Bollmannia communis ragged goby 47 0.2 18 4.5
Symphurus plagiusa blackcheek tonguefish 40 0.6 26 6.4
Urophycis cirrata gulf hake 39 1.5 8 2
Sphyrna tiburo bonnethead 38 35.4 19 4.7
Rhynchoconger flavus yellow conger 38 3.1 14 3.5
Antennarius radiosus singlespot frogfish 34 0.3 16 4
Ocyurus chrysurus yellowtail snapper 32 3.7 5 1.2
Lepophidium spp. cusk-eels 30 0.3 7 1.7
Chromis enchrysura yellowtail reeffish 28 0.4 16 4
Holocentrus bullisi deepwater squirrelfish 28 0.8 6 1.5
Raja texana roundel skate 27 9 21 5.2
Chaetodon sedentarius reef butterflyfish 27 1.1 13 3.2
Decodon puellaris red hogfish 26 1.3 11 2.7
Raja eglanteria clearnose skate 26 11.4 20 5
Hemipteronotus novacula pearly razorfish 26 1.6 8 2
Etrumeus teres round herring 26 0.5 6 1.5
43

Table 3. Species composition list (continued)
NUMBER OF
TOTAL NUMBER TOTAL WEIGHT TOWS WHERE % FREQUENCY
GENUS/SPECIES COMMON NAME CAUGHT CAUGHT (KG) CAUGHT OCCURRENCE
Hippocampus erectus lined seahorse 25 0.2 21 5.2
Dasyatis sabina Atlantic stringray 24 15.7 10 2.5
Paralichthys lethostigma southern flounder 23 9.7 17 4.2
Rypticus maculatus whitespotted soapfish 22 0.8 15 3.7
Chilomycterus schoepfii striped burrfish 22 7.1 16 4
Caulolatilus intermedius anchor tilefish 22 1.6 10 2.5
Pleuronectiformes flatfishes 21 0.2 1 0.2
Etropus 21 0.2 1 0.2
Stephanolepis hispida planehead filefish 21 0.8 5 1.2
Paralichthys albigutta gulf flounder 20 8.7 14 3.5
Dasyatis americana southern stingray 19 25.3 8 2
Priacanthus arenatus bigeye 18 3.1 11 2.7
Symphurus urospilus spottail tonguefish 17 0.5 7 1.7
Aluterus heudelotii dotterel filefish 17 4 14 3.5
Halichoeres bathyphilus greenband wrasse 17 0.2 1 0.2
Ogcocephalus corniger longnose batfish 17 0.3 12 3
Pomacanthus arcuatus gray angelfish 16 6.5 13 3.2
Hoplunnis macrura freckled pike-conger 15 0.1 7 1.7
Selar crumenophthalmus bigeye scad 15 1.1 7 1.7
Scomberomorus cavalla king mackerel 14 1 8 2
Apogon aurolineatus bridle cardinalfish 14 1.6 8 2
Peprilus paru harvestfish 14 0.4 10 2.5
Pterois lion fishes 14 3.8 3 0.7
Bothus ocellatus eyed flounder 14 0.3 6 1.5
Echeneis naucrates sharksucker 13 7.5 10 2.5
Citharichthys gymnorhinus anglefin whiff 13 0 9 2.2
Hemicaranx amblyrhynchus bluntnose jack 13 0.3 2 0.5
Anchoa lyolepis dusky anchovy 13 0 2 0.5
Bairdiella chrysoura silver perch 13 0.3 6 1.5
Sphoeroides nephelus southern puffer 13 1.5 7 1.7
Apogon quadrisquamatus sawcheek cardinalfish 13 0 9 2.2
44

Table 3. Species composition list (continued)
NUMBER OF
TOTAL NUMBER TOTAL WEIGHT TOWS WHERE % FREQUENCY
GENUS/SPECIES COMMON NAME CAUGHT CAUGHT (KG) CAUGHT OCCURRENCE
Ophidion grayi blotched cusk-eel 13 1.3 4 1
Astrapogon alutus bronze cardinalfish 12 0 5 1.2
Rhizoprionodon terraenovae Atlantic sharpnose shark 12 18.9 8 2
Calamus bajonado jolthead porgy 12 6.3 3 0.7
Rhinobatos lentiginosus Atlantic guitarfish 12 6.6 11 2.7
Pareques iwamotoi blackbar drum 12 0.4 6 1.5
Hemanthias aureorubens streamer bass 12 0.1 1 0.2
Holacanthus bermudensis blue angelfish 12 5.8 9 2.2
Aluterus scriptus scrawled filefish 11 2.9 5 1.2
Ophidion cusk-eels 11 0.3 9 2.2
Ogcocephalus cubifrons 11 3.2 10 2.5
Selene vomer lookdown 11 0.5 4 1
Pontinus longispinis longspine scorpionfish 11 0.2 4 1
Squatina dumeril Atlantic angel shark 10 26.5 5 1.2
Syacium micrurum channel flounder 10 0.1 1 0.2
Rachycentron canadum cobia 10 18.7 5 1.2
Scomberomorus maculatus Spanish mackerel 9 2.2 5 1.2
Rypticus bistrispinus freckled soapfish 9 0.1 4 1
Calamus penna sheepshead porgy 9 3.2 7 1.7
Paralichthys squamilentus broad flounder 9 1.7 3 0.7
Ophichthus puncticeps palespotted eel 9 1.1 8 2
Canthigaster rostratus 9 0.1 5 1.2
Dorosoma petenense threadfin shad 8 0.2 4 1
Antennarius ocellatus ocellated frogfish 8 0.3 8 2
Parablennius marmoreus seaweed blenny 8 0 7 1.7
Physiculus fulvus metallic codling 8 0.1 3 0.7
Sphyraena guachancho guaguanche 7 0.7 5 1.2
Rhynchoconger flavus 7 0.1 1 0.2
Gymnachirus melas naked sole 7 0.3 5 1.2
Opsanus pardus leopard toadfish 7 0.3 7 1.7
Urophycis earlli Carolina hake 6 0.4 4 1
45

Table 3. Species composition list (continued)
NUMBER OF
TOTAL NUMBER TOTAL WEIGHT TOWS WHERE % FREQUENCY
GENUS/SPECIES COMMON NAME CAUGHT CAUGHT (KG) CAUGHT OCCURRENCE
Estropus microstomus smallmouth flounder 6 0 1 0.2
Antennarius striatus striated frogfish 6 0.2 6 1.5
Citharichthys cornutus horned whiff 6 0 4 1
Acanthostracion polygonius honeycomb cowfish 6 4.2 3 0.7
Cryptotomus roseus bluelip parrotfish 6 0 5 1.2
Holocentrus rufus longspine squirrelfish 6 0.2 1 0.2
Hypoplectrus 5 0.1 5 1.2
Aluterus monoceros unicorn filefish 5 1.4 4 1
Narcine brasiliensis lesser electric ray 5 3.2 5 1.2
Mycteroperca phenax scamp 5 2.7 3 0.7
Serranus annularis orangeback bass 5 0 2 0.5
Echeneis sharksuckers 5 1.4 3 0.7
Ogcocephalus cubifrons polka-dot batfish 5 2 1 0.2
Seriola dumerili greater amberjack 5 2.9 4 1
Anisotremus virginicus porkfish 5 0.8 3 0.7
Oligoplites saurus leatherjack 5 0.1 2 0.5
Lonchopisthus micrognathus swordtail jawfish 5 0 5 1.2
Trinectes maculatus hogchoker 5 0.2 4 1
Ogcocephalus spp. batfishes 4 0 3 0.7
Citharichthys arctifrons Gulf Stream flounder 4 0 1 0.2
Mustelus sinusmexicanus Gulf smoothhound 4 7.4 2 0.5
Canthigaster jamestyleri 4 0 3 0.7
Echeneis neucratoides whitefin sharksucker 4 2.1 1 0.2
Bellator egretta streamer searobin 4 0.1 2 0.5
Lophius americanus goosefish 4 0.5 3 0.7
Halichoeres wrasses 4 0.5 1 0.2
Sphoeroides pachygaster blunthead puffer 4 0.6 3 0.7
Gobiesox strumosus skilletfish 4 0 4 1
Trachinotus carolinus Florida pompano 4 1.6 4 1
Caranx hippos crevalle jack 4 0.3 3 0.7
Gymnura micrura smooth butterfly ray 4 11.1 3 0.7
46

Table 3. Species composition list (continued)
NUMBER OF
TOTAL NUMBER TOTAL WEIGHT TOWS WHERE % FREQUENCY
GENUS/SPECIES COMMON NAME CAUGHT CAUGHT (KG) CAUGHT OCCURRENCE
Paralichthyidae 3 0 1 0.2
Lutjanus vivanus silk snapper 3 0.5 2 0.5
Phaeoptyx pigmentaria dusky cardinalfish 3 0 3 0.7
Etropus cyclosquamus shelf flounder 3 0 1 0.2
Menticirrhus littoralis gulf kingfish 3 0.5 2 0.5
Scorpaena spp. scorpionfishes 3 0 2 0.5
Apogon spp. cardinalfishes 3 0 1 0.2
Caulolatilus chrysops goldface tilefish 3 0.6 1 0.2
Sparisoma chrysopterum redtail parrotfish 3 0 1 0.2
Peristedion gracile slender searobin 3 0 2 0.5
Astrapogon puncticulatus blackfin cardinalfish 3 0 3 0.7
Ariomma 3 0.1 1 0.2
Pristipomoides freemani slender wenchman 3 0 1 0.2
Pomacentrus variabilis cocoa damselfish 2 0 1 0.2
Remora remora remora 2 0.7 1 0.2
Diodon holocanthus balloonfish 2 0.6 1 0.2
Hyporthodus flavolimbatus 2 0.2 2 0.5
Echiophis punctifer snapper eel 2 0.4 2 0.5
Conodon nobilis barred grunt 2 0.2 2 0.5
Polydactylus octonemus Atlantic threadfin 2 0.2 1 0.2
Bathyanthias mexicanus yellowtail bass 2 0 1 0.2
Bregmaceros atlanticus antenna codlet 2 0 1 0.2
Gobionellus oceanicus highfin goby 2 0 2 0.5
Syngnathus louisianae chain pipefish 2 0 2 0.5
Scorpaena dispar hunchback scorpionfish 2 0.1 1 0.2
Ariosoma balearicum bandtooth conger 2 0.1 2 0.5
Caulolatilus cyanops blackline tilefish 2 0.3 2 0.5
Dormitator maculatus fat sleeper 2 0 1 0.2
Pogonias cromis black drum 2 10.6 2 0.5
Paraconger caudilimbatus margintail conger 2 0.3 2 0.5
Bregmaceros 2 0 1 0.2
47

Table 3. Species composition list (continued)
NUMBER OF
TOTAL NUMBER TOTAL WEIGHT TOWS WHERE % FREQUENCY
GENUS/SPECIES COMMON NAME CAUGHT CAUGHT (KG) CAUGHT OCCURRENCE
Otophidium omostigmum polka-dot cusk-eel 2 0 2 0.5
Carcharhinus acronotus blacknose shark 2 10.8 2 0.5
Ogcocephalus pantostictus spotted batfish 2 0.8 2 0.5
Scorpaena plumieri spotted scorpionfish 2 1.1 2 0.5
Gymnothorax nigromarginatus blackedge moray 2 0.2 1 0.2
Dasyatis say bluntnose stingray 2 1.3 2 0.5
Opsanus tau oyster toadfish 1 0.1 1 0.2
Alectis ciliaris African pompano 1 0 1 0.2
Paralichthys southern flounders 1 0.1 1 0.2
Carcharhinus brevipinna spinner shark 1 3.6 1 0.2
Prognathodes aya bank butterflyfish 1 0 1 0.2
Corythoichthys albirostris 1 0 1 0.2
Seriola rivoliana almaco jack 1 0.3 1 0.2
Opistognathus lonchurus moustache jawfish 1 0 1 0.2
Lophiidae anglerfishes 1 0 1 0.2
Mustelus canis smooth dogfish 1 0.1 1 0.2
Echiophis intertinctus spotted spoon-nose eel 1 0.2 1 0.2
Pronotogrammus martinicensis 1 0 1 0.2
Lophius gastrophysus blackfin goosefish 1 0 1 0.2
Scomber japonicus chub mackerel 1 0.1 1 0.2
Mycteroperca microlepis gag 1 5.2 1 0.2
Mustelus smooth hound sharks 1 0.7 1 0.2
Serraniculus pumilio pygmy sea bass 1 0 1 0.2
Mustelus norrisi Florida smoothhound 1 0.7 1 0.2
Alosa chrysochloris blue herring 1 0.1 1 0.2
Sphyraena borealis northern sennet 1 0.2 1 0.2
Antennarius multiocellatus longlure frogfish 1 0 1 0.2
Symphurus spp. tonguefishes 1 0 1 0.2
Stephanolepis setifer pygmy filefish 1 0 1 0.2
Calamus leucosteus whitebone porgy 1 0.6 1 0.2
Monacanthus tuckeri slender filefish 1 0 1 0.2
48

Table 3. Species composition list (continued)
NUMBER OF
TOTAL NUMBER TOTAL WEIGHT TOWS WHERE % FREQUENCY
GENUS/SPECIES COMMON NAME CAUGHT CAUGHT (KG) CAUGHT OCCURRENCE
Archosargus probatocephalus sheepshead 1 0.5 1 0.2
Synodus synodus red lizardfish 1 0 1 0.2
Lophius 1 0.1 1 0.2
Lutjanus analis mutton snapper 1 3.8 1 0.2
Sparisoma atromarium 1 0 1 0.2
Apogon pillionatus broadsaddle cardinalfish 1 0 1 0.2
Chromis insolatus 1 0 1 0.2
Hypleurochilus 1 0 1 0.2
Gymnothorax spp. morays 1 0 1 0.2
Gobiosoma horsti yellowline goby 1 0 1 0.2
Gymnothorax moringa spotted moray 1 0.9 1 0.2
Anarchias 1 0 1 0.2
Hoplunnis diomedianus blacktail pike-conger 1 0 1 0.2
Myripristis jacobus blackbar soldierfish 1 0 1 0.2
Anthias tenuis threadnose bass 1 0 1 0.2
Chromis scotti purple reeffish 1 0 1 0.2
Eucinostomus melanopterus flagfin mojarra 1 0 1 0.2
Parexocoetus 1 0 1 0.2
Aetobatus narinari bonnetray 1 75 1 0.2
Hypleurochilus bermudensis barred blenny 1 0 1 0.2
Serranus subligarius belted sandfish 1 0 1 0.2
Haemulon sciurus bluestriped grunt 1 0.2 1 0.2
Astroscopus y-graecum southern stargazer 1 0.2 1 0.2
Conger triporiceps manytooth conger 1 0.2 1 0.2
Gobiosoma macrodon tiger goby 1 0 1 0.2
Lactophrys trigonus trunkfish 1 0.7 1 0.2
Anguilliformes eels 1 0 1 0.2
Abudefduf saxatilis sergeant major 1 0 1 0.2
Labrisomus haitiensis longfin blenny 1 0 1 0.2
Emblemaria atlantica banner blenny 1 0 1 0.2
Holacanthus angelfishes 1 0 1 0.2
49

Table 3. Species composition list (continued)
NUMBER OF
TOTAL NUMBER TOTAL WEIGHT TOWS WHERE % FREQUENCY
GENUS/SPECIES COMMON NAME CAUGHT CAUGHT (KG) CAUGHT OCCURRENCE
Ophidion selenops mooneye cusk-eel 1 0 1 0.2
Ophichthus gomesii shrimp eel 1 0.3 1 0.2
Scomber colias 1 0.1 1 0.2
Crustaceans
Farfantepenaeus aztecus brown shrimp 14149 338.7 167 41.3
Callinectes similis lesser blue crab 5150 96 138 34.2
Sicyonia brevirostris brown rock shrimp 4541 62.9 100 24.8
Portunus spinicarpus longspine swimming crab 3806 22.1 117 29
Portunus gibbesii irridescent swimming crab 1974 14.1 140 34.7
Squilla empusa mantis shrimp 1911 18.2 105 26
Rimapenaeus similis roughback shrimp 1598 6.4 82 20.3
Farfantepenaeus duorarum pink shrimp 1586 37.4 62 15.3
Solenocera vioscai humpback shrimp 1484 7 34 8.4
Litopenaeus setiferus white shrimp 1282 29.9 82 20.3
Xiphopenaeus kroyeri seabob 1098 4.1 17 4.2
Sicyonia dorsalis lesser rock shrimp 960 2.7 33 8.2
Rimapenaeus constrictus roughneck shrimp 919 2.2 33 8.2
Squilla chydaea mantis shrimp 845 4.4 51 12.6
Portunus spinimanus blotched swimming crab 725 26.7 99 24.5
Portunus ordwayii 494 2.8 24 5.9
Anasimus latus stilt spider crab 418 3.1 41 10.1
Solenocera atlantidis dwarf humpback shrimp 338 0.4 30 7.4
Parapenaeus politus deepwater rose shrimp 285 0.4 7 1.7
Mesopenaeus tropicalis salmon shrimp 178 0.7 16 4
Metapenaeopsis goodei Caribbean velvet shrimp 170 0.3 28 6.9
Raninoides louisianensis gulf frog crab 159 1.1 32 7.9
Calappa sulcata yellow box crab 159 30.2 65 16.1
Scyllarus chacei chace slipper lobster 130 0.4 36 8.9
Stenorhynchus seticornis yellowline arrow crab 107 0.3 45 11.1
50

Table 3. Species composition list (continued)
NUMBER OF
TOTAL NUMBER TOTAL WEIGHT TOWS WHERE % FREQUENCY
GENUS/SPECIES COMMON NAME CAUGHT CAUGHT (KG) CAUGHT OCCURRENCE
Callinectes sapidus blue crab 76 9.4 33 8.2
Munida pusilla 60 0 2 0.5
Scyllarides nodifer ridged slipper lobster 55 14.5 25 6.2
Podochela sidneyi shortfinger neck crab 55 0.1 27 6.7
Leiolambrus nitidus white elbow crab 53 0.1 21 5.2
Myropsis quinquespinosa fivespine purse crab 49 0.2 11 2.7
Cryptodromiopsis antillensis hairy sponge crab 48 0.4 29 7.2
Pseudorhombila quadridentata flecked squareback crab 48 0.3 17 4.2
Petrolisthes galathinus banded porcelain crab 38 0 7 1.7
Platylambrus granulata bladetooth elbow crab 35 0.1 23 5.7
Libinia dubia longnose spider crab 33 0.2 17 4.2
Squilla deceptrix 33 0.1 12 3
Squilla rugosa 33 0.2 9 2.2
Stenocionops furcatus furcatus furcate crab 28 0.3 17 4.2
Pagurus pollicaris flatclaw hermit crab 27 0.4 23 5.7
Pagurus annulipes 25 0 6 1.5
Hepatus epheliticus calico crab 25 1.2 15 3.7
Macrocoeloma trispinosum spongy decorator crab 22 0.1 13 3.2
Calappa flammea flame box crab 21 2.4 18 4.5
Metoporhaphis calcarata false arrow crab 21 0 13 3.2
Paguristes spp. hermit crabs 17 0 13 3.2
Parthenope agonus 16 0 9 2.2
Sicyonia burkenroadi spiny rock shrimp 16 0 7 1.7
Petrochirus diogenes giant hermit crab 16 0.6 13 3.2
Acanthocarpus alexandri gladiator box crab 15 0.1 4 1
Collodes robustus spider crab 15 0 5 1.2
Mithrax pleuracanthus shaggy clinging crab 14 0.1 8 2
Pseudomedaeus agassizii rough rubble crab 13 0 2 0.5
Scyllarus depressus scaled slipper lobster 13 0.1 8 2
Lobopilumnus agassizii areolated hairy crab 13 0.1 10 2.5
Stenorhynchus 13 0 8 2
51

Table 3. Species composition list (continued)
NUMBER OF
TOTAL NUMBER TOTAL WEIGHT TOWS WHERE % FREQUENCY
GENUS/SPECIES COMMON NAME CAUGHT CAUGHT (KG) CAUGHT OCCURRENCE
Portunus depressifrons flatface swimming crab 12 0.3 4 1
Solenoceridae solenocerid shrimps 11 0 1 0.2
Porcellana sayana spotted porcelain crab 11 0 2 0.5
Decapoda crabs 10 0 3 0.7
Stenocionops spinimanus prickly spider crab 10 2.2 9 2.2
Speocarcinus lobatus gulf squareback crab 9 1.1 2 0.5
Ovalipes floridanus Florida lady crab 9 0.2 7 1.7
Pagurus bullisi hermit crab 9 0 2 0.5
Mithrax hispidus coral clinging crab 9 0.1 5 1.2
Paguristes triangulatus hermit crab 8 0 4 1
Dardanus fucosus bareye hermit 8 0 6 1.5
Persephona crinita pink purse crab 8 0 8 2
Euphrosynoplax clausa craggy bathyal crab 8 0 6 1.5
Mithrax forceps red-ridged clinging crab 7 0 6 1.5
Dromiidae sponge crabs 7 0 3 0.7
Parasquilla coccinea mantis shrimp 7 0.1 6 1.5
Plesionika edwardsii soldier striped shrimp 7 0 1 0.2
Acanthilia intermedia granulose purse crab 7 0 6 1.5
Palicus faxoni finned stilt crab 6 0 4 1
Persephona mediterranea mottled purse crab 6 0 5 1.2
Plesionika longicauda pandalid shrimp 5 0 3 0.7
Sicyonia typica kinglet rock shrimp 5 0 4 1
Mithrax acuticornis sharphorn clinging crab 5 0 5 1.2
Pagurus impressus dimpled hermit 4 0 2 0.5
Stenopus scutellatus golden coral shrimp 4 0 3 0.7
Panulirus argus Caribbean spiny lobster 4 3.1 3 0.7
Sicyonia laevigata rock shrimp 4 0 1 0.2
Pilumnus sayi spineback hairy crab 4 0 4 1
Galathea rostrata 4 0 2 0.5
Libinia emarginata portly spider crab 4 0.2 3 0.7
Xanthidae mud crabs 3 0 2 0.5
52

Table 3. Species composition list (continued)
NUMBER OF
TOTAL NUMBER TOTAL WEIGHT TOWS WHERE % FREQUENCY
GENUS/SPECIES COMMON NAME CAUGHT CAUGHT (KG) CAUGHT OCCURRENCE
Podochela lamelligera neck crab 3 0 3 0.7
Macrocoeloma camptocerum Florida decorator crab 3 0 3 0.7
Euchirograpsus americanus American talon crab 3 0 3 0.7
Manucomplanus ungulatus 3 0 3 0.7
Phimochirus holthuisi red-striped hermit 3 0 3 0.7
Mithrax 3 0 3 0.7
Palicus alternata 2 0 1 0.2
Alpheus snapping shirmps 2 0 1 0.2
Calappa 2 0 2 0.5
Alpheus floridanus sand snapping shrimp 2 0.5 1 0.2
Dardanus insignis red brocade hermit 2 0 2 0.5
Sicyonia parri rock shrimps 2 0 2 0.5
Iliacantha 2 0 2 0.5
Sicyonia spp. rock shrimps 2 0 2 0.5
Munida irrasa 2 0 2 0.5
Squillidae mantis shrimps 1 0 1 0.2
Euryalidae 1 0 1 0.2
Menippe spp. stone crabs 1 0 1 0.2
Mysidae shrimps 1 0 1 0.2
Hypoconcha arcuata granulate shellback crab 1 0 1 0.2
Acetes americanus aviu shrimp 1 0 1 0.2
Synalpheus fritzmuelleri speckled snapping shrimp 1 0 1 0.2
Iliacantha sparsa shouldered purse crab 1 0 1 0.2
Euceramus praelongus olivepit porcelain crab 1 0 1 0.2
Podochela riisei longfinger neck crab 1 0 1 0.2
Scyllarus americanus American slipper lobster 1 0 1 0.2
Iliacantha subglobosa longfinger purse crab 1 0 1 0.2
Ranilia muricata muricate frog crab 1 0 1 0.2
Nibilia antilocapra shorthorn spiny crab 1 0 1 0.2
Stenocionops furcatus coelatus spider crab 1 0 1 0.2
Iliacantha liodactylus purse crab 1 0 1 0.2
53

Table 3. Species composition list (continued)
NUMBER OF
TOTAL NUMBER TOTAL WEIGHT TOWS WHERE % FREQUENCY
GENUS/SPECIES COMMON NAME CAUGHT CAUGHT (KG) CAUGHT OCCURRENCE
Goneplacidae 1 0 1 0.2
Sicyonia stimpsoni eyespot rock shrimp 1 0 1 0.2
Pilumnus floridanus plumed hairy crab 1 0 1 0.2
Pitho anisodon oval urn crab 1 0 1 0.2
Diogenidae left-handed hermit crabs 1 0 1 0.2
Stenopus 1 0 1 0.2
Munida 1 0 1 0.2
Pagurus carolinensis wormreef hermit 1 0 1 0.2
Euryplax nitida glabrous broadface crab 1 0 1 0.2
Others
Amusium papyraceum paper scallop 12404 163.4 64 15.8
Loligo plei arrow squid 3263 54.1 176 43.6
Lolliguncula brevis Atlantic brief squid 1338 12.7 106 26.2
Loligo pealeii longfin squid 920 48.8 99 24.5
Anadara baughmani Baughman's ark 366 5.3 17 4.2
Pitar cordatus Schwengel's pitar 299 5.8 38 9.4
Loligo spp. squids 204 2.8 14 3.5
Polystira albida white giant turris 186 1.7 19 4.7
Argopecten gibbus calico scallop 165 0.9 11 2.7
Argopecten 56 0.8 1 0.2
Lirophora clenchi Clench venus 50 0.6 13 3.2
Euvola raveneli Ravenel's scallop 46 0.2 11 2.7
Anadara ovalis blood ark 35 0.3 7 1.7
Sconsia striata royal bonnet 29 0.4 8 2
Octopus joubini Atlantic pygmy octopus 29 3.8 19 4.7
Neverita duplicata shark eye 23 0.3 15 3.7
Laevicardium laevigatum egg cockle 17 1.3 8 2
Conus austini cone shell 14 0.2 5 1.2
Macoma brevifrons short macoma 12 0.1 2 0.5
54
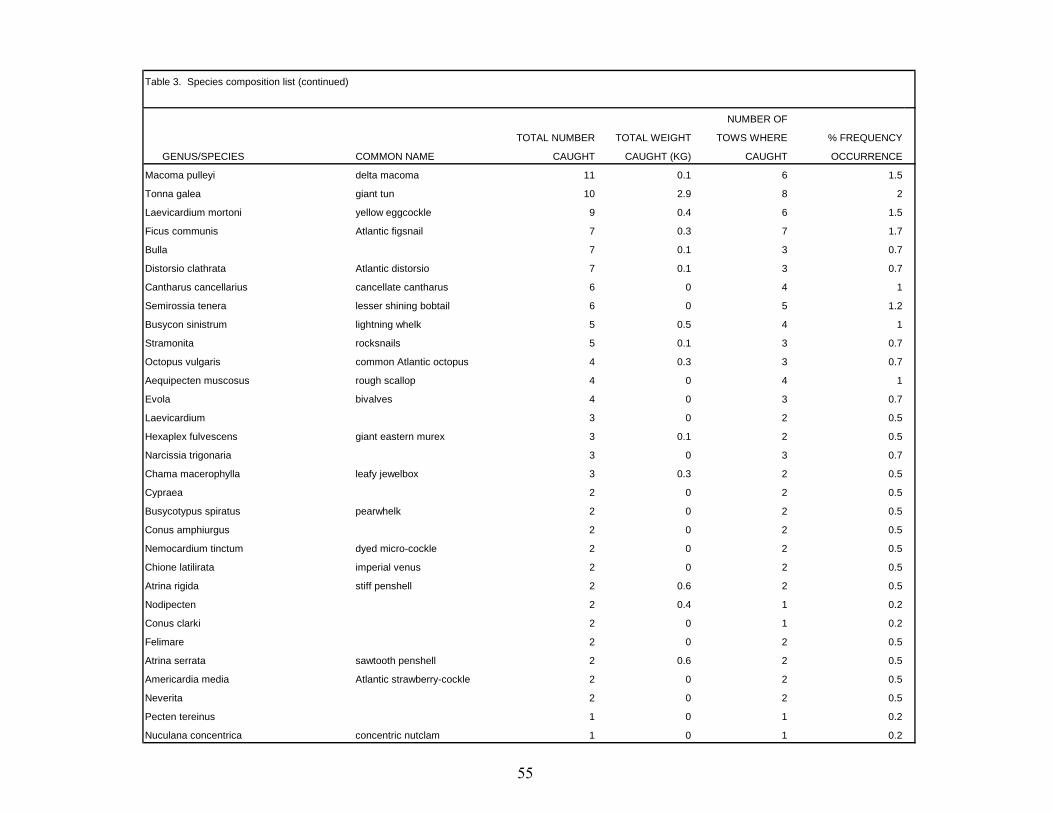
Table 3. Species composition list (continued)
NUMBER OF
TOTAL NUMBER TOTAL WEIGHT TOWS WHERE % FREQUENCY
GENUS/SPECIES COMMON NAME CAUGHT CAUGHT (KG) CAUGHT OCCURRENCE
Macoma pulleyi delta macoma 11 0.1 6 1.5
Tonna galea giant tun 10 2.9 8 2
Laevicardium mortoni yellow eggcockle 9 0.4 6 1.5
Ficus communis Atlantic figsnail 7 0.3 7 1.7
Bulla 7 0.1 3 0.7
Distorsio clathrata Atlantic distorsio 7 0.1 3 0.7
Cantharus cancellarius cancellate cantharus 6 0 4 1
Semirossia tenera lesser shining bobtail 6 0 5 1.2
Busycon sinistrum lightning whelk 5 0.5 4 1
Stramonita rocksnails 5 0.1 3 0.7
Octopus vulgaris common Atlantic octopus 4 0.3 3 0.7
Aequipecten muscosus rough scallop 4 0 4 1
Evola bivalves 4 0 3 0.7
Laevicardium 3 0 2 0.5
Hexaplex fulvescens giant eastern murex 3 0.1 2 0.5
Narcissia trigonaria 3 0 3 0.7
Chama macerophylla leafy jewelbox 3 0.3 2 0.5
Cypraea 2 0 2 0.5
Busycotypus spiratus pearwhelk 2 0 2 0.5
Conus amphiurgus 2 0 2 0.5
Nemocardium tinctum dyed micro-cockle 2 0 2 0.5
Chione latilirata imperial venus 2 0 2 0.5
Atrina rigida stiff penshell 2 0.6 2 0.5
Nodipecten 2 0.4 1 0.2
Conus clarki 2 0 1 0.2
Felimare 2 0 2 0.5
Atrina serrata sawtooth penshell 2 0.6 2 0.5
Americardia media Atlantic strawberry-cockle 2 0 2 0.5
Neverita 2 0 2 0.5
Pecten tereinus 1 0 1 0.2
Nuculana concentrica concentric nutclam 1 0 1 0.2
55
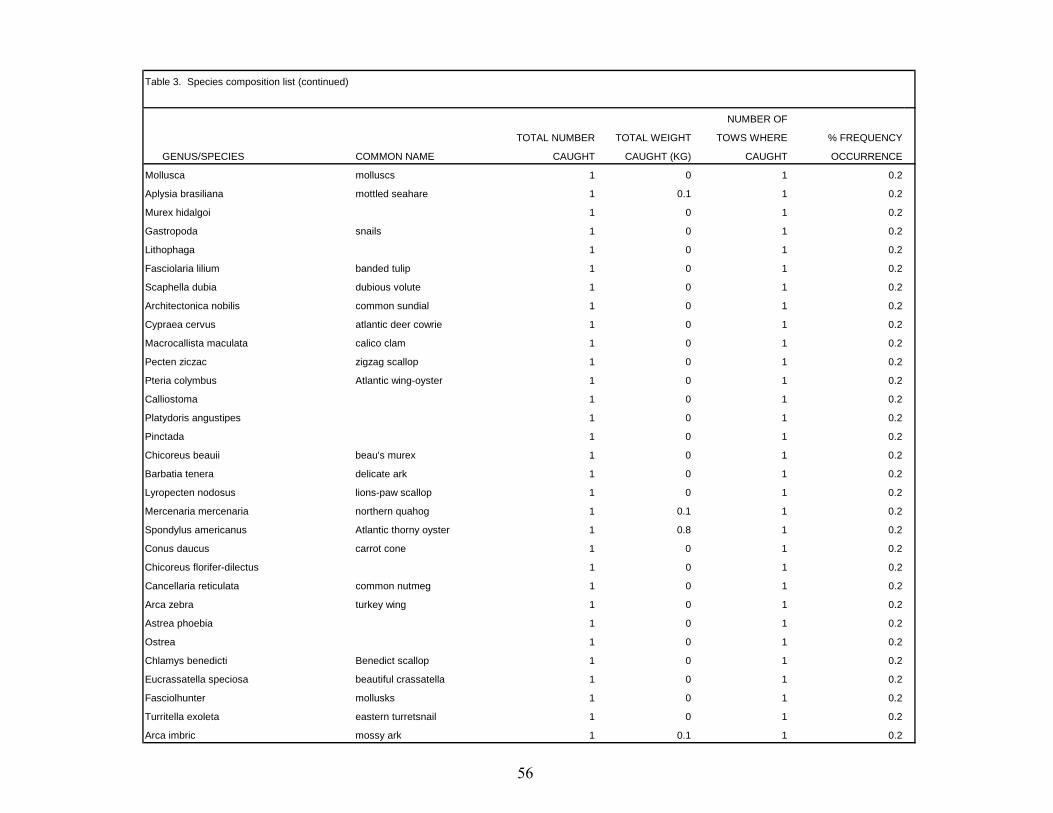
Table 3. Species composition list (continued)
NUMBER OF
TOTAL NUMBER TOTAL WEIGHT TOWS WHERE % FREQUENCY
GENUS/SPECIES COMMON NAME CAUGHT CAUGHT (KG) CAUGHT OCCURRENCE
Mollusca molluscs 1 0 1 0.2
Aplysia brasiliana mottled seahare 1 0.1 1 0.2
Murex hidalgoi 1 0 1 0.2
Gastropoda snails 1 0 1 0.2
Lithophaga 1 0 1 0.2
Fasciolaria lilium banded tulip 1 0 1 0.2
Scaphella dubia dubious volute 1 0 1 0.2
Architectonica nobilis common sundial 1 0 1 0.2
Cypraea cervus atlantic deer cowrie 1 0 1 0.2
Macrocallista maculata calico clam 1 0 1 0.2
Pecten ziczac zigzag scallop 1 0 1 0.2
Pteria colymbus Atlantic wing-oyster 1 0 1 0.2
Calliostoma 1 0 1 0.2
Platydoris angustipes 1 0 1 0.2
Pinctada 1 0 1 0.2
Chicoreus beauii beau's murex 1 0 1 0.2
Barbatia tenera delicate ark 1 0 1 0.2
Lyropecten nodosus lions-paw scallop 1 0 1 0.2
Mercenaria mercenaria northern quahog 1 0.1 1 0.2
Spondylus americanus Atlantic thorny oyster 1 0.8 1 0.2
Conus daucus carrot cone 1 0 1 0.2
Chicoreus florifer-dilectus 1 0 1 0.2
Cancellaria reticulata common nutmeg 1 0 1 0.2
Arca zebra turkey wing 1 0 1 0.2
Astrea phoebia 1 0 1 0.2
Ostrea 1 0 1 0.2
Chlamys benedicti Benedict scallop 1 0 1 0.2
Eucrassatella speciosa beautiful crassatella 1 0 1 0.2
Fasciolhunter mollusks 1 0 1 0.2
Turritella exoleta eastern turretsnail 1 0 1 0.2
Arca imbric mossy ark 1 0.1 1 0.2
56

Table 4. 2014 Bottom Longline Survey species composition list. Species with no weight recorded were too large to measure.
TOTAL TOTAL
NUMBER NUMBER TOTAL
GENUS/SPECIES COMMON NAME CAUGHT WEIGHED WEIGHT
Finfishes
Rhizoprionodon terraenovae Atlantic sharpnose shark 1275 1168 3600.8
Carcharhinus limbatus blacktip shark 344 275 3761.8
Lutjanus campechanus red snapper 205 185 1042.5
Bagre marinus gafftopsail catfish 152 139 219.7
Carcharhinus acronotus blacknose shark 148 137 1125.6
Carcharhinus brevipinna spinner shark 135 114 1370.3
Mustelus smooth hound sharks 113 110 657.4
Sciaenops ocellatus red drum 89 75 661.1
Ophichthus rex king snake eel 64 22 52.4
Dasyatis americana southern stingray 45 1 17.0
Sphyrna lewini scalloped hammerhead 37 19 232.7
Carcharhinus plumbeus sandbar shark 32 2 35.8
Carcharhinus leucas bull shark 29 6 41.4
Arius felis hardhead catfish 26 24 18.7
Galeocerdo cuvier tiger shark 22 14 98.2
Unid.fish 19 0
Sphyrna mokarran great hammerhead 15 4 85.5
Carcharhinus isodon finetooth shark 14 9 56.7
Carcharhinus falciformis silky shark 12 12 45.0
Epinephelus flavolimbatus yellowedge grouper 5 4 23.2
Centropristis philadelphicus Rock Sea bass 3 3 0.4
Rachycentron canadum cobia 3 3 33.7
Rhinoptera bonasus cownose ray 3 1 18.2
Echeneis naucrates sharksucker 3 3 3.5
Pogonias cromis black drum 2 2 17.1
Cynoscion arenarius sand seatrout 2 2 0.7
Myliobatis freminvillii bullnose ray 2 1 4.3
Dasyatis sabina Atlantic stingray 2 1 4.2
57

Table 4. 2014 Bottom Longline Survey species composition list. Species with no weight recorded were too large to measure.
TOTAL TOTAL
NUMBER NUMBER TOTAL
GENUS/SPECIES COMMON NAME CAUGHT WEIGHED WEIGHT
Caretta caretta Loggerhead 2 0
Micropogonias undulatus Atlantic croaker 1 1 0.1
Cynoscion nothus silver seatrout 1 1 0.2
Epinephelus niveatus snowy grouper 1 1 2.4
Dasyatis centroura clam cracker 1 0
Dasyatis say bluntnose stingray 1 0
Mycteroperca phenax scamp 1 1 9.0
Coryphaena hippurus dolphin 1 1 3.1
Urophycis cirratus Gulf hake 1 1 0.4
Astropecten cingulatus 1 0
Caranx hippos crevalle jack 1 1 12.4
Thunnus atlanticus blackfin tuna 1 0
Scomberomorus maculatus Atlantic Spanish mackerel 1 1 2.0
Brotula barbatum bearded brotula 1 1 6.0
Urophycis floridanus 1 1 1.0
Megalops atlanticus tarpon 1 0
Callinectes sapidus blue crab 1 0
Ophichthus puncticeps palespotted eel 1 0
Sphyrna tiburo bonnethead 1 1 6.0
Manta birostris Atlantic manta 1 0
Echiophis punctifer snapper eel 1 0
Carcharhinidae requiem sharks 1 0
58

Table 5. 2014 Vertical Line Survey species composition list. Species with no weight recorded were too large to measure.
TOTAL TOTAL
NUMBER NUMBER TOTAL
GENUS/SPECIES COMMON NAME CAUGHT WEIGHED WEIGHT
Finfishes
Lutjanus campechanus red snapper 1211 1210 2633.6
Rhomboplites aurorubens vermilion snapper 31 31 19.0
Balistes capriscus gray triggerfish 28 28 50.5
Caranx crysos blue runner 15 15
Seriola dumerili greater amberjack 13 13 18.1
Arius felis hardhead catfish 9 9
Carcharhinus brevipinna spinner shark 5 4
Pagrus pagrus red porgy 4 4 2.7
Echeneis naucrates sharksucker 4 3 4.1
Cynoscion arenarius sand seatrout 4 4
Seriola rivoliana almaco jack 3 3 4.0
Rhizoprionodon terraenovae Atlantic sharpnose shark 2 2 4.1
Haemulon aurolineatum tomtate 2 1 0.2
Lutjanus synagris lane snapper 1 1 0.8
Lutjanus griseus gray snapper 1 1 4.5
Diplectrum formosum sand perch 1 1 0.2
Carcharhinus falciformis silky shark 1 1
Scomber japonicus chub mackerel 1 1
Sciaenops ocellatus red drum 1 1 4.4
Sarda bonitos 1 1 1.8
Epinephelus nigritus warsaw grouper 1 1 6.5
Epinephelus morio red grouper 1 1 4.4
Epinephelus niveatus snowy grouper 1 1 2.6
59

Figure 1. Statistical zones for shrimp in the Gulf of Mexico.
60
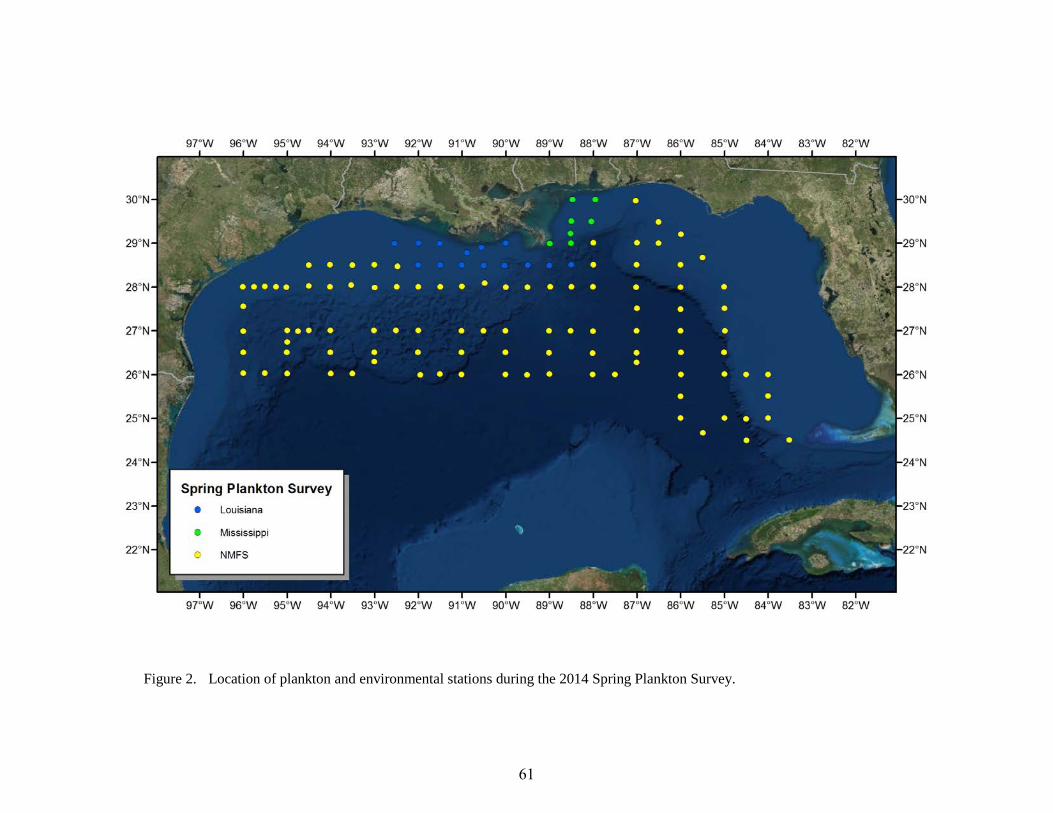
Figure 2. Location of plankton and environmental stations during the 2014 Spring Plankton Survey.
61

Figure 3. Locations of stations during the 2014 Fall Plankton Survey.
62

Figure 4. Locations of stations during the 2014 Summer Shrimp/Groundfish Survey.
63

Figure 5. Locations of stations during the 2014 Fall Shrimp/Groundfish Survey.
64

Figure 6. Locations of stations during the 2014 Reef Fish Survey.
65

Figure 7. Locations of stations during the 2014 Inshore Bottom Longline Survey.
66
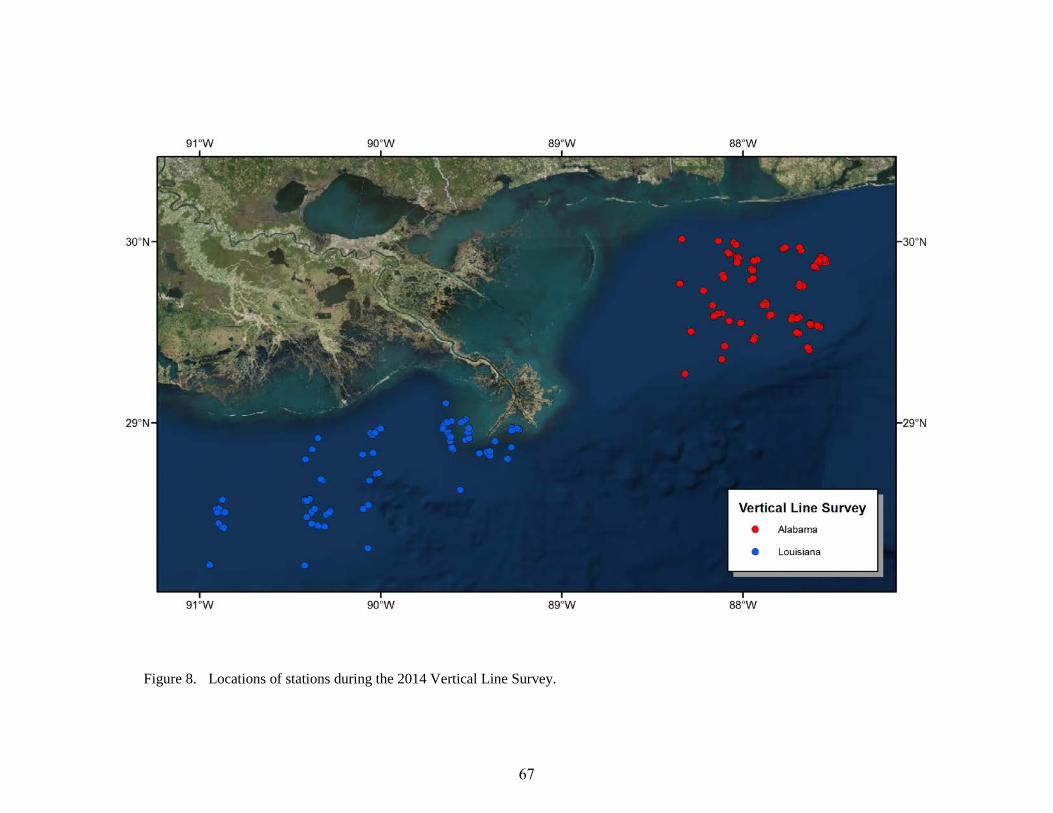
Figure 8. Locations of stations during the 2014 Vertical Line Survey.
67


