29
MOBILE SPEED STUDY 2018 SEARCHMETRICS WHITEPAPER

MOBILE SPEED STUDY
2018
SEARCHMETRICS
WHITEPAPER
2MOBILE SPEED STUDY 2018: The race to be fastest in Google's world
Purpose of the Study .................................................................................................................... 3
Background: Mobile Search in 2018 .......................................................................................... 4
Synopsis: Executive Findings and Conclusions .................................................................... 5
Study Methodology – Measuring and Defining Page Speed ................................................ 6
Mobile Page Speed – Results .................................................................................................... 7
Mobile Page Speed – Explanations and Interpretations ....................................................... 8
Optimizing your Site – How fast does fast have to be? .......................................................10
AMP ................................................................................................................................................12
AMP – Results .............................................................................................................................13
Industry Analysis .........................................................................................................................15
Results at a Glance – Page Speed across Industries ........................................................16
Results at a Glance – AMP across Industries .....................................................................17
eCommerce: Mobile Page Speed .............................................................................................19
eCommerce: AMP .......................................................................................................................20
Finance: Mobile Page Speed .....................................................................................................21
Finance: AMP ...............................................................................................................................22
Health: Mobile Page Speed ........................................................................................................23
Health: AMP ..................................................................................................................................24
Media: Mobile Page Speed ........................................................................................................25
Media: AMP...................................................................................................................................26
Travel: Mobile Page Speed.........................................................................................................27
Travel: AMP ...................................................................................................................................28
Table of Contents

3MOBILE SPEED STUDY 2018: The race to be fastest in Google's world
Purpose of the Study
• revealing the relationship between mobile page speeds and Google rankings
• highlighting where most value is to be gained from site speed optimization
• demonstrating the specifics of page speeds in the industries of eCommerce, finance,
health, media and travel
• showing how widespread the use of AMP is across different industries
• analyzing the data to show which kinds of AMP optimization are most relevant in
each industry
Mobile Speed Study 2018: A Searchmetrics Whitepaper
It is Searchmetrics’ mission to enable ever-increasing transparency for the modern
marketer. A big part of this mission is conducting analyses into the state of search and
content marketing, from SEO ranking factors to best practices and content strategies.
Data and analyses can be accessed in the Searchmetrics Knowledge Base and on the
Searchmetrics blog.
For marketers, 2018 is the year of mobile search, with Google beginning the roll-out of
its mobile-first indexing in March and confirming page speed’s influence as a mobile
ranking factor from July. Online marketers will only succeed if they understand mobile-
specific features of search engine optimization. The analysis in this Searchmetrics
whitepaper focuses on two such features, both of which are highly relevant in 2018:
Mobile Page Speed
The findings of this study will aid marketers in their mobile optimization efforts by:
Accelerated Mobile Pages (AMP)

4MOBILE SPEED STUDY 2018: The race to be fastest in Google's world
Background: Mobile Search in 2018
Mobile search has been on the rise for several years, but 2018 is the year where
mobile without a doubt has become the new standard for web search.
Mobile Page Speed as a Ranking Factor from July 2018
Mobile-First Indexing and AMP
In January 2018, Google announced on its webmaster blog its Speed Update, making
page speed a ranking factor from July 2018. This is a significant statement, as Google
is normally extremely coy about its ranking algorithm, and usually prefers to refer
to less tangible factors like “relevance” or “awesomeness”. If Google is promoting a
ranking factor this openly, then it certainly makes sense to pay attention.
As Google makes clear in its blogpost, this emphasis on page speed is part of its push
towards encouraging developers to focus on user experience. With page speed playing
such a central role in Google’s assessment of user experience, Searchmetrics decided
to conduct an analysis of the relationship between page speed and Google rankings.
The results are presented in this whitepaper.
The fact that page speed is becoming a ranking factor (only) for mobile searches
does not diminish its importance. In March 2018, Google confirmed that it had (finally)
begun its switch to mobile-first indexing, meaning that a page’s mobile version is
considered most important when assessing it for rankings. Globally, more searches
are made on mobile than desktop and so it is only logical for Google to prioritize users’
mobile needs.
As mobile becomes the primary form of search, mobile-specific initiatives grow in
importance. One of the biggest is Accelerated Mobile Pages (AMP), a framework
for building lean, lighting-fast pages for mobile devices. In its early days, AMP was
primarily used by news sites, but the uptake of the framework has since spread into
all corners of the internet. An investigation into AMP and its relevance in different
industries makes up the second part of this whitepaper.
5MOBILE SPEED STUDY 2018: The race to be fastest in Google's world
Synopsis: Executive Findings and Conclusions
This page summarizes the main findings of this paper.
1. Across all industries, there is a strong connection between mobile page speed and
Google ranking amongst pages ranking on positions 1 to 5 in the search results.
Near the top, pages load faster with each improvement in ranking position.
2. Mobile pages ranking on positions 1 to 5 load faster than those ranking 6 to 15.
3. If optimizing a page’s speed, significant benefits are only likely if a page can be
optimized to load in under two seconds.
4. Improvements to mobile page speed at the slower end of the spectrum, e.g. from
six to five seconds, are unlikely to have much impact.
5. Mobile page speeds do go up and down a bit across industries, but the general
trend is much the same across the board: Top 5 results are faster than 6 to 15.
6. Across all industries, Accelerated Mobile Pages are found on the first results pages
for three out of five (61%) keywords.
7. AMP is most common in media (87% of keywords), but is also found on over half of
SERPs in finance, eCommerce and travel.
8. AMP results are least common in the health industry, appearing on the first search
results page for just 35% of keywords.
9. Of all the different types of AMP integration, organic AMP pages are the most
common, appearing for 47% of searches.
10. AMP carousels are still primarily found in media, where 36% of results include a
mixed carousel and 14% a publisher carousel.
6MOBILE SPEED STUDY 2018: The race to be fastest in Google's world
There are several definitions of what it means for a page to be loaded. Common
metrics used include the time to first byte, first meaningful paint and first interactive.
Popular providers of page speed tools include Google Lighthouse, Webpagetest,
Pingdom or GTmetrix.
For any analysis of page load times, the most essential factor is that a consistent
approach is taken to ensure that results are comparable. For this study, load time is
defined as the time from sending the first request to the completion of the Document
Object Model (domComplete). This is the point when the browser has finished
processing the document. More information on domComplete can be found at
varvy.com.
Measuring the speed of websites is an imprecise science at the best of times. Internet
connections vary enormously, even within a designated standard like 3G or LTE.
Furthermore, numerous factors along the connection between searcher and server
can affect how long a page takes to load for a particular user at a particular time.
Therefore, if you are measuring the speed of your pages and those of your
competitors, then bear in mind that you will likely get different results, as they will
always depend on the connection being used.
In all cases, when testing page speeds, it is important that the connection is used is
stable so that the speeds of different pages can be compared with one another. This
study was conducted using a stable, high-speed connection.
When is a Page loaded?
Measuring Site Speed
Study Methodology – Measuring and Defining Page Speed
Before diving into the results of our analysis, it is necessary to establish two points:
7MOBILE SPEED STUDY 2018: The race to be fastest in Google's world
Mobile Page Speed – Results
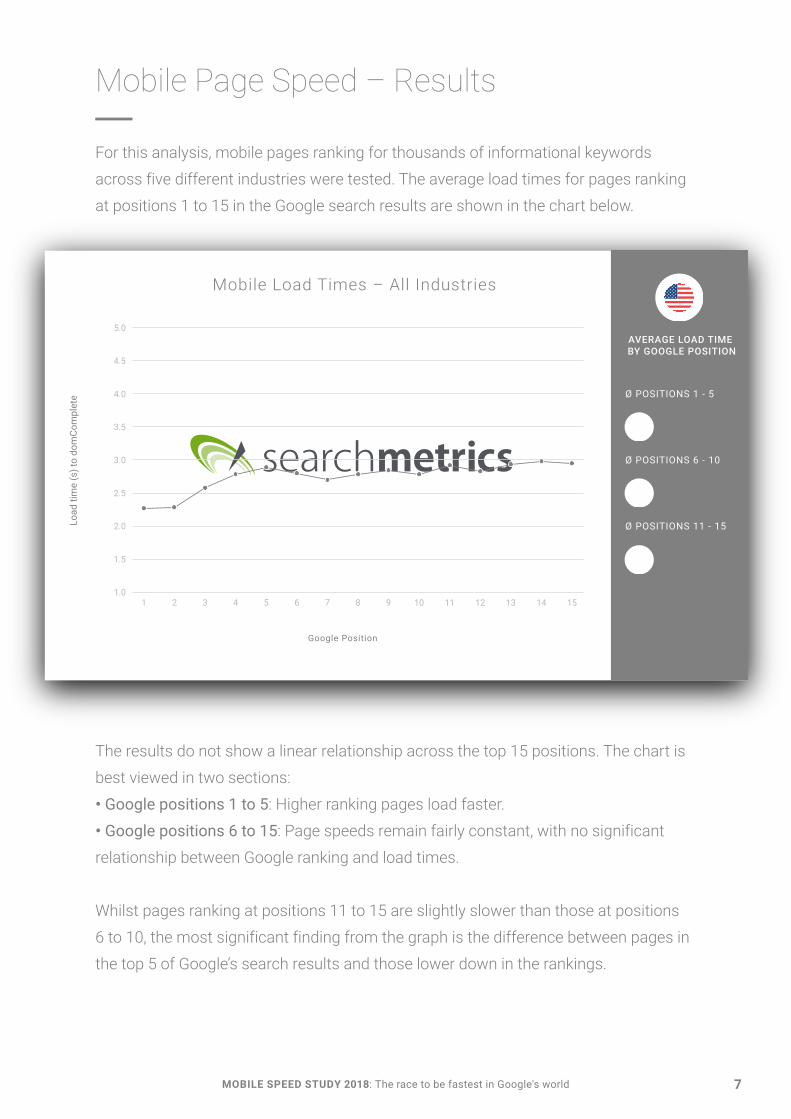
For this analysis, mobile pages ranking for thousands of informational keywords
across five different industries were tested. The average load times for pages ranking
at positions 1 to 15 in the Google search results are shown in the chart below.
The results do not show a linear relationship across the top 15 positions. The chart is
best viewed in two sections:
• Google positions 1 to 5: Higher ranking pages load faster.
• Google positions 6 to 15: Page speeds remain fairly constant, with no significant
relationship between Google ranking and load times.
Whilst pages ranking at positions 11 to 15 are slightly slower than those at positions
6 to 10, the most significant finding from the graph is the difference between pages in
the top 5 of Google’s search results and those lower down in the rankings.
AVERAGE LOAD TIME BY GOOGLE POSITION
Google Position
Load
tim
e (s
) to
dom
Com
plet
e
1 2 3 4 5 6 7 8 9 151413121110
Mobile Load Times – All Industries

8MOBILE SPEED STUDY 2018: The race to be fastest in Google's world
Mobile Page Speed – Explanations and Interpretations
Interpretation of ranking factors sometimes feels like walking blindly into a minefield.
But that’s what SEO professionals love to do. This page presents a range of possible
explanations of the page speed results, as provided by consultants from The
Searchmetrics Digital Strategies Group.
DIGITAL STRATEGIES GROUP
Lukas Krawieczek,
Senior SEO Consultant,
Searchmetrics Digital Strategies Group
Load time is one of the decisive factors for positions at the
top of the SERPs.
“As mobile websites become increasingly complex, including
the growing use of JavaScript elements and frameworks,
load time will definitely remain one of the decisive factors
determining the positions at the very top of the SERPs.
Interactive elements and frameworks push up the volume
of data websites need to load, but users’ expectations stay
the same. They want a page to be available in a fraction of a
second. Websites that ignore this are likely to see a negative
impact on their position in the SERPs.”
9MOBILE SPEED STUDY 2018: The race to be fastest in Google's world
Mobile Page Speed – Explanations and Interpretations
Niels Dahnke
Head of SEO/SEA/Social Media,
MADSACK Market Solutions GmbH
Felix Oey
Senior SEO Consultant
Searchmetrics Digital Strategies Group
Google pays particular attention to page speed on the top 3
ranking positions.
Why should Google rank you highly if you can’t even keep
up with users’ expectations?
„The top 5 positions get over 80% of all clicks, and users
tend to click on the first three links in the SERPs. This means
that Google pays particular attention to fast-loading pages
on these positions. Slower pages with relevant content will
generally make it to position 4 and below.”
“Your mobile load speed is as important as your content
quality and good usability. People always expect an
instantaneous answer from any mobile page. Why should
Google rank you highly if you can’t even keep up with users’
expectations?”

10MOBILE SPEED STUDY 2018: The race to be fastest in Google's world
Optimizing your Site – How fast does fast have to be?
A big part of successful SEO is knowing where your competition stands and where to
optimize first. This means setting priorities and understanding where you can achieve
the biggest impact for the most efficient output of resources.
To illustrate this in terms of page speed, the following graph shows how many pages
on the top 5 Google positions, and how many pages on positions 6 to 10, are loaded
within a certain time – i.e. within one second, two seconds, three seconds and so on.
Cumulative Percentage of Pages that Load within a Certain Time
1 2 3 4 5 6 7 8 9 10
Google Positions 1 to 5 Google Positions 6 to 10
Perc
enta
ge o
f pag
es th
at lo
ad w
ithin
tim
e (c
umul
ativ
e)
Load time (s) to domComplete

11MOBILE SPEED STUDY 2018: The race to be fastest in Google's world
• Almost a third (32%) of pages in the top 5 are loaded within a second, whereas under
one in four pages ranked 6 to 10 load this quickly
• Lower-ranking pages catch up quickly; the proportion of top 5 pages only remains
significantly higher than those ranked 6 to 10 for pages loading under 2 seconds.
• For pages that load in 5 or more seconds, there is almost no difference between
pages ranked 1-5 and those ranked 6-10.
This suggests that if your page ranks 6 to 10 and takes longer than five seconds to
load, increasing the speed slightly isn’t likely to have much impact. However, if you
can get your page loading under two seconds, then you may be able to improve your
chance of pushing into the top 5.
Note that these absolute times are based on our tests over a high-speed connection.
This shows that the main difference in load times between pages in the top 5 and
those in the lower half of the top 10 comes at the high end of the speed spectrum.
Optimizing your Site – How fast does fast have to be?
12MOBILE SPEED STUDY 2018: The race to be fastest in Google's world
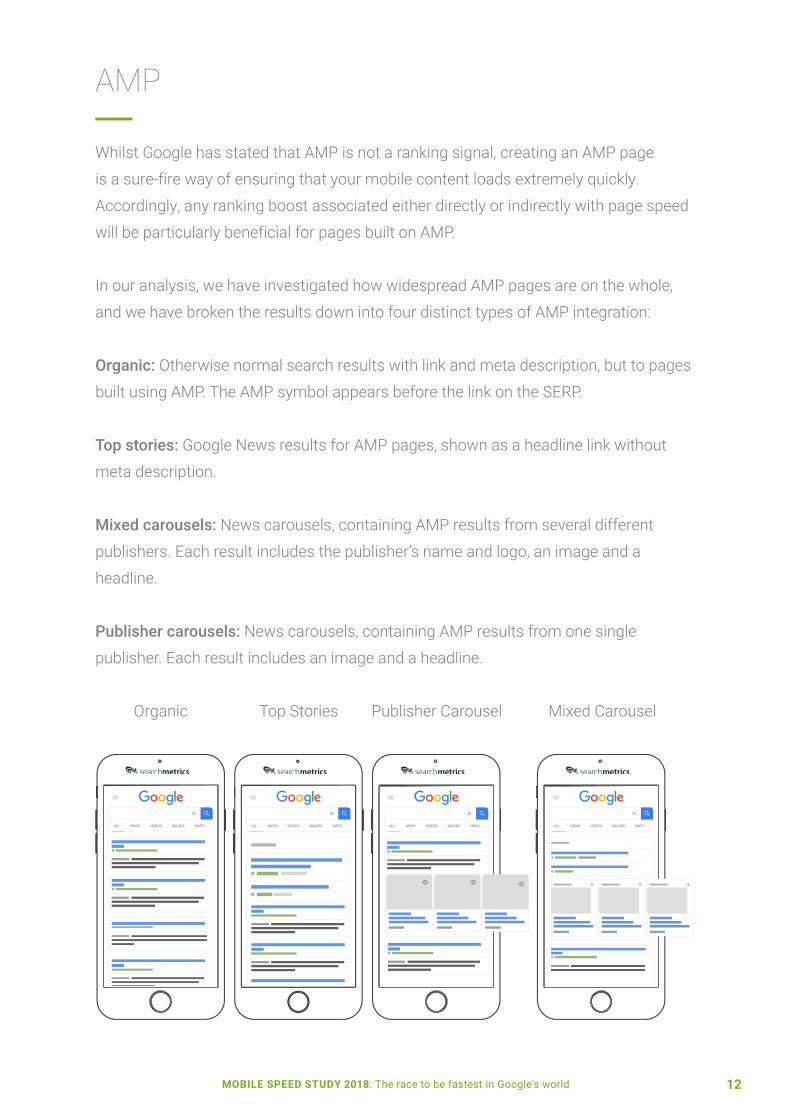
Whilst Google has stated that AMP is not a ranking signal, creating an AMP page
is a sure-fire way of ensuring that your mobile content loads extremely quickly.
Accordingly, any ranking boost associated either directly or indirectly with page speed
will be particularly beneficial for pages built on AMP.
In our analysis, we have investigated how widespread AMP pages are on the whole,
and we have broken the results down into four distinct types of AMP integration:
Organic: Otherwise normal search results with link and meta description, but to pages
built using AMP. The AMP symbol appears before the link on the SERP.
Top stories: Google News results for AMP pages, shown as a headline link without
meta description.
Mixed carousels: News carousels, containing AMP results from several different
publishers. Each result includes the publisher’s name and logo, an image and a
headline.
Publisher carousels: News carousels, containing AMP results from one single
publisher. Each result includes an image and a headline.
AMP
Organic Publisher CarouselTop Stories Mixed Carousel
13MOBILE SPEED STUDY 2018: The race to be fastest in Google's world
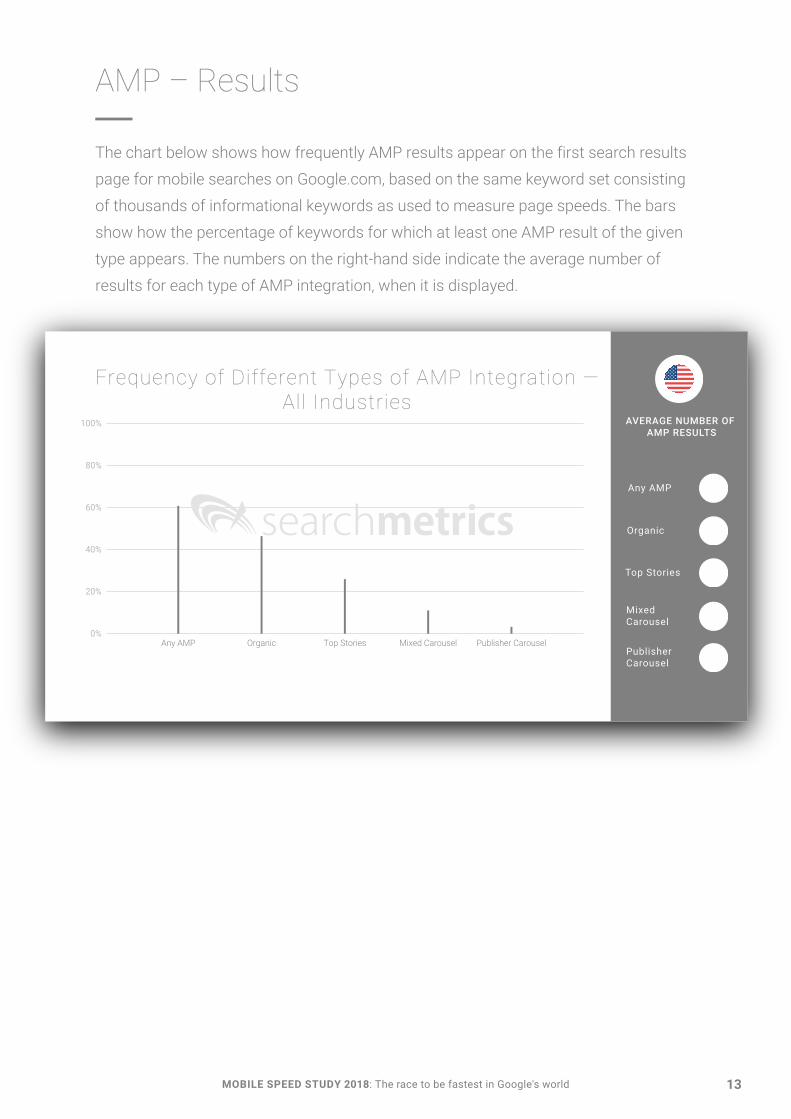
The chart below shows how frequently AMP results appear on the first search results
page for mobile searches on Google.com, based on the same keyword set consisting
of thousands of informational keywords as used to measure page speeds. The bars
show how the percentage of keywords for which at least one AMP result of the given
type appears. The numbers on the right-hand side indicate the average number of
results for each type of AMP integration, when it is displayed.
AMP – Results
Any AMP Organic Top Stories Mixed Carousel Publisher Carousel
AVERAGE NUMBER OF AMP RESULTS
Any AMP
Organic
Top Stories
Mixed Carousel
Publisher Carousel
Frequency of Different Types of AMP Integration — All Industries

14MOBILE SPEED STUDY 2018: The race to be fastest in Google's world
• Organic AMP results are the most frequent type, appearing for 47% of keywords
• Mixed carousels are found for 11% of keywords, whereas the rate is just 4% for
carousels occupied by a single publisher
• AMP top stories are displayed for around one in four searches (26%) and are
normally limited to 1 or 2 results
A first SERP with AMP has an average of 4.3 AMP results. This indicates strongly that
the use of Accelerated Mobile Pages is no longer limited to news sites and publishers.
A more detailed industry-by-industry breakdown of AMP results is given later in this
paper.
The main finding is that AMP results appear on the first search results page for over
three fifths – 61% – of keywords. Furthermore:
RESULTS AT A GLANCE – AMP ACROSS INDUSTRIES
AMP – Results
15MOBILE SPEED STUDY 2018: The race to be fastest in Google's world
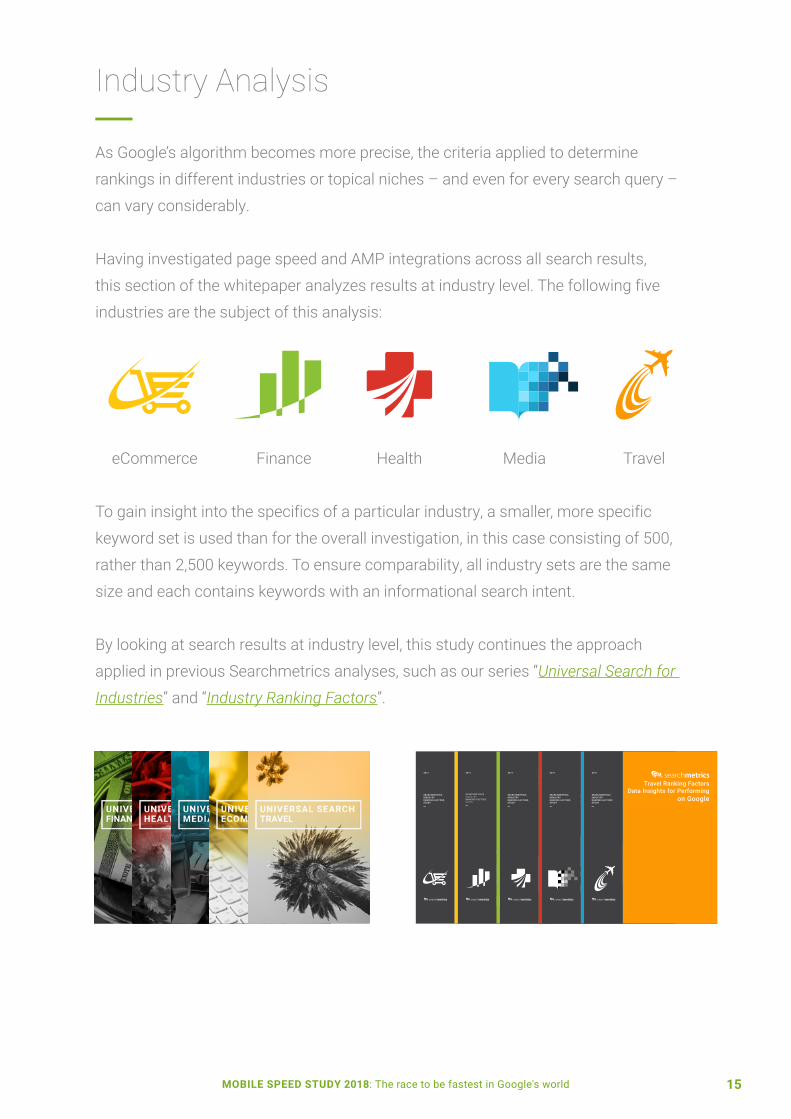
As Google’s algorithm becomes more precise, the criteria applied to determine
rankings in different industries or topical niches – and even for every search query –
can vary considerably.
Having investigated page speed and AMP integrations across all search results,
this section of the whitepaper analyzes results at industry level. The following five
industries are the subject of this analysis:
To gain insight into the specifics of a particular industry, a smaller, more specific
keyword set is used than for the overall investigation, in this case consisting of 500,
rather than 2,500 keywords. To ensure comparability, all industry sets are the same
size and each contains keywords with an informational search intent.
By looking at search results at industry level, this study continues the approach
applied in previous Searchmetrics analyses, such as our series “Universal Search for
Industries” and “Industry Ranking Factors”.
Industry Analysis
SEARCHMETRICSINDUSTRYRANKING FACTORSSTUDY
2017
E-Commerce Ranking FactorsData Insights for Performing
on Google
SEARCHMETRICSINDUSTRYRANKING FACTORSSTUDY
2017 SearchmetricsFinance Ranking FactorsData Insights for Performing
on GoogleSEARCHMETRICSINDUSTRYRANKING FACTORSSTUDY
2017
Health Ranking FactorsData Insights for Performing
on Google
Health Ranking Factors © Searchmetrics 20171
SEARCHMETRICSINDUSTRYRANKING FACTORSSTUDY
2017
Media Ranking FactorsData Insights for Performing
on Google
SEARCHMETRICSINDUSTRYRANKING FACTORSSTUDY
2017
Travel Ranking FactorsData Insights for Performing
on Google
Finance Health TraveleCommerce Media
16MOBILE SPEED STUDY 2018: The race to be fastest in Google's world
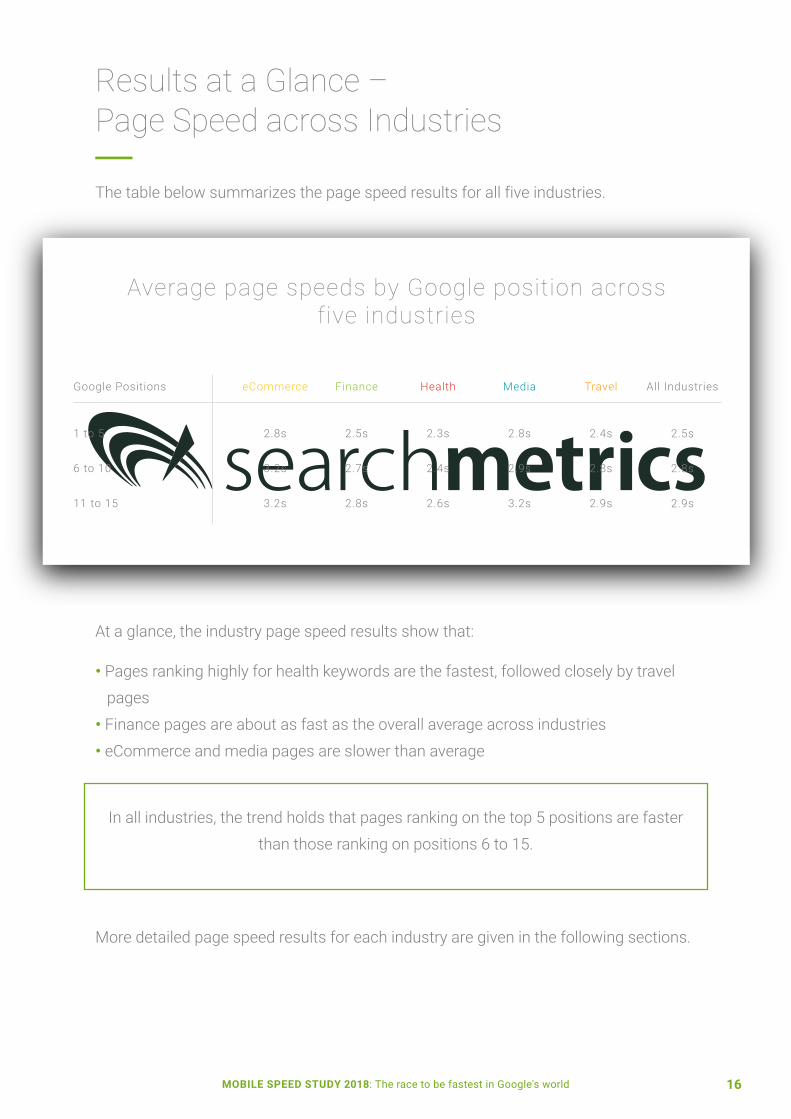
Results at a Glance – Page Speed across Industries
The table below summarizes the page speed results for all five industries.
• Pages ranking highly for health keywords are the fastest, followed closely by travel
pages
• Finance pages are about as fast as the overall average across industries
• eCommerce and media pages are slower than average
Average page speeds by Google position across five industries
Google Positions eCommerce Finance Health Media Travel All Industries
1 to 5
11 to 15
6 to 10
2.8s
3.2s
3.2s
2.5s
2.8s
2.7s
2.3s
2.6s
2.4s
2.8s
3.2s
2.9s
2.4s
2.9s
2.8s
2.5s
2.9s
2.8s
At a glance, the industry page speed results show that:
More detailed page speed results for each industry are given in the following sections.
In all industries, the trend holds that pages ranking on the top 5 positions are faster
than those ranking on positions 6 to 15.

17MOBILE SPEED STUDY 2018: The race to be fastest in Google's world
Results at a Glance – AMP across Industries
The table below summarizes the AMP results for all five industries, showing how
frequently the different AMP integrations appear.
Frequency of different types of AMP integration across five industries
Type of AMP Integration eCommerce Finance Health Media Travel All Industries
Any AMP
Publisher Carousel
Top Stories
Mixed Carousel
Organic
59%
2%
19%
8%
46%
67%
1%
19%
6%
60%
35%
<1%
13%
2%
25%
87%
14%
49%
36%
69%
56%
<1%
31%
4%
32%
61%
4%
26%
11%
47%
18MOBILE SPEED STUDY 2018: The race to be fastest in Google's world
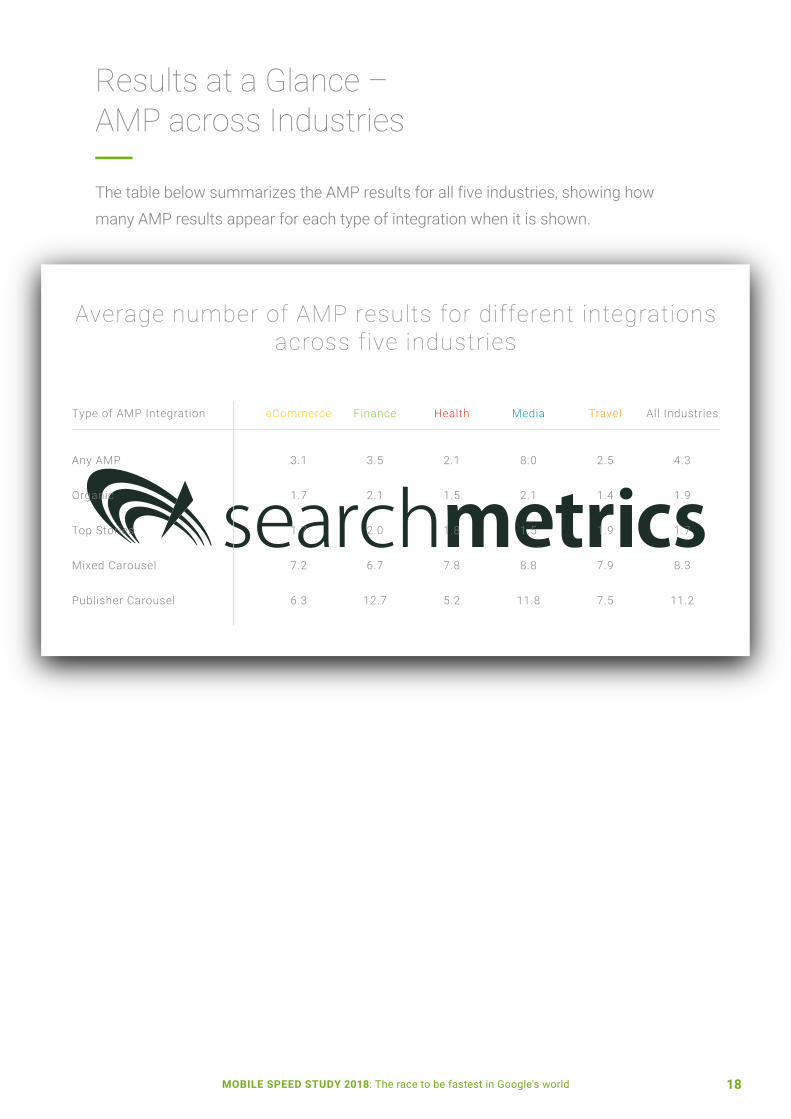
Results at a Glance – AMP across Industries
The table below summarizes the AMP results for all five industries, showing how
many AMP results appear for each type of integration when it is shown.
Average number of AMP results for different integrations across five industries
Type of AMP Integration eCommerce Finance Health Media Travel All Industries
Any AMP
Publisher Carousel
Top Stories
Mixed Carousel
Organic
3.1
6.3
1.7
7.2
1.7
3.5
12.7
2.0
6.7
2.1
2.1
5.2
1.8
7.8
1.5
8.0
11.8
1.5
8.8
2.1
2.5
7.5
1.9
7.9
1.4
4.3
11.2
1.7
8.3
1.9
19MOBILE SPEED STUDY 2018: The race to be fastest in Google's world
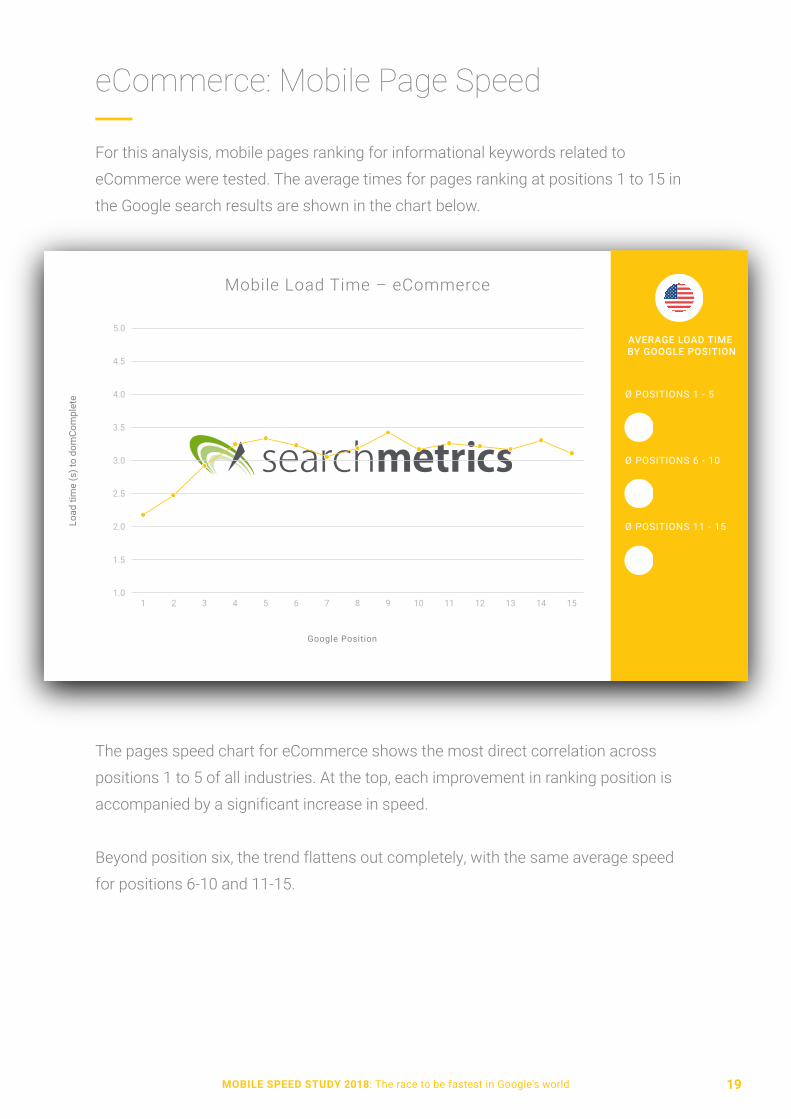
For this analysis, mobile pages ranking for informational keywords related to
eCommerce were tested. The average times for pages ranking at positions 1 to 15 in
the Google search results are shown in the chart below.
The pages speed chart for eCommerce shows the most direct correlation across
positions 1 to 5 of all industries. At the top, each improvement in ranking position is
accompanied by a significant increase in speed.
Beyond position six, the trend flattens out completely, with the same average speed
for positions 6-10 and 11-15.
eCommerce: Mobile Page Speed
AVERAGE LOAD TIME BY GOOGLE POSITION
Google Position
Load
tim
e (s
) to
dom
Com
plet
e
1 2 3 4 5 6 7 8 9 151413121110
Mobile Load Time – eCommerce
20MOBILE SPEED STUDY 2018: The race to be fastest in Google's world
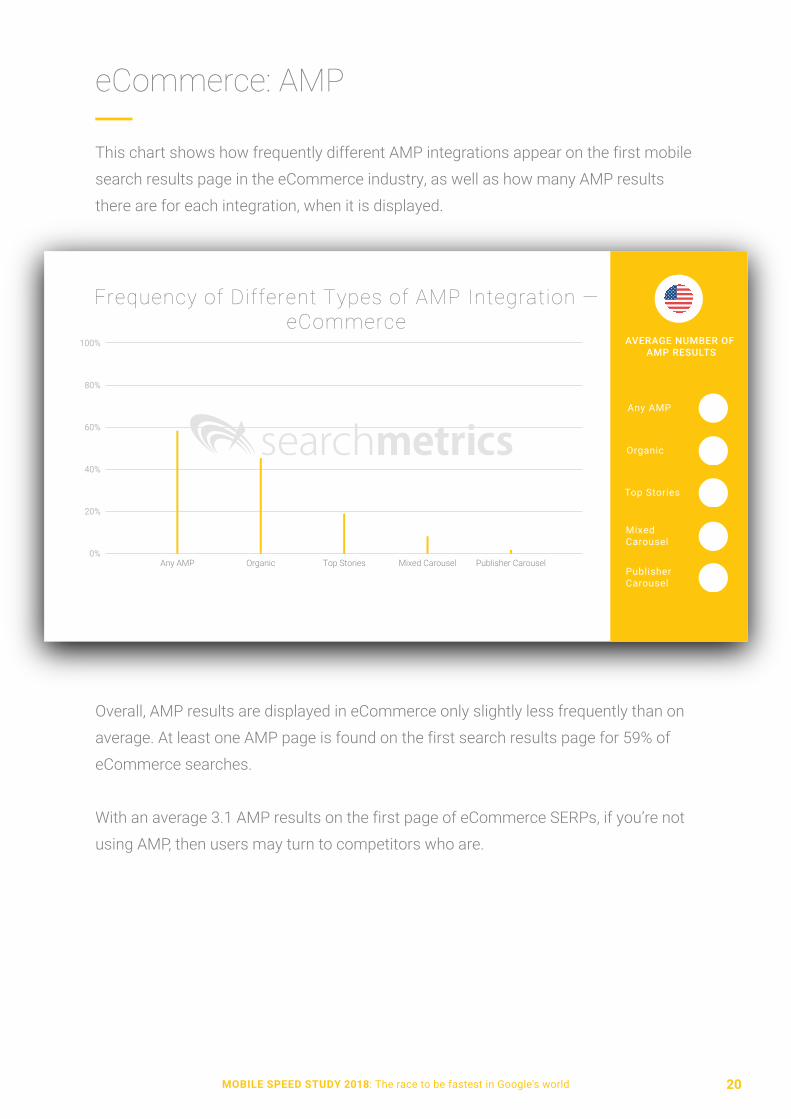
This chart shows how frequently different AMP integrations appear on the first mobile
search results page in the eCommerce industry, as well as how many AMP results
there are for each integration, when it is displayed.
Overall, AMP results are displayed in eCommerce only slightly less frequently than on
average. At least one AMP page is found on the first search results page for 59% of
eCommerce searches.
With an average 3.1 AMP results on the first page of eCommerce SERPs, if you’re not
using AMP, then users may turn to competitors who are.
eCommerce: AMP
Any AMP Organic Top Stories Mixed Carousel Publisher Carousel
Frequency of Different Types of AMP Integration — eCommerce
AVERAGE NUMBER OF AMP RESULTS
Any AMP
Organic
Top Stories
Mixed Carousel
Publisher Carousel
21MOBILE SPEED STUDY 2018: The race to be fastest in Google's world
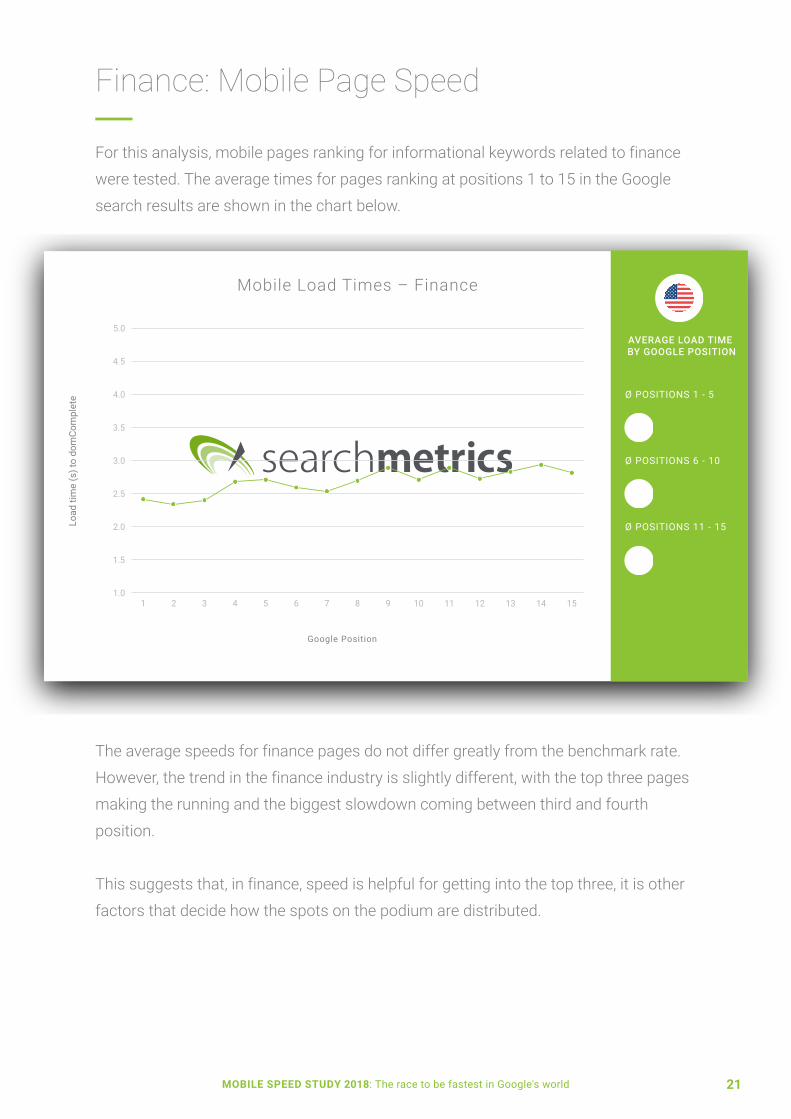
For this analysis, mobile pages ranking for informational keywords related to finance
were tested. The average times for pages ranking at positions 1 to 15 in the Google
search results are shown in the chart below.
The average speeds for finance pages do not differ greatly from the benchmark rate.
However, the trend in the finance industry is slightly different, with the top three pages
making the running and the biggest slowdown coming between third and fourth
position.
This suggests that, in finance, speed is helpful for getting into the top three, it is other
factors that decide how the spots on the podium are distributed.
Finance: Mobile Page Speed
AVERAGE LOAD TIME BY GOOGLE POSITION
Google Position
Load
tim
e (s
) to
dom
Com
plet
e
1 2 3 4 5 6 7 8 9 151413121110
Mobile Load Times – Finance
22MOBILE SPEED STUDY 2018: The race to be fastest in Google's world
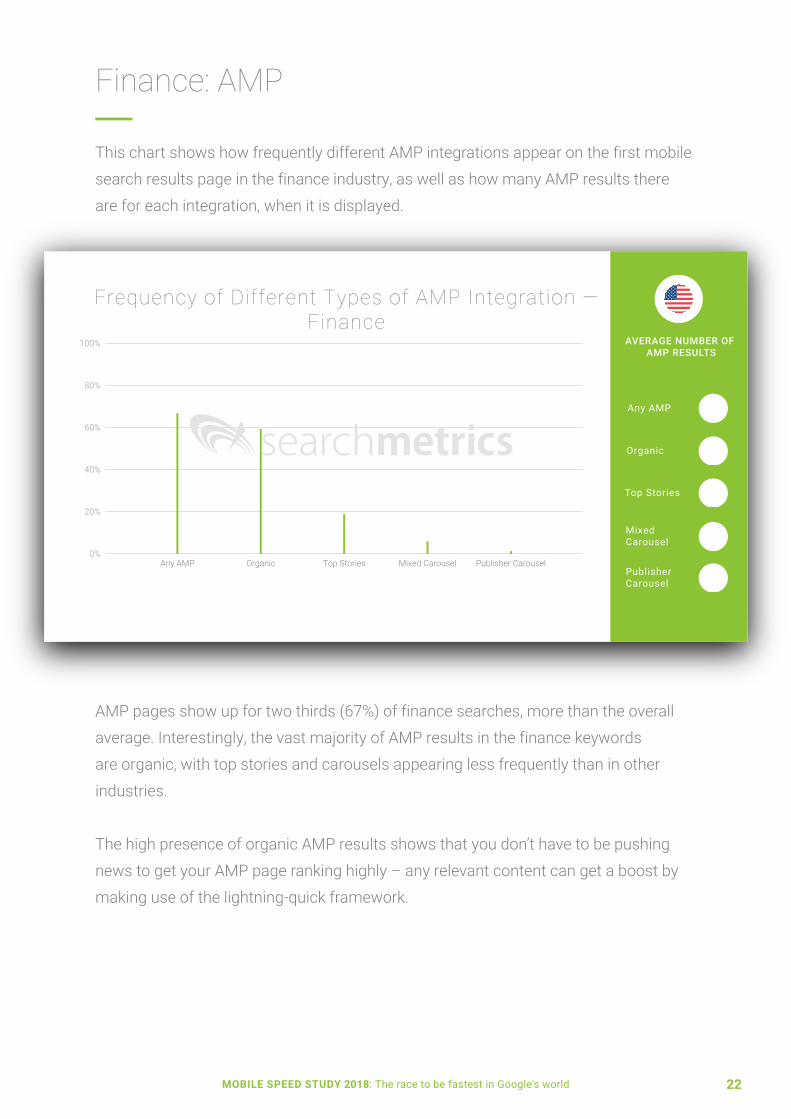
This chart shows how frequently different AMP integrations appear on the first mobile
search results page in the finance industry, as well as how many AMP results there
are for each integration, when it is displayed.
AMP pages show up for two thirds (67%) of finance searches, more than the overall
average. Interestingly, the vast majority of AMP results in the finance keywords
are organic, with top stories and carousels appearing less frequently than in other
industries.
The high presence of organic AMP results shows that you don’t have to be pushing
news to get your AMP page ranking highly – any relevant content can get a boost by
making use of the lightning-quick framework.
Finance: AMP
Any AMP Organic Top Stories Mixed Carousel Publisher Carousel
Frequency of Different Types of AMP Integration — Finance
AVERAGE NUMBER OF AMP RESULTS
Any AMP
Organic
Top Stories
Mixed Carousel
Publisher Carousel
23MOBILE SPEED STUDY 2018: The race to be fastest in Google's world
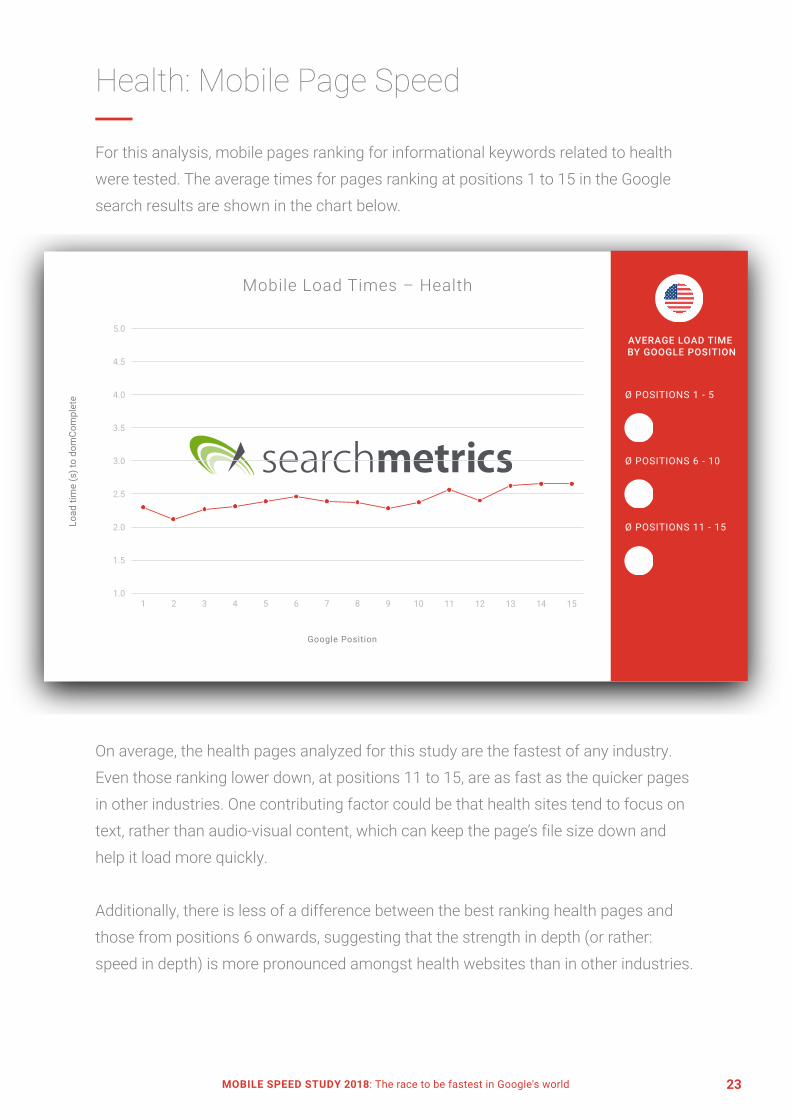
For this analysis, mobile pages ranking for informational keywords related to health
were tested. The average times for pages ranking at positions 1 to 15 in the Google
search results are shown in the chart below.
On average, the health pages analyzed for this study are the fastest of any industry.
Even those ranking lower down, at positions 11 to 15, are as fast as the quicker pages
in other industries. One contributing factor could be that health sites tend to focus on
text, rather than audio-visual content, which can keep the page’s file size down and
help it load more quickly.
Additionally, there is less of a difference between the best ranking health pages and
those from positions 6 onwards, suggesting that the strength in depth (or rather:
speed in depth) is more pronounced amongst health websites than in other industries.
Health: Mobile Page Speed
AVERAGE LOAD TIME BY GOOGLE POSITION
Google Position
Load
tim
e (s
) to
dom
Com
plet
e
1 2 3 4 5 6 7 8 9 151413121110
Mobile Load Times – Health

24MOBILE SPEED STUDY 2018: The race to be fastest in Google's world
This chart shows how frequently different AMP integrations appear on the first mobile
search results page in the health industry, as well as how many AMP results there are
for each integration, when it is displayed.
AMP pages appear less frequently for health searches than in any other industry. Only
35% of health keywords return any kind of AMP integration, with carousels almost
non-existent.
As health pages are also the fastest of any industry (on average), this means that
many websites are providing their users with content quickly, even without AMP.
However, with so few AMP results appearing on the first page, the ones that do appear
have a better chance of standing out.
Health: AMP
Any AMP Organic Top Stories Mixed Carousel Publisher Carousel
Frequency of Different Types of AMP Integration — Health
AVERAGE NUMBER OF AMP RESULTS
Any AMP
Organic
Top Stories
Mixed Carousel
Publisher Carousel
25MOBILE SPEED STUDY 2018: The race to be fastest in Google's world
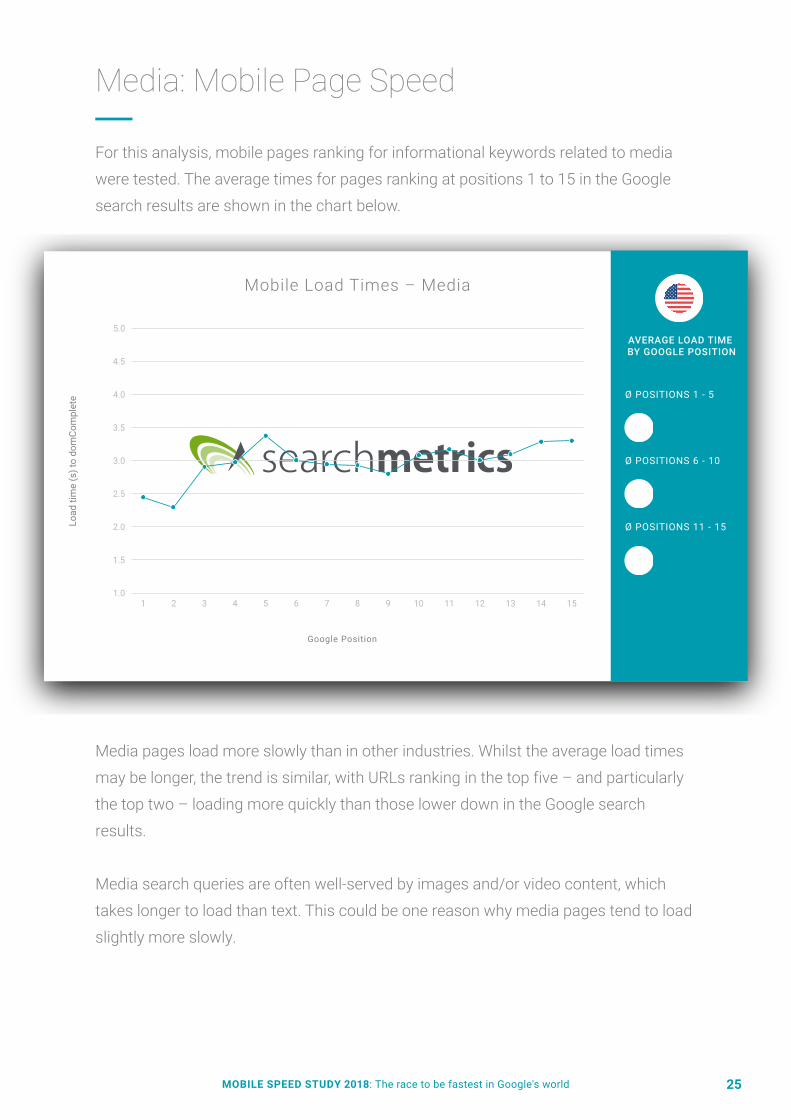
For this analysis, mobile pages ranking for informational keywords related to media
were tested. The average times for pages ranking at positions 1 to 15 in the Google
search results are shown in the chart below.
Media pages load more slowly than in other industries. Whilst the average load times
may be longer, the trend is similar, with URLs ranking in the top five – and particularly
the top two – loading more quickly than those lower down in the Google search
results.
Media search queries are often well-served by images and/or video content, which
takes longer to load than text. This could be one reason why media pages tend to load
slightly more slowly.
Media: Mobile Page Speed
AVERAGE LOAD TIME BY GOOGLE POSITION
Google Position
Load
tim
e (s
) to
dom
Com
plet
e
1 2 3 4 5 6 7 8 9 151413121110
Mobile Load Times – Media

26MOBILE SPEED STUDY 2018: The race to be fastest in Google's world
This chart shows how frequently different AMP integrations appear on the first mobile
search results page in the media industry, as well as how many AMP results there are
for each integration, when it is displayed.
As AMP has its origins with news portals and publishers, it is of little surprise to see
media sites making most frequent use of the AMP framework, with 87% of media
industry searches returning at least one AMP page on the first results page.
Not only is the overall rate much higher than in other industries, but carousels, both
mixed and those dedicated to a single publisher, appear much more often. This
impacts strongly on the total number of AMP results – with an average eight AMP
URLs appearing on the first results page (when there is any AMP at all).
The fact that non-AMP pages in the media industry tend to load more slowly than
average emphasizes the huge advantage to be gained for media websites that provide
AMP versions of their mobile pages.
Media: AMP
Any AMP Organic Top Stories Mixed Carousel Publisher Carousel
Frequency of Different Types of AMP Integration — Media
AVERAGE NUMBER OF AMP RESULTS
Any AMP
Organic
Top Stories
Mixed Carousel
Publisher Carousel

27MOBILE SPEED STUDY 2018: The race to be fastest in Google's world
For this analysis, mobile pages ranking for informational keywords related to travel
were tested. The average times for pages ranking at positions 1 to 15 in the Google
search results are shown in the chart below.
Travel pages ranking on the first five positions load more quickly than those lower
down the SERPs. This trend is much clearer than in other industries like finance or
health.
Overall, travel pages load more quickly than in all industries analyzed, except for
health. This suggests that leading websites in the travel agency pay attention to the
technical optimization of their pages better than in other sectors. Travel sites that don’t
optimize for site speed are likely to be left behind by the competition.
Travel: Mobile Page Speed
AVERAGE LOAD TIME BY GOOGLE POSITION
Google Position
Load
tim
e (s
) to
dom
Com
plet
e
1 2 3 4 5 6 7 8 9 151413121110
Mobile Load Times — Travel
28MOBILE SPEED STUDY 2018: The race to be fastest in Google's world
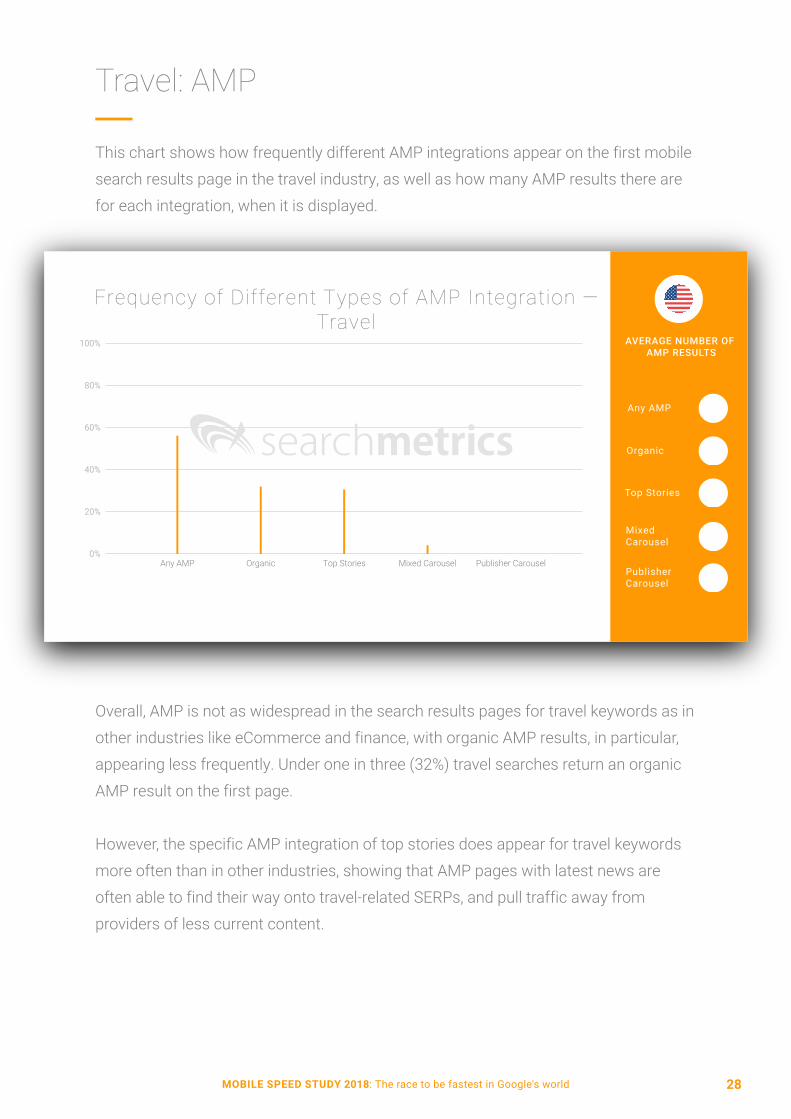
This chart shows how frequently different AMP integrations appear on the first mobile
search results page in the travel industry, as well as how many AMP results there are
for each integration, when it is displayed.
Overall, AMP is not as widespread in the search results pages for travel keywords as in
other industries like eCommerce and finance, with organic AMP results, in particular,
appearing less frequently. Under one in three (32%) travel searches return an organic
AMP result on the first page.
However, the specific AMP integration of top stories does appear for travel keywords
more often than in other industries, showing that AMP pages with latest news are
often able to find their way onto travel-related SERPs, and pull traffic away from
providers of less current content.
Travel: AMP
Any AMP Organic Top Stories Mixed Carousel Publisher Carousel
Frequency of Different Types of AMP Integration — Travel
AVERAGE NUMBER OF AMP RESULTS
Any AMP
Organic
Top Stories
Mixed Carousel
Publisher Carousel

1100 Park Place
Suite 150
San Mateo, CA 94403
+1 (866) 411 9494
If you have any questions regarding this whitepaper or the Searchmetrics SuiteTM, please do not hesitate to contact us at:


