Training Course on Short -term Business Statistics, Pakistan Bureau of Statistics, 5-7 Nov 2012 Abd Latib Talib - Department of Statistics Malaysia 1 Short-term Business Statistics Seasonal Adjustment
Transcript
Training Course on Short -term Business Statistics,
Pakistan Bureau of Statistics, 5-7 Nov 2012Abd Latib Talib - Department of Statistics Malaysia 1
Short-term Business Statistics
Seasonal Adjustment
Training Course on Short -term Business Statistics,
Pakistan Bureau of Statistics, 5-7 Nov 2012Abd Latib Talib - Department of Statistics Malaysia2
•First Day
• Overview of BCI
• Malaysia BCI
•Time series Decomposition
• Seasonal Adjustment
• Second Day
• Indicators selection
• The Composite Index
• The Diffusion Index
Outline
Training Course on Short -term Business Statistics,
Pakistan Bureau of Statistics, 5-7 Nov 2012Abd Latib Talib - Department of Statistics Malaysia
3
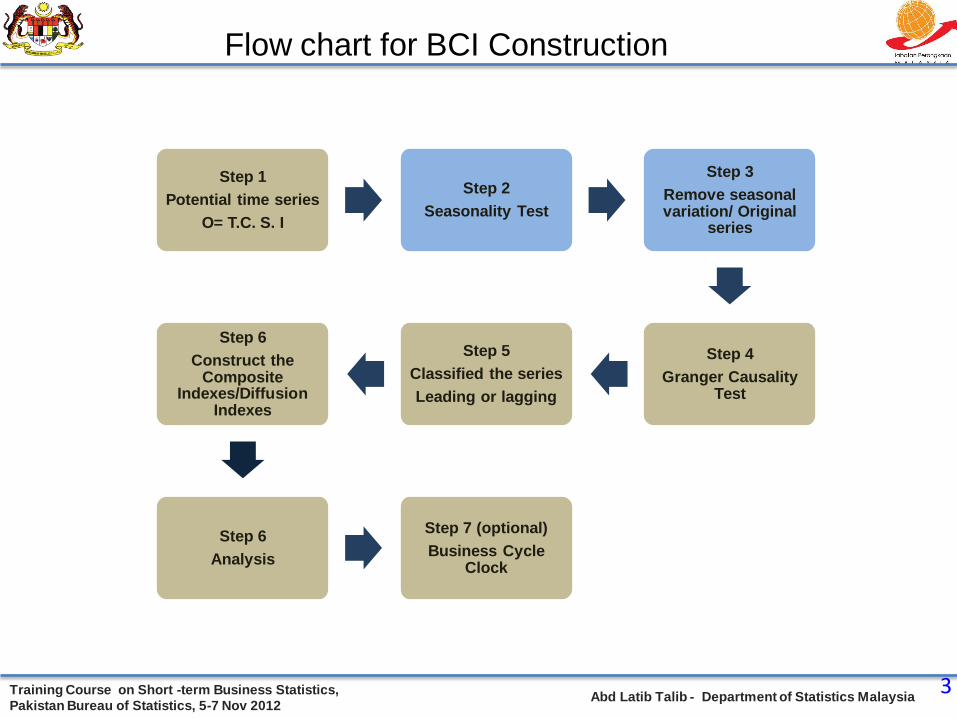
Step 1
Potential time series
O= T.C. S. I
Step 2
Seasonality Test
Step 3
Remove seasonal variation/ Original
series
Step 4
Granger Causality Test
Step 5
Classified the series
Leading or lagging
Step 6
Construct the Composite
Indexes/Diffusion Indexes
Step 6
Analysis
Step 7 (optional)
Business Cycle Clock
Flow chart for BCI Construction
Training Course on Short -term Business Statistics,
Pakistan Bureau of Statistics, 5-7 Nov 2012Abd Latib Talib - Department of Statistics Malaysia
INTRODUCTION
The time series components discussed earlier can be
separated using the decomposition method /software.
In practice, researchers only separate the seasonal
component in the data series for analysis purpose.
While, for the purpose of short-term analysis, most
researchers also separate the trend component of the
data series.
4
Training Course on Short -term Business Statistics,
Pakistan Bureau of Statistics, 5-7 Nov 2012Abd Latib Talib - Department of Statistics Malaysia
5
Seasonal factors only occur on a monthly and
quarterly time series data.
Usually, the seasonal element exist in the data of
production, sales, income/revenue and prices.
It is important to note that, not all monthly/ quarterly
time series data (ii) should be seasonal adjustment.
The seasonality test must be made before deciding
to implement a series of seasonality adjustment.
INTRODUCTION
Training Course on Short -term Business Statistics,
Pakistan Bureau of Statistics, 5-7 Nov 2012Abd Latib Talib - Department of Statistics Malaysia
6
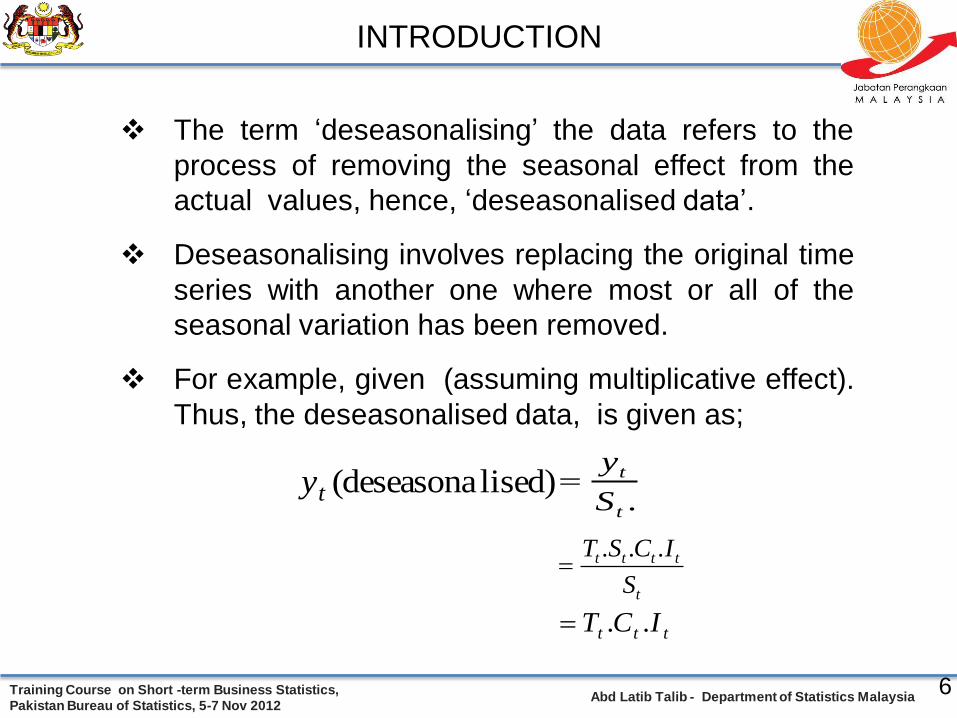
The term ‘deseasonalising’ the data refers to the
process of removing the seasonal effect from the
actual values, hence, ‘deseasonalised data’.
Deseasonalising involves replacing the original time
series with another one where most or all of the
seasonal variation has been removed.
For example, given (assuming multiplicative effect).
Thus, the deseasonalised data, is given as;
lised)(deseasonaty.t
t
S
y
t
tttt
S
ICST ...
ttt ICT ..
INTRODUCTION
Training Course on Short -term Business Statistics,
Pakistan Bureau of Statistics, 5-7 Nov 2012Abd Latib Talib - Department of Statistics Malaysia
7
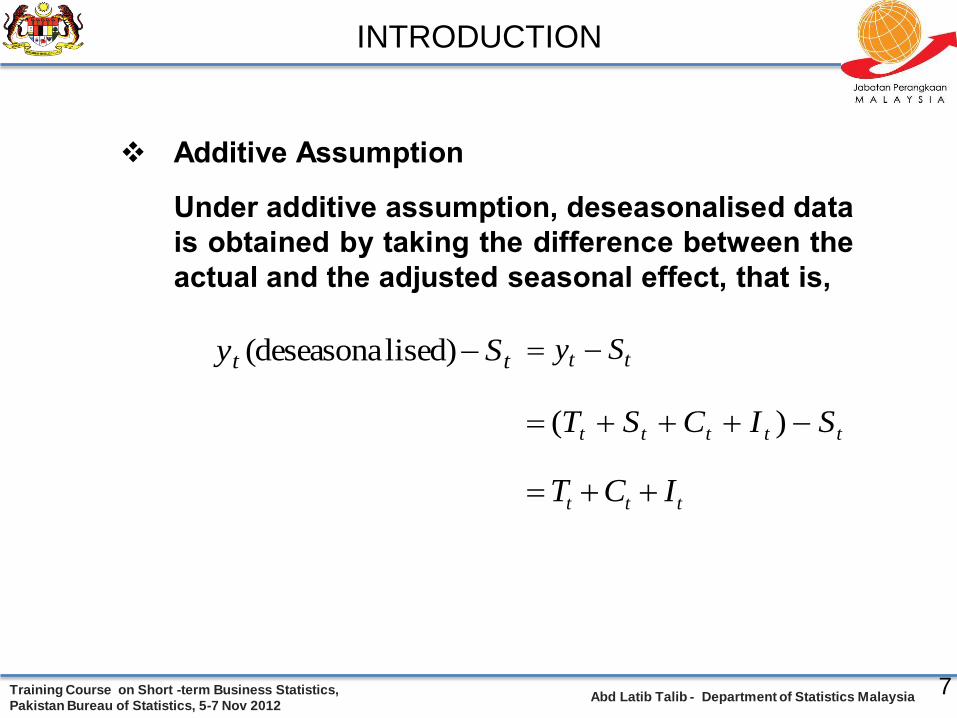
Additive Assumption
Under additive assumption, deseasonalised data
is obtained by taking the difference between the
actual and the adjusted seasonal effect, that is,
tt Sy lised)(deseasona tt Sy
ttttt SICST )(
ttt ICT
INTRODUCTION
Training Course on Short -term Business Statistics,
Pakistan Bureau of Statistics, 5-7 Nov 2012Abd Latib Talib - Department of Statistics Malaysia
WHY DO WE WANT
SEASONALLY ADJUSTED DATA?
8
“…Seasonal movements can make features
difficult or impossible to see…”
Training Course on Short -term Business Statistics,
Pakistan Bureau of Statistics, 5-7 Nov 2012Abd Latib Talib - Department of Statistics Malaysia
PURPOSE OF
SEASONAL ADJUSTMENT
9
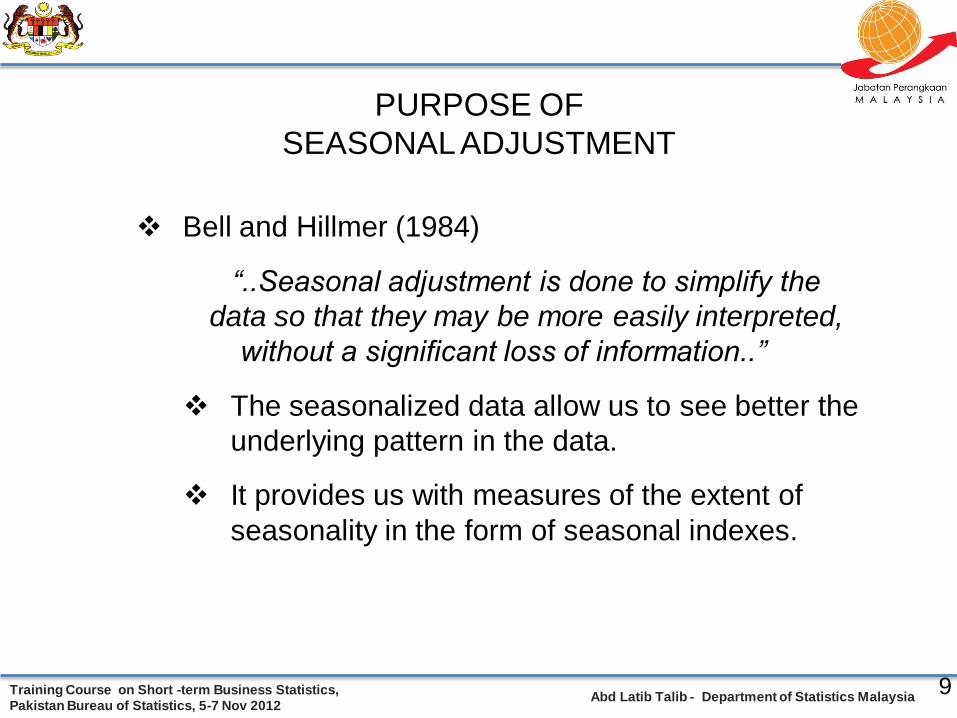
Bell and Hillmer (1984)
“..Seasonal adjustment is done to simplify the
data so that they may be more easily interpreted,
without a significant loss of information..”
The seasonalized data allow us to see better the
underlying pattern in the data.
It provides us with measures of the extent of
seasonality in the form of seasonal indexes.
Training Course on Short -term Business Statistics,
Pakistan Bureau of Statistics, 5-7 Nov 2012Abd Latib Talib - Department of Statistics Malaysia
10
80
100
120
1990:01
1991:01
1992:01
1993:01
1994:01
1995:01
1996:01
1997:01
1998:01
1999:01
2000:01
2001:01
2002:01
2003:01
2004:01
2005:01
2006:01
2007:01
2008:01
2009:01
2010:01
2011:01
2012:01
P
1/ 08
T
3/ 09
P
1/ 01
T
2/ 02
P
12/ 97
T
11/ 98
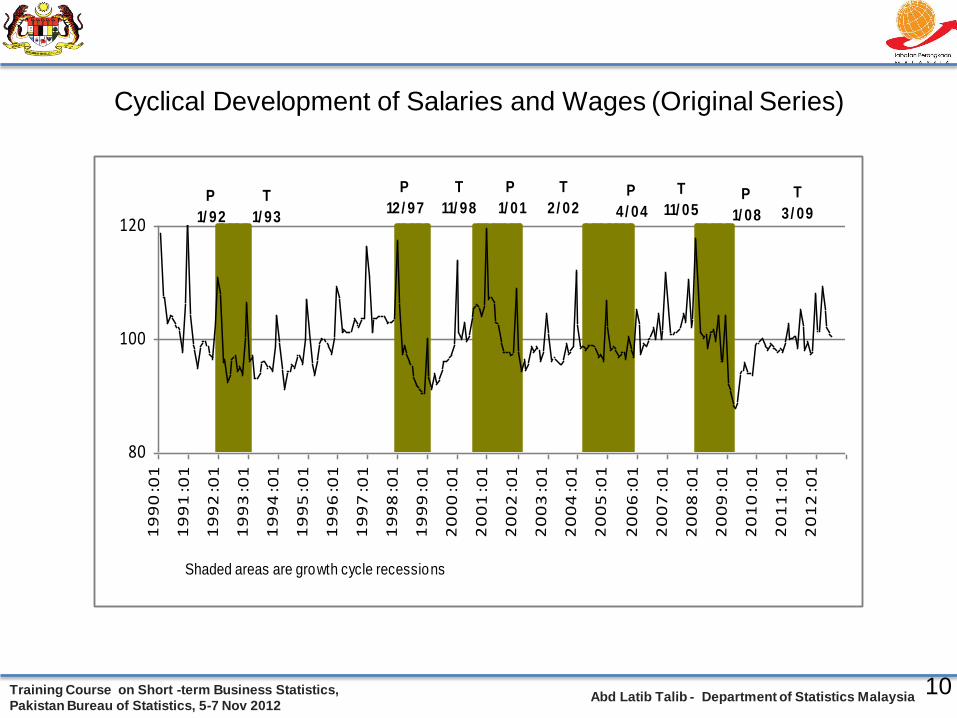
Shaded areas are growth cycle recessions
P
1/ 92
T
1/ 93
P
4/ 04
T
11/ 05
Cyclical Development of Salaries and Wages (Original Series)
Training Course on Short -term Business Statistics,
Pakistan Bureau of Statistics, 5-7 Nov 2012Abd Latib Talib - Department of Statistics Malaysia
11
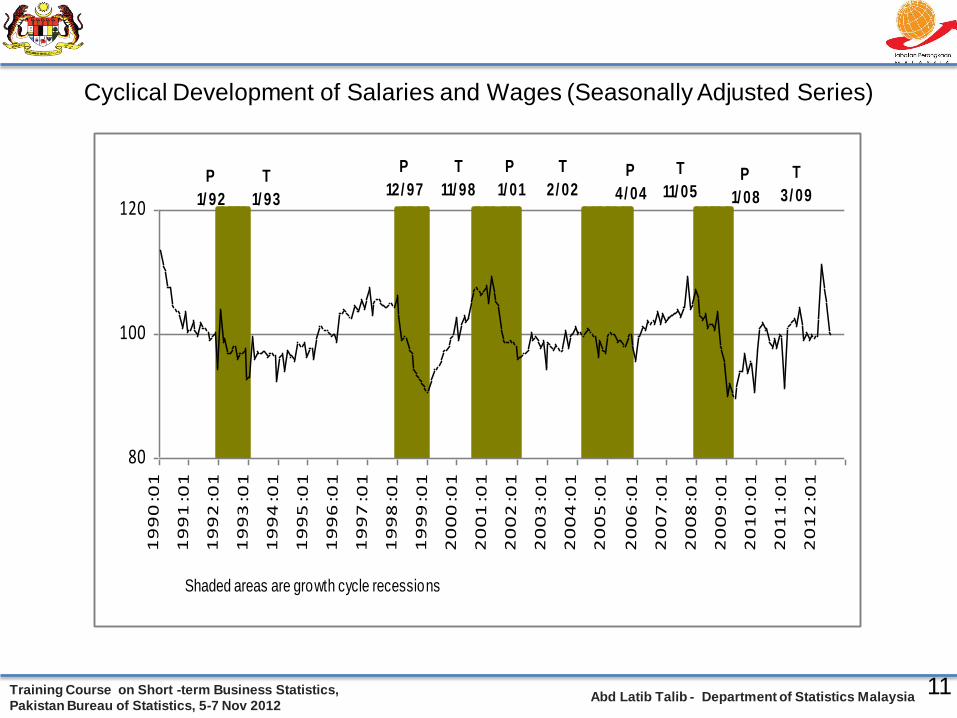
Cyclical Development of Salaries and Wages (Seasonally Adjusted Series)
80
100
120
1990:01
1991:01
1992:01
1993:01
1994:01
1995:01
1996:01
1997:01
1998:01
1999:01
2000:01
2001:01
2002:01
2003:01
2004:01
2005:01
2006:01
2007:01
2008:01
2009:01
2010:01
2011:01
2012:01
P
1/ 08
T
3/ 09
P
1/ 01
T
2/ 02
P
12/ 97
T
11/ 98
Shaded areas are growth cycle recessions
P
1/ 92
T
1/ 93
P
4/ 04
T
11/ 05
Training Course on Short -term Business Statistics,
Pakistan Bureau of Statistics, 5-7 Nov 2012Abd Latib Talib - Department of Statistics Malaysia
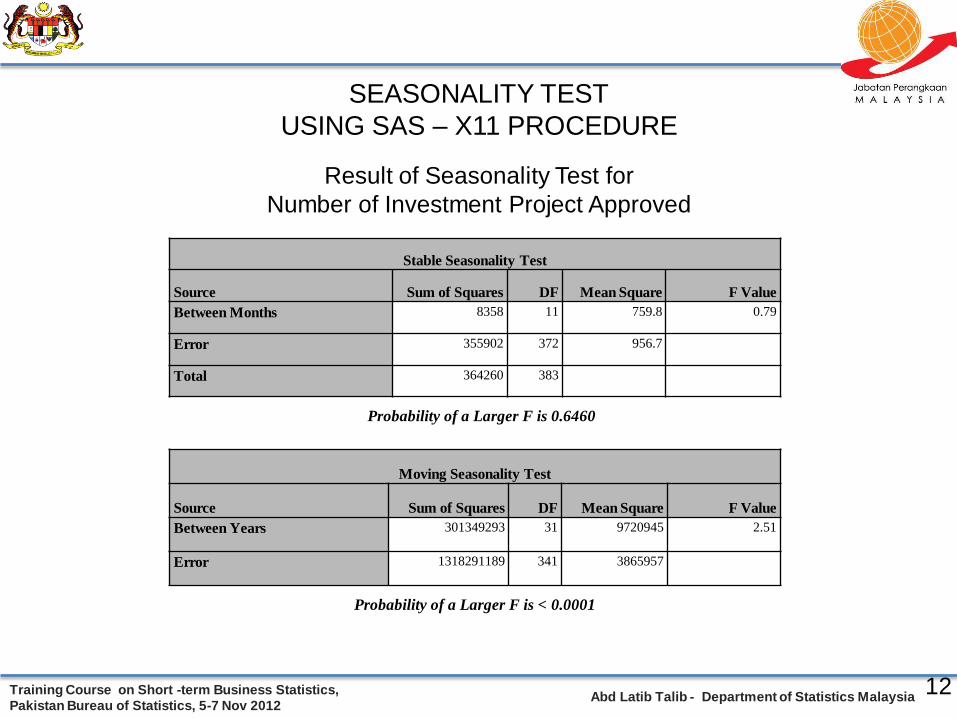
SEASONALITY TEST
USING SAS – X11 PROCEDURE
12
Probability of a Larger F is < 0.0001
Result of Seasonality Test for
Number of Investment Project Approved
Stable Seasonality Test
Source Sum of Squares DF Mean Square F Value
Between Months 8358 11 759.8 0.79
Error 355902 372 956.7
Total 364260 383
Probability of a Larger F is 0.6460
Moving Seasonality Test
Source Sum of Squares DF Mean Square F Value
Between Years 301349293 31 9720945 2.51
Error 1318291189 341 3865957
Training Course on Short -term Business Statistics,
Pakistan Bureau of Statistics, 5-7 Nov 2012Abd Latib Talib - Department of Statistics Malaysia
13
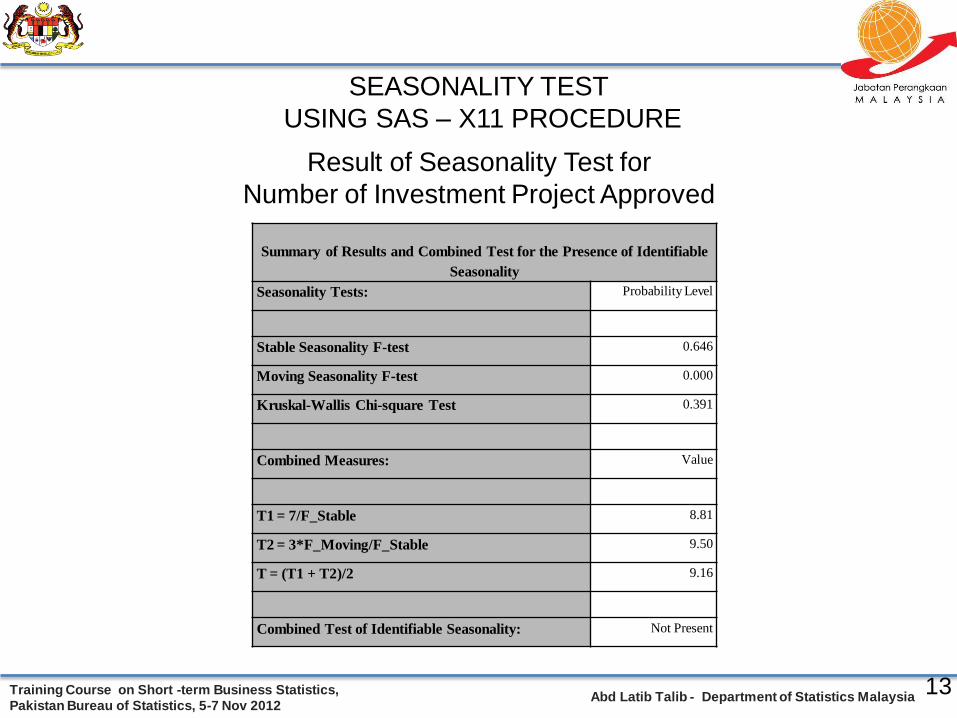
SEASONALITY TEST
USING SAS – X11 PROCEDURE
Result of Seasonality Test for
Number of Investment Project Approved
Summary of Results and Combined Test for the Presence of Identifiable
Seasonality
Seasonality Tests: Probability Level
Stable Seasonality F-test 0.646
Moving Seasonality F-test 0.000
Kruskal-Wallis Chi-square Test 0.391
Combined Measures: Value
T1 = 7/F_Stable 8.81
T2 = 3*F_Moving/F_Stable 9.50
T = (T1 + T2)/2 9.16
Combined Test of Identifiable Seasonality: Not Present
Training Course on Short -term Business Statistics,
Pakistan Bureau of Statistics, 5-7 Nov 2012Abd Latib Talib - Department of Statistics Malaysia
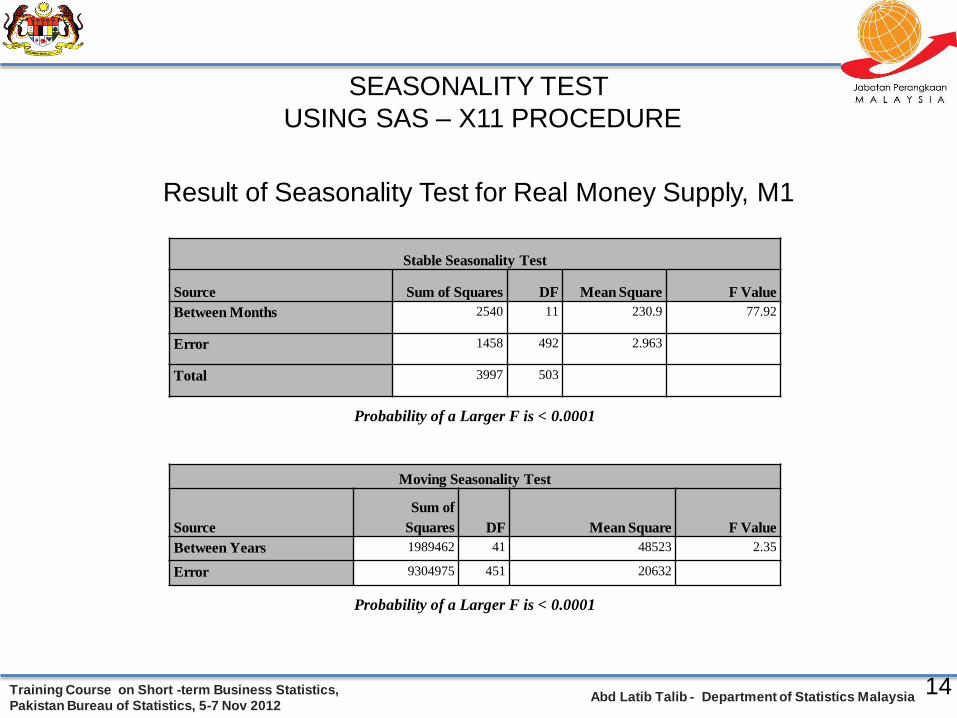
SEASONALITY TEST
USING SAS – X11 PROCEDURE
14
Stable Seasonality Test
Source Sum of Squares DF Mean Square F Value
Between Months 2540 11 230.9 77.92
Error 1458 492 2.963
Total 3997 503
Probability of a Larger F is < 0.0001
Moving Seasonality Test
Source
Sum of
Squares DF Mean Square F Value
Between Years 1989462 41 48523 2.35
Error 9304975 451 20632
Probability of a Larger F is < 0.0001
Result of Seasonality Test for Real Money Supply, M1
Training Course on Short -term Business Statistics,
Pakistan Bureau of Statistics, 5-7 Nov 2012Abd Latib Talib - Department of Statistics Malaysia 15
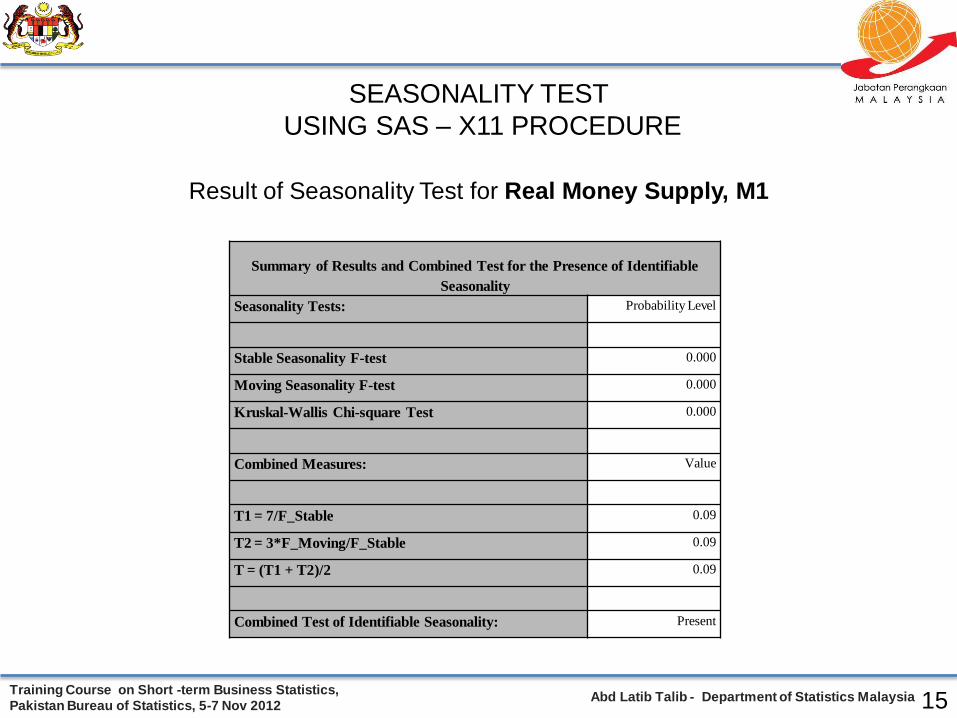
Summary of Results and Combined Test for the Presence of Identifiable
Seasonality
Seasonality Tests: Probability Level
Stable Seasonality F-test 0.000
Moving Seasonality F-test 0.000
Kruskal-Wallis Chi-square Test 0.000
Combined Measures: Value
T1 = 7/F_Stable 0.09
T2 = 3*F_Moving/F_Stable 0.09
T = (T1 + T2)/2 0.09
Combined Test of Identifiable Seasonality: Present
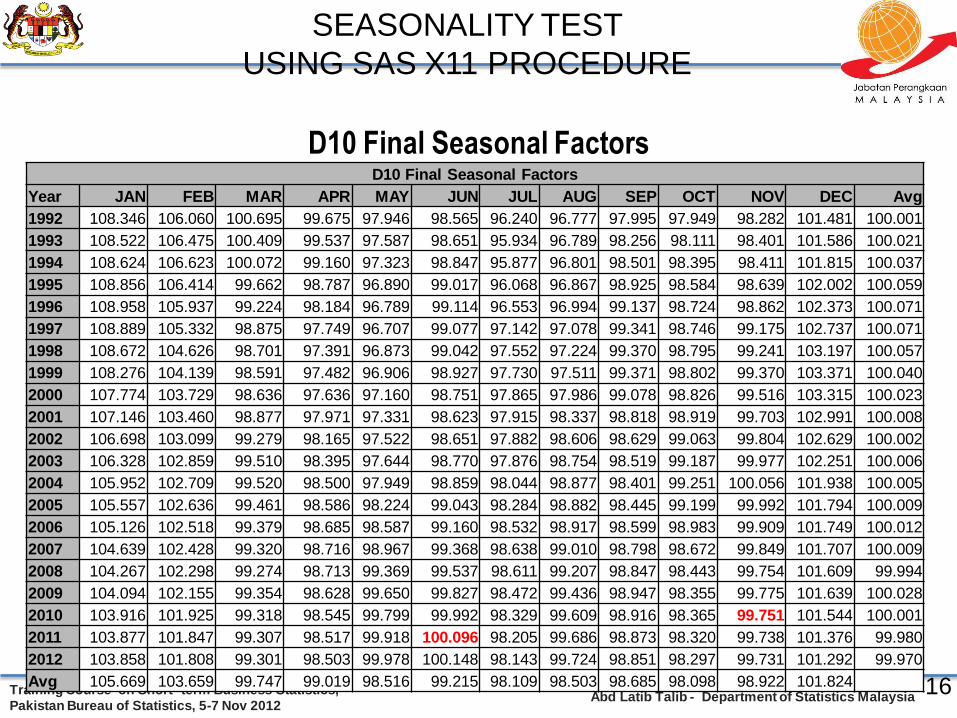
SEASONALITY TEST
USING SAS – X11 PROCEDURE
Result of Seasonality Test for Real Money Supply, M1
Training Course on Short -term Business Statistics,
Pakistan Bureau of Statistics, 5-7 Nov 2012Abd Latib Talib - Department of Statistics Malaysia
16
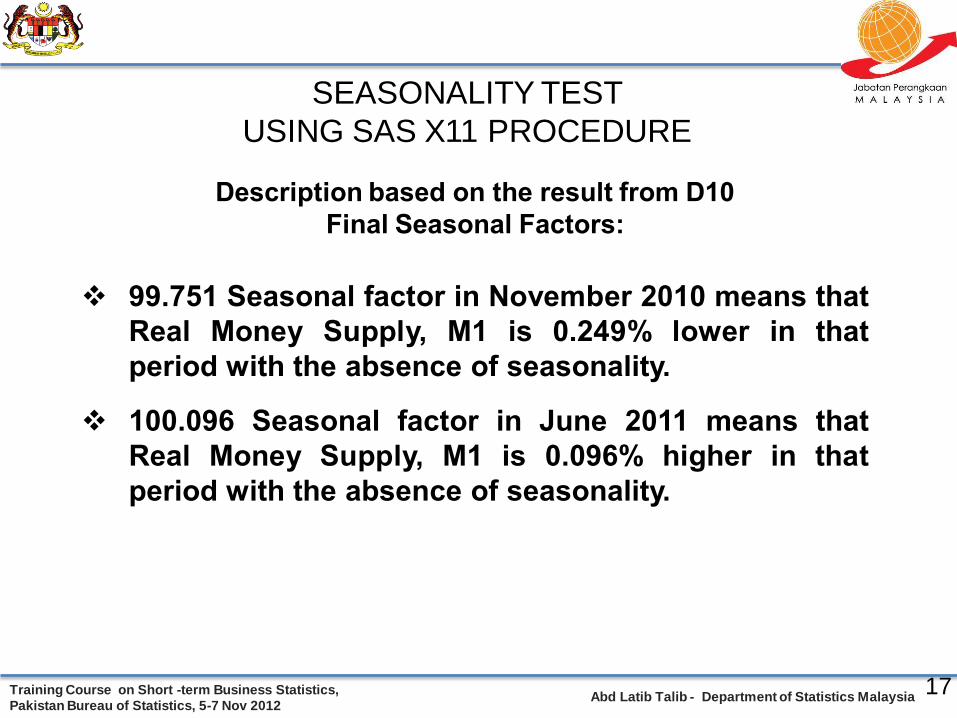
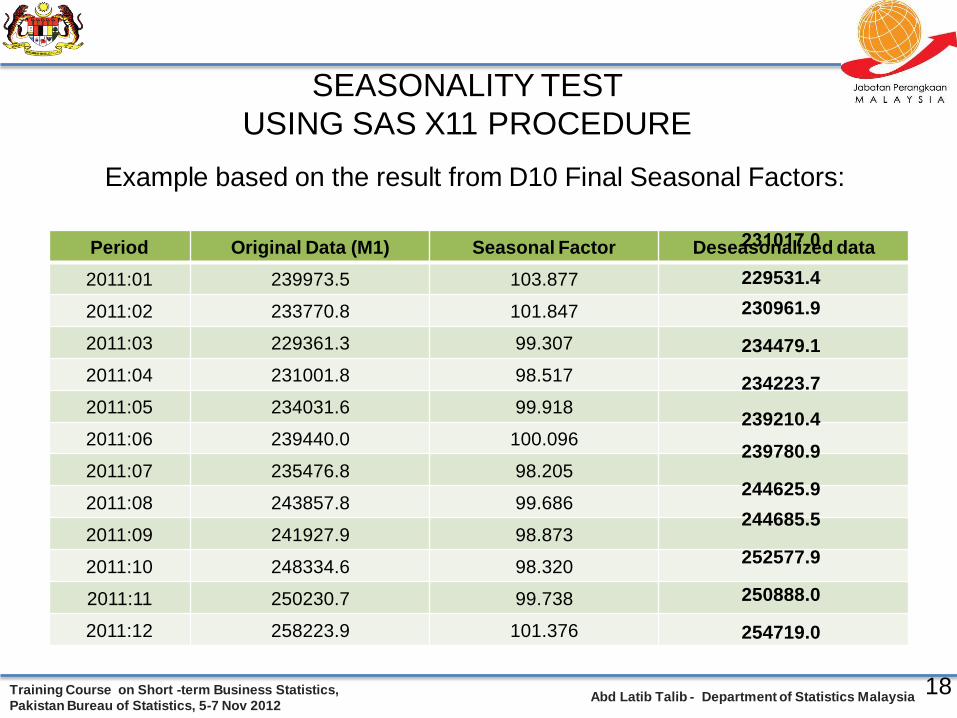
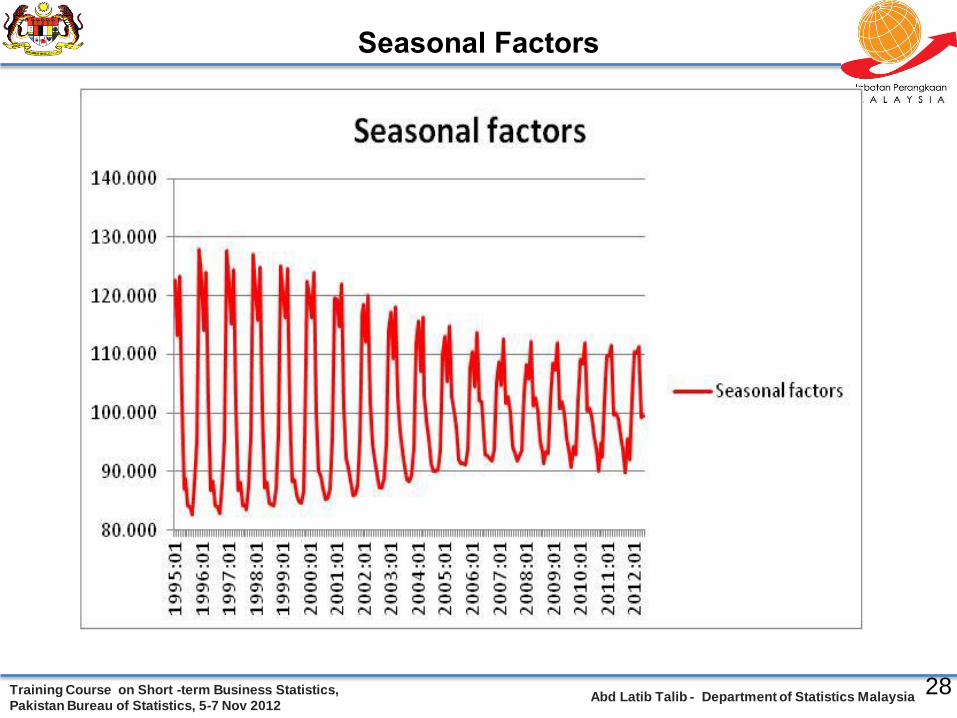
D10 Final Seasonal FactorsD10 Final Seasonal Factors
Year JAN FEB MAR APR MAY JUN JUL AUG SEP OCT NOV DEC Avg