Seasonal cycle of circulation in the Antarctic Peninsula and the off-shelf transport of shelf waters into southern Drake Passage and Scotia Sea Mingshun Jiang a,n , Matthew A. Charette b , Christopher I. Measures c , Yiwu Zhu a , Meng Zhou a a Department of Environmental, Earth and Ocean Sciences, University of Massachusetts Boston, 100 Morrissey Blvd., Boston, MA 02125, USA b Department of Marine Chemistry and Biogeochemistry, Woods Hole Oceanographic Institution, Woods Hole, MA 02543, USA c Department of Oceanography, University of Hawaii, Honolulu, HI 96822, USA article info Keywords: Model Circulation Antarctic Peninsula Antarctic Circumpolar Current Elephant Island Off-shelf transport Fe Drake Passage Southern Scotia Sea abstract The seasonal cycle of circulation and transport in the Antarctic Peninsula shelf region is investigated using a high-resolution ( 2 km) regional model based on the Regional Oceanic Modeling System (ROMS). The model also includes a naturally occurring tracer with a strong source over the shelf (radium isotope 228 Ra, t 1/2 ¼5.8 years) to investigate the sediment Fe input and its transport. The model is spun-up for three years using climatological boundary and surface forcing and then run for the 2004– 2006 period using realistic forcing. Model results suggest a persistent and coherent circulation system throughout the year consisting of several major components that converge water masses from various sources toward Elephant Island. These currents are largely in geostrophic balance, driven by surface winds, topographic steering, and large-scale forcing. Strong off-shelf transport of the Fe-rich shelf waters takes place over the northeastern shelf/slope of Elephant Island, driven by a combination of topographic steering, extension of shelf currents, and strong horizontal mixing between the ACC and shelf waters. These results are generally consistent with recent and historical observational studies. Both the shelf circulation and off-shelf transport show a significant seasonality, mainly due to the seasonal changes of surface winds and large-scale circulation. Modeled and observed distributions of 228 Ra suggest that a majority of Fe-rich upper layer waters exported off-shelf around Elephant Island are carried by the shelfbreak current and the Bransfield Strait Current from the shallow sills between Gerlache Strait and Livingston Island, and northern shelf of the South Shetland Islands, where strong winter mixing supplies much of the sediment derived nutrients (including Fe) input to the surface layer. & 2013 Elsevier Ltd. All rights reserved. 1. Introduction The Antarctic Peninsula (AP) is located at the northernmost point of the Antarctic continent, facing South America across the Drake Passage (Fig. 1). The AP shelf region supports a productive marine ecosystem, yet it is experiencing the strongest impacts of climate change among the regions of Antarctic continent. For example, winter air temperatures in the western Antarctic Penin- sula (WAP) have increased about 6 1C in the last half century (Vaughan et al., 2003). Such a warming trend, along with other dramatic changes in environmental conditions, has imposed unprecedented pressure on the ecosystem (Ducklow et al., 2007). The AP shelf area is also important to the productivity in the southern Drake Passage and the Scotia Sea. Shelf waters in the AP area are rich in dissolved iron, the limiting micro-nutrient for phytoplankton growth in the southern Ocean (Martin et al., 1990). Recent studies have suggested that as the Antarctic Circumpolar Current (ACC) passes through the Shackelton Fracture Gap (SFG), it impinges upon the shelf around Elephant Island (EI) and interacts with the shelf currents to drive strong off-shelf transport of iron-rich shelf waters (Zhou et al., this issue). This iron flux is likely important to the massive and persistent phytoplankton blooms in the southern Scotia Sea observed from both satellite images (Kahru et al., 2007) and in situ measurements (e.g., Holm- Hansen et al., 2004; Korb et al., 2010). Recent studies have suggested a coherent circulation pattern in the AP shelf region. Along the northwest Weddell shelf, both the Antarctic Coastal Current (CC) and Antarctic Slope Current (ASC) flow northeastward with a typical velocity of 10 cm/s (Muench and Gordon, 1995; Thompson and Heywood, 2008). Thompson et al. (2009) suggested that a majority of the ASC follows the continental slope moving along the Weddell slope, and some of which may cross the Philip Ridge toward the northeast EI shelf. A portion of the ASC may join the CC to turn Contents lists available at SciVerse ScienceDirect journal homepage: www.elsevier.com/locate/dsr2 Deep-Sea Research II 0967-0645/$ - see front matter & 2013 Elsevier Ltd. All rights reserved. http://dx.doi.org/10.1016/j.dsr2.2013.02.029 n Corresponding author. Tel.: þ1 617 287 6186. E-mail address: [email protected] (M. Jiang). Please cite this article as: Jiang, M., et al., Seasonal cycle of circulation in the Antarctic Peninsula and the off-shelf transport of shelf waters into southern Drake Passage and Scotia Sea. Deep-Sea Res. II (2013), http://dx.doi.org/10.1016/j.dsr2.2013.02.029i Deep-Sea Research II ] (]]]]) ]]]–]]]
Transcript
Deep-Sea Research II ] (]]]]) ]]]–]]]
Contents lists available at SciVerse ScienceDirect
Deep-Sea Research II
0967-06
http://d
n Corr
E-m
Pleaswate
journal homepage: www.elsevier.com/locate/dsr2
Seasonal cycle of circulation in the Antarctic Peninsula and the off-shelftransport of shelf waters into southern Drake Passage and Scotia Sea
Mingshun Jiang a,n, Matthew A. Charette b, Christopher I. Measures c, Yiwu Zhu a, Meng Zhou a
a Department of Environmental, Earth and Ocean Sciences, University of Massachusetts Boston, 100 Morrissey Blvd., Boston, MA 02125, USAb Department of Marine Chemistry and Biogeochemistry, Woods Hole Oceanographic Institution, Woods Hole, MA 02543, USAc Department of Oceanography, University of Hawaii, Honolulu, HI 96822, USA
e cite this article as: Jiang, M., et al.rs into southern Drake Passage and
a b s t r a c t
The seasonal cycle of circulation and transport in the Antarctic Peninsula shelf region is investigated
using a high-resolution (�2 km) regional model based on the Regional Oceanic Modeling System
(ROMS). The model also includes a naturally occurring tracer with a strong source over the shelf
(radium isotope 228Ra, t1/2¼5.8 years) to investigate the sediment Fe input and its transport. The model
is spun-up for three years using climatological boundary and surface forcing and then run for the 2004–
2006 period using realistic forcing. Model results suggest a persistent and coherent circulation system
throughout the year consisting of several major components that converge water masses from various
sources toward Elephant Island. These currents are largely in geostrophic balance, driven by surface
winds, topographic steering, and large-scale forcing. Strong off-shelf transport of the Fe-rich shelf
waters takes place over the northeastern shelf/slope of Elephant Island, driven by a combination of
topographic steering, extension of shelf currents, and strong horizontal mixing between the ACC and
shelf waters. These results are generally consistent with recent and historical observational studies.
Both the shelf circulation and off-shelf transport show a significant seasonality, mainly due to the
seasonal changes of surface winds and large-scale circulation. Modeled and observed distributions of228Ra suggest that a majority of Fe-rich upper layer waters exported off-shelf around Elephant Island
are carried by the shelfbreak current and the Bransfield Strait Current from the shallow sills between
Gerlache Strait and Livingston Island, and northern shelf of the South Shetland Islands, where strong
winter mixing supplies much of the sediment derived nutrients (including Fe) input to the
surface layer.
& 2013 Elsevier Ltd. All rights reserved.
1. Introduction
The Antarctic Peninsula (AP) is located at the northernmostpoint of the Antarctic continent, facing South America across theDrake Passage (Fig. 1). The AP shelf region supports a productivemarine ecosystem, yet it is experiencing the strongest impacts ofclimate change among the regions of Antarctic continent. Forexample, winter air temperatures in the western Antarctic Penin-sula (WAP) have increased about 6 1C in the last half century(Vaughan et al., 2003). Such a warming trend, along with otherdramatic changes in environmental conditions, has imposedunprecedented pressure on the ecosystem (Ducklow et al., 2007).
The AP shelf area is also important to the productivity in thesouthern Drake Passage and the Scotia Sea. Shelf waters in the AParea are rich in dissolved iron, the limiting micro-nutrient for
ll rights reserved.
ng).
, Seasonal cycle of circulatiScotia Sea. Deep-Sea Res. I
phytoplankton growth in the southern Ocean (Martin et al., 1990).Recent studies have suggested that as the Antarctic CircumpolarCurrent (ACC) passes through the Shackelton Fracture Gap (SFG),it impinges upon the shelf around Elephant Island (EI) andinteracts with the shelf currents to drive strong off-shelf transportof iron-rich shelf waters (Zhou et al., this issue). This iron flux islikely important to the massive and persistent phytoplanktonblooms in the southern Scotia Sea observed from both satelliteimages (Kahru et al., 2007) and in situ measurements (e.g., Holm-Hansen et al., 2004; Korb et al., 2010).
Recent studies have suggested a coherent circulation patternin the AP shelf region. Along the northwest Weddell shelf, boththe Antarctic Coastal Current (CC) and Antarctic Slope Current(ASC) flow northeastward with a typical velocity of 10 cm/s(Muench and Gordon, 1995; Thompson and Heywood, 2008).Thompson et al. (2009) suggested that a majority of the ASCfollows the continental slope moving along the Weddell slope,and some of which may cross the Philip Ridge toward thenortheast EI shelf. A portion of the ASC may join the CC to turn
on in the Antarctic Peninsula and the off-shelf transport of shelfI (2013), http://dx.doi.org/10.1016/j.dsr2.2013.02.029i
Fig. 1. Top panel: model domain (one per every three grid lines is plotted) and bathymetry. Bottom panel: model grid for the Antarctic Peninsula area (one per two grid
lines is plotted). Red, blue and green lines indicate the model Elephant Island slope transect, BS transect, and PR-SSR transect, respectively. Black line indicates the
observed BS transect during NBP0606 cruise. Acronyms: BI, Brabant Island; GS, Gerlache Strait; AS, Antarctic Sound; JI, Joinville Island; SI, Smith Island; LI, Livingston
Island; KGI, King George Island; EI, Elephant Island; CI, Clarence Island; SSR, South Scotia Ridge; PR, Philips Ridge; HT, Hesperides Trough; STR, Shackelton Transverse
Ridge; SFG, Shackelton Fracture Gap; SB, Shackelton Bank; TR, Terror Rise. South Shetland Islands (SSIs) referred to the island chains including SI, LI, and KGI. Broad arrows
indicate the dominant currents (for details see text). (For interpretation of the references to color in this figure caption, the reader is referred to the web version of this
article.)
M. Jiang et al. / Deep-Sea Research II ] (]]]]) ]]]–]]]2
southward into the BS after passing Joinville Ridge (Thompsonand Heywood, 2008; Thompson et al., 2009; von Gyldenfeldtet al., 2002).
Within BS, the combined southwestward current, referred toas the southern BS Current (SBSC) hereafter, meets the relativelywarm and fresh waters from the WAP through the Gerlache StraitCurrent (GSC) at the western end of the strait (Niiler et al., 1991;Zhou et al., 2002, 2006). Together they feed into the eastwardflowing BS Current (BSC), which is a strong and narrow (4–6 kmwide) jet with a 50 cm/s velocity flowing along the steep northernslope of BS (Zhou et al., 2006). Zhou et al. (2006) suggested thatthe BSC is mainly driven by beta-effects and the wind curl overthe strait, a mechanism similar to the formation of westernboundary currents in major ocean basins.
North of the South Shetland Islands (SSIs), the SouthernBoundary of the ACC (SBACC) follows the continental slope east-ward passing through the SFG, and once through the gap, mayimpinge the shelf east of EI (Zhou et al., 2010). Before passing thegap, however, a small portion of the SBACC may detour south-ward and intrude into the eastern basin of BS through the passagebetween King George Island (KGI) and EI. The SBACC intrudingflow, BSC, and the ASC crossover flow appear to all converge in thearea east of EI interacting with the impinging ACC, leading to
Please cite this article as: Jiang, M., et al., Seasonal cycle of circulatiwaters into southern Drake Passage and Scotia Sea. Deep-Sea Res. I
strong mixing between these flows and a strong off-shelf trans-port of shelf waters.
There is limited information about the seasonal cycle of thecirculation in this area. Most of the studies noted above took placein austral fall and summer or reflected an annual mean such asthose that employed drifters (Thompson et al., 2009; Zhou et al.,2006). In particular, there is little information about the wintercirculation within BS and around EI. One exception to this is themooring study by von Gyldenfeldt et al. (2002), which revealedremarkably consistent currents over the Joinville Ridge for aperiod of about two years. Winter circulation can be importantto overall shelf Fe transport because deep winter mixing mayentrain a large amount of dissolved iron into the surface layer foroff-shelf transport. Most of this iron may be transported towardElephant Island given the low winter biological removal rates.
Although previous studies have demonstrated the existence ofstrong off-shelf transport of iron-rich shelf waters around EI area,several important aspects of the transport remain unclear. Theseinclude detailed knowledge of the iron sources and fluxes, theirpathways to reach the EI area and beyond, and the dynamicmechanisms driving the off-shelf transport. Zhou et al. (2010)suggested that the off-shelf transport is due to Rossby adjustmentwhen the southern branch of ACC passing through the SFG climbs
on in the Antarctic Peninsula and the off-shelf transport of shelfI (2013), http://dx.doi.org/10.1016/j.dsr2.2013.02.029i
M. Jiang et al. / Deep-Sea Research II ] (]]]]) ]]]–]]] 3
the shelf/slope. Meso-scale eddies may form as the jet becomesunstable and may subsequently contribute to the off-shelf flux. Inaddition, the interactions of several different water masses mayinduce complex mixing between shelf waters and ACC waters. Wewill refer this area as the EI Transport and Mixing Zone (EITMZ)hereafter.
It is generally believed that the Fe in the shelf waters aroundElephant Island is supplied from sediments on the AP shelf (Hattaet al., this issue; Measures et al., this issue). However, the precisesources of Fe and their transport pathways to reach the EI shelfregion remain unclear. In this manuscript, we incorporate into themodel a naturally occurring tracer of sediment-water interaction(radium isotope 228Ra, t1/2¼5.8 years), which has been used in thesouthern Ocean to quantify sediment-derived Fe input and toinvestigate its transport and dispersion (Charette et al., 2007;Dulaiova et al., 2009).
In this manuscript, we present a numerical model developedfor the AP shelf and surrounding areas, and then use the model toinvestigate the circulation pattern, its seasonal variability, and thedominant underlying processes. In Section 2, a brief description ofthe model and data used for this study is presented. In Section 3,we evaluate the model’s ability to capture key physical featuresby comparing the model results with available data. Model resultsof the circulation in the AP shelf region and its seasonal variabilityare presented as well. In Section 4, we discuss the key physicalprocesses that control the circulation and its variability, thedynamic processes associated with the off-shelf transport, andthe sources and pathways of Fe-rich shelf waters reaching theElephant Island shelf and beyond. A brief summary is presented inSection 5.
2. Model and data
2.1. Model
A high-resolution regional circulation model has been devel-oped for the Antarctic Peninsula, Drake Passage, Scotia Sea,northern Weddell Sea, and South Georgia with a horizontalresolution of 2–15 km (Fig. 1). The numerical simulations areintended to resolve circulation around the AP shelf, and thereforethe highest model resolution (�2 km) is centered over the APshelf and slope. The model is based on the Regional OceanicModeling System (ROMS), which is a terrain-following S-coordi-nate modeling system (Shchepetkin and McWilliams, 2005).There are 40 vertical layers, allowing the distribution of verticalgrid thickness to vary from a nearly uniform distribution inshallow areas to one more focused on the surface layer in deepareas. A third-order upstream scheme is used for horizontaladvection in the momentum equation, while a fourth-order leap-frog scheme is used for vertical advection. A multi-dimensionalpositive definite advection transport algorithm is used for thecomputation of tracer advection to avoid spurious negative tracerconcentrations (Smolarkiewicz, 1984). A Smagorinsky-type of mix-ing is used for horizontal viscosity and diffusivity (Smagorinsky,1963), in which the viscosity is computed from current shear andgrid size, and diffusivity is set to be 1/10th of the viscosity. In theAP shelf region, the viscosity and diffusivity are approximately10 m2/s and 1 m2/s, respectively. A second-order algorithm isused to compute the pressure-gradient term in order to reducethe so-called sigma-coordinate truncation error (Shchepetkin andMcWilliams, 2003). Vertical mixing is computed using the non-localK-profile vertical mixing scheme (KPP) (Large et al., 1994).
The model is initialized with the climatological temperatureand salinity from the World Ocean Atlas 2009 (WOA09) (Antonov
Please cite this article as: Jiang, M., et al., Seasonal cycle of circulatiwaters into southern Drake Passage and Scotia Sea. Deep-Sea Res. I
et al., 2010; Locarnini et al., 2010), spun-up for three years withmonthly climatological forcing, and then run for the period 2004–2006 using monthly forcing for each particular year. The modelsurface forcing parameters include sea surface temperature (SST),sea surface salinity (SSS), winds, solar radiation, relative humid-ity, precipitation, air pressure, and air-temperature. For theclimatological simulation (spin-up), SST and SSS are derived fromthe Comprehensive Ocean Atmospheric Data Set (COADS) (DaSilva et al., 1994), and other parameters are derived from thelong-term (1980–2010) monthly means of National Centers forEnvironmental Prediction (NCEP) re-analysis 2.0 products (Kalnayet al., 1996). The relative humidity and precipitation are from thelong-term (1987–2006) monthly mean of Hamburg Ocean Atmo-sphere Parameters and Fluxes from Satellite Data (HOAPS)(Andersson et al., 2010). For the 2004–2006 simulation, SST andSSS are derived from the 1/41 global Ocean Circulation andClimate Advanced Model (OCCAM) (Webb et al., 1998), andmeteorological parameters are again from NCEP and HOAPSproducts for the specific period.
A bulk formulation from NCAR Community Climate SystemModel (CCSM) is used to compute the wind stresses and heatfluxes using surface winds and other meteorological parameters(Collins et al., 2006). To reduce uncertainty due to computedsurface heat and salt fluxes, surface temperature and salinity arerestored to prescribed SST and SSS with a variable time-scaledepending on ocean heat sensitivity for temperature and a fixed30-day time-scale for salinity, respectively. The correction termsare applied to the model top layer. However, in effect heat or saltchanges are mixed over the entire surface mixed layer, which isgenerally deeper than the model top layer. Therefore, the result-ing response time-scale for the mixed layer is much longer thanthe nudging time-scale. On average, the effective time-scales forboth temperature and salinity restoration for the surface mixedlayer are about 20 days in summer and 100 days in winter, whichallows dynamic intrinsic variability to develop properly. Themodel also has a fully integrated sea-ice sub-model using acombination of the elastic–viscous–plastic (EVP) rheology(Hunke, 2001; Hunke and Dukowicz, 1997) and simple one-layer ice and snow thermodynamics with a molecular sub-layerunder the ice (Mellor and Kantha, 1989).
The model open boundary conditions include temperature,salinity, and mean sea level, and diagnostic geostrophic currentswith these parameters. For the climatological simulation, bound-ary temperature and salinity are from WOA09; for the 2004–2006simulation, they are from the OCCAM ¼1 model output. Sea levelis derived from the monthly mean dynamic height provided byAVISO (http://www.aviso.oceanobs.com/) augmented with theOCCAM sea level because AVISO data does not cover the southernportion of our model domain.
The model includes an additional tracer component to simu-late short-lived or nearly inert tracers such as the radium isotopes224Ra (t1/2¼3.66 days) and 228Ra (t1/2¼5.75 years). These tracersare initialized with zero values, and a uniform sediment flux(arbitrary units) is applied to the bottom layer for the AP shelfarea only, to provide continuous input. Boundary values of thesetracers are set to zero as we are mainly concerned with thesources and fates of sediment input from the AP shelf region. Inthis manuscript, we only will use only 228Ra and treat it as aninert tracer given its long half-life relative to the dynamic upperocean mixing processes taking place in this region. The purpose ofincluding a Ra tracer is to understand the vertical mixing andhorizontal pathways of sedimentary Fe input, and therefore noreal sediment flux rate is necessary. In the figures presentedbelow, however, modeled values are linearly multiplied by aconstant factor so that the modeled values have a comparablerange with observations from 228Ra (Dulaiova et al., 2009).
on in the Antarctic Peninsula and the off-shelf transport of shelfI (2013), http://dx.doi.org/10.1016/j.dsr2.2013.02.029i
M. Jiang et al. / Deep-Sea Research II ] (]]]]) ]]]–]]]4
2.2. Data
In order to gauge the model performance, model results havebeen compared with available climatological and cruise surveydata. In this manuscript, we report three types of comparisons:(1) the large-scale mean circulation pattern with satellite mea-sured sea surface dynamic height (SSH), (2) hydrographic proper-ties with in situ measurements of temperature, salinity, and(3) modeled 228Ra with in situ measurements. The SSH was fromthe AVISO satellite altimetry products, which are derived bymerging measurements from several satellites (http://www.aviso.oceanobs.com/). The temperature and salinity data werecollected during the February 12–March 24, 2004 (LMG0402) andJuly 3–August 15, 2006 (NBP0606) cruises by standard CTD casts(Zhou et al., 2010, this issue). The LMG0402 cruise covered anarea about 200 km�200 km northeast of Elephant Island and theNBP0606 ran several transects through the BS and around EI. Inaddition, surface salinity and radium isotope data were collectedduring the January 14–February 8, 2006 Antarctic Marine LivingResources (AMLR) summer cruise (Dulaiova et al., 2009). Moredetails on the sampling and data processing for LMG0402,NBP0606 and AMLR 2006 cruises can be found in Zhou et al.(2010, this issue) and Dulaiova et al. (2009), respectively.
Fig. 2. Top panel: long-term (1986–2010) mean sea surface dynamic height (cm)
from AVISO. Bottom panel: model annual mean surface currents (arrows) and sea
level (m, color) in 2004. Red broad arrows highlight the off-shelf transport points.
(For interpretation of the references to color in this figure caption, the reader is
referred to the web version of this article.)
3. Results
3.1. Model skills
Modeled sea level and surface currents in the Drake Passageand Scotia Sea region are compared with the long-term mean ofAVISO SSH in Fig. 2. Both the modeled and observed sea levelssuggest that a strong Polar Front (PF) (contour �60 cm for thedata and 0.6 m for the model) resides in the northern part of theDrake Passage. A relatively weaker but broader southern ACCfront (SACCF) runs through the southern Drake Passage nearlyparallel to the PF. A portion of the SACCF turns southward beforeencountering the Shackelton Traverse Ridge (STR), and thenreturns northward along the eastern side of the ridge. Thesouthern boundary of ACC (SBACC) follows the Antarctic con-tinental slope before passing through the SFG. However, it mean-ders dramatically after passing the SFG and a significant portionseparates from the slope moving into southern Scotia Sea. Thispattern is generally consistent with previous studies based onlong-term hydrographic data, current measurements, and driftertrajectories (Cunningham et al., 2003; Orsi et al., 1995; Zhou et al.,2010).
Model results also suggest that the SACCF is relatively weakwith currents around 20 cm/s west of the STR, whereas along theSSIs shelf slope, the SBACC currents are about 30–40 cm/s. Theconvergence of these two currents in the SFG results in currentsin the SFG of 470 cm/s (Zhou et al., 2010). After passing throughthe gap, the combined flow of SACCF and SBACC splits into threebranches: the first one moves northward along the eastern side ofthe ridge to join the main ACC, the second flows through themiddle of the Ona Basin into the ACC, and the third branchmeanders but can be in close contact with the Antarctic shelfslope. It is worth noting that both modeled fields and AVISO SSHshow three northward meanderings of SBACC in association withthe topographic features: (1) the junction between the SFG and EIat around 571W, (2) over the Shackelton Bank (SB) around 541W,and (3) Terror Rise (TR) around 511W. On the last meandering, themixed cold shelf waters are pushed more than 200 km into thesouthern Scotia Sea.
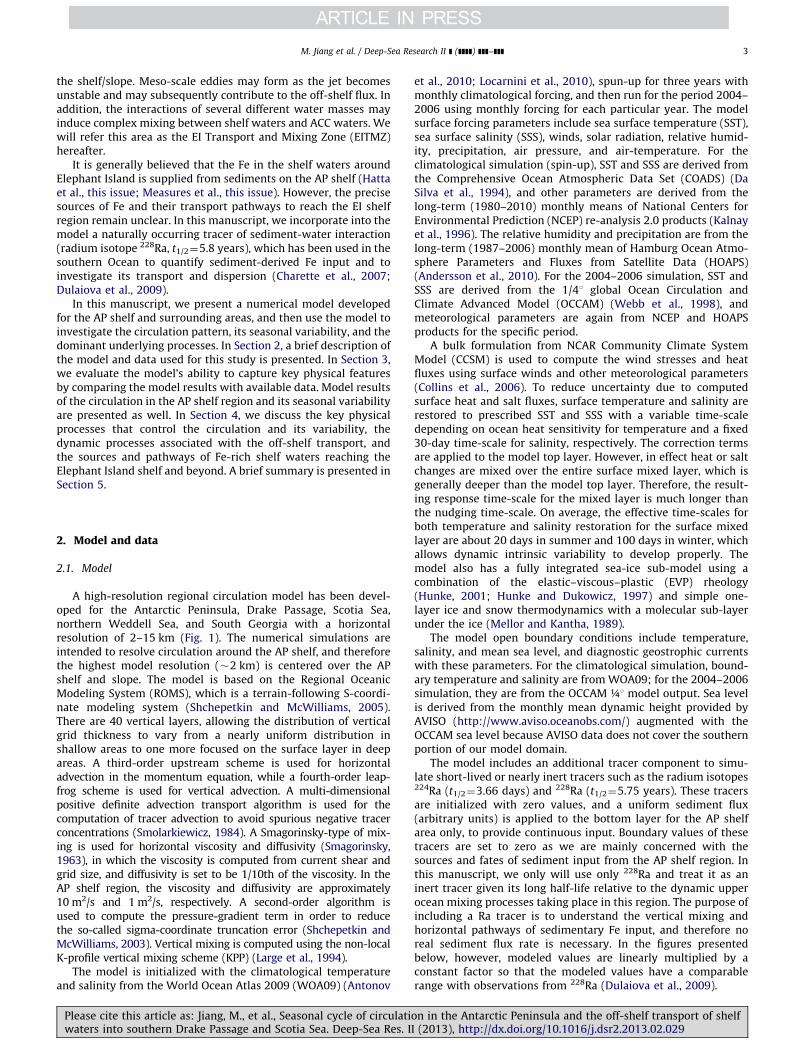
Modeled temperature and salinity in February 2004 aroundthe EI area generally agree well with the observations (Fig. 3),
Please cite this article as: Jiang, M., et al., Seasonal cycle of circulatiwaters into southern Drake Passage and Scotia Sea. Deep-Sea Res. I
although modeled salinity in the off-shelf plume is lower than inthe observations. Both modeled and observed temperature andsalinity suggest that after passing through the SFG, the ACCwaters turn sharply northward into the Ona Basin. At the sametime, a significant amount of shelf water is entrained into the off-shelf transport as indicated by the cold and high salinity plume,which is present from the surface to deeper than 200 m (Zhouet al., 2010).
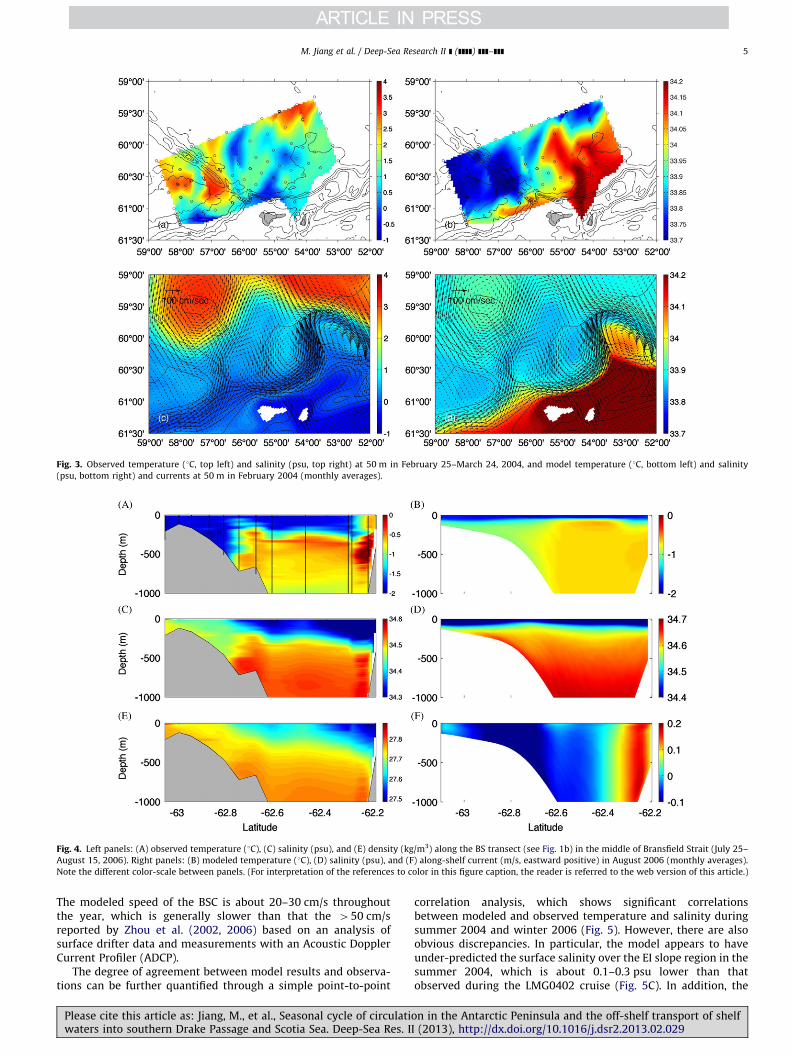
To illustrate the model performance in winter, modeledtemperature and salinity in August 2006 are compared withmeasurements during the NBP0606 cruise (July–August 2006)along the BS transect through the middle of the Bransfield Strait(Fig. 4). Both modeled and observed results show strong gradientsof temperature and salinity from north to south, and a cool butrelatively fresh surface layer on top of the warm and salty deepwaters in the central basin. Along both the northern and southernshelf/slope regions, observations show that the water column iswell mixed down to �500 m, whereas the modeled mixed layer ismuch shallower, at about 100 m. This is likely due to weaker seaice formation in the model (not shown) as a result of the use ofthe monthly forcing, which smoothes out the effects from majorstorm events. Model results also show that the cold and saltywaters in the southern BS shelf are associated with weak south-westward currents centered on the shelf margin. In contrast, astrong eastward narrow BSC can be found along the steep north-ern slope, in association with relatively fresh but warm water.
on in the Antarctic Peninsula and the off-shelf transport of shelfI (2013), http://dx.doi.org/10.1016/j.dsr2.2013.02.029i
Fig. 3. Observed temperature (1C, top left) and salinity (psu, top right) at 50 m in February 25–March 24, 2004, and model temperature (1C, bottom left) and salinity
(psu, bottom right) and currents at 50 m in February 2004 (monthly averages).
Fig. 4. Left panels: (A) observed temperature (1C), (C) salinity (psu), and (E) density (kg/m3) along the BS transect (see Fig. 1b) in the middle of Bransfield Strait (July 25–
August 15, 2006). Right panels: (B) modeled temperature (1C), (D) salinity (psu), and (F) along-shelf current (m/s, eastward positive) in August 2006 (monthly averages).
Note the different color-scale between panels. (For interpretation of the references to color in this figure caption, the reader is referred to the web version of this article.)
M. Jiang et al. / Deep-Sea Research II ] (]]]]) ]]]–]]] 5
The modeled speed of the BSC is about 20–30 cm/s throughoutthe year, which is generally slower than that the 450 cm/sreported by Zhou et al. (2002, 2006) based on an analysis ofsurface drifter data and measurements with an Acoustic DopplerCurrent Profiler (ADCP).
The degree of agreement between model results and observa-tions can be further quantified through a simple point-to-point
Please cite this article as: Jiang, M., et al., Seasonal cycle of circulatiwaters into southern Drake Passage and Scotia Sea. Deep-Sea Res. I
correlation analysis, which shows significant correlationsbetween modeled and observed temperature and salinity duringsummer 2004 and winter 2006 (Fig. 5). However, there are alsoobvious discrepancies. In particular, the model appears to haveunder-predicted the surface salinity over the EI slope region in thesummer 2004, which is about 0.1–0.3 psu lower than thatobserved during the LMG0402 cruise (Fig. 5C). In addition, the
on in the Antarctic Peninsula and the off-shelf transport of shelfI (2013), http://dx.doi.org/10.1016/j.dsr2.2013.02.029i
Fig. 5. One-to-one correlations between modeled and observed 10 m temperature and salinity in summer 2004 and winter 2006: (A) model 10 m temperature in February
2004 (monthly average) versus observed temperature during February–March 2004 (r¼0.66, po0.01), (B) model 10 m temperature in August 2006 (monthly average)
versus observed temperature during July–August 2006 (r¼0.58, po0.01), (C) same as (A) except for salinity (r¼0.61, po0.01), and (D) same as (B) except for salinity
(r¼0.56, po0.01). Solid lines are least-square regressions and dashed lines indicate the 1:1 relationship. The locations of LMG0402 stations please see Fig. 3a. The
locations of NBP0606 stations (see Zhou et al., this issue).
M. Jiang et al. / Deep-Sea Research II ] (]]]]) ]]]–]]]6
correlation is somewhat biased by the extreme values duringsummer and winter cases (Fig. 5B–D). However, after removingthose extreme data points for temperature in the winter 2006(modeled T41 1C), salinity in summer 2004 (modeledS434 psu), and salinity for winter 2006 (modeled So34 psu),the modeled values are still significantly correlated with datawith r¼0.2 (po0.05), r¼0.42 (po0.01), and ro0.46 (po0.01),respectively.
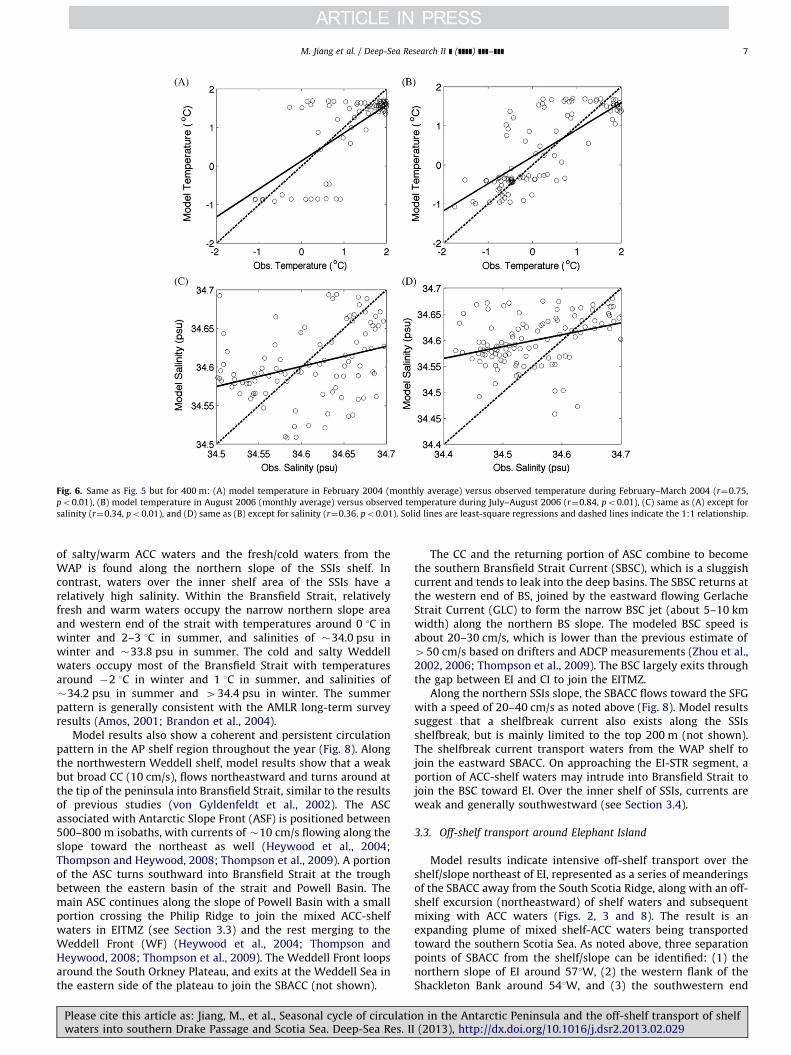
A similar comparison for temperature and salinity at 400 m isshown in Fig. 6. Modeled temperature northeast of EI in summer2004 remains significantly correlated with data (r¼0.75, po0.01)(Fig. 6A). The modeled temperatures, however, cluster aroundtwo values, whereas observed temperatures cover the entirerange (�1 to 2 1C). This is in contrast to the winter 2006 case,in which modeled and observed temperatures are nearly linearlycorrelated (r¼0.84, po0.01) (Fig. 6B). The modeled and observedsalinity at 400 m show much weaker yet significant correlationswith modeled salinity having narrower ranges during bothsummer 2004 and winter 2006 (Fig. 6C and D).
We also compare modeled surface salinity and inert tracerconcentration in January 2006 with the observed salinity and228Ra during the AMLR summer (January 14–February 8) 2006cruise (Fig. 7). Both modeled and observed salinity show a strongNW–SE gradient between relatively fresh ACC waters in thesouthern Drake Passage and the high salinity Weddell waters inthe southern BS and northwestern Weddell shelf (Fig. 7A and C).The modeled salinity of shelf waters surrounding SSIs fallsbetween that of the ACC waters and the Weddell waters. Modelresults also show that a portion of high salinity Weddell slopewater is transported across the south Scotia Ridge by the ASCpassing Clarence Island (CI) into the EITMZ, consistent with
Please cite this article as: Jiang, M., et al., Seasonal cycle of circulatiwaters into southern Drake Passage and Scotia Sea. Deep-Sea Res. I
previous studies (Thompson and Heywood, 2008; Thompsonet al., 2009). A significant correlation is found between themodeled and observed salinities (r¼0.6, po0.01), although againa weaker salinity gradient across the shelf is indicated in themodel than seen in the observations.
Both modeled and observed 228Ra show high surface concen-trations surrounding the SSIs, although observed 228Ra is muchmore patchy (Fig. 7B and D). Model results also show high 228Raconcentration in the southwestern end of BS, where there were nosampling stations. Model results suggest that the shelf waterswith high 228Ra concentration at the western end of BS aretransported northward through the channel between SmithIsland and Livingston Island to the shelf margin, and then north-eastward along the shelf margin toward EI. On approaching EI, amajority of the high 228Ra waters pass through the northern slopeof EI, whereas the remaining portion passes through the channelbetween EI and CI. The model predicts lower surface 228Raconcentrations than those observed in the eastern basin of BS(Fig. 7D). The observed 228Ra distribution also indicates that sedi-ment input may spread through the middle of the eastern basintoward EI. Overall, the modeled 228Ra distribution is significantlycorrelated with the observed values (r¼0.3, po0.01).
3.2. Hydrography and circulation patterns in the AP shelf/slope
region
Model results indicate a coherent spatial pattern of watermasses in the AP shelf region (Figs. 3, 4 and 7). Relatively freshwaters occupy the western AP with surface salinity below33.4 psu in summer and about 33.7 psu in winter. A mixture
on in the Antarctic Peninsula and the off-shelf transport of shelfI (2013), http://dx.doi.org/10.1016/j.dsr2.2013.02.029i
Fig. 6. Same as Fig. 5 but for 400 m: (A) model temperature in February 2004 (monthly average) versus observed temperature during February–March 2004 (r¼0.75,
po0.01), (B) model temperature in August 2006 (monthly average) versus observed temperature during July–August 2006 (r¼0.84, po0.01), (C) same as (A) except for
salinity (r¼0.34, po0.01), and (D) same as (B) except for salinity (r¼0.36, po0.01). Solid lines are least-square regressions and dashed lines indicate the 1:1 relationship.
M. Jiang et al. / Deep-Sea Research II ] (]]]]) ]]]–]]] 7
of salty/warm ACC waters and the fresh/cold waters from theWAP is found along the northern slope of the SSIs shelf. Incontrast, waters over the inner shelf area of the SSIs have arelatively high salinity. Within the Bransfield Strait, relativelyfresh and warm waters occupy the narrow northern slope areaand western end of the strait with temperatures around 0 1C inwinter and 2–3 1C in summer, and salinities of �34.0 psu inwinter and �33.8 psu in summer. The cold and salty Weddellwaters occupy most of the Bransfield Strait with temperaturesaround �2 1C in winter and 1 1C in summer, and salinities of�34.2 psu in summer and 434.4 psu in winter. The summerpattern is generally consistent with the AMLR long-term surveyresults (Amos, 2001; Brandon et al., 2004).
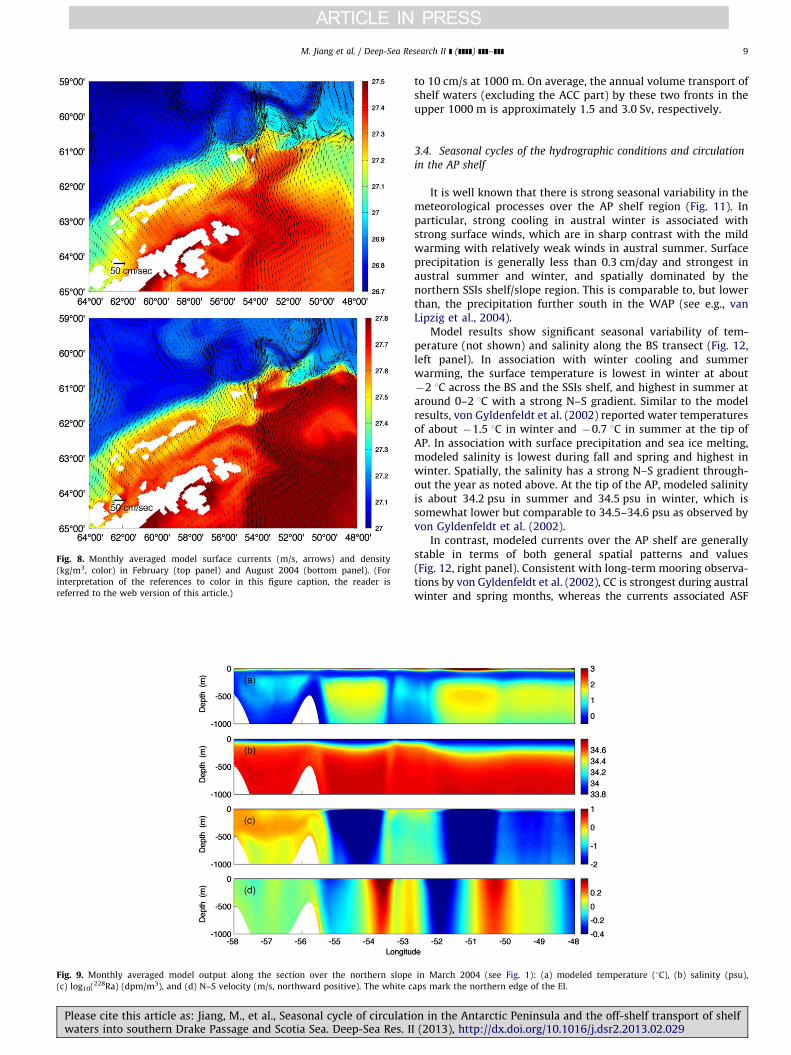
Model results also show a coherent and persistent circulationpattern in the AP shelf region throughout the year (Fig. 8). Alongthe northwestern Weddell shelf, model results show that a weakbut broad CC (10 cm/s), flows northeastward and turns around atthe tip of the peninsula into Bransfield Strait, similar to the resultsof previous studies (von Gyldenfeldt et al., 2002). The ASCassociated with Antarctic Slope Front (ASF) is positioned between500–800 m isobaths, with currents of �10 cm/s flowing along theslope toward the northeast as well (Heywood et al., 2004;Thompson and Heywood, 2008; Thompson et al., 2009). A portionof the ASC turns southward into Bransfield Strait at the troughbetween the eastern basin of the strait and Powell Basin. Themain ASC continues along the slope of Powell Basin with a smallportion crossing the Philip Ridge to join the mixed ACC-shelfwaters in EITMZ (see Section 3.3) and the rest merging to theWeddell Front (WF) (Heywood et al., 2004; Thompson andHeywood, 2008; Thompson et al., 2009). The Weddell Front loopsaround the South Orkney Plateau, and exits at the Weddell Sea inthe eastern side of the plateau to join the SBACC (not shown).
Please cite this article as: Jiang, M., et al., Seasonal cycle of circulatiwaters into southern Drake Passage and Scotia Sea. Deep-Sea Res. I
The CC and the returning portion of ASC combine to becomethe southern Bransfield Strait Current (SBSC), which is a sluggishcurrent and tends to leak into the deep basins. The SBSC returns atthe western end of BS, joined by the eastward flowing GerlacheStrait Current (GLC) to form the narrow BSC jet (about 5–10 kmwidth) along the northern BS slope. The modeled BSC speed isabout 20–30 cm/s, which is lower than the previous estimate of450 cm/s based on drifters and ADCP measurements (Zhou et al.,2002, 2006; Thompson et al., 2009). The BSC largely exits throughthe gap between EI and CI to join the EITMZ.
Along the northern SSIs slope, the SBACC flows toward the SFGwith a speed of 20–40 cm/s as noted above (Fig. 8). Model resultssuggest that a shelfbreak current also exists along the SSIsshelfbreak, but is mainly limited to the top 200 m (not shown).The shelfbreak current transport waters from the WAP shelf tojoin the eastward SBACC. On approaching the EI-STR segment, aportion of ACC-shelf waters may intrude into Bransfield Strait tojoin the BSC toward EI. Over the inner shelf of SSIs, currents areweak and generally southwestward (see Section 3.4).
3.3. Off-shelf transport around Elephant Island
Model results indicate intensive off-shelf transport over theshelf/slope northeast of EI, represented as a series of meanderingsof the SBACC away from the South Scotia Ridge, along with an off-shelf excursion (northeastward) of shelf waters and subsequentmixing with ACC waters (Figs. 2, 3 and 8). The result is anexpanding plume of mixed shelf-ACC waters being transportedtoward the southern Scotia Sea. As noted above, three separationpoints of SBACC from the shelf/slope can be identified: (1) thenorthern slope of EI around 571W, (2) the western flank of theShackleton Bank around 541W, and (3) the southwestern end
on in the Antarctic Peninsula and the off-shelf transport of shelfI (2013), http://dx.doi.org/10.1016/j.dsr2.2013.02.029i
Fig. 7. (a) Modeled surface salinity (psu) and (b) 228Ra (dpm/m3) in January 2006 (monthly averages), and (c) observed surface salinity (psu) and (d) 228Ra (dpm/m3)
during January–February 2006. Also shown are 1:1 correlations between the modeled and observed salinity (r¼0.56, po0.01) (e) and 228Ra (r¼0.35, po0.01) (f). In (d) a
background value of 1.7 dpm/m3 is subtracted from the observed 228Ra concentration. Model values of 228Ra are scaled to the observed ones since model sediment 228Ra
flux has an arbitrary unit.
M. Jiang et al. / Deep-Sea Research II ] (]]]]) ]]]–]]]8
of Terror Rise around 51.51W. Similar separation points are alsopresent in the mean currents derived from drifter trajectories(Zhou et al., 2010) and the SSH map (Fig. 2). At the bottom of thenorthern EI slope, the SACCF passes through the SFG and a portionmakes a sharp north turn following the eastern side of the STR.The meandering of the SBACC and the SACCF combined transporta significant amount of mixed water northward. At the secondseparation point, however, modeled currents indicate that amajority of the northward transported waters returns to interceptthe shelf/slope further east. In contrast, the off-shelf meanderingat the third point produces a broad plume of mixed waters thatspreads much further offshore and downstream.
Vertically, these meanderings and transport take place in theupper 1000 m as narrow bands of 20–50 km (Fig. 9). The south-ward flows of 10–40 cm/s carry warm but relatively fresh ACCwaters on the left and shelf waters on the right, as indicated
Please cite this article as: Jiang, M., et al., Seasonal cycle of circulatiwaters into southern Drake Passage and Scotia Sea. Deep-Sea Res. I
by the high 228Ra concentration. In general, shelf waters belowthe surface mixed layer become warmer and fresher moving tothe northeast. The northward transport over the upper 1000 m atthe second and third separation bands are approximately 9 Sv(1 Sv¼106 m3/s) and 18 Sv, respectively.
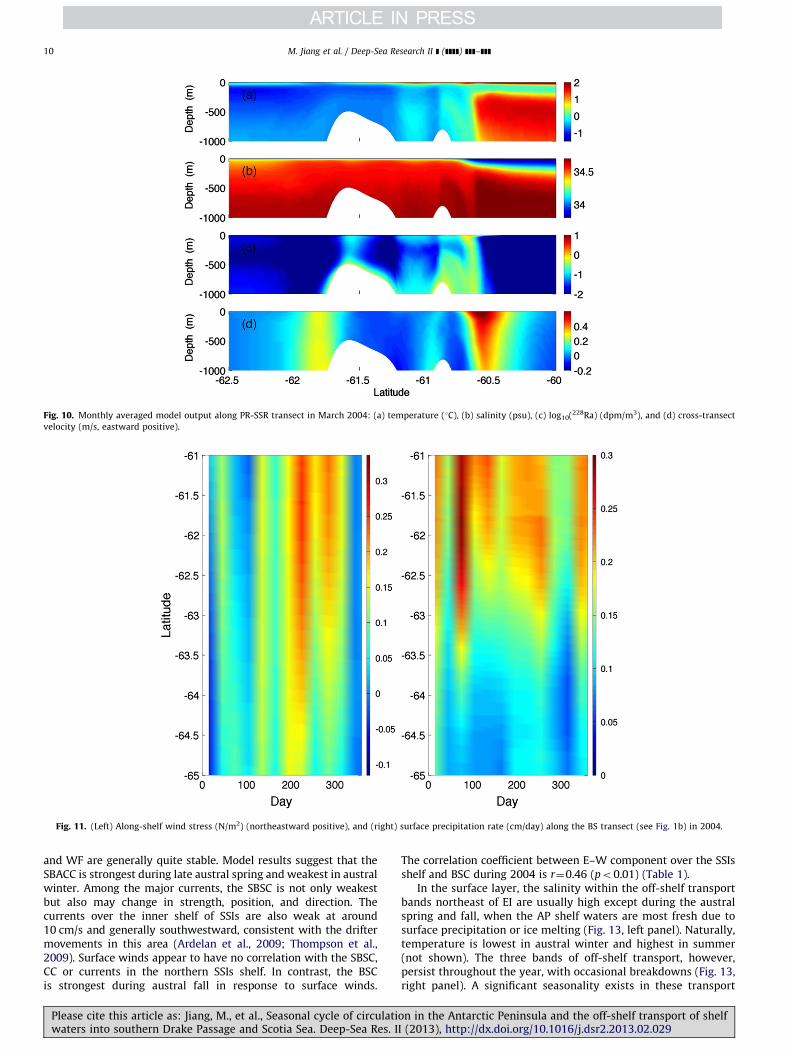
Model distributions of 228Ra along the PR-SSR transect (seeFig. 1b) indicate that the shelf waters being transported down-stream are mainly associated with two fronts: (1) the Weddell-shelf front at 61.71 S between the crossover portion of WeddellSlope waters and AP shelf waters, and (2) the shelf-ACC front at60.71 S (Fig. 10). As noted above, the high 228Ra shelf watersoccupy the southern branch (right side) of the shelf-ACC front.The Weddell-shelf front has a width of �20 km and a currentspeed of �15 cm/s positioned at 1000–2000 m over the southernslope of Philip Ridge, while the shelf-ACC front has a widthof �30 km and a speed decreasing from 40 cm/s at the surface
on in the Antarctic Peninsula and the off-shelf transport of shelfI (2013), http://dx.doi.org/10.1016/j.dsr2.2013.02.029i
Fig. 8. Monthly averaged model surface currents (m/s, arrows) and density
(kg/m3, color) in February (top panel) and August 2004 (bottom panel). (For
interpretation of the references to color in this figure caption, the reader is
referred to the web version of this article.)
Fig. 9. Monthly averaged model output along the section over the northern slope
(c) log10(228Ra) (dpm/m3), and (d) N–S velocity (m/s, northward positive). The white c
M. Jiang et al. / Deep-Sea Research II ] (]]]]) ]]]–]]] 9
Please cite this article as: Jiang, M., et al., Seasonal cycle of circulatiwaters into southern Drake Passage and Scotia Sea. Deep-Sea Res. I
to 10 cm/s at 1000 m. On average, the annual volume transport ofshelf waters (excluding the ACC part) by these two fronts in theupper 1000 m is approximately 1.5 and 3.0 Sv, respectively.
3.4. Seasonal cycles of the hydrographic conditions and circulation
in the AP shelf
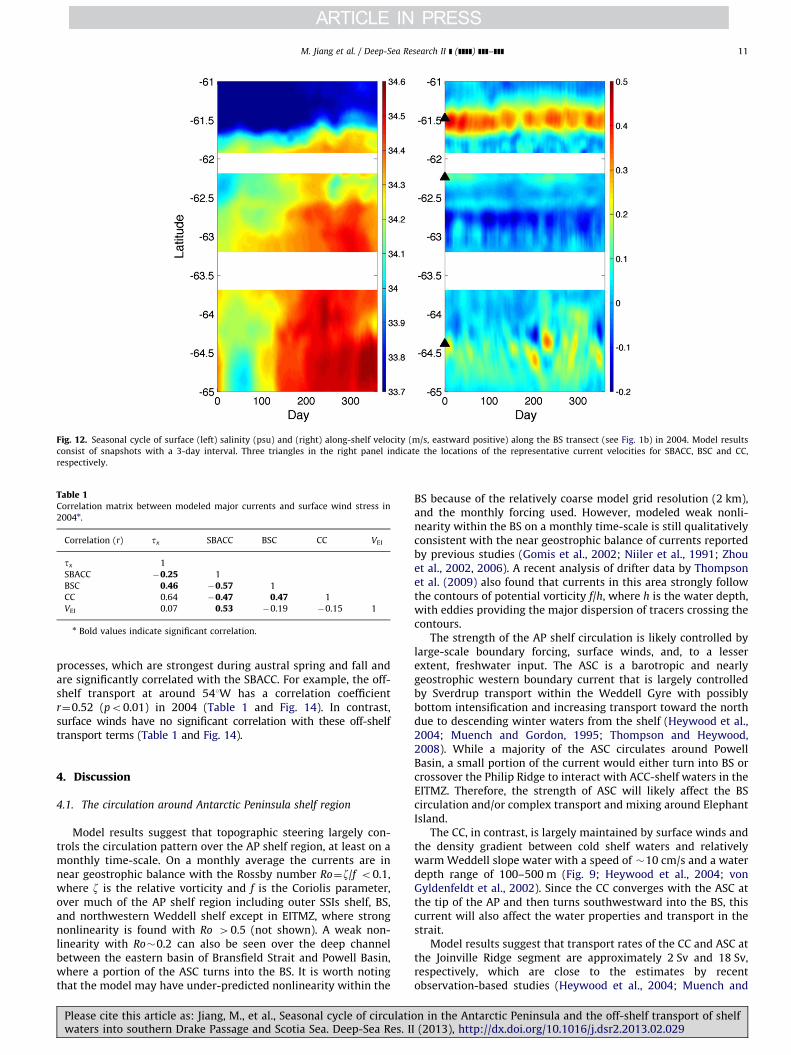
It is well known that there is strong seasonal variability in themeteorological processes over the AP shelf region (Fig. 11). Inparticular, strong cooling in austral winter is associated withstrong surface winds, which are in sharp contrast with the mildwarming with relatively weak winds in austral summer. Surfaceprecipitation is generally less than 0.3 cm/day and strongest inaustral summer and winter, and spatially dominated by thenorthern SSIs shelf/slope region. This is comparable to, but lowerthan, the precipitation further south in the WAP (see e.g., vanLipzig et al., 2004).
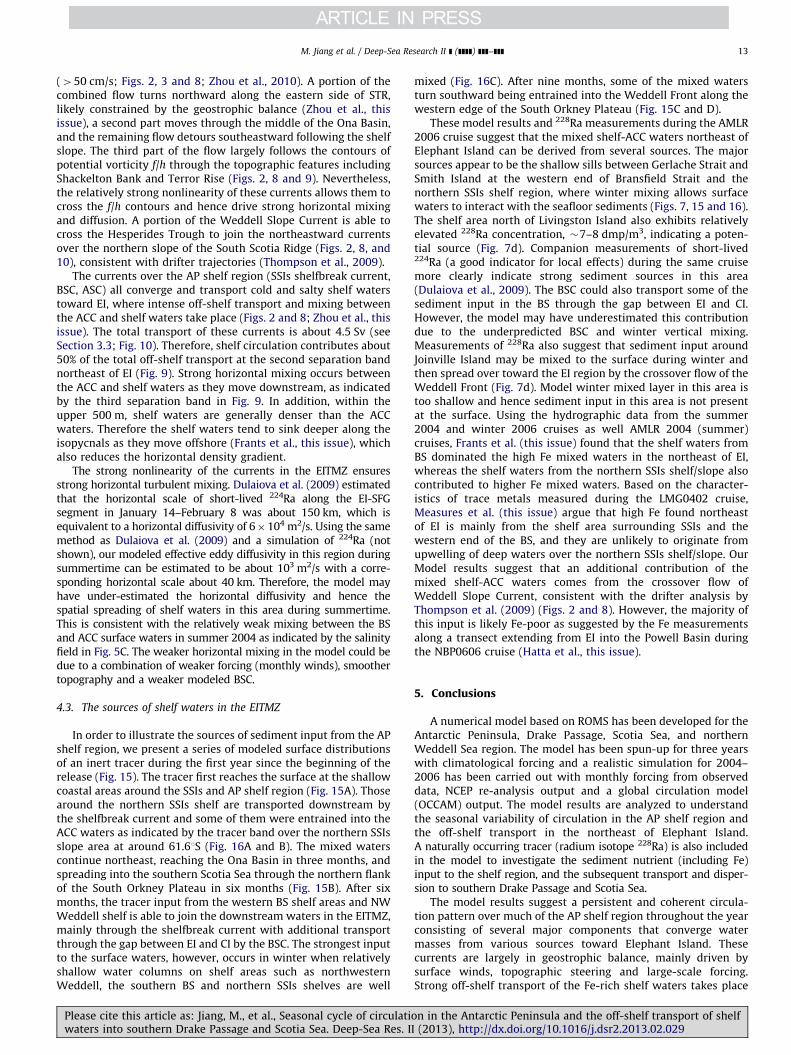
Model results show significant seasonal variability of tem-perature (not shown) and salinity along the BS transect (Fig. 12,left panel). In association with winter cooling and summerwarming, the surface temperature is lowest in winter at about�2 1C across the BS and the SSIs shelf, and highest in summer ataround 0–2 1C with a strong N–S gradient. Similar to the modelresults, von Gyldenfeldt et al. (2002) reported water temperaturesof about �1.5 1C in winter and �0.7 1C in summer at the tip ofAP. In association with surface precipitation and sea ice melting,modeled salinity is lowest during fall and spring and highest inwinter. Spatially, the salinity has a strong N–S gradient through-out the year as noted above. At the tip of the AP, modeled salinityis about 34.2 psu in summer and 34.5 psu in winter, which issomewhat lower but comparable to 34.5–34.6 psu as observed byvon Gyldenfeldt et al. (2002).
In contrast, modeled currents over the AP shelf are generallystable in terms of both general spatial patterns and values(Fig. 12, right panel). Consistent with long-term mooring observa-tions by von Gyldenfeldt et al. (2002), CC is strongest during australwinter and spring months, whereas the currents associated ASF
in March 2004 (see Fig. 1): (a) modeled temperature (1C), (b) salinity (psu),
aps mark the northern edge of the EI.
on in the Antarctic Peninsula and the off-shelf transport of shelfI (2013), http://dx.doi.org/10.1016/j.dsr2.2013.02.029i
Fig. 10. Monthly averaged model output along PR-SSR transect in March 2004: (a) temperature (1C), (b) salinity (psu), (c) log10(228Ra) (dpm/m3), and (d) cross-transect
velocity (m/s, eastward positive).
Fig. 11. (Left) Along-shelf wind stress (N/m2) (northeastward positive), and (right) surface precipitation rate (cm/day) along the BS transect (see Fig. 1b) in 2004.
M. Jiang et al. / Deep-Sea Research II ] (]]]]) ]]]–]]]10
and WF are generally quite stable. Model results suggest that theSBACC is strongest during late austral spring and weakest in australwinter. Among the major currents, the SBSC is not only weakestbut also may change in strength, position, and direction. Thecurrents over the inner shelf of SSIs are also weak at around10 cm/s and generally southwestward, consistent with the driftermovements in this area (Ardelan et al., 2009; Thompson et al.,2009). Surface winds appear to have no correlation with the SBSC,CC or currents in the northern SSIs shelf. In contrast, the BSCis strongest during austral fall in response to surface winds.
Please cite this article as: Jiang, M., et al., Seasonal cycle of circulatiwaters into southern Drake Passage and Scotia Sea. Deep-Sea Res. I
The correlation coefficient between E–W component over the SSIsshelf and BSC during 2004 is r¼0.46 (po0.01) (Table 1).
In the surface layer, the salinity within the off-shelf transportbands northeast of EI are usually high except during the australspring and fall, when the AP shelf waters are most fresh due tosurface precipitation or ice melting (Fig. 13, left panel). Naturally,temperature is lowest in austral winter and highest in summer(not shown). The three bands of off-shelf transport, however,persist throughout the year, with occasional breakdowns (Fig. 13,right panel). A significant seasonality exists in these transport
on in the Antarctic Peninsula and the off-shelf transport of shelfI (2013), http://dx.doi.org/10.1016/j.dsr2.2013.02.029i
Fig. 12. Seasonal cycle of surface (left) salinity (psu) and (right) along-shelf velocity (m/s, eastward positive) along the BS transect (see Fig. 1b) in 2004. Model results
consist of snapshots with a 3-day interval. Three triangles in the right panel indicate the locations of the representative current velocities for SBACC, BSC and CC,
respectively.
Table 1Correlation matrix between modeled major currents and surface wind stress in
2004n.
Correlation (r) tx SBACC BSC CC VEI
tx 1
SBACC �0.25 1
BSC 0.46 �0.57 1
CC 0.64 �0.47 0.47 1
VEI 0.07 0.53 �0.19 �0.15 1
n Bold values indicate significant correlation.
M. Jiang et al. / Deep-Sea Research II ] (]]]]) ]]]–]]] 11
processes, which are strongest during austral spring and fall andare significantly correlated with the SBACC. For example, the off-shelf transport at around 541W has a correlation coefficientr¼0.52 (po0.01) in 2004 (Table 1 and Fig. 14). In contrast,surface winds have no significant correlation with these off-shelftransport terms (Table 1 and Fig. 14).
4. Discussion
4.1. The circulation around Antarctic Peninsula shelf region
Model results suggest that topographic steering largely con-trols the circulation pattern over the AP shelf region, at least on amonthly time-scale. On a monthly average the currents are innear geostrophic balance with the Rossby number Ro¼z/f o0.1,where z is the relative vorticity and f is the Coriolis parameter,over much of the AP shelf region including outer SSIs shelf, BS,and northwestern Weddell shelf except in EITMZ, where strongnonlinearity is found with Ro 40.5 (not shown). A weak non-linearity with Ro�0.2 can also be seen over the deep channelbetween the eastern basin of Bransfield Strait and Powell Basin,where a portion of the ASC turns into the BS. It is worth notingthat the model may have under-predicted nonlinearity within the
Please cite this article as: Jiang, M., et al., Seasonal cycle of circulatiwaters into southern Drake Passage and Scotia Sea. Deep-Sea Res. I
BS because of the relatively coarse model grid resolution (2 km),and the monthly forcing used. However, modeled weak nonli-nearity within the BS on a monthly time-scale is still qualitativelyconsistent with the near geostrophic balance of currents reportedby previous studies (Gomis et al., 2002; Niiler et al., 1991; Zhouet al., 2002, 2006). A recent analysis of drifter data by Thompsonet al. (2009) also found that currents in this area strongly followthe contours of potential vorticity f/h, where h is the water depth,with eddies providing the major dispersion of tracers crossing thecontours.
The strength of the AP shelf circulation is likely controlled bylarge-scale boundary forcing, surface winds, and, to a lesserextent, freshwater input. The ASC is a barotropic and nearlygeostrophic western boundary current that is largely controlledby Sverdrup transport within the Weddell Gyre with possiblybottom intensification and increasing transport toward the northdue to descending winter waters from the shelf (Heywood et al.,2004; Muench and Gordon, 1995; Thompson and Heywood,2008). While a majority of the ASC circulates around PowellBasin, a small portion of the current would either turn into BS orcrossover the Philip Ridge to interact with ACC-shelf waters in theEITMZ. Therefore, the strength of ASC will likely affect the BScirculation and/or complex transport and mixing around ElephantIsland.
The CC, in contrast, is largely maintained by surface winds andthe density gradient between cold shelf waters and relativelywarm Weddell slope water with a speed of �10 cm/s and a waterdepth range of 100–500 m (Fig. 9; Heywood et al., 2004; vonGyldenfeldt et al., 2002). Since the CC converges with the ASC atthe tip of the AP and then turns southwestward into the BS, thiscurrent will also affect the water properties and transport in thestrait.
Model results suggest that transport rates of the CC and ASC atthe Joinville Ridge segment are approximately 2 Sv and 18 Sv,respectively, which are close to the estimates by recentobservation-based studies (Heywood et al., 2004; Muench and
on in the Antarctic Peninsula and the off-shelf transport of shelfI (2013), http://dx.doi.org/10.1016/j.dsr2.2013.02.029i
Fig. 13. Seasonal cycle of surface (left panel) salinity (psu) and (right panel) cross-shelf velocity (m/s, off-shelf positive) along the EI shelf slope transect (see Fig. 1b) in
2004. Model results consist of snapshots with a 3-day interval. Black line on top of the right panel indicates average range for off-shelf transport velocity.
Fig. 14. Top panel: E–W component of surface wind stress over the SSIs shelf in
2004. Bottom panel: ACC current (blue) at the KGI segment, Bransfield Current
(green) at KGI segment, Antarctic coastal current (black) over the northwest
Weddell Shelf, and off-shelf current velocity (red) at Shackleton Bank segment
(601300N, 541 W) in 2004. The locations chosen for representing ACC, BSC, and CC
see Fig. 12. The averaging band for the off-shelf transport velocity (see Fig. 13).
(For interpretation of the references to color in this figure caption, the reader is
referred to the web version of this article.)
M. Jiang et al. / Deep-Sea Research II ] (]]]]) ]]]–]]]12
Gordon, 1995), and a numerical model (Matano et al., 2002). Thisis lower, however, than the recent estimate of 48 Sv by Thompsonand Heywood (2008), which includes the volume transport ofdeep water flow that is likely underestimated in our model.Model results further suggest that, among these transports, about2 Sv turns into the BS, which falls between the 1 Sv estimate ofHeywood et al. (2004) and the 2.471 Sv estimate of vonGyldenfeldt et al. (2002).
The impacts of SBACC on the circulation over the AP shelfregion remain unclear. Model results show that the ACC-shelf
Please cite this article as: Jiang, M., et al., Seasonal cycle of circulatiwaters into southern Drake Passage and Scotia Sea. Deep-Sea Res. I
mixed waters in the WAP may cross over the shallow sillsbetween Brabant Island and Smith Island, and intrude into theBS (Fig. 8). But the volume of the intrusion through this routeappears to be limited (Capella et al., 1992; Gomis et al., 2002;Zhou et al., 2002). Capella et al. (1992) suggested that the ACCwaters enter the strait mainly through the deep trough betweenSmith Island and Livingston Island. Zhou et al. (2006) were able toidentify waters with similar characteristics (warm and salty) asthose of the UCDW at 300–500 m over the KGI slope area (BSside), which are similar to the warm and salty waters observedduring the NBP0606 cruise (Fig. 4A and C). However, no significantintrusion of the UCDW is present the model results (Fig. 4B and D).
Over the SSIs northern shelf margin, the Ekman transportdriven by prevailing westerly winds likely transport the shelfwaters towards the offshore area, and induce subsurface upwel-ling of UCDW onto the shelf at the same time. In addition, theSBACC may penetrate into the BS through the channel betweenKGI and EI (Fig. 8; Thompson et al., 2009).
The model appears to have underestimated the strength of BSCfor several reasons. Firstly, the transport by Gerlache StraitCurrent is likely underestimated due to the much shallowerwater depth in the model. Secondly, the intruding flow of upperCDW into the BS is largely missing, which is likely due to thesmoothing of bottom topography, the coarse resolution of themodel, and the weaker than expected non-geostrophic currentsdue to the smooth monthly winds. Thirdly, the broader width ofthe BSC may be simply due to the coarse model resolution(�2 km).
4.2. Off-shelf transport around the Elephant Island
The circulation in the EITMZ is highly dynamic driven by thecomplicated interactions between the ACC, BSC, and Weddell Seacurrents over a complex bathymetry. Both model results andobservations indicate that as the SBACC and a portion of SACCFpass through the SFG where the currents become stronger
on in the Antarctic Peninsula and the off-shelf transport of shelfI (2013), http://dx.doi.org/10.1016/j.dsr2.2013.02.029i
M. Jiang et al. / Deep-Sea Research II ] (]]]]) ]]]–]]] 13
(450 cm/s; Figs. 2, 3 and 8; Zhou et al., 2010). A portion of thecombined flow turns northward along the eastern side of STR,likely constrained by the geostrophic balance (Zhou et al., thisissue), a second part moves through the middle of the Ona Basin,and the remaining flow detours southeastward following the shelfslope. The third part of the flow largely follows the contours ofpotential vorticity f/h through the topographic features includingShackelton Bank and Terror Rise (Figs. 2, 8 and 9). Nevertheless,the relatively strong nonlinearity of these currents allows them tocross the f/h contours and hence drive strong horizontal mixingand diffusion. A portion of the Weddell Slope Current is able tocross the Hesperides Trough to join the northeastward currentsover the northern slope of the South Scotia Ridge (Figs. 2, 8, and10), consistent with drifter trajectories (Thompson et al., 2009).
The currents over the AP shelf region (SSIs shelfbreak current,BSC, ASC) all converge and transport cold and salty shelf waterstoward EI, where intense off-shelf transport and mixing betweenthe ACC and shelf waters take place (Figs. 2 and 8; Zhou et al., thisissue). The total transport of these currents is about 4.5 Sv (seeSection 3.3; Fig. 10). Therefore, shelf circulation contributes about50% of the total off-shelf transport at the second separation bandnortheast of EI (Fig. 9). Strong horizontal mixing occurs betweenthe ACC and shelf waters as they move downstream, as indicatedby the third separation band in Fig. 9. In addition, within theupper 500 m, shelf waters are generally denser than the ACCwaters. Therefore the shelf waters tend to sink deeper along theisopycnals as they move offshore (Frants et al., this issue), whichalso reduces the horizontal density gradient.
The strong nonlinearity of the currents in the EITMZ ensuresstrong horizontal turbulent mixing. Dulaiova et al. (2009) estimatedthat the horizontal scale of short-lived 224Ra along the EI-SFGsegment in January 14–February 8 was about 150 km, which isequivalent to a horizontal diffusivity of 6�104 m2/s. Using the samemethod as Dulaiova et al. (2009) and a simulation of 224Ra (notshown), our modeled effective eddy diffusivity in this region duringsummertime can be estimated to be about 103 m2/s with a corre-sponding horizontal scale about 40 km. Therefore, the model mayhave under-estimated the horizontal diffusivity and hence thespatial spreading of shelf waters in this area during summertime.This is consistent with the relatively weak mixing between the BSand ACC surface waters in summer 2004 as indicated by the salinityfield in Fig. 5C. The weaker horizontal mixing in the model could bedue to a combination of weaker forcing (monthly winds), smoothertopography and a weaker modeled BSC.
4.3. The sources of shelf waters in the EITMZ
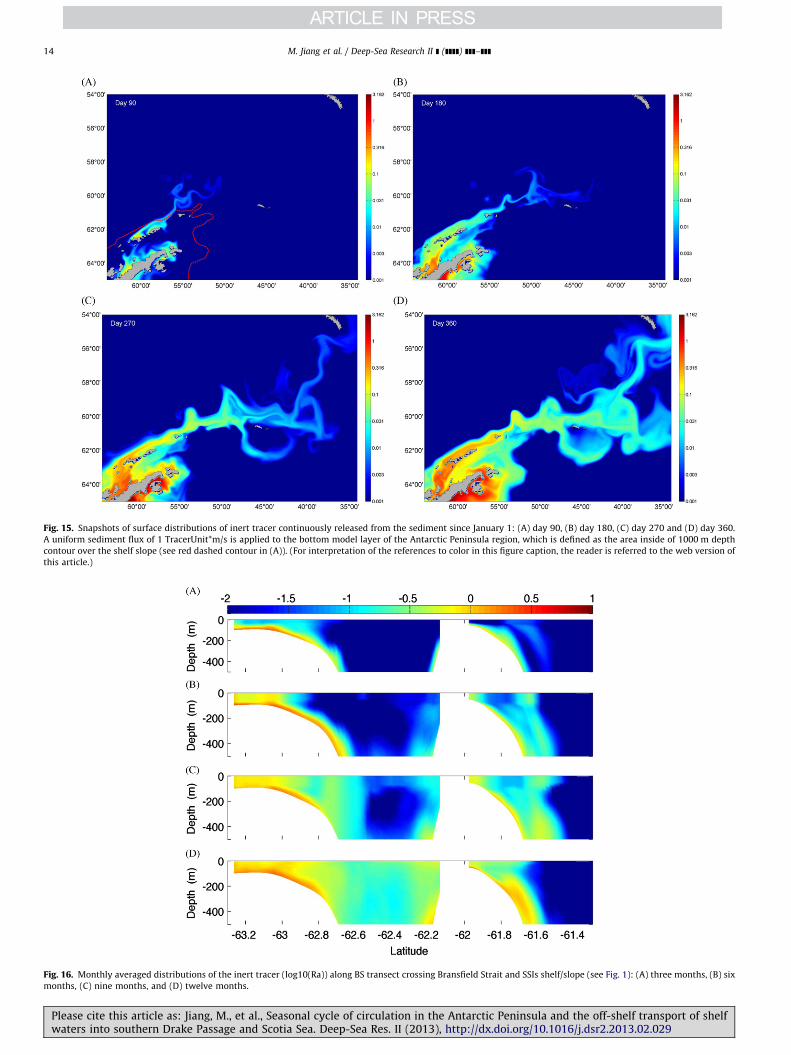
In order to illustrate the sources of sediment input from the APshelf region, we present a series of modeled surface distributionsof an inert tracer during the first year since the beginning of therelease (Fig. 15). The tracer first reaches the surface at the shallowcoastal areas around the SSIs and AP shelf region (Fig. 15A). Thosearound the northern SSIs shelf are transported downstream bythe shelfbreak current and some of them were entrained into theACC waters as indicated by the tracer band over the northern SSIsslope area at around 61.61S (Fig. 16A and B). The mixed waterscontinue northeast, reaching the Ona Basin in three months, andspreading into the southern Scotia Sea through the northern flankof the South Orkney Plateau in six months (Fig. 15B). After sixmonths, the tracer input from the western BS shelf areas and NWWeddell shelf is able to join the downstream waters in the EITMZ,mainly through the shelfbreak current with additional transportthrough the gap between EI and CI by the BSC. The strongest inputto the surface waters, however, occurs in winter when relativelyshallow water columns on shelf areas such as northwesternWeddell, the southern BS and northern SSIs shelves are well
Please cite this article as: Jiang, M., et al., Seasonal cycle of circulatiwaters into southern Drake Passage and Scotia Sea. Deep-Sea Res. I
mixed (Fig. 16C). After nine months, some of the mixed watersturn southward being entrained into the Weddell Front along thewestern edge of the South Orkney Plateau (Fig. 15C and D).
These model results and 228Ra measurements during the AMLR2006 cruise suggest that the mixed shelf-ACC waters northeast ofElephant Island can be derived from several sources. The majorsources appear to be the shallow sills between Gerlache Strait andSmith Island at the western end of Bransfield Strait and thenorthern SSIs shelf region, where winter mixing allows surfacewaters to interact with the seafloor sediments (Figs. 7, 15 and 16).The shelf area north of Livingston Island also exhibits relativelyelevated 228Ra concentration, �7–8 dmp/m3, indicating a poten-tial source (Fig. 7d). Companion measurements of short-lived224Ra (a good indicator for local effects) during the same cruisemore clearly indicate strong sediment sources in this area(Dulaiova et al., 2009). The BSC could also transport some of thesediment input in the BS through the gap between EI and CI.However, the model may have underestimated this contributiondue to the underpredicted BSC and winter vertical mixing.Measurements of 228Ra also suggest that sediment input aroundJoinville Island may be mixed to the surface during winter andthen spread over toward the EI region by the crossover flow of theWeddell Front (Fig. 7d). Model winter mixed layer in this area istoo shallow and hence sediment input in this area is not presentat the surface. Using the hydrographic data from the summer2004 and winter 2006 cruises as well AMLR 2004 (summer)cruises, Frants et al. (this issue) found that the shelf waters fromBS dominated the high Fe mixed waters in the northeast of EI,whereas the shelf waters from the northern SSIs shelf/slope alsocontributed to higher Fe mixed waters. Based on the character-istics of trace metals measured during the LMG0402 cruise,Measures et al. (this issue) argue that high Fe found northeastof EI is mainly from the shelf area surrounding SSIs and thewestern end of the BS, and they are unlikely to originate fromupwelling of deep waters over the northern SSIs shelf/slope. OurModel results suggest that an additional contribution of themixed shelf-ACC waters comes from the crossover flow ofWeddell Slope Current, consistent with the drifter analysis byThompson et al. (2009) (Figs. 2 and 8). However, the majority ofthis input is likely Fe-poor as suggested by the Fe measurementsalong a transect extending from EI into the Powell Basin duringthe NBP0606 cruise (Hatta et al., this issue).
5. Conclusions
A numerical model based on ROMS has been developed for theAntarctic Peninsula, Drake Passage, Scotia Sea, and northernWeddell Sea region. The model has been spun-up for three yearswith climatological forcing and a realistic simulation for 2004–2006 has been carried out with monthly forcing from observeddata, NCEP re-analysis output and a global circulation model(OCCAM) output. The model results are analyzed to understandthe seasonal variability of circulation in the AP shelf region andthe off-shelf transport in the northeast of Elephant Island.A naturally occurring tracer (radium isotope 228Ra) is also includedin the model to investigate the sediment nutrient (including Fe)input to the shelf region, and the subsequent transport and disper-sion to southern Drake Passage and Scotia Sea.
The model results suggest a persistent and coherent circula-tion pattern over much of the AP shelf region throughout the yearconsisting of several major components that converge watermasses from various sources toward Elephant Island. Thesecurrents are largely in geostrophic balance, mainly driven bysurface winds, topographic steering and large-scale forcing.Strong off-shelf transport of the Fe-rich shelf waters takes place
on in the Antarctic Peninsula and the off-shelf transport of shelfI (2013), http://dx.doi.org/10.1016/j.dsr2.2013.02.029i
Fig. 15. Snapshots of surface distributions of inert tracer continuously released from the sediment since January 1: (A) day 90, (B) day 180, (C) day 270 and (D) day 360.
A uniform sediment flux of 1 TracerUnit*m/s is applied to the bottom model layer of the Antarctic Peninsula region, which is defined as the area inside of 1000 m depth
contour over the shelf slope (see red dashed contour in (A)). (For interpretation of the references to color in this figure caption, the reader is referred to the web version of
this article.)
Fig. 16. Monthly averaged distributions of the inert tracer (log10(Ra)) along BS transect crossing Bransfield Strait and SSIs shelf/slope (see Fig. 1): (A) three months, (B) six
months, (C) nine months, and (D) twelve months.
M. Jiang et al. / Deep-Sea Research II ] (]]]]) ]]]–]]]14
Please cite this article as: Jiang, M., et al., Seasonal cycle of circulation in the Antarctic Peninsula and the off-shelf transport of shelfwaters into southern Drake Passage and Scotia Sea. Deep-Sea Res. II (2013), http://dx.doi.org/10.1016/j.dsr2.2013.02.029i
M. Jiang et al. / Deep-Sea Research II ] (]]]]) ]]]–]]] 15
over the northeastern shelf/slope of Elephant Island (EITMZ),driven by a combination of topographic steering, extension ofshelf currents, and strong horizontal mixing between ACC andshelf waters. Both the shelf circulation and off-shelf transportshow a significant seasonality, likely driven by strong seasonalvariations of surface winds and large-scale forcing. These resultsare generally consistent with historical studies and our recentfield surveys. The model, however, likely under-estimates thevertical mixing overall and the seasonality of currents in the APshelf region due to the monthly forcing applied.
Modeled and observed distributions of 228Ra suggest that amajority of Fe-rich surface waters exported off-shelf aroundElephant Island are from the shallow sills between Gerlache Straitand Livingston Island, and northern shelf of the South ShetlandIslands carried by the shelfbreak current and the Bransfield StraitCurrent. The shelf region at the tip of the Antarctic Peninsulaincluding eastern BS shelf and northwestern Weddell Shelf likelyalso contributes to the surface waters downstream. The verticalFe flux is largely due to strong winter vertical mixing, whichbrings surface water in contact with the shelf sediment in therelatively shallow areas. This vertical Fe flux, however, is likelyunder-estimated by the model because of the weak verticalmixing driven by the monthly forcing.
Acknowledgments
This project is supported by NOAA grant NA09OAR4310062.MZ and MJ are also supported by NSF grant 0948378 and MAC byNSF grant 0948442. The satellite altimetry data is provided byAVISO (http://www.aviso.oceanobs.com/). We thank the OCCAMmodeling group for providing their long-term global model out-put (http://www.noc.soton.ac.uk/JRD/OCCAM/EMODS/info/coord.php3). Relative humidity and precipitation data are provided byHOAPS project from http://www.hoaps.zmaw.de/index.php?id=home. We thank Kate Hedstrom at the University of Alaska atFairbank for providing the ROMS model with imbedded sea icecomponent. The numerical computation is carried out at thecluster computer RAVANA at the University of MassachusettsBoston.
References
Amos, A.F., 2001. A decade of oceanographic variability in summertime nearElephant Island, Antarctica. J. Geophys. Res. 106, 22,401–22,423.
Andersson, A., Fennig, K., Klepp, C., Bakan, S., Gral, H., Schulz, J., 2010. TheHamburg Ocean atmosphere parameters and fluxes from satellitedata—HOAPS-3. Earth Syst. Sci. Data Discuss 3, 143–194, http://dx.doi.org/10.5194/essdd-3-143-2010.
Antonov, J.I., Seidov, D., Boyer, T.P., Locarnini, R.A., Mishonov, A.V., Garcia, H.E.,Baranova, O.K., Zweng, M.M., Johnson, D.R., 2010. World Ocean Atlas 2009, vol.2: salinity. In: Levitus, S. (Ed.), NOAA Atlas NESDIS 69. U.S. GovernmentPrinting Office, Washington, D.C., pp. 184.
Ardelan, M.V., Holm-Hansen, O., Hewes, C.D., Reiss, C.S., Silva, N.S., Dulaiova, H.,Steinnes, E., Sakshaug, E., 2009. Natural iron enrichment around the AntarcticPeninsula in the southern Ocean. Biogeosci. Discuss. 6, 7481–7515.
Brandon, M.A., Naganobu, M., Demer, D.A., Chernyshkov, P., Trathan, P.N., Thorpe,S.E., Kameda, T., Berezhinskiy, O.A., Hawker, E.J., Grant, S., 2004. Physicaloceanography in the Scotia Sea during the CCAMLR 2000 survey, australsummer 2000. Deep-Sea Res. II 51, 1301–1321.
Capella, J., Ross, R., Quetin, L.B., Hofmann, E.E., 1992. A note on the thermalstructure of the upper ocean in the Bransfield Strait-South Shetland Islandsregion. Deep-Sea Res. I 39 (7–8), 1221–1229.
Charette, M., et al., 2007. Radium isotopes as tracers of iron sources fueling asouthern Ocean phytoplankton bloom. Deep-Sea Res. II 54, 18–20.
Collins, W.D., Bitz, C.M., Blackmon, M.L., Bonan, G.B., Bretherton, C.S., Carton, J.A.,et al., 2006. The Community Climate System Model version 3 (CCSM3). J. Clim.19 (11), 2122–2143.
Cunningham, S.A., Alderson, S.G., King, B.A., Brandon, M.A., 2003. Transport andvariability of the Antarctic Circumpolar Current in Drake Passage. J. Geophys.Res. 108 (C5), 8084, http://dx.doi.org/10.1029/2001JC001147.
Please cite this article as: Jiang, M., et al., Seasonal cycle of circulatiwaters into southern Drake Passage and Scotia Sea. Deep-Sea Res. I
Da Silva, A., Young, A.C., Levitus, S., 1994. Atlas of surface marine data 1994, vol. 1:Algorithms and procedures, Tech. Rep. 6. U.S. Department of Commerce,NOAA, NESDIS.
Ducklow, H.W., Baker, K., Fraser, W.R., Martinson, D.G., Quetin, L.B., Ross, R.M.,Smith, R.C., Stammerjohn, S., Vernet, M., 2007. Marine ecosystems: the WestAntarctic Peninsula. Phil. Trans. R. Soc. B 362, 67–94.
Dulaiova, H., et al., 2009. Shelf-derived iron inputs drive biological productivity inthe southern Drake Passage. Global Biogeochem. Cycle 23, GB4014.
Frants, M., Gille, S.T., Hewes, C.D., Holm-Hansen, O., Kahru, M., Lombrozo, A.,Measures, C.I., Mitchell, B.G., Wang, H., Zhou, M. Optimal multi-parameteranalysis of source water distributions in the Southern Drake Passage. Deep-SeaResearch II, this issue [http://dx.doi.org/10.1016/j.dsr2.2012.06.002].
Gomis, D., Garcia, M.A., Lopez, O., Pascual, A., 2002. Quasi-geostrophic 3Dcirculation and mass transport in the western Bransfield Strait during Australsummer 1995/96. Deep-Sea Res. II 49, 603–621.
Hatta, M. et al. Iron fluxes from the shelf regions near the South Shetland Islands inthe Drake Passage during the austral-winter 2006. Deep-Sea Research II, thisissue [http://dx.doi.org/10.1016/j.dsr2.2012.11.003].
Heywood, K.J., Garabato, A.C.N., Stevens, D.P., Muench, R., 2004. On the fate of theAntarctic Slope Front and the origin of the Weddell Front. J. Geophys. Res. 109,C06021.
Holm-Hansen, O., Kahru, M., Hewes, C.D., Kawaguch, S., Kameda, T., Sushin, V.A.,Krasovski, I., Priddle, J., Korb, R., Hewitt, R.P., Mitchell, B.G., 2004. Temporaland spatial distribution of chlorophyll-a in surface waters of the Scotia Sea asdetermined by both shipboard measurements and satellite data. Deep-Sea Res.II 51, 1323–1331.
Hunke, E.C., 2001. Viscous–plastic sea ice dynamics with the EVP model:linearization issues. J. Comp. Phys 170, 18–38.
Hunke, E.C., Dukowicz, J.K., 1997. An elastic–viscous–plastic model for sea icedynamics. J. Phys. Oceanogr. 27, 1849–1868.
Kahru, M., et al., 2007. Eddies enhance biological production in the Weddell-Scotiaconfluence of the southern Ocean. Geophys. Res. Lett. 34 (14), L14603, http://dx.doi.org/10.1029/2007GL030430.
Kalnay, E., Kanamitsu, M., Kistler, R., Collins, W., Deaven, D., et al., 1996. The NCEP/NCAR re-analysis project. Bull. Amer. Meteor. Soc. 77, 437–471.
Korb, R.E., Whitehouse, M.J., Gordon, M., Ward, P., Poulton, A.J., 2010. Summermicroplankton community structure across the Scotia Sea: implications forbiological carbon export. Biogeosciences 7, 343–356.
Large, W.G., McWilliams, J.C., Doney, S.C., 1994. Oceanic vertical mixing: a reviewand a model with a nonlocal boundary layer parameterization. Rev. Geophys.32 (4), 363–403.
Locarnini, R.A., Mishonov, A.V., Antonov, J.I., Boyer, T.P., Garcia, H.E., Baranova,O.K., Zweng, M.M., Johnson, D.R., 2010. World Ocean Atlas 2009, vol. 1:temperature. In: Levitu, S. (Ed.), NOAA Atlas NESDIS 68. U.S. GovernmentPrinting Office, Washington, D.C., pp. 184.
Matano, R.P., Gordon, A.L., Muench, R.D., Palma, E.D., 2002. A numerical study ofthe circulation in the northwestern Weddell Sea. Deep-Sea Res. II 49,4827–4841.
Martin, J.H., Gordon, R.M., Fitzwater, S.E., 1990. Iron in Antarctic waters. Nature345, 156–158.
Measures, C.I. et al. The influence of shelf processes in delivering dissolved iron tothe HNLC waters of the Drake Passage, Antarctica. Deep-Sea Research II, thisissue [http://dx.doi.org/10.1016/j.dsr2.2012.11.004].
Mellor, G.L., Kantha, L., 1989. An ice-ocean coupled model. J. Geophys. Res. 94,10,937–10,954.
Muench, R.D., Gordon, A.L., 1995. Circulation and transport of water along thewestern Weddell Sea margin. J. Geophys. Res. 100 (C9), 503–515 18.
Niiler, P.P., Amos, A.F., Hu, J.-H., 1991. Water masses and 200 m relativegeostrophic circulation in the western Bransfield Strait region. Deep-Sea Res.II 38, 943–959.
Orsi, A.H., Whitworth, T., Nowlin, W.D., 1995. On the meridional extent and frontsof the Antarctic circumpolar current. Deep-Sea Res. I 42, 641–673.
Shchepetkin, A.F., McWilliams, J.C., 2003. A method for computing horizontalpressure-gradient force in an oceanic model with a non-aligned verticalcoordinate. J. Geophys. Res. 108 (C3), 3090.
Shchepetkin, A.F., McWilliams, J.C., 2005. The regional oceanic modeling system(ROMS): a split-explicit, free-surface, topography-following-coordinate ocea-nic model. Ocean Modell. 9, 347–404.
Smagorinsky, J., 1963. General circulation experiments with the primitive equa-tions. Mon. Weather Rev. 91, 99–164.
Smolarkiewicz, P.K., 1984. A fully multidimensional positive-definite advectiontransport algorithm with small implicit diffusion. J. Comput. Phys. 54, 325–362.
Thompson, A.F., Heywood, K.J., 2008. Frontal structure and transport in thenorthwestern Weddell Sea. Deep-Sea Res. I 55, 1229–1251.
Thompson, A.F., Heywood, K.J., Thorpe, S.E., Renner, A.H.H., Trasvina, A., 2009.Surface Circulation at the tip of the Antarctic Peninsula from drifters. J. Phys.Oceanogr. 39, 3–26.
van Lipzig, N.P.M., King, J.C., Lachlan-Cope, T.A., van den Broeke, M.R., 2004.Precipitation, sublimation, and snow drift in the Antarctic Peninsula regionfrom a regional atmospheric model. J. Geophys. Res. 109, D24109.
von Gyldenfeldt, A.B., Fahrbach, E., Garcıa, M.A., Schroder, M., 2002. Flowvariability at the tip of the Antarctic Peninsula. Deep-Sea Res. II 49,4743–4766.
Vaughan, D.G., Marshall, G.J., Connolley, W.M., Parkinson, C., Mulvaney, R.,Hodgson, D., King, J.C., Pudsey, C.J., Turner, J., 2003. Recent rapid regionalclimate warming on the Antarctic Peninsula. Clim. Change 60, 243–274.
on in the Antarctic Peninsula and the off-shelf transport of shelfI (2013), http://dx.doi.org/10.1016/j.dsr2.2013.02.029i
M. Jiang et al. / Deep-Sea Research II ] (]]]]) ]]]–]]]16
Webb, D.J., B. A. de Cuevas and A. C. Coward, 1998, The first main run of theOCCAM global ocean model, Southampton Oceanography Centre, InternalDocument No. 34.
Zhou, M., Niiler, P.P., Hu, J.-H., 2002. Surface current in the Bransfield and GerlacheStraits measured by surface Lagrangian drifters. Deep-Sea Res. I 46, 267–280.
Zhou, M., Pearn, P., Zhu, Y., Dorland, R., 2006. The western boundary current in theBransfield Strait, Antarctica. Deep-Sea Res. I 53, 1244–1252.
Please cite this article as: Jiang, M., et al., Seasonal cycle of circulatiwaters into southern Drake Passage and Scotia Sea. Deep-Sea Res. I
Zhou, M., Zhu, Y., Dorland, R.D., 2010. Dynamics of the current system in thesouthern Drake Passage. Deep-Sea Res. I 57, 1039–1048.
Zhou, M. et al. Winter mesoscale circulation on the shelf slope region of the
southern Drake Passage. Deep-Sea Research II, this issue [http://dx.doi.org/10.1016/j.dsr2.2013.03.041].
on in the Antarctic Peninsula and the off-shelf transport of shelfI (2013), http://dx.doi.org/10.1016/j.dsr2.2013.02.029i