SEATH - A NEW TOOL FOR AUTOMATED FEATURE EXTRACTION IN THE CONTEXT OF OBJECT-BASED IMAGE ANALYSIS S. Nussbaum a , I. Niemeyer b , M.J. Canty a a Research Center Juelich Programme Group Systems Analysis and Technology Development (STE) D-52425 Juelich, Germany - (s.nussbaum, m.canty)@fz-juelich.de b Freiberg University of Mining and Technology Institute of Mine-Surveying & Geodesy D-09599 Freiberg, Germany - [email protected]KEY WORDS: Feature Analysis, Object-Oriented Techniques, Feature Quality Measure, Automation, Standardisation, Nuclear Safe- guards ABSTRACT: In order to avoid the time-consuming trial-and-error practice for seeking significant features for optimal class separation in object-based classification, an automatic feature extraction methodology, called SEaTH has been developed. SEaTH calculates the SEperability and the corresponding THresholds of object classes for any number of given features on the basis of a statistical approach. The statistical measure for determining the representative features for each object class is the mutual separability of the object classes. Subsequently, SEaTH calculates those thresholds which allow the best separability in the selected features. The methodology and its application to a case study on an Iranian nuclear facility are presented. With regard to the automation of object-based image processing, aspects of standardization and transferability are discussed. 1. INTRODUCTION Feature recognition is an essential part of object-based image analysis. A comprehensive feature extraction methodology is the precondition for successful work with image objects. Given the large number of possible features for object description, it is necessary to identify the characteristic, significant features for object-classes of interest. Questions like: ”Which of the nu- merous possible features are most characteristic for which object class?” or ”Is the feature I have chosen really the best possible feature?” have to be answered. These and other problems de- mand a consistent procedure for selecting object features as well as a quality measure for features. The methodology should be able to identify the most salient features for each object class and should also allow a comparison of their suitability. Since the availability of high-resolution satellite imagery, the use of remote sensing data has become very important for nuclear verification and safeguards purposes. 1 According to the expected technical improvements regarding the spatial and spectral reso- lution, satellite imagery can build the basis of complex systems in the future for recognizing and monitoring even small-scale and short-term structural features of interests within nuclear facilities. Examples are construction of buildings, plant expansion, changes of the operational status, planning of underground activities etc. Large volumes of satellite data require a high degree of automated image processing, analysis and interpretation. Though it seems to be overconfident to replace an image analyst completely by a software system, there certainly exist opportunities to obtain faster and more precise image analysis results. These include for example the pre-selection of relevant objects or the automatic de- tection and classification of changes. When adapted to high-resolution imagery, the traditional pixel- based image processing algorithms are sometimes limited. Espe- cially if small structural objects are to be detected, object-based procedures seem to be more precise and meaningful. In compar- ison to the purely spectral-based features used within the pixel- based approaches, the inclusion of features such as the size or ori- 1 The work presented in this paper has been carried out in the context of nuclear verification and international safeguards, in support of the In- ternational Atomic Energy Agency (IAEA). The developed feature anal- ysis tool can, of course, be used in any classification context. entation of an object, its shape or texture and its relations to other objects on the same or at different scales, considerably extends the possibilities for image analysis. Computer driven, object- based image analysis is in a first approximation comparable to visual perception. An image interpreter recognizes, along with the color of an image, also the shapes, textures and coherent re- gions present within it, and associates meaningful objects and their contextual relations. A similar goal is intended in object- based image analysis, although the complexity and effectiveness of human perception is of course far from being achieved. The extraction of the objects from the analyzed image occurs at the lowest level by segmentation, at which stage the primary seg- ments should ideally represent the real world objects. The feature analysis provides the basis for the preparation of a ruled-based classification model resulting in a classified image. In this paper we emphasize the important step of feature analysis. 2. SEATH ALGORITHM Generally, a semantic class can be described by its characteris- tic features and their distribution in the feature space. Using an object-based approach to analyze an image, there are many pos- sible features to take into consideration in order to describe the object classes of interest. Therefore it is necessary to determine the prominent features for each object class for the succeeding image analysis (Nussbaum, Niemeyer, and Canty, 2005). The feature analyzing tool SEaTH (SEparability and THresholds) identifies these characteristic features with a statistical approach based on training objects. These training objects represent a small subset out of the total amount of image objects and should be rep- resentative objects for each object class. The statistical measure for determining the representative features for each object class is the pairwise separability of the object classes among each other. Subsequently, SEaTH calculates the thresholds which allow the maximum separability in the chosen features. 2.1 SEparability The identification of the characteristic features is a problem of probability density estimation. On the basis of representative training data for each object class, the probability distribution
Transcript
SEATH - A NEW TOOL FOR AUTOMATED FEATURE EXTRACTION IN THE CONTEXT OFOBJECT-BASED IMAGE ANALYSIS
S. Nussbauma, I. Niemeyerb, M.J. Cantya
aResearch Center Juelich Programme Group Systems Analysis and Technology Development (STE)D-52425 Juelich, Germany - (s.nussbaum, m.canty)@fz-juelich.de
bFreiberg University of Mining and Technology Institute of Mine-Surveying & GeodesyD-09599 Freiberg, Germany - [email protected]
In order to avoid the time-consuming trial-and-error practice for seeking significant features for optimal class separation in object-basedclassification, an automatic feature extraction methodology, called SEaTH has been developed. SEaTH calculates the SEperability andthe corresponding THresholds of object classes for any number of given features on the basis of a statistical approach. The statisticalmeasure for determining the representative features for each object class is the mutual separability of the object classes. Subsequently,SEaTH calculates those thresholds which allow the best separability in the selected features. The methodology and its application toa case study on an Iranian nuclear facility are presented. With regard to the automation of object-based image processing, aspects ofstandardization and transferability are discussed.
1. INTRODUCTION
Feature recognition is an essential part of object-based imageanalysis. A comprehensive feature extraction methodology isthe precondition for successful work with image objects. Giventhe large number of possible features for object description, itis necessary to identify the characteristic, significant features forobject-classes of interest. Questions like: ”Which of the nu-merous possible features are most characteristic for which objectclass?” or ”Is the feature I have chosen really the best possiblefeature?” have to be answered. These and other problems de-mand a consistent procedure for selecting object features as wellas a quality measure for features. The methodology should beable to identify the most salient features for each object class andshould also allow a comparison of their suitability.
Since the availability of high-resolution satellite imagery, the useof remote sensing data has become very important for nuclearverification and safeguards purposes.1 According to the expectedtechnical improvements regarding the spatial and spectral reso-lution, satellite imagery can build the basis of complex systemsin the future for recognizing and monitoring even small-scale andshort-term structural features of interests within nuclear facilities.Examples are construction of buildings, plant expansion, changesof the operational status, planning of underground activities etc.Large volumes of satellite data require a high degree of automatedimage processing, analysis and interpretation. Though it seemsto be overconfident to replace an image analyst completely bya software system, there certainly exist opportunities to obtainfaster and more precise image analysis results. These include forexample the pre-selection of relevant objects or the automatic de-tection and classification of changes.
When adapted to high-resolution imagery, the traditional pixel-based image processing algorithms are sometimes limited. Espe-cially if small structural objects are to be detected, object-basedprocedures seem to be more precise and meaningful. In compar-ison to the purely spectral-based features used within the pixel-based approaches, the inclusion of features such as the size or ori-
1The work presented in this paper has been carried out in the contextof nuclear verification and international safeguards, in support of the In-ternational Atomic Energy Agency (IAEA). The developed feature anal-ysis tool can, of course, be used in any classification context.
entation of an object, its shape or texture and its relations to otherobjects on the same or at different scales, considerably extendsthe possibilities for image analysis. Computer driven, object-based image analysis is in a first approximation comparable tovisual perception. An image interpreter recognizes, along withthe color of an image, also the shapes, textures and coherent re-gions present within it, and associates meaningful objects andtheir contextual relations. A similar goal is intended in object-based image analysis, although the complexity and effectivenessof human perception is of course far from being achieved. Theextraction of the objects from the analyzed image occurs at thelowest level by segmentation, at which stage the primary seg-ments should ideally represent the real world objects. The featureanalysis provides the basis for the preparation of a ruled-basedclassification model resulting in a classified image. In this paperwe emphasize the important step of feature analysis.
2. SEATH ALGORITHM
Generally, a semantic class can be described by its characteris-tic features and their distribution in the feature space. Using anobject-based approach to analyze an image, there are many pos-sible features to take into consideration in order to describe theobject classes of interest. Therefore it is necessary to determinethe prominent features for each object class for the succeedingimage analysis (Nussbaum, Niemeyer, and Canty, 2005).
The feature analyzing tool SEaTH (SEparability and THresholds)identifies these characteristic features with a statistical approachbased on training objects. These training objects represent a smallsubset out of the total amount of image objects and should be rep-resentative objects for each object class. The statistical measurefor determining the representative features for each object class isthe pairwise separability of the object classes among each other.Subsequently, SEaTH calculates the thresholds which allow themaximum separability in the chosen features.
2.1 SEparability
The identification of the characteristic features is a problem ofprobability density estimation. On the basis of representativetraining data for each object class, the probability distribution
for each class can be estimated and used to calculate the sep-arability between two object classes. Under the assumption ofnormal probability distributions, the Bhattacharyya distance Bcan be used as a suitable separability measure. B is justified as ameasure of separability from the Bayesean decision rule for mis-classification probability. For the derivation of the Bhattacharyyadistance see (Bhattacharyya, 1943) or (Fukunaga, 1990). Fortwo classes (C1, C2) and one feature it is given by
B =1
8(m1 − m2)
2 2
σ21 + σ2
2
+1
2ln[
σ21 + σ2
2
2σ1σ2], (1)
where mi and σ2i , i = 1, 2, are the mean and the variance, respec-
tively, for the two feature distributions. If the means coincide, thefirst term in (1) vanishes, whereas the second term vanishes if thetwo feature distributions have equal variances.
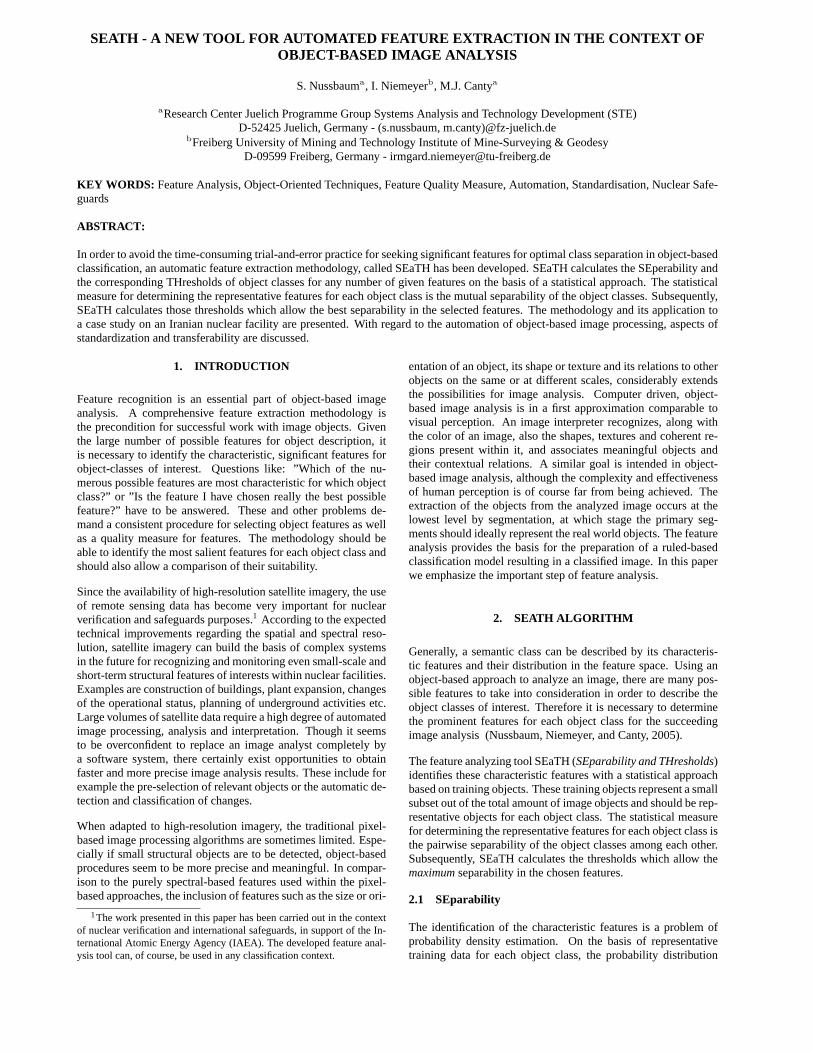
Figure 1 shows the probability distribution exemplified for twoobject classes C1 and C2 and three notional features A, B andC. In feature A both object classes show a partial separability,this means that there is an area where the probability distributionsof the object classes (C1 and C2) overlap in their feature charac-teristic. Given feature B this overlap is so large that its use for forclassification would result in a huge object misclassification rate.This feature therefore provides poor separability relative to ob-ject classes C1 and C2. The ideal case is represented by featureC. Here the object classes have no overlap in the feature char-acteristic it is therefore well-suited for classification: the featurehas complete separability.
Class 1(C )1
Class 2(C )2
FeatureA
Probability
m2
m1
2�1
2�2
Class 1(C )1
Class 2(C )2
FeatureB
Probability
m2
m1
2�1
2�2
Class 1(C )1
Class 2(C )2
FeatureC
Probability
m2
m1
2�1
2�2
Partial Separability
Poor Separability
Optimal Separability
Figure 1. Examples of probability distributions
An more useful measure for separation in classification contextsis the Jeffries-Matusita distance J which has, unlike B, a finite
dynamic range. This allows a better comparison of the featureanalysis results to identify that feature which has the separability.The Jeffries-Matusita distance measures the separability of twoclasses on a scale [0 − 2] in terms of B:
J = 2(1 − e−B). (2)
Complete separability of the two classes with respect to the ana-lyzed feature is indicated by J = 2. That is to say, on the basisof the training objects used, there will be no misclassifications ifthis feature is used for classification. The lower J is, the worseis the separability and the higher the number of misclassified ob-jects. SEaTH calculates the separability for any number of givenobject classes and object class combinations.
2.2 THreshold
Besides determining the features separating optimally the objectclasses among each other, it is essential to know also the decisionthreshold for the maximum separability. The knowledge of theoptimum threshold is necessary for the assembly of a ruled-basedclassification model.
The optimum threshold is also calculated by SEaTH. A Gaussianprobability mixture model of the form
p(x) = p(x|C1)p(C1) + p(x|C2)p(C2)
is fit to the frequency distribution of a feature for two objectclasses C1 and C2, where p(x|C1) is a normal distribution withmean mC1 and variance σ2
C1 and similarly for p(x|C2). The de-cision threshold which minimizes the error probability is obtainedby solving
p(x|C1)p(C1) = p(x|C2)p(C2). (3)
for x. Taking logarithms,
1
2σ2C2
(x−mC2)2− 1
2σ2C1
(x−mC1)2 = log[
σC1
σC2∗p(C2)
p(C1)] =: A
(4)with solutions
x1(2) =1
σ2C1 − σ2
C2
[mC2σ
2C1 − mC1σ
2C2 ± (5)
σC1
√(mC1 − mC2)2 + 2A(σ2
C1 − σ2C2)
]. (6)
The relevant solution of the two can be determined by requiringthat it lie between the two means m1, m2 of the probability dis-tributions. Thus, for the example in Figure 2, x1 is the correctchoice. Since the distributions are only partially separated (seesection 2.1), there will be some misclassifications when usingthis feature for classification of unknown object classes. Giventhe validity of the normal approximation assumption, SEaTH willminimize their number.
To identify the best features for the classification SEaTH calcu-lates the separability and the corresponding threshold for everyobject class combination and for every feature. Any number ofobject classes and features can be analyzed. The results of SEaTHare presented in tables. An interpretation of the results allows afast preparation of a classification model, with statistically opti-mized features and thresholds.
Class 1(C )1
Class 2(C )2
Feature
Probability
m2
m1
2�1
2�2
X2 X1ThresholdSolutions
Figure 2. Threshold identification
3. SEATH VALIDATION
The SEaTH Algorithm was validated by performing an accuracyassessment for an object-based analysis of an aerial image ac-quired over the Research Center Julich (FZJ) in September 1998.The image has a ground resolution of 1.25 m. Ground truth datawere available for the entire scene.
The image analysis process was carried out with the softwareeCognition (Baatz, Heyen, and Hofman, 2004). All image ob-ject were considered in the accuracy assessment, except for thoseimage objects representing mixed classes. Figure 3 shows theoriginal aerial image of the FZJ.
500 m
Figure 3. Research Center Julich, September 1998
In this scene, the object classes BUILT-UP, FIELDS, FOREST,MEADOWS, STREETS and SHADOWS were classified. Theclass BUILT-UP contains buildings and sealed surfaces whichare not streets. A very simple segmentation procedure was ap-plied, with only one scale level: scale factor 50, shape factor 0.3,compactness 0.5. Nevertheless most of the expected objects arewell-represent as individual segments.
The segmentation results in almost 2500 image objects. For theSEaTH analysis about 2% of the total number of image objectswere selected as training data, i.e. approximately ten objects foreach class. eCognition enables the user to select feature charac-teristics for the training objects. For the validation 74 spectral,
shape and texture features were taken into account. The trainingdata set was then analyzed with SEaTH, which calculated, for ev-ery object class combination, the separability and thresholds foreach of the 74 features (see Table 1).
Spectral featuresMean Channel 1,2,3Stddev Channel 1,2,3Ratio Channel 1,2,3Max.Diff.BrightnessShape featuresArea (m2)Length (m)Width (m)Length/widthCompactnessElliptic FitRectangular FitBorder length (m)Shape indexDensityMain directionAsymmetryTexture featuresGLCM Homogeneity (all dir.) Channel 1,2,3, all dir.GLCM Contrast (all dir.) Channel 1,2,3, all dir.GLCM Dissimilarity (all dir.) Channel 1,2,3, all dir.GLCM Entropy (all dir.) Channel 1,2,3, all dir.GLCM Ang. 2nd moment (all dir.) Channel 1,2,3, all dir.GLCM Mean (all dir.) Channel 1,2,3, all dir.GLCM StdDev (all dir.) Channel 1,2,3, all dir.GLCM Correlation (all dir.) Channel 1,2,3, all dir.GLDV Ang. 2nd moment (all dir.) Channel 1,2,3, all dir.GLDV Entropy (all dir.) Channel 1,2,3, all dir.GLDV Mean (all dir.) Channel 1,2,3, all dir.GLDV Contrast (all dir.) Channel 1,2,3, all dir.
Table 1. Features used for image analysis with SEaTH
Table 2 lists the two ”best” of the given 74 features for each objectclass combination. In general the first few features with maxi-mum separability are sufficient for classification, especially if theclassification model is to be applied to other image data. Forreasons of transferability, it is wise to keep the number of char-acteristic features low. A subsequent interpretation of the SEaTHresults finally leads to the compilation of a ruled-based classifi-cation model.
Here are some examples of how to read Table 2: the object classBUILT-UP is best separated from the class FOREST (line 1) withthe feature Ratio Channel 2. This feature nearly holds a com-plete separability (1.99). All image objects with a feature char-acteristic in Ratio Channel 2 smaller (column: omen) than 0.352(column: threshold) should be assigned to the class BUILT-UP.This statement can easily be implemented as a classification rulein eCognition; The best features for separation of FOREST fromMEADOWS (line 10) are texture features. Every image objectwith a GLCM Dissimilarity Chan. 2 feature characteristic greaterthan 12.92 belongs to the class FOREST, otherwise it will be clas-sified as MEADOWS.
The result of the object based classification is shown in Figure4. The class WATER has been classified manually since it corre-sponds to only one image object.
In remote sensing the accuracy assessment is important for theevaluation and the comparison of classification results. A goodoverview of general techniques, accuracy measures, the construc-tion of an error matrix and the sampling problem can be found in(Congalton, 1991). For the accuracy assessment of the object-oriented classification based on the SEaTH results the overall ac-curacy as well as the users- and producers accuracy were calcu-lated.
Object Class Combination Separability Omen ThresholdBUILT-UP. from FORESTRatio Chan. 2 1.99 small 0.352Ratio Chan. 1 1.95 great 0.309BUILT-UP. from STREETSDensity 1.69 great 1.105Length (m) 1.17 small 150.901BUILT-UP. from MEADOWSRatio Chan. 2 1.85 small 0.351Max.Diff. 1.80 small 0.107BUILT-UP. from FIELDSRatio Chan. 3 1.97 great 0.311Ratio Chan. 1 1.89 small 0.345SHADOWS from BUILT-UPMean Chan. 2 1.98 small 94.810Mean Chan. 1 1.98 small 85.900SHADOWS from FORESTGLCM Ang. 2nd (a.d.) Chan. 2 1.41 great 0.0006GLCM Ang. 2nd moment (all dir.) 1.37 great 0.0007SHADOWS from STREETSMean Chan. 1 2.00 small 117.769GLCM Mean (all dir.) Chan. 1 2.00 small 121.413SHADOWS from MEADOWSMean Chan. 2 1.96 small 93.979GLCM Mean (all dir.) Chan. 2 1.94 small 99.268FOREST from STREETSGLCM Mean (all dir.) Chan. 1 2.00 small 120.944Mean Chan. 1 2.00 small 130.044FOREST from MEADOWSGLCM Dissim. (all dir.) Chan. 2 1.99 great 12.920GLDV Mean (all dir.) Chan. 2 1.99 great 12.920FOREST from FIELDSGLCM Dissim. (all dir.) Chan. 2 1.99 great 13.333GLDV Mean (all dir.) Chan. 2 1.99 great 13.333STREETS from FIELDSRatio Chan. 3 1.97 great 0.316Max.Diff. 1.94 small 0.078STREETS from MEADOWSRatio Chan. 2 1.92 small 0.344Max.Diff. 1.89 small 0.074MEADOWS from FIELDSRatio Chan. 1 1.82 small 0.345Ratio Chan. 2 1.52 great 0.361
Table 2. Summarized result of the SEaTH analysis
Figure 4. Classification of the ariel image acquired over the FZJ
Results are presented in a common error matrix, which speci-fies the ground truth data in columns and the classified objects in
rows against each other (see Table 3). The diagonal of the ma-trix shows the correctly identified objects (here in boldface). Dueto space considerations, the reference object data in the columnsare represented by numbers which represents the object classes.The number is equivalent to the numbers given in the rows of theclassified objects.
Table 3. Accuracy assessment of the FZJ classification
Since there are ground information data for every of the 2036reference objects taken for the accuracy assessment, the confi-dence level is 100%. The overall accuracy for the classifica-tion based on SEaTH is 95%. The producer accuracy amountsto 90% or better for all object classes, except for the object classSTREETS with a producer accuracy of only 81%. In all otherobject classes, over 90% of the reference objects where identifiedcorrectly, in the case of FOREST even 98%. The worst result,obtained for the object class STREETS, was predictable on thebasis of the SEaTH results, given the separability of the classesBUILT-UP and STREETS of 1.69. The reliability of the classifi-cation is represented by the user accuracy, which is 90% for mostof the classes over 90%, except for the object classes FIELDS andSHADOWS. With regard to nuclear verification the class BUILT-UP is particularly important, for example to confirm State decla-rations regarding new construction.
4. TEST CASE IRAN: ARAK
In this section the SEaTH methodology is applied to an actual testcase, the nuclear installation at Arak in the Iran. Since the Iranis a member of the Non-Proliferation Treaty (NPT), InternationalAtomic Energy Agency (IAEA) Safeguards measures are beingapplied to the site. The facility Arak contains a Heavy WaterProduction Plant, a 40 MWt Research Reactor as well as hot cellsunder construction.
Site area monitoring was carried out on the basis of ASTER satel-lite data at 15m ground resolution. For observation of individ-ual facilities over time, high spatial resolution Quickbird imagesat 0.6m ground resolution have also been used (Niemeyer andNussbaum, 2006). This case study uses two Quickbird imagesacquired over the facility from 12 June 2004 and 20 June 2005. Inthe following, we will focus on the extraction of an object-basedclassification model using the results of the feature analysis toolSEaTH. The other steps (preprocessing, classification and changedetection) will only be mentioned briefly.
The pre-processing of the satellite images consisted of automatedimage-to-image-registration (Lehner, 1986) and wavelet-basedimage sharpening (Ranchin and Wald, 2000). For reasons oftransferability of the classification model, relative radiometric nor-malization was also applied to the data sets (Canty, Nielsen, andSchmidt, 2004).
500m
Figure 5. QUICKBIRD image of the Arak Facility, 12 June 2004- pre-processed, original image provided by Digital Globe
The extraction of the objects is carried out by the multi-scale seg-mentation within eCognition with standardized parameters (Baatzand Schaepe, 2000). The SEaTH analysis is carried out for twosegmentation levels. On a higher level the big real world objectse.g. great buildings where analysed followed by the lower levelwhere small structures are represented e.g. watchtowers.
TextureGLCM Homogeneity (all dir.) Channel 1,2,3,4, NDVI, all dir.GLCM Contrast (all dir.) Channel 1,2,3,4, NDVI, all dir.GLCM Dissimilarity (all dir.) Channel 1,2,3,4, NDVI, all dir.GLCM Entropy (all dir.) Channel 1,2,3,4, NDVI, all dir.GLCM Ang. 2nd moment (all dir.) Channel 1,2,3,4, NDVI, all dir.GLCM Mean (all dir.) Channel 1,2,3,4, NDVI, all dir.GLCM StdDev (all dir.) Channel 1,2,3,4, NDVI, all dir.GLCM Correlation (all dir.) Channel 1,2,3,4, NDVI, all dir.GLDV Ang. 2nd moment (all dir.) Channel 1,2,3,4, NDVI, all dir.GLDV Entropy (all dir.) Channel 1,2,3,4, NDVI, all dir.GLDV Mean (all dir.) Channel 1,2,3,4, NDVI, all dir.GLDV Contrast (all dir.) Channel 1,2,3,4, NDVI, all dir.
Table 4. Features used for image analysis with SEaTH
Feature extraction and semantic modelling is implemented on thebasis of representative training objects for each of the definedobject classes: BACKGROUND, BUILT-UP, SHADOWS, TAR-MAC STREETS, VEGETATION and WATCHTOWERS. Table4 gives an overview of the analyzed features. SEaTH now cal-culates for each possible combination of two object classes theirseparability in any feature plus the corresponding threshold (see.Sect.2.). An interpretation of the SEaTH results leads to the com-pilation of a rule-based classification model and finally to a clas-
sified image. The model itself will not presented here, howeverFigure 6 shows the site classification for June 2004.
Figure 6. Classification of the Arak Facility, 12 June 2004
At first view, the results seem coherent, with none of the salt andpepper effects that appear often in pixel-based approaches. Mostof the objects are classified correctly. An accuracy assessmentwas carried out as explained in section 3. Here 260 reference ob-jects from a total of 9000 image objects were considered. Theoverall classification accuracy is 92%. Table 5 also shows the cal-culated user and producers accuracy for each class. In particularthe good accuracy achieved in the class BUILT-UP is importantfor Safeguards related purposes.
Table 5. Accuracy assessment of the Arak 2004 classification
The question whether the features identified with SEaTH are ”keyfeatures“ for the analyzed object classes is a question of transfer-ability. For an automated monitoring regime, it would be bene-ficial if the created classification model can be applied as an ref-erence model for all other scenes of the Arak site or, even better,for other facilities.
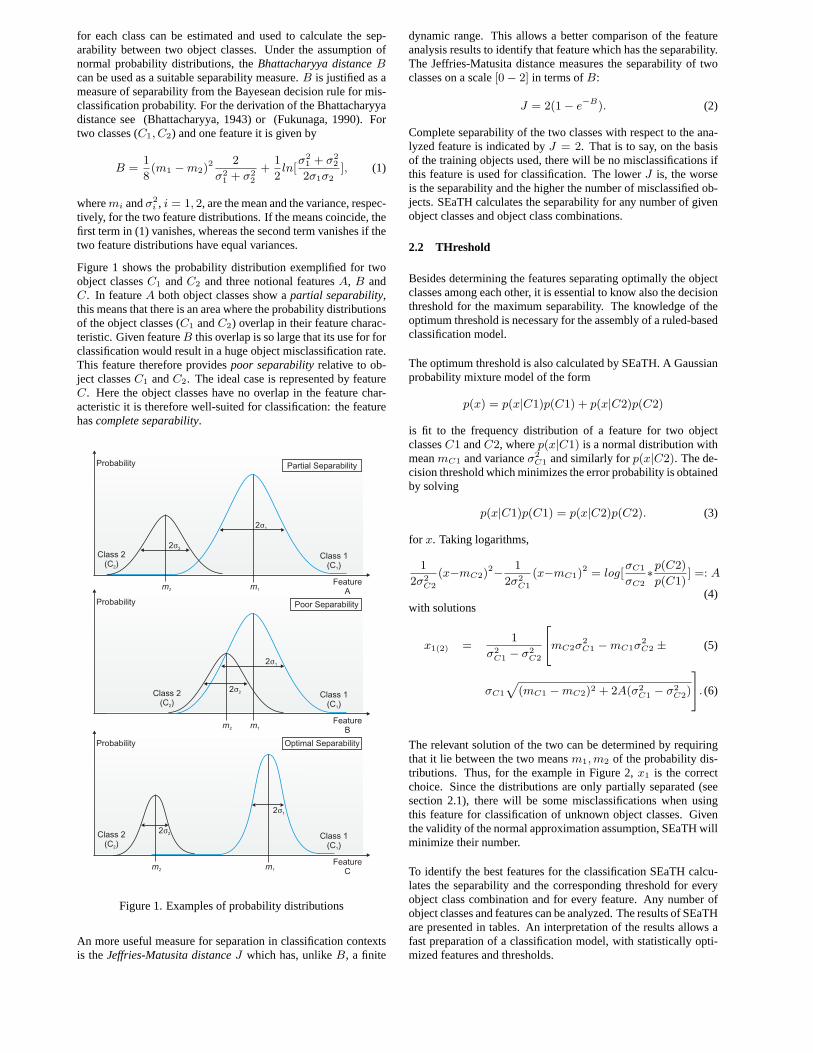
The results of a temporal transferability test of the classificationmodel is presented in Figure 7. Here the classification modelfrom Arak 2004 is applied to a pre-processed Quickbird image ofthe Arak facility from 20 June 2005. Choosing nearly the same
acquisition dates (both in June) and keeping the exact model, theachieved classification result is, with an overall accuracy of 91%,quite satisfactory.
Figure 7. Classified image of the Arak Facility, 20 June 2005
5. CONCLUSIONS AND FUTURE WORK
A comprehensive feature analysis is essential for the work withimage objects. It utilizes the advantage of a wide feature basisof objects and provides the fundament for a successful classifica-tion. The feature recognition and analysis Tool SEaTH has beendescribed, validated and exemplified for a case study on the Ira-nian Facility of Arak. SEaTH is a very useful tool in the contextof feature analysis. It is able to evaluate statistically any num-ber of given features for object classes of interest. The results ofSEaTH allow an optimized object-oriented classification whichminimizes the misclassified rate.
The features identified with SEaTH produce a good classificationresult for the Arak site and even the temporal transferability ofthe classification works very well. In future work SEaTH willbe improved regarding features wich are not approximately nor-mal distributed. Other investigations belonging to the temporaltransferability of training objects for the SEaTH analysis will becarried out.
In all, SEaTH shows promising results in the field of featurerecognition for Nuclear Safeguards related purposes. In the givencase study the buildings could be identified correctly, and thisinformation can be used in combination with a change detectiontechnique for nuclear verification. In future work on nuclear veri-fication a comprehensive change detection and interpretation sys-tem has to be developed. To this end, characteristic features fordifferent facility types in different geographical/political areas areurgently needed. Moreover, automatic procedures for geometricregistration, radiometric normalization, image fusion/sharpeninghave to be developed and/or improved.
REFERENCES
Baatz, M., Heyen, M., and Hofman, P., 2004. ecognition profes-sional. user guide 4. User Guide. Definiens AG. http://www.definiens-imaging.com.
Baatz, M. and Schaepe, A., 2000. Multiresolution segmentation - an opti-mization approach for high quality multi-scale image segmentation. InJ Strobl and T Blaschke (Eds.), Angewandte Geographische Informa-tionsverarbeitung XII, Beitraege zum AGIT-Symposium Salzburg, Hei-delberg, pp. 12–23.
Bhattacharyya, A. A., 1943. On a measure of divergence between twostatistical populations defined by their probability distributions. CalcuttaMath. Soc. 35, 99–110.
Canty, M. J., Nielsen, A. A., and Schmidt, M., 2004. Automatic radio-metric normalization of multispectral imagery. Remote Sensing of Envi-ronment 91, 441–451.
Congalton, R. G., 1991. A review of assessing the accuracy of classifica-tion of remotely sensed data. Remote Sensing Environment 37, 35–46.
Fukunaga, K., 1990. Introduction to Statistical Pattern Recognition, Sec-ond Edition. New York: Academic Press Inc.
Lehner, M., 1986. Triple stereoscopic imagery simulation and digital im-age correlation for meoss project. Proc. ISPRS Commision I Symposium,Stuttgart, pp. 477–484.
Niemeyer, I. and Nussbaum, S., 2006. Change Detection: The Poten-tial for Nuclear Safeguards. in: Verifying Treaty Compliance - LimitingWeapons of Mass Destruction and Monitoring Kyoto Protocol Provisions,R. Avenhaus, N. Kyriakopoulos, M. Richard and G. Stein (Ed.), Springer.
Nussbaum, S., Niemeyer, I., and Canty, M., 2005. Feature recognition inthe context of automated object-oriented analysis of remote sensing datamonitoring the iranian nuclear sites. Proc. SPIE Europe Symposium onOptics/Photonics in Security & Defence, 26-28 September 2005, Bruges,Belgium 5988.
Ranchin, T. and Wald, L., 2000. Fusion of high spatial and spectral resolu-tion images: The arsis concept and its implementation. PhotogrammetricEngineering and Remote Sensing 66, 49–61.