sustainability Article Seawater Fluorescence Near Oil Occurrence Emilia Baszanowska * and Zbigniew Otremba Department of Physics, Gdynia Maritime University, 81-225 Gdynia, Poland; [email protected]* Correspondence: [email protected]; Tel.: +48-58-5586-588 Received: 31 March 2020; Accepted: 13 May 2020; Published: 15 May 2020 Abstract: Petroleum and its related products pose a serious pollution risk to the world’s seas and require a simple, rapid detection method. This is a difficult task if the pollution is under the water surface. One common approach to oil detection is excitation-emission spectroscopy (EEMs) of seawater exposed to oil for analyzing the fluorometric index (FI o/w ) as a potential indicator of oil presence in the marine environment. In this paper, FI o/w was determined for both natural seawater and samples of the same water, but exposed to a relatively small portion of oil. The water samples were collected from the coastal and port waters of the Gdynia region (Southern Baltic Sea) from five stations, four times at two-week intervals. FI o/w indicates the changes between seawater sampled from the marine environment and the same seawater polluted with oil substances. Moreover, the obtained FI o/w values do not depend on the point and time of sampling. In all cases of seawater exposed to oil, significantly higher FI o/w values were observed than for unpolluted seawater. Moreover, the detection of oil by analyzing the value of FI o/w is efficient if the oil-to-water weight ratio is close to or above 5 × 10 -6 . Keywords: oil in seawater; oil fluorescence; oil detection; seawater fluorescence; excitation-emission spectra; fluorometric index 1. Introduction Oil pollution can enter marine waters from various sources, such as stormwater drainage from cities, untreated waste disposal from factories and industrial facilities, as well as unregulated recreational boating, onshore air pollution or natural seeps and by the heavy traffic in marine transport. The challenge is the prevention, detection, and removal of spills [1]. The ability to detect oil in the aquatic environment depends on the oil form and weathering state, the amount of oil in seawater and the spatial scale of the oil spill. When oil is visible on the surface of seawater, space-borne remote sensing detection, or airborne detection [2,3] are the most effective methods to assess the scale of the spillage. The advantage of remote sensing is the ability to observe events in remote and often inaccessible areas such as oil spills from ruptured pipelines. Moreover, remote sensing data through multi-temporal imaging allow obtaining information about the oil movement rate and direction, which is crucial in oil spill control. Remote sensing is based on a wide range of devices such as infrared video, photography from airborne platforms, thermal infrared imaging, and laser fluorosensors. In oil spill detection, airborne or space-born optical sensors are useful. After a very large oil spill in the Gulf of Mexico in 2010, various space-borne remote sensors were tested as possibly suitable for oil pollution detection and oil slick tracking [4–8]. However, during darkness and under poor weather conditions, only Synthetic Aperture Radar (SAR) is reliable [2,9]. When oil is invisible in an optical range, there is a broad spectrum of methods available for oil detection, such as ultraviolet, infrared or Raman spectroscopy [1,10,11] and sensitive methods based on fluorescence phenomenon [12,13]. Submersed oil (for example, oil-in-water emulsions) to a small extent manifests itself in the above-water upward radiance field, although detection is possible under certain lighting and weather conditions [14] or using underwater sensors [15]. Sustainability 2020, 12, 4049; doi:10.3390/su12104049 www.mdpi.com/journal/sustainability
Transcript
sustainability
Article
Seawater Fluorescence Near Oil Occurrence
Emilia Baszanowska * and Zbigniew OtrembaDepartment of Physics, Gdynia Maritime University, 81-225 Gdynia, Poland; [email protected]* Correspondence: [email protected]; Tel.: +48-58-5586-588
Received: 31 March 2020; Accepted: 13 May 2020; Published: 15 May 2020�����������������
Abstract: Petroleum and its related products pose a serious pollution risk to the world’s seas andrequire a simple, rapid detection method. This is a difficult task if the pollution is under the watersurface. One common approach to oil detection is excitation-emission spectroscopy (EEMs) ofseawater exposed to oil for analyzing the fluorometric index (FIo/w) as a potential indicator of oilpresence in the marine environment. In this paper, FIo/w was determined for both natural seawaterand samples of the same water, but exposed to a relatively small portion of oil. The water sampleswere collected from the coastal and port waters of the Gdynia region (Southern Baltic Sea) from fivestations, four times at two-week intervals. FIo/w indicates the changes between seawater sampled fromthe marine environment and the same seawater polluted with oil substances. Moreover, the obtainedFIo/w values do not depend on the point and time of sampling. In all cases of seawater exposed tooil, significantly higher FIo/w values were observed than for unpolluted seawater. Moreover, thedetection of oil by analyzing the value of FIo/w is efficient if the oil-to-water weight ratio is close to orabove 5 × 10⁻⁶.
Keywords: oil in seawater; oil fluorescence; oil detection; seawater fluorescence; excitation-emissionspectra; fluorometric index
1. Introduction
Oil pollution can enter marine waters from various sources, such as stormwater drainagefrom cities, untreated waste disposal from factories and industrial facilities, as well as unregulatedrecreational boating, onshore air pollution or natural seeps and by the heavy traffic in marine transport.The challenge is the prevention, detection, and removal of spills [1]. The ability to detect oil in theaquatic environment depends on the oil form and weathering state, the amount of oil in seawater andthe spatial scale of the oil spill. When oil is visible on the surface of seawater, space-borne remotesensing detection, or airborne detection [2,3] are the most effective methods to assess the scale ofthe spillage. The advantage of remote sensing is the ability to observe events in remote and ofteninaccessible areas such as oil spills from ruptured pipelines. Moreover, remote sensing data throughmulti-temporal imaging allow obtaining information about the oil movement rate and direction, whichis crucial in oil spill control. Remote sensing is based on a wide range of devices such as infrared video,photography from airborne platforms, thermal infrared imaging, and laser fluorosensors. In oil spilldetection, airborne or space-born optical sensors are useful. After a very large oil spill in the Gulf ofMexico in 2010, various space-borne remote sensors were tested as possibly suitable for oil pollutiondetection and oil slick tracking [4–8]. However, during darkness and under poor weather conditions,only Synthetic Aperture Radar (SAR) is reliable [2,9].
When oil is invisible in an optical range, there is a broad spectrum of methods available for oildetection, such as ultraviolet, infrared or Raman spectroscopy [1,10,11] and sensitive methods basedon fluorescence phenomenon [12,13]. Submersed oil (for example, oil-in-water emulsions) to a smallextent manifests itself in the above-water upward radiance field, although detection is possible undercertain lighting and weather conditions [14] or using underwater sensors [15].
Fluorescence spectroscopy also seems to be a sensitive method to study the complex structure ofhydrocarbons with aromatic compounds responsible for oil fluorescence. However, seawater exhibitsits own fluorescence spectra due to the presence of natural seawater components, referred to asDissolved Organic Matter (DOM) [16], Fluorescent Dissolved Organic Matter (FDOM) [17], ColouredDissolved Organic Matter (CDOM) [18,19], phytoplankton [20] and pigments [21]. It was found thatthe fluorescent properties of seawater in the ultraviolet (UV) range change after contact with evena small amount of oil. The fact that the shape of the spectra of seawater fluorescence changes aftercontact with oil has already been demonstrated [13] in studies of the ultraviolet field (excitation from200 to 340 nm, emission 240–500 nm). Thus, the problem to be solved now is how to identify waterthat has been in contact with oil, based on fluorescence spectra.
The research described in this paper involves situations in which oil appears in the marineenvironment, but visual perception is unlikely. The oil may be invisible when it enters the waterin small amounts but can become a threat over time. These events can occur, for example, in thecase of unsealing underwater pipes [22], oil leaking during port trans-shipment [23], or leaks fromwrecks [24,25]. Fuel leaks or lubricating oil from ships cannot be ruled out even if they operatefaultlessly, or when a failure was not noticed by the ship’s crew. In some parts of the sea, there may benatural seepage from the bottom of the sea [26–28].
The paper reports on a study of the effectiveness of fluorometric index (FIo/w) for water sampledfrom the sea at different points sampled several times in the warm season. It is, therefore, a continuationand extension of the authors’ previous paper [29] that includes water from only one place. In thepresent paper reports on a study extracted from excitation-emission fluorescence matrix spectra (EEMs),fluorometric index (FIo/w) for water sampled from the sea in five stations located along the coastal andport waters of the Gdynia region (Southern Baltic Sea) collected at four times in summer season (Juneand July) in this area.
2. Materials and Methods
2.1. Seawater Sampling and Combining with Oil
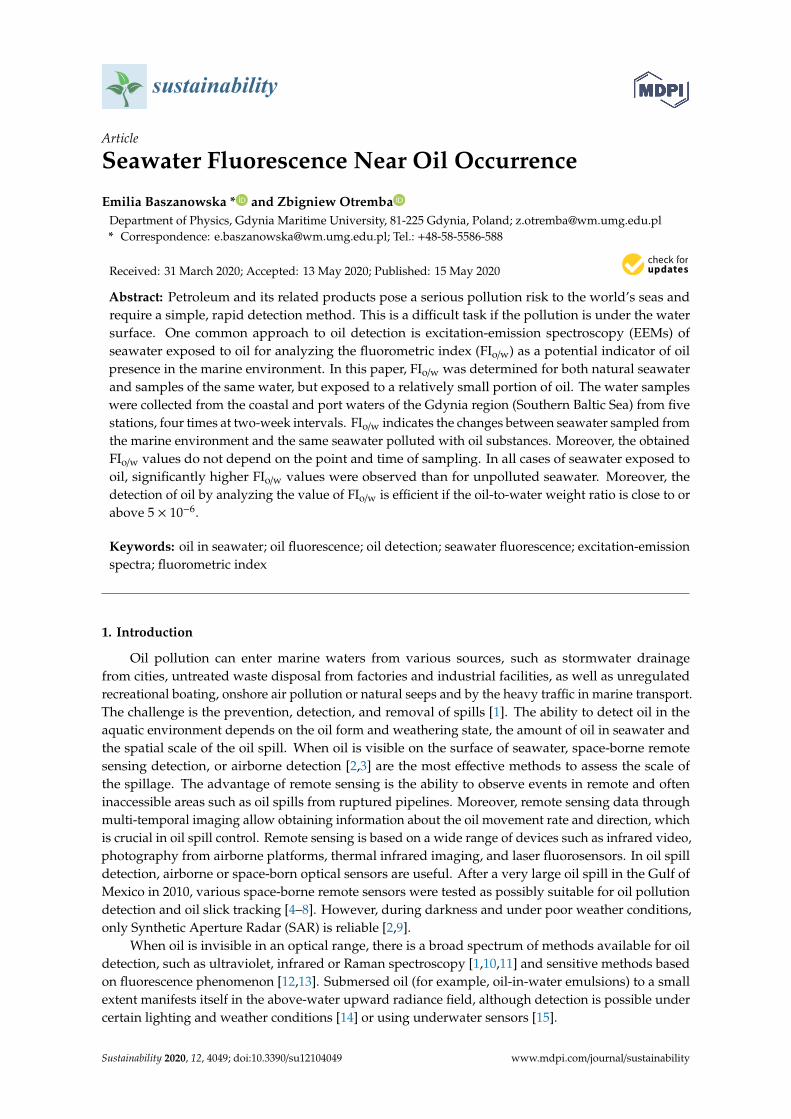
Seawater samples were taken at the seaside (near Gdynia Port, Gulf of Gdansk in the SouthernBaltic Sea, Poland) and in two points of the Port of Gdynia (Figure 1a). Seawater samples werecollected from a 1 m depth into 1-L glass bottles, four times every two weeks in June and July (warmsummer season): at the beginning of June (T = 10.7 ◦C and salinity 7.2 PSU), the middle of June(T = 14.6 ◦C and salinity 7.4 PSU), the end of June (T = 15.9 ◦C and salinity 7.2 PSU) and the middleof July (T = 16.1 ◦C and salinity 7.0 PSU). For the test, the warm summer season was selected due tothe high content of phytoplankton and blooms of cyanobacteria (usually observed in June, July, andAugust when the temperature of the Baltic Sea is the highest, about 17–20 ◦C). The components couldhave a significant influence on the oil fluorescence in seawater due to the fluorescence of oil beingpartially covered in an area where chlorophyll or Colored Dissolved Organic Matter strongly absorbslight radiation [13,30–32]. Moreover, the presence of individual species of cyanobacteria may affect thesuccession of phytoplankton in the aquatic environment [33].
Crude oil Petrobaltic extracted from the Baltic Sea shelf (light crude, with American PetroleumInstitute (API) gravity 43–44◦ and sulfur content 0.12%) was used as material for the laboratorycontamination of seawater. A small droplet of oil was placed on a slice of aluminum foil and wasthen weighed and inserted into a seawater sample (Figure 1b) to reach the desired oil-to-water ratio(ro/w)—explains the ratio of weighted oil to a certain amount of seawater. Six samples polluted by oilwith an oil-to-water ratio (ro/w) in the range of 0.5 × 10⁻⁶ to 500 × 10−6 were prepared (the use of theunit “ppm” has been abandoned because the actual concentration of oil substances that have passedinto the oil is unknown). The studied seawater before fluorescence measurements was exposed to theadded oil for one day.
Sustainability 2020, 12, 4049 3 of 9
Sustainability 2020, 12, x FOR PEER REVIEW 3 of 10
Pier (a) and method of controlled contamination of the seawater sample (b).
Crude oil Petrobaltic extracted from the Baltic Sea shelf (light crude, with American Petroleum
Institute (API) gravity 43–44° and sulfur content 0.12%) was used as material for the laboratory
contamination of seawater. A small droplet of oil was placed on a slice of aluminum foil and was
then weighed and inserted into a seawater sample (Figure 1b) to reach the desired oil-to-water ratio
(ro/w) - explains the ratio of weighted oil to a certain amount of seawater. Six samples polluted by oil
with an oil-to-water ratio (ro/w) in the range of 0.5 × 10⁻⁶ to 500 × 10−6 were prepared (the use of the
unit “ppm” has been abandoned because the actual concentration of oil substances that have passed
into the oil is unknown). The studied seawater before fluorescence measurements was exposed to
the added oil for one day.
2.2. Measurements
A Hitachi F-7000 spectrofluorometer was used to determine the excitation-emission spectra
(EEMs). Measurements were performed for excitation wavelengths ranging from 200 nm to 480 nm
with an excitation sampling interval of 5 nm, whereas the emission wavelengths were changed
from 260 nm to 700 nm with an emission sampling interval of 5 nm. The excitation slit was
established as 10 nm, the emission slit 10 nm, the integration time 0.5 s, and the photomultiplier
tube voltage was 400 V.
The EEMs were determined for seawater sampled from the sea environment and seawater
exposed to Petrobaltic-type crude oil for various oil-to-water ratios. Measurements were performed
at a stabilized temperature of 20 °C. Rayleigh scattering to yield a digital matrix of EEMs was
removed (if the excitation wavelength and emission wavelengths were equal, and the emission
wavelength was two times higher than the excitation wavelength).
3. Results and Discussion
3.1. Fluorometric Index (FI) Determination Procedure Using EEMs of the Seawater Before and After
Combining with Oil
The EEM spectra were determined for natural seawater and oil-polluted seawater samples for
several oil-to-water ratios: 0.5 × 10⁻⁶, 5 × 10⁻⁶, 50 × 10−6 and 500 × 10−6 from five stations at four
sampling times in June and July. Figure 2 presents examples of EEMs for natural seawater samples
at five stations (Figure 2a) and polluted by oil for an oil-to-water ratio of 50 × 10−6 (Figure 2b) in the
middle of July. The EEM spectra of natural seawater in Figure 2a indicates the presence of the main
peak in the UV-range positioned at an excitation wavelength from 200 nm to 280 nm (centered at
225 nm) corresponding to an emission wavelength from 300 nm to 450 nm centered at 355 nm (see
Figure 1. Sampling points: #1–Gdynia-Orłowo Walking Pier, #2–Gdynia Seaside Promenade,#3–Gdynia-Port Pomorskie Quay, #4–Gdynia-Port Cruise-Ship Terminal, #5–Mechelinki WalkingPier (a) and method of controlled contamination of the seawater sample (b).
2.2. Measurements
A Hitachi F-7000 spectrofluorometer was used to determine the excitation-emission spectra(EEMs). Measurements were performed for excitation wavelengths ranging from 200 nm to 480 nmwith an excitation sampling interval of 5 nm, whereas the emission wavelengths were changed from260 nm to 700 nm with an emission sampling interval of 5 nm. The excitation slit was established as10 nm, the emission slit 10 nm, the integration time 0.5 s, and the photomultiplier tube voltage was400 V.
The EEMs were determined for seawater sampled from the sea environment and seawaterexposed to Petrobaltic-type crude oil for various oil-to-water ratios. Measurements were performed ata stabilized temperature of 20 ◦C. Rayleigh scattering to yield a digital matrix of EEMs was removed(if the excitation wavelength and emission wavelengths were equal, and the emission wavelength wastwo times higher than the excitation wavelength).
3. Results and Discussion
3.1. Fluorometric Index (FI) Determination Procedure Using EEMs of the Seawater before and after Combiningwith Oil
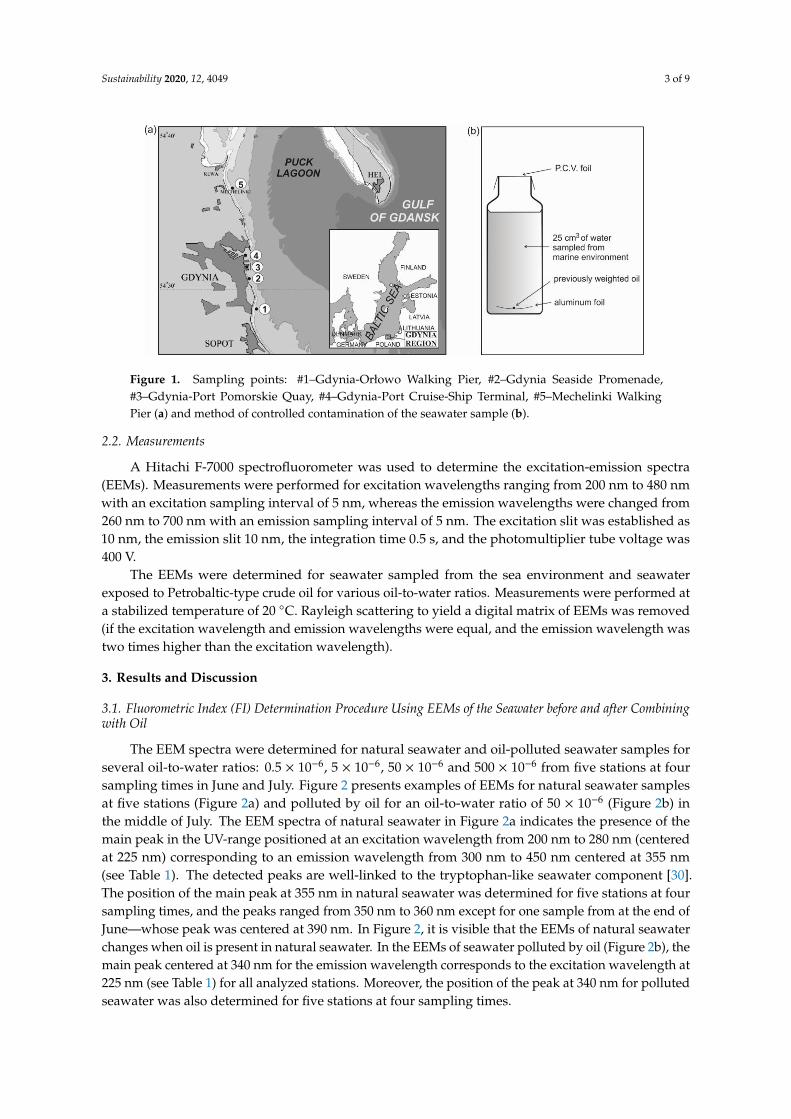
The EEM spectra were determined for natural seawater and oil-polluted seawater samples forseveral oil-to-water ratios: 0.5 × 10⁻⁶, 5 × 10⁻⁶, 50 × 10−6 and 500 × 10−6 from five stations at foursampling times in June and July. Figure 2 presents examples of EEMs for natural seawater samplesat five stations (Figure 2a) and polluted by oil for an oil-to-water ratio of 50 × 10−6 (Figure 2b) inthe middle of July. The EEM spectra of natural seawater in Figure 2a indicates the presence of themain peak in the UV-range positioned at an excitation wavelength from 200 nm to 280 nm (centeredat 225 nm) corresponding to an emission wavelength from 300 nm to 450 nm centered at 355 nm(see Table 1). The detected peaks are well-linked to the tryptophan-like seawater component [30].The position of the main peak at 355 nm in natural seawater was determined for five stations at foursampling times, and the peaks ranged from 350 nm to 360 nm except for one sample from at the end ofJune—whose peak was centered at 390 nm. In Figure 2, it is visible that the EEMs of natural seawaterchanges when oil is present in natural seawater. In the EEMs of seawater polluted by oil (Figure 2b), themain peak centered at 340 nm for the emission wavelength corresponds to the excitation wavelength at225 nm (see Table 1) for all analyzed stations. Moreover, the position of the peak at 340 nm for pollutedseawater was also determined for five stations at four sampling times.
Sustainability 2020, 12, 4049 4 of 9
Sustainability 2020, 12, x FOR PEER REVIEW 5 of 10
Figure 2. Examples of normalized EEM spectra of natural seawater samples (a) and the same
samples polluted by oil for an oil-to-water ratio of 50 × 10−6 (b) in five stations indicated in Figure 1a
in the middle of July.
Table 1. Major fluorescent peaks of natural seawater and the same samples polluted by oil for an
oil-to-water ratio of 50 × 10−6 with their wavelength-independent maxima for five stations
(numbered as in Figure 1a) in the middle of July.
Figure 2. Examples of normalized EEM spectra of natural seawater samples (a) and the same samplespolluted by oil for an oil-to-water ratio of 50 × 10−6 (b) in five stations indicated in Figure 1a in themiddle of July.
Sustainability 2020, 12, 4049 5 of 9
Table 1. Major fluorescent peaks of natural seawater and the same samples polluted by oil for anoil-to-water ratio of 50 × 10−6 with their wavelength-independent maxima for five stations (numberedas in Figure 1a) in the middle of July.
The position of peaks in EEMs caused by the presence of oil in the natural seawater is significantto detect the presence of oil in the sampling area. However, taking into account the need to detectoil quickly and easily, a better solution would be to find a sensitive indicator of the presence of oil ina defined sea area, which could be used to construct a specialized fluorosensor. Based on EEMs ofnatural seawater and seawater polluted by oil, a fluorometric index FIo/w was proposed, which uses aspecific wavelength for both natural unpolluted seawater and the same seawater but having contactwith oil [29]. Formula (1) described the FIo/w definition as the quotient of the fluorescence intensityat the emission wavelength for seawater polluted by oil to the intensity at the emission wavelengthfor natural seawater corresponding to the detected excitation maxima for both natural seawater andseawater polluted by oil.
FIo/w =
[ I(λEmission o f seawater polluted by oil)
I(λEmission o f natural seawater)
]λExcitation
(1)
The specific excitation and emission wavelengths for FIo/w definition were selected based on theEEMs of natural seawater and seawater polluted by oil (see Figure 3). The main peaks detected for thesame excitation wavelength at 225 nm (the red line in Figure 3) correspond to the emission wavelengthsfor these peaks detected for natural seawater at 350 nm (the green line in Figure 3) and seawaterpolluted by oil at 340 nm, respectively (the purple line in Figure 3). Therefore, FIo/w was calculated asthe quotient of the fluorescence intensity at a 340 nm emission wavelength and the intensity at 355 nm,while the excitation wavelength remained equal to 225 nm (Formula (2)).
FIo/w =
[I(λEm=340)
I(λEm=355)
]λEx=225
(2)
where I(λEm=340) describes the fluorescence intensity corresponding to the emission wavelength forpolluted seawater (340 nm) and I(λEm=355) describes the fluorescence intensity corresponding to theemission wavelength for natural seawater (355 nm) linked to the same excitation wavelength (λEx=225)for both kinds of seawater (225 nm).
3.2. Fluorometric Index of Different Origin Sea Waters
Using Formula (2), FIo/w was calculated for natural seawater and seawater contaminated by oilfrom all stations in the considered time and for all oil-to-water ratios. The non-normalized data of EEMspectra of natural seawater and seawater polluted by crude oil were used for calculations. The resultsof FIo/w calculations are presented in Table 2 for natural seawater and in Table 3 for seawater pollutedby oil (for chosen oil-to-water ratio equal to 50 × 10−6) from all stations at different times. Moreover,the results for several oil-to-water ratios for seawater contaminated by oil for the selected station #1at four different times are presented in Table 4. FIo/w values for polluted seawater achieved highervalues above 1 (about 1.4) than for natural seawater below 1 (about 0.93). This creates an easy way to
Sustainability 2020, 12, 4049 6 of 9
accurately identify seawater pollution. Moreover, FIo/w values do not depend on the time of sampling,and FIo/w is independent of the oil concentration.
Sustainability 2020, 12, x FOR PEER REVIEW 6 of 10
Station
Exmax [nm] ± (5 nm)/Emmax [nm] ± (5 nm)
Natural Seawater Polluted Seawater
Peak 1 Peak 2 Peak 1 Peak 2
#1 225/355 225/340 275/335
#2 225/350 225/340 275/335
#3 225/350 272.5/335 225/340 275/335
#4 225/350 225/340 275/335
#5 225/360 225/340 275/335
The position of peaks in EEMs caused by the presence of oil in the natural seawater is
significant to detect the presence of oil in the sampling area. However, taking into account the need
to detect oil quickly and easily, a better solution would be to find a sensitive indicator of the
presence of oil in a defined sea area, which could be used to construct a specialized fluorosensor.
Based on EEMs of natural seawater and seawater polluted by oil, a fluorometric index FIo/w was
proposed, which uses a specific wavelength for both natural unpolluted seawater and the same
seawater but having contact with oil [29]. Formula (1) described the FIo/w definition as the quotient
of the fluorescence intensity at the emission wavelength for seawater polluted by oil to the intensity
at the emission wavelength for natural seawater corresponding to the detected excitation maxima
for both natural seawater and seawater polluted by oil.
ExcitationseawaternaturalofEmission
oilbypollutedseawaterofEmission
woI
IFI
)(
)( (1)
The specific excitation and emission wavelengths for FIo/w definition were selected based on the
EEMs of natural seawater and seawater polluted by oil (see Figure 3). The main peaks detected for
the same excitation wavelength at 225 nm (the red line in Figure 3) correspond to the emission
wavelengths for these peaks detected for natural seawater at 350 nm (the green line in Figure 3) and
seawater polluted by oil at 340 nm, respectively (the purple line in Figure 3). Therefore, FIo/w was
calculated as the quotient of the fluorescence intensity at a 340 nm emission wavelength and the
intensity at 355 nm, while the excitation wavelength remained equal to 225 nm (Formula (2)).
Figure 3. EEM spectra for natural seawater from the station (#1) (a) at the beginning of June and the
same seawater contaminated by oil for an oil-to-water ratio of 50 × 10−6 (b).
Figure 3. EEM spectra for natural seawater from the station (#1) (a) at the beginning of June and thesame seawater contaminated by oil for an oil-to-water ratio of 50 × 10−6 (b).
Table 2. Fluorometric index (FIo/w) calculated by formula 2 for uncontaminated seawater.
Station
Date
FIo/w [-]
Beginning of June Middle of June End of June Middle of July
Table 3. Fluorometric index (FIo/w) calculated by formula 2 for seawater from five sampling stationstaken at different times and contaminated by oil for an oil-to-water ratio of 50 × 10−6.
Station
Date
FIo/w [-]
Beginning of June Middle of June End of June Middle of July
Table 4. Fluorometric index (FIo/w) calculated by formula 2 when seawater was sampled at station #1contaminated by oil for different oil-to-water ratios.
ro/wFIw/o [-]
Beginning of June Middle of June End of June Middle of July
In each case, the amount of contaminant in relation to water was 5:100,000 (ro/w = 50 × 10−6).The average FIo/w value for natural water was 0.925 (standard deviation 0.023), while for contaminatedwater, it was 1.381 (standard deviation 0.044).
3.3. Fluorometric Index Compared to the Degree of Contamination
The results of the test described in Section 3.2 indicate that the value of FIo/w shows whether thewater is in contact with oil contamination. To determine to what extent the amount of oil pollutionaffects the possibility of its detection based on the FIo/w value, tests were carried out for seawatercollected at sampling point #1 (the end of the pier in Orłowo) at four different times contaminated byoil with an oil-to-water ratio ro/w from 0.5 × 10⁻⁶ to 500 × 10−6. The results are presented in Figure 4.A distinct increase in FIo/w already exists for ro/w = 0.5 × 10⁻⁶. Beginning with ro/w = 0.5 × 10⁻⁶, theFIo/w value ceases to depend on ro/w (stabilizes at the level closed to 1.4).
Sustainability 2020, 12, x FOR PEER REVIEW 8 of 10
50 × 10−6 1.42 1.33 1.37 1.42
500 × 10−6 1.41 1.37 1.39 1.40
In each case, the amount of contaminant in relation to water was 5:100,000 (ro/w = 50 × 10−6). The
average FIo/w value for natural water was 0.925 (standard deviation 0.023), while for contaminated
water, it was 1.381 (standard deviation 0.044).
3.3. Fluorometric Index Compared to the Degree of Contamination
The results of the test described in Section 3.2 indicate that the value of FIo/w shows whether the
water is in contact with oil contamination. To determine to what extent the amount of oil pollution
affects the possibility of its detection based on the FIo/w value, tests were carried out for seawater
collected at sampling point #1 (the end of the pier in Orłowo) at four different times contaminated
by oil with an oil-to-water ratio ro/w from 0.5 × 10⁻⁶ to 500 × 10−6. The results are presented in Figure
4. A distinct increase in FIo/w already exists for ro/w = 0.5 × 10⁻⁶. Beginning with ro/w = 0.5 × 10⁻⁶, the FIo/w
value ceases to depend on ro/w (stabilizes at the level closed to 1.4).
Figure 4. Value of fluorometric index FIo/w for seawater exposed to various amounts of oil for various
sampling dates. The internal graph shows FIo/w for only small ro/w values with a stretched scale. The
letter U indicates the values of the index for uncontaminated seawater.
4. Conclusions
The fluorometric index FIo/w was defined as a tool for oil pollution detection in seawater in such
a manner that the oil pollution present in the sea is manifested by an increase in FIo/w. In the
authors’ previous paper, the effectiveness of FIo/w was tested for seawater polluted by various kinds
of oils and various oil-to-water ratios for one sampling point. The tests performed earlier and
statistical calculations indicated a high similarity in the values of FIo/w independent of both the kind
of oil and oil-to-water ratio.
In the paper, the test of the effectiveness of FIo/w was expanded, corresponding to different
sampling points and several sampling times. The results presented in this paper concern seawater
collected from five different stations in coastal waters four times during the summer season in the
Baltic Sea (June–July) and seawater polluted by oil for different oil-to-water ratio (0.5–500 × 10−6).
For the tests, only one oil was used (Petrobaltic-crude oil), taking into account the independence of
Figure 4. Value of fluorometric index FIo/w for seawater exposed to various amounts of oil for varioussampling dates. The internal graph shows FIo/w for only small ro/w values with a stretched scale.The letter U indicates the values of the index for uncontaminated seawater.
4. Conclusions
The fluorometric index FIo/w was defined as a tool for oil pollution detection in seawater in such amanner that the oil pollution present in the sea is manifested by an increase in FIo/w. In the authors’previous paper, the effectiveness of FIo/w was tested for seawater polluted by various kinds of oilsand various oil-to-water ratios for one sampling point. The tests performed earlier and statisticalcalculations indicated a high similarity in the values of FIo/w independent of both the kind of oil andoil-to-water ratio.
In the paper, the test of the effectiveness of FIo/w was expanded, corresponding to differentsampling points and several sampling times. The results presented in this paper concern seawatercollected from five different stations in coastal waters four times during the summer season in theBaltic Sea (June–July) and seawater polluted by oil for different oil-to-water ratio (0.5–500 × 10−6).For the tests, only one oil was used (Petrobaltic-crude oil), taking into account the independence ofFIo/w from the kind of oil. The results indicate the FIo/w value, starting from a certain threshold amount
Sustainability 2020, 12, 4049 8 of 9
of oil (in this case it the oil-water-ratio is about 5 × 10⁻⁶), ceases to increase despite increasing the doseof this contamination for five different stations in coastal waters. The rising effect of FIo/w in the case ofcontact of water with oil was observed in each of the twenty examined cases. In summary, the resultsindicate the independence of FIo/w index from the time and point of sampling. By treating this factas a good prognostic of the effectiveness and universality of the method, it is possible to extend theresearch to include water collected in other seasons and from a wider area. Moreover, the wavelengthsproposed for the FIo/w index could be used in the future to design and build sensors for oil detection.
Author Contributions: Conceptualization, E.B. and Z.O.; methodology, E.B; formal analysis, E.B.; investigation,E.B. and Z.O; data curation, E.B. and Z.O; writing—original draft preparation, E.B.; writing—review and editing,Z.O; visualization, E.B. and Z.O. All authors have read and agreed to the published version of the manuscript.
Acknowledgments: This paper was supported by a Gdynia Maritime University grant, No. WM/2020/PZ/05.
Conflicts of Interest: The authors declare no conflict of interest.
References
1. Fingas, M. Oil Spill Science and Technology, 2nd ed.; Gulf Professional Publishing: Houston, TX, USA, 2016.2. Migliaccio, M.; Gambardella, A.; Tranfaglia, M. SAR Polarimetry. To Observe Oil Spills. IEEE Trans. Geosci.
Muller-Karger, F.; et al. Remote sensing estimation of surface oil volume during the 2010 Deepwater Horizonoil blowout in the Gulf of Mexico: Scaling up AVIRIS observations with MODIS measurements. J. Appl.Remote. Sens. 2018, 12, 026008. [CrossRef]
4. Zhou, Z.; Guo, L.; Shiller, A.M.; Lohrenz, S.; Asper, V.L.; Osburn, C. Characterization of oil components fromthe Deepwater Horizon oil spill in the Gulf of Mexico using fluorescence EEM and PARAFAC techniques.Mar. Chem. 2013, 148, 10–21. [CrossRef]
5. Hou, Y.; Li, Y.; Liu, B.; Liu, Y.; Wang, T. Design and Implementation of a Coastal-Mounted Sensor for OilFilm Detection on Seawater. Sensors 2017, 18, 70. [CrossRef] [PubMed]
6. Hu, C.; Weisberg, R.H.; Liu, Y.; Zheng, L.; Daly, K.L.; English, D.; Zhao, J.; Vargo, G.A. Did the northeasternGulf of Mexico become greener after the Deepwater Horizon oil spill? Geophys. Res. Lett. 2011, 38, 09601.[CrossRef]
7. Leifer, I.; Lehr, W.J.; Simecek-Beatty, D.; Bradley, E.; Clark, R.; Dennison, P.E.; Hu, Y.; Matheson, S.; Jones, C.E.;Holt, B.; et al. State of the art satellite and airborne marine oil spill remote sensing: Application to the BPDeepwater Horizon oil spill. Remote. Sens. Environ. 2012, 124, 185–209. [CrossRef]
8. Sun, S.; Lu, Y.; Liu, Y.; Wang, M.; Hu, C. Tracking an Oil Tanker Collision and Spilled Oils in the East ChinaSea Using Multisensor Day and Night Satellite Imagery. Geophys. Res. Lett. 2018, 45, 3212–3220. [CrossRef]
9. Fingas, M.; Brown, C.E. Oil Spill Remote Sensing. In Handbook of Oil Spill Science and Technology; Wiley:Hoboken, NJ, USA, 2015; pp. 311–356.
10. Downare, T.D.; Mullins, O.C. Visible and Near-Infrared Fluorescence of Crude Oils. Appl. Spectrosc.1995, 49, 754–764. [CrossRef]
11. Wang, Z.; Stout, S. Oil Spill Environmental Forensics: Fingerprinting and Source Identification, 2nd ed.; AcademicPress as An Imprint of Elsevier: London, UK, 2016.
12. Patra, D.; Mishra, A.K. Total synchronous fluorescence scan spectra of petroleum products. Anal. Bioanal. Chem.2002, 373, 304–309. [CrossRef]
13. Baszanowska, E.; Otremba, Z. Modification of optical properties of seawater exposed to oil contaminantsbased on excitation-emission spectra. J. Eur. Opt. Soc. Rapid Publ. 2015, 10, 10047. [CrossRef]
14. Otremba, Z.; Zielinski, O.; Hu, C. Optical contrast of oil dispersed in seawater under windy conditions.J. Eur. Opt. Soc. Rapid Publ. 2013, 8, 13051. [CrossRef]
15. Tedetti, M.; Guigue, C.; Goutx, M. Utilization of a submersible UV fluorometer for monitoring anthropogenicinputs in the Mediterranean coastal waters. Mar. Pollut. Bull. 2010, 60, 350–362. [CrossRef] [PubMed]
16. Coble, P.G. Characterization of marine and terrestrial DOM in seawater using excitation-emission matrixspectroscope. Mar. Chem. 1996, 51, 325–346. [CrossRef]
17. Miranda, M.L.; Mustaffa, N.I.H.; Robinson, T.-B.; Stolle, C.; Ribas-Ribas, M.; Wurl, O.; Zielinski, O. Influenceof solar radiation on biogeochemical parameters and fluorescent dissolved organic matter (FDOM) in the seasurface microlayer of the southern coastal North Sea. Elem. Sci. Anth. 2018, 6, 15. [CrossRef]
18. Coble, P. Colored dissolved organic matter in seawater. In Subsea Optics and Imaging; Elsevier BV: London, UK,2013; pp. 98–118.
19. Drozdowska, V.; Freda, W.; Baszanowska, E.; Rudz, K.; Darecki, M.; Heldt, J.; Toczek, H. Spectral propertiesof natural and oil-polluted Baltic seawater – results of measurements and modelling. Eur. Phys. J. Spec. Top.2013, 222, 2157–2170. [CrossRef]
20. McKee, D.; Röttgers, R.; Neukermans, G.; Calzado, V.S.; Trees, C.; Ampolo-Rella, M.; Neil, C.; Cunningham, A.Impact of measurement uncertainties on determination of chlorophyll-specific absorption coefficient formarine phytoplankton. J. Geophys. Res. Oceans 2014, 119, 9013–9025. [CrossRef]
21. Ostrowska, M. Model dependences of the deactivation of phytoplankton pigment excitation energyon environmental conditions in the sea**Support for this study was provided by the project ‘SatelliteMonitoring of the Baltic Sea Environment—SatBałtyk’ funded by European Union through EuropeanRegional Development Fund contract No. POIG 01.01.02-22-011/09. Oceanology 2012, 54, 545–564. [CrossRef]
22. Wan, J.; Yu, N.; Wu, Y.; Feng, R.; Yu, N. Hierarchical Leak Detection and Localization Method in Natural GasPipeline Monitoring Sensor Networks. Sensors 2011, 12, 189–214. [CrossRef]
23. Blokus-Roszkowska, A.; Kwiatuszewska-Sarnecka, B.; Wolny, P. Analysis of the Crude Oil Transfer Process andIts Safety; University of Turku: Turku, Finland, 2017.
24. Agbakwuru, J. Oil/Gas Pipeline Leak Inspection and Repair in Underwater Poor Visibility Conditions:Challenges and Perspectives. J. Environ. Prot. 2012, 3, 394–399. [CrossRef]
25. Zdziebłowski, S. Wrecks on the Bottom of the Baltic Sea Are a Potential Environmental Hazard, Ministryof Science and Higher Education (Internet Portal). Available online: http://scienceinpoland.pap.pl/en/
news/news%2C33072%2Cwrecks-bottom-baltic-sea-are-potential-environmental-hazard.html (accessed on16 March 2020).
26. Macdonald, I.R.; Garcia-Pineda, O.; Beet, A.; Asl, S.D.; Feng, L.; Graettinger, G.; French-McCay, D.; Holmes, J.;Hu, C.; Huffer, F.; et al. Natural and unnatural oil slicks in the G ulf of M exico. J. Geophys. Res. Oceans2015, 120, 8364–8380. [CrossRef]
27. SOS California, Natural Oil Seepage Facts. Available online: http://www.soscalifornia.org/natural-oil-seepage-facts/ (accessed on 14 February 2020).
28. Chen, S.; Hu, C. In search of oil seeps in the Cariaco basin using MODIS and MERIS medium-resolution data.Remote. Sens. Lett. 2014, 5, 442–450. [CrossRef]
29. Baszanowska, E.; Otremba, Z. Detecting the Presence of Different Types of Oil in Seawater Using aFluorometric Index. Sensors 2019, 19, 3774. [CrossRef] [PubMed]
30. Coble, P.G. Marine Optical Biogeochemistry: The Chemistry of Ocean Color. Chem. Rev. 2007, 107, 402–418.[CrossRef] [PubMed]
31. Baszanowska, E.; Otremba, Z. Spectral signatures of fluorescence and light absorption to identify crude oilsfound in the marine environment. J. Eur. Opt. Soc. Rapid Publ. 2014, 9, 14029. [CrossRef]
32. Christensen, J.H.; Hansen, A.B.; Mortensen, J.; Andersen, O. Characterization and Matching of Oil SamplesUsing Fluorescence Spectroscopy and Parallel Factor Analysis. Anal. Chem. 2005, 77, 2210–2217. [CrossRef][PubMed]
33. Maculewicz, J.; Sliwinska-Wilczewska, S.; Latała, A. Zjawisko oddziaływania allelopatycznegopikoplanktonowej sinicy synechococcus sp. na nitkowate sinice geitlerinema amfibium i rivularia sp. EdukacjaBiologiczna Srodowiskowa 2017, 2, 3–9. (In Polish) [CrossRef]