GLOBE ® 2005 Seaweed Reproductive Phenology Protocol - 1 Earth System Science Learning Activities Appendix Welcome Introduction Protocols Seaweed Reproductive Phenology Protocol Purpose To classify and count the reproductive phenological phases of receptacles on selected seaweed species Overview Students will classify and count the reproductive phases of seaweed plants within a 1-meter x 1-meter plot in the inter-tidal zone. Student Outcomes Students will be able to, - identify reproductive stages of seaweed plants; - graph the relative abundance of the reproductive stages; - compare when reproductive stages occur in different places; and - explore relationships between reproductive stages and climate factors. Science Concepts Life Sciences Organisms have basic needs. Organisms can only survive in environments where their needs are met. Earth has many different environments that support different combinations of organisms. Plants and animals have life cycles. Energy for life derives mainly from the Sun. Living systems require a continuous input of energy to maintain their chemical and physical organizations. Scientific Inquiry Abilities Students will learn how to identify the different reproductive stages during plant growth. Students will make connections between climate and seaweed reproductive cycle. Identify answerable questions. Design and conduct scientific investigations. Use appropriate mathematics to analyze data. Develop descriptions and predictions using evidence. Recognize and analyze alternative explanations. Communicate procedures, descriptions, and predictions. Time 30 –45 minutes Level Middle and Secondary Frequency Once a month for four months in a row during low tides Materials and Tools GPS receiver GPS Field Guide GPS Data Sheet Seaweed Reproductive Phenology Site Definition Field Guide Seaweed Reproductive Phenology Site Definition Data Sheet Seaweed Reproductive Phenology Protocol Field Guide Seaweed Reproductive Phenology Protocol Data Sheet Documenting Your Hydrology Study Site Field Guide (Hydrology Investigation) Ruler in millimeters Clinometer Compass Tide tables for locality Pencil or pen Camera
2-4 meter sticks or quadrat (see Freshwater Macroinvertebrate Protocol in Hydrology Investigation)
PreparationLearn how to use tide tables
Practice identifying the seaweed reproductive
stages using the photos
Learn how to identify seaweed species
PrerequisitesNone
IntroductionAs with budburst and blooming of plants on land, plants in the oceans go through growing and reproductive cycles. Seaweed reproductive phases are an example of plant phenology. The study of when these phases occur can help scientists better understand how these plants respond to climatic factors. With time, seaweed reproductive phenology can be used to study the effects of climate change.
Teacher SupportWho can do this protocol?To do this protocol you must live by the ocean in an area where at least one of the selected seaweed species is found. The seaweed species used in this study are: Ascophyllum nodosum, Fucus distichus, Fucus spiralis, Fucus vesiculosus, Pelvetia canaliculata, and Fucus serratus.
Distribution of Selected Seaweed SpeciesAscophyllum nodosum is distributed in the North Atlantic (South & Tittley 1986). On the European coast it is found from Portugal in the south and northwards to northern Norway. It grows around the UK and Ireland, Faeroe Islands, Iceland, Jan Mayen, and southern Greenland. On the North American side it is found from Delaware in the south to Baffin Island and Hudson Bay in the north.
Fucus distichus is found in the North Atlantic and the North Pacific. It grows along the coast of Norway north to Spitzbergen. It grows on the west coast of UK and Ireland, Faeroe Islands, Iceland, Jan Mayen, and West Greenland. In
North America it grows from Virginia in the south to Baffin Island in the north (South & Tittley 1986). Fucus distichus grows on the Pacific coast of North America from Oregon to Alaska (Lüning 1990).
Fucus spiralis has its distribution range in the North Atlantic and the North Pacific. It is found in the Azores and Portugal and from there its distribution extends northwards to northern Norway and Bear Island. F. spiralis is found around UK and Ireland, Faeroe Islands, and Iceland. On the Atlantic coast of North America it has been found in the range from Delaware north to Baffin Island in Canada (South & Tittley 19869. On the Pacific coast of North America the species is found from Oregon northwards to Alaska (Lüning 1990).
Fucus vesiculosus is found in the Azores and along the Atlantic coast of Europe from Portugal to northern Norway and Spitzbergen. It is found around the coast of UK and Ireland, Faeroe Islands, Iceland, and Greenland. On the Atlantic coast of North America it is found from Virginia in the south, north to Baffin Island and Hudson Bay in the north (South & Tittley 1986).
Pelvetia canaliculata is found along the coast of Europe from Portugal in the south to northern Norway. It is found around the coast of UK and Ireland, Faeroe Islands and southwestern Iceland (South & Tittley 1986). P. canaliculata is not found in North America.
Site SelectionThe site needs to be an easily accessible rocky shore. It is preferable to have the site away from areas with industrial or residential activities for pollution and human activities may affect when seaweed reproduces so that the seaweed
reproduction does not reflect regional climatic influences. The object of the study is to learn connections between the seaweed phenology and climate factors.
Your students will be visiting the site four times (once each month). The students need to visit the same plot each time. To do this, you need to establish a permanent marker. If there is a distinctive feature on the beach (such as an unusually large boulder), use the feature to identify your location. Or, you could pound a reinforcing bar into the beach.
Frequency of SamplingSampling should be done once a month for four consecutive months. Pelvetia canaliculata, Fucus vesiculosus, and Fucus spiralis are better sampled in the fall. Choose Ascophyllum nodosum or Fucus disticus if you would like to sample in the spring. If you have any questions about which species to choose and when to sample, please contact GLOBE.
It is not necessary to sample precisely at the same time each month. Instead, look at tide-tables for your area and select a day when the tide is at its lowest during the month. The time between two hours before and after the low tide is the recommended time to sample.
Advance PreparationYou may want to visit the site before the students to determine how safe the shore is for the students and to see what types of seaweed are present.
Find out what species of seaweed are in your area.
Find out what the tidal range is for your area.
Make color photocopies of the reproductive stages of the seaweed species your students will be observing. Depending on your site and your educational objectives, your students could be studying one or more species.
Student PreparationFamiliarize students with the parts of seaweed plants
Practice identifying the different reproductive phases using the photos provided for the species in your area before going to the site to collect data.
Practice using tide tables to determine when you should sample.
Measurement ProceduresIt is requested that all the receptacles on the plants are counted. If there is one species in the plot, then count the receptacles on all the plants of that species. If there are multiple seaweed species, then you can either count only one species or all species. It is preferable to count the receptacles of each species. It is important to keep track of which receptacles go with which species.
Start counting the receptacles at one corner and keep track of the plants whose receptacles have already been counted. Have students work in teams with two or more students classifying the reproductive stages. You can rotate students so that a large group gets an opportunity to classify the stages. These plants are very strong and durable; however, students should handle the plants with care so that they are not harmed.
You can set up multiple plots. If there are two or more seaweed species on the beach, a group of students at one plot can count the receptacles of one species while another group of students at a second plot can count the receptacles on a second seaweed species.
Reproductive phasesThe descriptions in the tables below along with the photos of the reproductive stages will help with classification of the stage at your site.
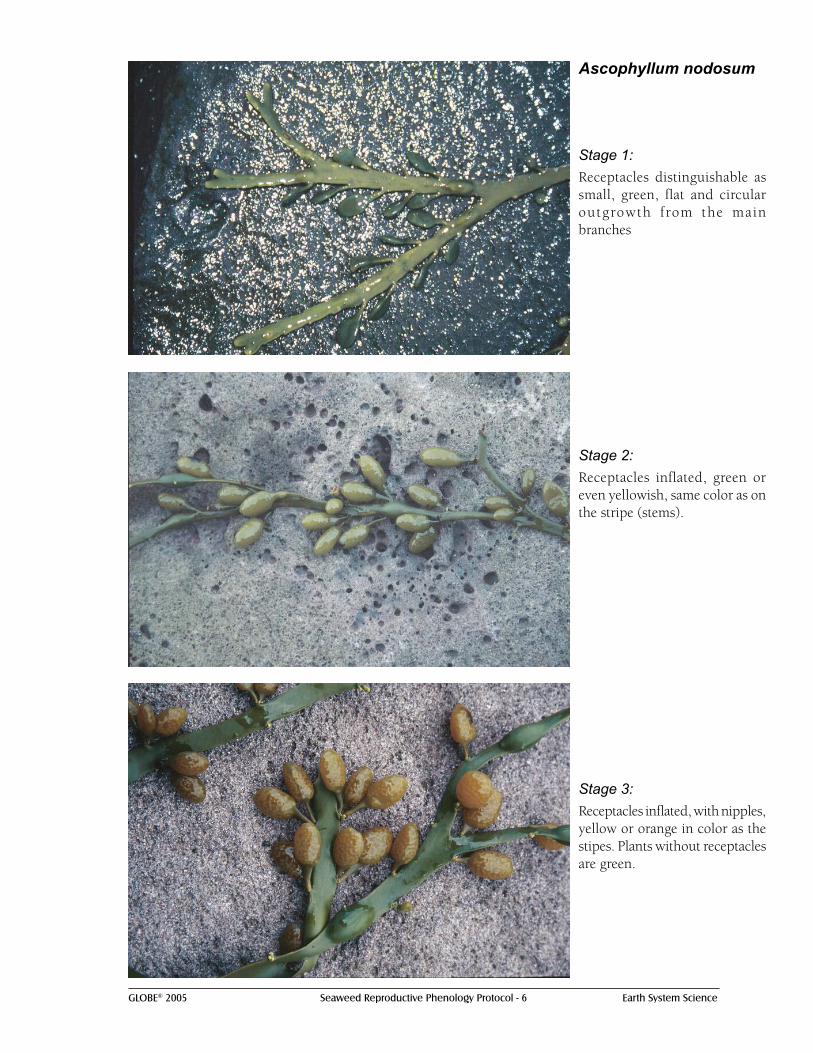
Table EA-SW-1: Receptacle developmental stages for Ascophyllum nodosum.
Stages Description1 Receptacles distinguishable as small,
green, flat and circular outgrowth from the main branches.
2 Receptacles inflated, green or even yellowish, same color as on the stipe (stems).
3 Receptacles inflated, with nipples, yellow or orange in color as on the stipes (stems). Plants without receptacles are green.
4 Receptacles ruptured and torn, orange in color (release of gametes).
5 New side branches starting to develop. No receptacles distinguishable.
Table EA-SW-2. Receptacle developmental stages for Fucus distichus.
Stages Description1 Receptacles small elongated, with a
rough surface, greenish as the plant.2 Receptacles greenish, elongate with
nipples, sometimes become 1/4 inflated at the apex.
3 Receptacles brownish, elongate with nipples, about 1/3 inflated.
4 Receptacles ruptured, starting from the apex proceeding inwards (gamete release).
5 No receptacles.
Table EA-SW-3. Receptacle developmental stages of Fucus spiralis.
Stage 1: Receptacles distinctively thicker than the blades but with the same color
Stage 2: Receptacles inflated, green or even yellow, same color as the blade bearing the receptacle.
Stage 3: Receptacles inflated with yellow nipples, yellow or orange in color, same color as the blade bearing the receptacles. Plants without receptacles are green.
Measuring RocksTo define the site, students are asked to report the most common rock size on the beach. Rocks are classified according to their size. The size category is defined by the length of the longest axis. The size categories are shown in Table EA-SW-1.
Table EA-SE-1 Size Categories for Rocks
Category Length of longest axisBoulders large >1000 mm medium 500-1000 mm small 256-500 mm Cobbles 64-256 mm Pebbles 16-64 mm Gravel 4-16 mm
Connections to Other ProtocolsIt is not required, but would be very helpful to the scientists to have hydrology measurements taken, in particular water temperature, transparency, and salinity.
Reading a Tide TableTides are caused by the gravitational pull of the moon and the sun on Earth. Because the moon is so much closer to Earth than the sun, the moon exerts the greater pull. The most extreme tides, called spring tides occur during full and new moons when Earth, moon, and sun are in a line. During quarter and three quarter moons, the moon, Earth and sun form a right triangle and the tidal range (the difference between high and low tides) is the smallest. These tides are called neap tides.
You need a tide table calculated for the local area to determine the tides in your area. The tide table will give you the dates, times and water levels for high and low water. These are available from government agencies, private fisheries and tourist agencies. They can also be found on the web, in newspapers, or published as booklets. Because tides vary each year with the lunar cycle, it is necessary to use a tide table calculated for the current year. Tides also vary with each locality, so try to get a tide table for the exact area you are observing, or for the closest
area for which tide tables are available. You may need to consult two tide tables - a primary tide tabled based on a tide station in the general region of your site and an auxiliary tide table with corrections for time and tidal height for your particular site.
Most areas have two low and two high waters per day with one set of high and low more extreme than the others. This is called a mixed semidiurnal tide (mixed because the two tide cycles are uneven and semidiurnal because there are two sets per day). The two high and low water levels occur over approximately 24 hours with each high and low approximately six hours apart. Tide cycles actually occur over a lunar day, which is 24 hours and 50 minutes long. The two low tides in a day occur on average every 12 hours 25 minutes. The time of the first low tide each day occurs on average approximately 50 minutes later than the day before. Local topographic features may cause these times to vary.
To determine the tidal height at a particular time and date, read on the tide table the times of high and low water for the date you sampled that bracket the time you sampled. Determine whether the tide was coming in or going out when you sampled by assuming that the tide turned (changed direction) at the times of low and high tides. For instance if you sampled at 4 PM on August 1, 2002 (Table EA-SW-2), the tide was coming in because it was low at 1:06 PM and high at a later time, 7:40 PM.
Table EA-SE-2: Tide Table for Aberdeen, Washington
Tide Predictions (High and Low Waters) August, 2002 Source: NOAA, National Ocean Service
Daylight Saving Time
Day Time Ht. Time Ht. Time Ht. Time Ht.
1 Th 131am L 0.6 730am H 2.0 106pm L 0.8 740pm H 2.6
2 F 233am L 0.5 841am H 1.9 206pm L 1.0 832pm H 2.7
3 Sa 335am L 0.3 956am H 1.9 313pm L 1.1 928pm H 2.7
4 Su 432am L 0.1 1105am H 2.0 417pm L 1.1 1024pm H 2.8
5 M 526am L -0.2 1204pm H 2.2 516pm L 1.0 1118pm H 2.9
6 Tu 616am L -0.4 1256pm H 2.3 611pm L 0.9
7 W 1209am H 3.0 703am L -0.6 143pm H 2.5 702pm L 0.8
8 Th 1258am H 3.2 747am L -0.7 228pm H 2.6 751pm L 0.6
9 F 147am H 3.2 831am L -0.8 309pm H 2.7 839pm L 0.5
10 Sa 237am H 3.2 913am L -0.7 349pm H 2.8 927pm L 0.3
11 Su 327am H 3.2 955am L -0.6 428pm H 2.9 1017pm L 0.2
12 M 419am H 3.0 1037am L -0.4 508pm H 3.0 1109pm L 0.1
13 Tu 514am H 2.8 1121am L -0.1 549pm H 3.0
14 W 1206am L 0.1 614am H 2.5 1209pm L 0.2 634pm H 3.0
15 Th 108am L 0.1 721am H 2.3 104pm L 0.5 725pm H 3.0
16 F 215am L 0.0 837am H 2.1 206pm L 0.8 824pm H 2.9
17 Sa 323am L 0.0 956am H 2.1 313pm L 0.9 928pm H 2.9
18 Su 428am L -0.1 1110am H 2.2 419pm L 1.0 1032pm H 2.9
19 M 527am L -0.2 1211pm H 2.3 521pm L 0.9 1130pm H 2.9
20 Tu 618am L -0.3 101pm H 2.5 616pm L 0.8
21 W 1221am H 2.9 703am L -0.3 142pm H 2.6 705pm L 0.7
22 Th 106am H 2.9 744am L -0.3 220pm H 2.7 750pm L 0.6
23 F 148am H 2.9 821am L -0.3 254pm H 2.7 831pm L 0.5
24 Sa 228am H 2.8 856am L -0.2 326pm H 2.7 910pm L 0.5
25 Su 307am H 2.8 928am L 0.0 355pm H 2.7 949pm L 0.4
26 M 346am H 2.7 1000am L 0.2 423pm H 2.7 1027pm L 0.4
27 Tu 426am H 2.5 1029am L 0.3 450pm H 2.7 1107pm L 0.4
28 W 510am H 2.3 1058am L 0.5 519pm H 2.7 1152pm L 0.4
29 Th 600am H 2.2 1129am L 0.8 551pm H 2.7
30 F 1244am L 0.4 659am H 2.0 1208pm L 1.0 633pm H 2.6
31 Sa 146am L 0.4 810am H 2.0 113pm L 1.2 730pm H 2.6
Note: Heights in this table are in meters. Many tide tables in the United Sates and in Canada are in feet. To convert feet to meters, divide the data by 3.28 ft/m.
All tide tables (including this one) are in local time. You will need to convert to UT.
To determine the time and date of the lowest tide for a particular month, use your tide table to find the heights of the tides over the entire month. Which number is lowest (including negative numbers)? This is the lowest tide of the month when the water recedes the farthest from the shore. Which number is the highest? This number is likely to fall just after the lowest tide. Look at the illustration for the tide table for Aberdeen, Washington for August 2002 to determine the times and dates of highest and lowest tides for that month. The most extreme low tide of –0.8 meters occurred on Aug 9th at 08:31 local time. A high tide of 3.2 meters occurred 6 hours 44 minutes earlier at 01:47 local time.
Zero tide datum (also expressed as + 0, or “plus 0”) is a measure of the average low tide level. There are two different definitions used worldwide for the zero tide datum: mean lower low water and mean low water. Mean lower low water is the mean of the lowest tides for that area. Mean low water is the mean of all of the low tides for that area. The zero tide datum will be found in the legend of the tide table. Students will need to check off on the data sheet which definition of zero tide datum is used on their tide table.
In interpreting your data, it is important to know which zero tide datum is used on your tide table. The negative numbers refer to water levels below the zero tide datum for your area. For example, a tide level of –0.5 is read as “minus one half meter below the zero tide level”.
Helpful Hints• A quadrat is not necessary, but may make
defining the 1-meter x 1-meter plot easier in the field. The Instrument Construction section in the Hydrology Investigation shows how a quadrat can be made.
• Put the color photos of the reproductive stages in clear plastic covers so that the photos do not get wet or damaged.
Questions for Further InvestigationHow does water temperature affect when the reproductive phases occur?
Do you expect much difference in when the reproductive phases occur from one year to the next?
Do storms affect when the reproductive phases occur?
Does the transparency of water affect seaweed reproduction?
ReferencesLüning K. 1990. Seaweeds; Their environment, Biogeography, and Ecophysiology. A Wiley-interscience publication. 250 p.
South G.R. & Tittley I. 1986. A check list and distributional index of the benthic marine algae of the North Atlantic ocean. Huntsman Marine Laboratory and British Museum (Natural History). St Andrews and London, 76 p.
Seaweed Reproduction Phenology Site DefinitionField GuideTaskTo measure the beach aspect, beach slope, locate the longitude and latitude of your site, describe the dominant size of the beach substrate (rocks) and take photos.
What You Need❑ GPS receiver ❑ Compass
❑ GPS Protocol Field Guide ❑ Ruler in millimeters
❑ GPS Data Sheet ❑ Camera
❑ Seaweed Phenology Site Definition Sheet ❑ Clinometer
❑ Documenting Your Hydrology Study Site Field Guide (Hydrology Investigation)
In the Field1. Fill out the top section of the Seaweed Phenology Site Definition Sheet.2. Draw a map of the site following the instructions in the Hydrology Investigation,
Documenting Your Hydrology Study Site Field Guide.3. Locate a place on the beach where you will sample.4. Use the GPS receiver to find the latitude, longitude and elevation following the Basic GPS
Protocol.5. Stand perpendicular to the slope of the beach with your eyes facing the water. Measure
the direction with the compass (1-360 degrees). Be sure to enter the true and not magnetic direction (aspect). 360 degrees is used for true north.
6. Work with another student whose eyes are at approximately the same height as yours. Stand several meters apart in a line perpendicular to the water’s edge. The student closer to the water should site the eyes of the other student through the straw of the clinometer. Record the angle (slope) on the Seaweed Phenology Site Definition Sheet.
7. Estimate the size of the rocks that are dominant at the site using this table. Use the ruler to measure the longest axis of some of the rocks.
Category Length of longest axis Boulders large >1000 mm medium 500-1000 mm small 256-500 mm Cobbles 64-256 mm Pebbles 16-64 mm Gravel 2-16 mm
8. Take photos of the beach in the four cardinal directions: North, East, South, and West. Use the compass to determine direction. Use true North not magnetic north.
9. Submit map and photos to the address given in the Implementation Guide.
TaskTo identify the seaweed species at your site and to classify the reproductive stages of the receptacles on all the plants in a 1-meter x 1-meter plot.
What You Need
❑ 2 - 4 Meter sticks or a quadrat ❑ Equipment and Field Guides for Hydrology Protocols (optional)❑ Photos of the reproductive stages ❑ Pencil or pen
❑ Seaweed Reproductive Phenology Data Sheet
In the Field1. Locate your site. Use the meter sticks or quadrat to define the boundaries of the 1-meter x 1-
meter area. Align the area so that it is parallel to the water line.
2. Identify the species you will be counting.
3. Start in a corner of the area and move systematically through the area. For each plant, classify the reproductive stage for each receptacle. Use the photos of the seaweed reproductive phenology stages to help you classify. Classify all the receptacles on all the plants in the plot.
4. Total the counts for each reproductive phase for each seaweed species.
5. Take water measurements following the protocols in the Hydrology Investigation (optional).
Seaweed Protocol – Looking at the DataAre the data reasonable?During the beginning of the reproductive cycle, the percentage of stage 1 should be large and the others smaller. As the reproductive season continues, there should be larger percentages of stages 2, 3, and 4. Eventually when the reproductive cycle is complete, stage 5 should be most common.
The following graph demonstrates this cycle. Notice in March, phase 1 is observed and then in June, stages 2 and 3 are found also. As the season progresses, only stages 3 and 4 are seen (observe September and October). In November reproduction is complete and no receptacles are found.
If you find a different pattern, for instance stage 1 occurring after stage 4, you may want to check to see if you are classifying the reproductive stages correctly.
What do scientists look for in the data?Scientists are interested in learning how the reproductive cycle changes from year to year and if there is a long-term trend in when the reproductive phases occur. Scientists want to know what are the differences between the east and west of the North America, between the eastern and western Atlantic and what are differences among areas with similar water temperature. As well, scientists want to explore relationships with other hydrological measurements such as water temperature and salinity, and atmosphere measurements such as air temperature.