36
Investor Presentation SEB January–September 2013 1

Investor Presentation SEB January–September 2013
1

Disclaimer
IMPORTANT NOTICE THIS PRESENTATION IS NOT AN OFFER OR SOLICITATION OF AN OFFER TO BUY OR SELL SECURITIES. IT IS SOLELY FOR USE AT AN INVESTOR PRESENTATION AND
IS PROVIDED AS INFORMATION ONLY. THIS PRESENTATION DOES NOT CONTAIN ALL OF THE INFORMATION THAT IS MATERIAL TO AN INVESTOR. THIS PRESENTATION IN AND OF ITSELF SHOULD NOT FORM THE BASIS OF ANY INVESTMENT DECISION. BY ATTENDING THE PRESENTATION OR BY READING THE PRESENTATION SLIDES YOU AGREE TO BE BOUND AS FOLLOWS:
This presentation is not an offer for sale of securities in the United States, Canada or any other jurisdiction. This presentation may not be all-inclusive and may not contain all of the information that you may consider material. Neither SEB nor any third party nor any of their
respective affiliates, shareholders, directors, officers, employees, agents and advisers makes any expressed or implied representation or warranty as to the completeness, fairness, reasonableness of the information contained herein and none of them shall accept any responsibility or liability (including any third party liability) for any loss or damage, whether or not arising from any error or omission in compiling such information or as a result of any party’s reliance or use of such information.
Certain data in this presentation was obtained from various external data sources and SEB has not verified such data with independent sources. Accordingly, SEB makes no representations as to the accuracy or completeness of that data. Such data involves risks and uncertainties and is subject to change based on various factors.
Any securities, financial instruments or strategies mentioned herein may not be suitable for all investors. The recipient of this presentation must make its own independent decision regarding any securities or financial instruments and its own independent investigation and appraisal of the business and financial condition of SEB and the nature of the securities. Each recipient is strongly advised to seek its own independent advice in relation to any investment, financial, legal, tax, accounting or regulatory issues.
This presentation does not constitute a prospectus or other offering document or an offer or invitation to subscribe for or purchase any securities and nothing contained herein shall form the basis of any contract or commitment whatsoever. This presentation is being furnished to you solely for your information and may not be reproduced, copied, shared, disseminated or redistributed, in whole or in part, in any manner whatsoever to any other person. The distribution of this presentation in certain jurisdictions may be restricted by law and persons into whose possession this presentation comes should inform themselves about, and observe, any such restrictions.
Safe Harbor Certain statements contained in this presentation reflect SEB’s current views with respect to future events and financial and operational performance. Except for
the historical information contained herein, statements in this presentation which contain words or phrases such as “will”, “aim”, “will likely result”, “would”, “believe”, “may”, “result”, “expect”, “will continue”, “anticipate”, “estimate”, “intend”, “plan”, “contemplate”, “seek to”, “future”, “objective”, “goal”, “strategy”, “philosophy”, “project”, “should”, “will pursue” and similar expressions or variations of such expressions may constitute “forward-looking statements”. These forward-looking statements involve a number of risks, uncertainties and other factors that could cause SEB’s actual development and results to differ materially from any development or result expressed or implied by such forward-looking statements. These risks and uncertainties include, but are not limited to, SEB’s ability to successfully implement its strategy, future levels of non-performing loans, its growth and expansion, the adequacy of its allowance for credit losses, its provisioning policies, technological changes, investment income, cash flow projections, exposure to market risks as wells other risks. SEB undertakes no obligation to publicly update or revise forward-looking statements contained herein, whether as a result of new information, future events or otherwise. In addition, forward-looking statements contained in this presentation regarding past trends or activities should not be taken as a representation that such trends or activities will continue in the future. You should not place undue reliance on forward-looking statements, which speak only as of the date of this presentation.
2

Our way of doing business
Full-service customers
Holistic coverage
Investments in core services
Large Corporate
2,100 customers
Financial Institutions
700 customers
Corporate
400k customers
Private
4m customers
Since 1856…
3

Fx SEK/EUR = 8.90 *latest available 2011 data
Corporate and Institutional business * – The leading Nordic franchise in Trading, Capital Markets and Fx
activities, Equities, Corporate and Investment banking – Second largest Nordic asset manager with SEK 1,427bn under
management – Largest Nordic custodian with SEK 5,814bn under custody
Private Individuals * – The largest Swedish Private Bank in terms of Assets Under
Management – Total Swedish household savings market: No. 2 with approx.
11% market share – Life insurance & Pensions: Leading unit-linked life business
with approx. 17% of the Swedish market and approx 9% of the total unit-linked and traditional life & pension business in Sweden
– Swedish household mortgage lending: Approx. 16% – Second largest bank in the Baltic countries
* latest available data
Market franchise Sep 2013
*excluding Treasury
Germany *
Sweden
Norway
Finland
Denmark
Other
Geographic Baltic - Estonia 2% - Latvia 3% - Lithuania 4%
Business *
Merchant Banking -Corporate Banking 20% -Markets 14% -Transaction Banking 6%
Retail (Retail Sweden & Baltic division)
Total operating income 12m rolling Sept 2013
Wealth Management and Life
4
Ambition going forward
The leading Nordic bank for corporates & institutions
Top universal bank in Sweden and the Baltics
5

Dividend payout 40% or above
Financial ambitions
Common Equity Tier 1 ratio of 13%
Generate ROE that is competitive with peers
Long-term ROE aspiration 15%
6

Actions to raise divisional performance
Merchant Banking
Retail Banking
Asset Gathering
Baltic
Income growth by 2015
~15%
~20%
~5%
~15%
Second phase in the Nordic and German expansion
Increase cross-selling on existing customer base
Further strengthen corporate profile
Leverage multi-channel approach
Reduce complexity in fund offering and grow PB
Improve Life insurance online solutions
Focus on customer profitability
Improve advisory services to corporates
7

Short- and long-term ROE ambitions
Near-term ambition
Long-term ambition
15%
13%
ROE
CET1 ratio
on
13%
(15%)
ROE
CET1 ratio
on
Today
11%
13%
ROE
CET1 ratio
on
Operating leverage Capital generation
Operating leverage Capital efficiency
8

Highlights Q3-2013
Improved business sentiment
Increased operating leverage
Renewed regulatory uncertainty
1 2 3
9
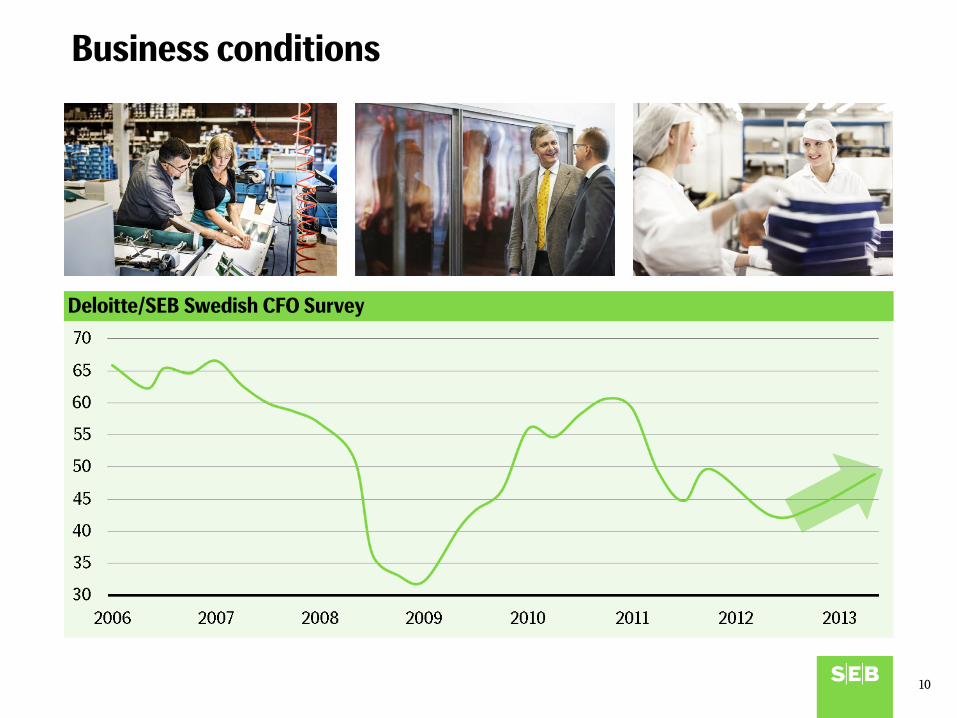
Business conditions
Deloitte/SEB Swedish CFO Survey
10

Financial summary
11
Operating income by type, Q3 2013 vs. Q3 2012 (SEK bn)
Profit and loss (SEK m)
Net interest income
Net fee and commissions
Net financial income
Net life insurance income
Q3-12 Q3-13 Q3-12 Q3-13 Q3-12 Q3-13 Q3-12 Q3-13
% Jan-Sep
2013Jan-Sep
2012 %
Total Operating income 10,324 9,681 7 30,523 29,186 5Total Operating expenses -5,453 -5,639 -3 -16,626 -17,128 -3Profit before credit losses 4,871 4,042 21 13,897 12,058 15Net credit losses etc. -253 -185 -779 -662
Operating profit 4,618 3,857 20 13,118 11,396 15
Q3-13 Q3-12

Profit generating throughout the financial and sovereign debt “crises”
Income, expenses and net credit losses (SEK bn)
Operating profit, (SEK bn)
16.2 15.6 17.2 17.0
15.6 12.4
15.2 14.9
5.7
17.0 14.2
11.4
12.9 14.2
13.9 13.1
12

Business mix creates stable and diversified revenues
13
0
2
4
6
8
10
12
14
Q1-09 Q2-09 Q3-09 Q4-09 Q1-10 Q2-10 Q3-10 Q4-10 Q1-11 Q2-11 Q3-11 Q4-11 Q1-12 Q2-12 Q3-12 Q4-12 Q1-13 Q2-13 Q3-13
Non Net Interest Income Net Interest Income
SEK bn
SEK bn
*Gross commission development
Total operating income split between Non-NII and NII
Underlying market shares render stable commission* and net life income
60%
12.5
9.1 9.2 8.7 9.2
59% 59% 64% 54%
41% 41% 36% 46%
40% 8.9
53%
47%
10.0
55%
45%
9.7
44%
56%
45%
56%
9.5
44%
55%
9.2
46%
54%
9.3
44%
56%
9.6
46%
54%
9.9
46%
54%
9.7 9.6
46%
54%
9.6
47%
53%
10.6
44%
56%
10.3
46%
54% 49%
10.7
51%

Net interest income development
14
Net interest income 2012 YTD vs. 2013 YTD (SEK bn)
Net interest income type Q3 2011 – Q3 2013 (SEK bn)
Deposits
Funding & other
Lending +5%

NIM development
15
Inte
rest
-ear
ning
and
deb
t se
curit
ies
Loan
s & D
epos
its
Group NIM Q1 2011 ~1% Q1 2013 ~1%

Net fee and commission income development
Net fee and commissions 2012 YTD vs. 2013 YTD (SEK bn)
Gross fee and commissions by income type Q3 2011 – Q3 2013 (SEK bn)
Custody and mutual funds
Payments, cards, lending, deposits & guarantees
Advisory, secondary markets and derivatives +9%
16

Q3 Q2 SEK m Jan - Sep Jan - Sep SEK m
SEK m 2013 2013 ∆ 2013 2012 ∆Issue of securities and advisory 154 161 -7 380 405 -25
Secondary market and derivatives 482 647 -165 1,624 1,460 164
Custody and mutual funds 1,631 1,702 -71 4,990 4,853 137Whereof performance and transaction fees Wealth 2 48 -46 120 87 33
Payments, cards, lending, deposits, guarantees and other 2,587 2,515 72 7,276 6,658 618 Whereof payments and card fees 1,463 1,516 -53 4,400 4,460 -60 Whereof lending 828 675 153 1,957 1,439 518
Fee and commission income 4,854 5,025 -171 14,270 13,376 894
Fee and commission expense -1,119 -1,214 95 -3,477 -3,471 -6
Net fee and commission income 3,735 3,811 -76 10,793 9,905 888
Net fee and commission income development SEB Group
17

Net financial income development
18
Net financial income development Q3 2011 – Q3 2013 (SEK bn)
Average daily turnover of Swedish sovereign bonds

Increased operating leverage
Average quarterly income (SEK bn) Average quarterly expenses (SEK bn)
Operating leverage
Notes: Excluding one-offs (restructuring in 2010, and bond buy-back and IT impairment in 2012) Estimated IAS 19 costs in 2010
Average quarterly pre-provision profit (SEK bn)
19

Divisional performance
Operating profit Jan-Sep 2013 vs. Jan-Sep 2012 (SEK bn)
RoBE 12.3% 21.0% 14.5% 18.9% 13.1%
20

Large Corporate financing
21
Headline transactions Q3 2013
SEK league table – Corporate bonds 12 month rolling (SEK bn)
SEK 500m Sole bookrunner
EUR 750m Joint bookrunner
EUR 685m Joint Bookrunner
EUR 150m Joint Bookrunner
Credit portfolio FX-adjusted, SEK bn

Continued positive trend for Retail Banking Change Q3 2013 vs. Q3 2012
22
*proforma, adjusted to allow improved comparison (altered tax and BE allocation models)
0,48
C/I ratio, -0,08
Credit losses, SEK m, -1 per cent Operating profit, SEK m, +34 per cent
RoBE, per cent, +7.8 per cent*

Customer growth in Retail Banking Sweden
Active SME customers (thousands)
Full service customers (thousands)
461,8
23

Selective origination ● The mortgage product is the foundation of
the client relationship ● SEB’s customers have higher credit quality
than the market average and are over-proportionally represented in higher income segments (Source: Swedish Credit Bureau (“UC AB”))
High asset performance ● Net credit losses consistently low, now 0bps ● Loan book continues to perform – loans past
due >60 days still at 10bps
Mortgage lending based on affordability
SEB’s Swedish household mortgage lending
Low LTVs by regional and global standards Credit scoring and assessment 7% interest rate test 85% regulatory first lien mortgage cap &minimum 15% of own
equity required If LTV >70% requirement to amortise on all new loans Max loan amount 5x total gross household income irrespective
of LTV ‘Sell first and buy later’ recommendation
0-50%
51-85% 23%
>85% 1% Loan-to-value Share of portfolio
76%
YoY +11%
YoY +16%
YoY +11%
YoY +11%
YoY +10%
YoY +9%
SEK bn
SEB portfolio development vs. total market (QoQ)
24
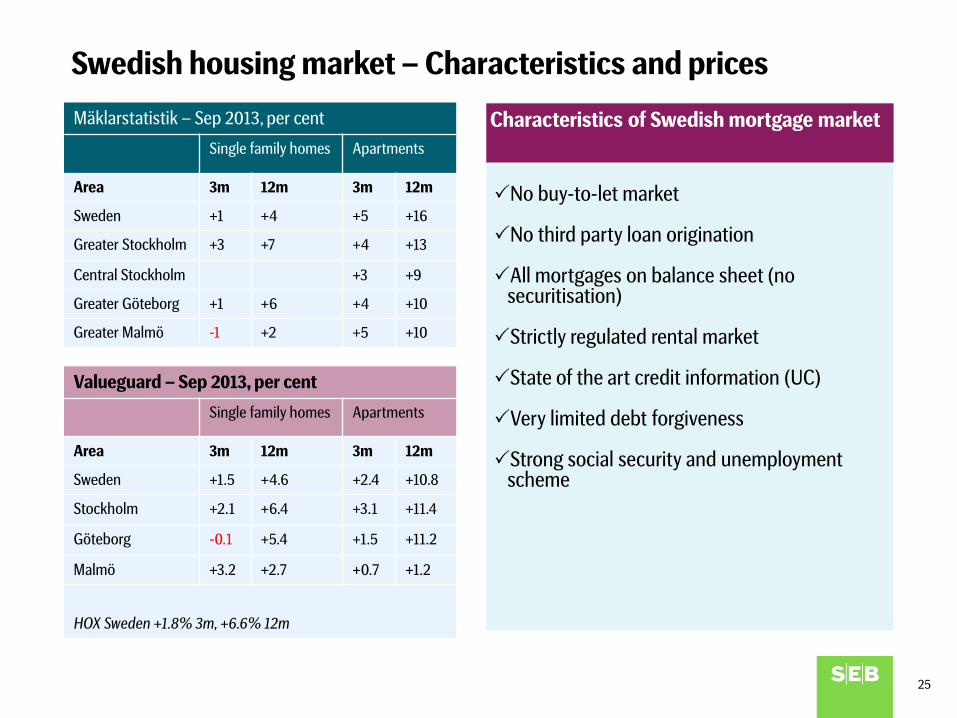
Swedish housing market – Characteristics and prices
Mäklarstatistik – Sep 2013, per cent
Single family homes Apartments
Area 3m 12m 3m 12m
Sweden +1 +4 +5 +16
Greater Stockholm +3 +7 +4 +13
Central Stockholm +3 +9
Greater Göteborg +1 +6 +4 +10
Greater Malmö -1 +2 +5 +10
No buy-to-let market
No third party loan origination
All mortgages on balance sheet (no securitisation)
Strictly regulated rental market
State of the art credit information (UC)
Very limited debt forgiveness
Strong social security and unemployment scheme
Characteristics of Swedish mortgage market
Valueguard – Sep 2013, per cent
Single family homes Apartments
Area 3m 12m 3m 12m
Sweden +1.5 +4.6 +2.4 +10.8
Stockholm +2.1 +6.4 +3.1 +11.4
Göteborg -0.1 +5.4 +1.5 +11.2
Malmö +3.2 +2.7 +0.7 +1.2
HOX Sweden +1.8% 3m, +6.6% 12m
25

Balance sheet
26

CET 1 ratio (Basel 3)
Strong asset quality and balance sheet
CT 1 (Basel 2.5)
Liquidity resources
Customer deposits
2009 2012 Sep 2013
28.6bn 13.8bn 10.2bn
65% 66% 69%
0.92% 0.08% 0.08%
750bn 862bn 923bn
>10% ~25% ~25%
N.A. 113% 114%
11.7% 15.1% 17.4%
N.A. 13.1% 15.0%
Non-performing loans
Liquidity coverage ratio
NPL coverage ratio
Ass
et q
ualit
y Fu
ndin
g an
d liq
uidi
ty
Cap
ital
(SEK)
Net credit loss level
27
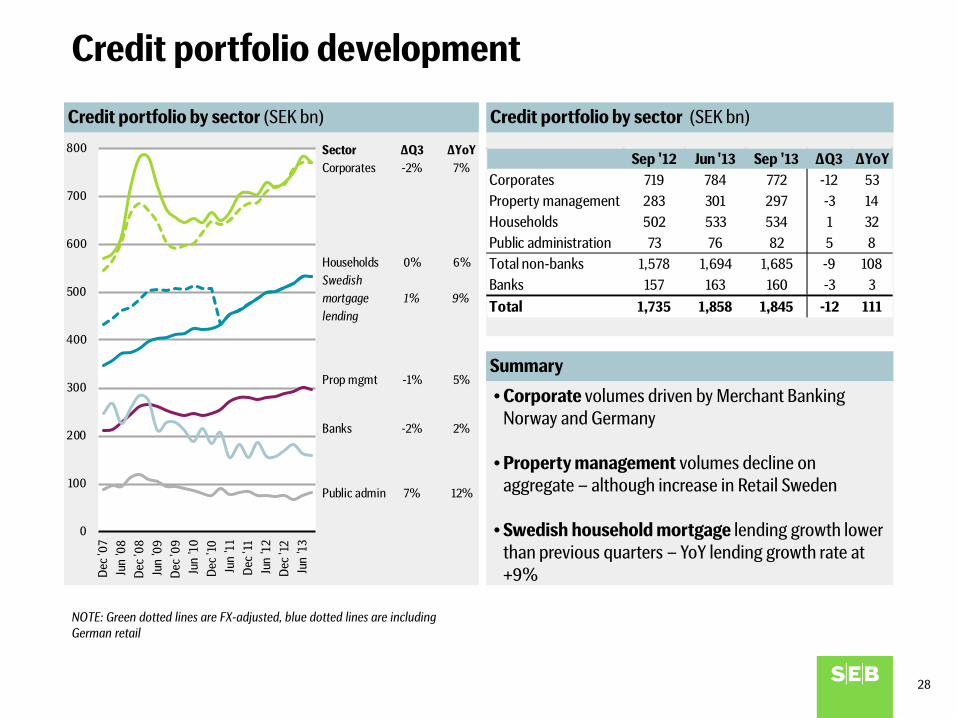
Credit portfolio by sector (SEK bn)
Credit portfolio development
Credit portfolio by sector (SEK bn)
Summary
NOTE: Green dotted lines are FX-adjusted, blue dotted lines are including German retail
0
100
200
300
400
500
600
700
800
Dec
'07
Jun
'08
Dec
'08
Jun
'09
Dec
'09
Jun
'10
Dec
'10
Jun
'11
Dec
'11
Jun
'12
Dec
'12
Jun
'13
Sep '12 Jun '13 Sep '13 ∆Q3 ∆YoYCorporates 719 784 772 -12 53Property management 283 301 297 -3 14Households 502 533 534 1 32Public administration 73 76 82 5 8Total non-banks 1,578 1,694 1,685 -9 108Banks 157 163 160 -3 3Total 1,735 1,858 1,845 -12 111
• Corporate volumes driven by Merchant Banking Norway and Germany
• Property management volumes decline on aggregate – although increase in Retail Sweden
• Swedish household mortgage lending growth lower than previous quarters – YoY lending growth rate at +9%
Sector ∆Q3 ∆YoYCorporates -2% 7%
Households 0% 6%Swedish mortgage 1% 9%lending
Prop mgmt -1% 5%
Banks -2% 2%
Public admin 7% 12%
28

0
5
10
15
20
25
30
Dec
'07
Dec
'08
Dec
'09
Dec
'10
Dec
'11
Dec
'12
Mar
'13
Jun
'13
Sep
'13
Dec
'07
Dec
'08
Dec
'09
Dec
'10
Dec
'11
Dec
'12
Mar
'13
Jun
'13
Sep
'13
Dec
'07
Dec
'08
Dec
'09
Dec
'10
Dec
'11
Dec
'12
Mar
'13
Jun
'13
Sep
'13
Dec
'07
Dec
'08
Dec
'09
Dec
'10
Dec
'11
Dec
'12
Mar
'13
Jun
'13
Sep
'13
Group Nordics Germany Baltics
Portfolio assessed - past due >60 days
Individually assessed - impaired loans with specific reserves
Non-performing loans QoQ development (SEK bn)
NOTE: Sale of the German retail operations reduced German NPLs by SEK 817m in Mar ‘11
-18.8%
-6.9% 9.1%
-27.7%
NPL % of lending: 0.7% 0.2% 0.8% 5.6%NPL coverage ratio: 68.8% 69.1% 87.9% 64.4%
Development of Non-Performing Loans SEK bn
29

Nordics
Credit loss levels per geography Annualised accumulated
Germany *
Baltics
SEB Group **
Negative credit loss level = reversal * Continuing operations ** Total operations
0.050.18 0.17
0.06 0.07 0.05 0.06
2007 2008 2009 2010 2011 2012 Sep '13
0.10 0.07 0.11 0.05 0.02 0.02 0.05
2007 2008 2009 2010 2011 2012 Sep '13
0.431.28
5.43
0.63
-1.37
0.33 0.32
2007 2008 2009 2010 2011 2012 Sep '13
0.110.30
0.92
0.15
-0.08
0.08 0.08
2007 2008 2009 2010 2011 2012 Sep '13
30

A strong balance sheet structure Sep 2013
Balance sheet structure SEK 2,569bn
Liquid assets
124% of short-term funding
1. A relatively large share of lending is contractually short which allows for swift re-pricing to adjust for e.g. changed funding costs.
2. Central bank deposits refer to long-term relationship-based deposits from central banks and do not refer to borrowings from central banks
Central Bank deposits 2)
“Banking book” 1)
2)
Stable funding 117% of “Banking book”
Short-term funding
31

Conservative funding strategy
Long-term funding activities (SEK bn)
Instrument 2011 2012 Q3 2013 Jan- Sep
2013
Senior unsecured SEB AB 32 42 16 32
Covered bonds SEB AB 95 81 15 57
Covered bonds SEB AG 0 1 0 0
Subordinated debt 0 6 0 0
Total 126 124 31 89
Issuance of bonds (SEK bn)
Stable structural liquidity position – SEBs Core Gap ratio*
* Core Gap Ratio is an SEB defined internal measure similar to the regulatory-defined NSFR but based on internal behavioural modelling. It measures the amount of more than 1 year funding in relation to more than 1 year assets.
32

Basel II without transitional rules SEB Group
SEK bn
Core Tier I 93.8 96.4 97.5 88.4 89.0 95.5 99.7
Capital base 103.1 106.7 109.6 100.9 100.9 105.0 106.9
RWA 675 632 591 586 583 593 574
Note: Pre Dec 2012 not restated for accounting principle changes
Basel III fully implemented 13.1% 13.4% 14.2% 15.0%
33

Sum-up
34
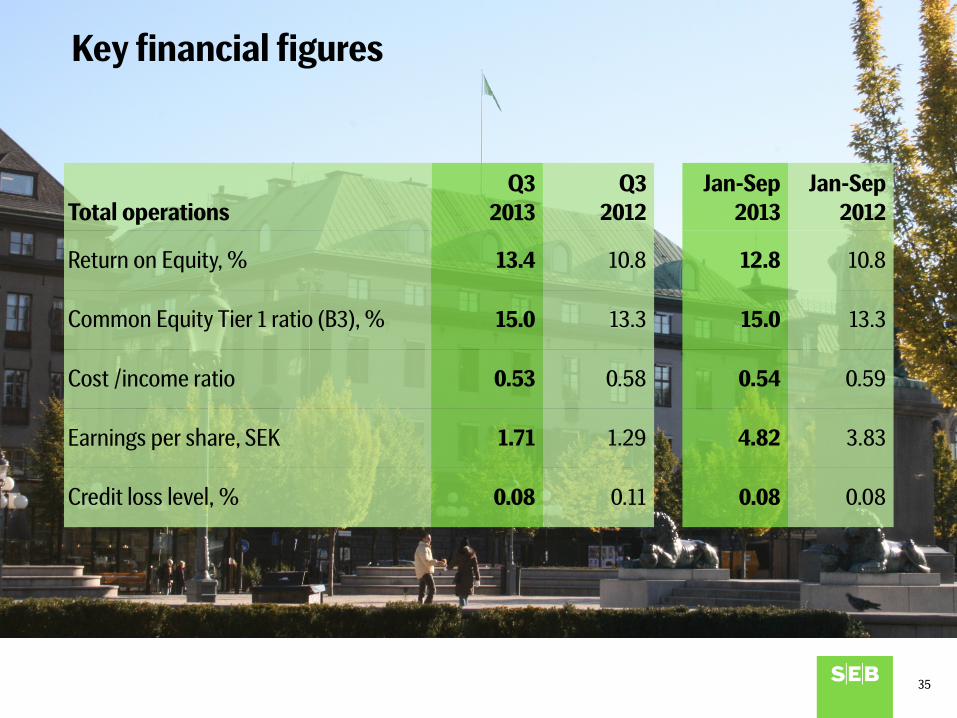
Key financial figures
35
Total operations
Q3 2013
Q3 2012
Jan-Sep 2013
Jan-Sep 2012
Return on Equity, % 13.4 10.8 12.8 10.8
Common Equity Tier 1 ratio (B3), % 15.0 13.3 15.0 13.3
Cost /income ratio 0.53 0.58 0.54 0.59
Earnings per share, SEK 1.71 1.29 4.82 3.83
Credit loss level, % 0.08 0.11 0.08 0.08

Going forward
Customer satisfaction
A long-term financial partner
Continued execution
36


