35
SECA SOFC Programs At FuelCell Energy Inc. Presented at the 7 th Annual SECA Workshop Philadelphia, PA. September 12-14, 2006 by Jody Doyon
SECA SOFC Programs At FuelCell Energy Inc.
Presented at the 7th Annual SECA WorkshopPhiladelphia, PA.
September 12-14, 2006by
Jody Doyon
FCE SECA SOFC Programs
FuelCell Energy, Inc. (FCE) has been engaged in a Department of Energy (DOE) sponsored SECA Cost Reduction Phase I program to develop a 3-10kW SOFC power plant system since April, 2003
FCE has recently been selected by DOE to participate in the SECA Coal-Based Systems program. This programs objective is the development of very efficient coal-fueled large scale (multi-MW) power plants with near zero emissions to be demonstrated at FutureGen. Applicable elements of the existing SECA Cost Reduction project will be integrated into this new project’s technical objectives, based on similarities in cell and stack development.
The FCE SOFC TeamThe FCE team is comprised of organizations with expertise in key functional areas:
FuelCell Energy Inc. (FCE), Danbury, CTVersa Power Systems Inc. (VPS), Littleton, CO:
• Versa Power Systems Ltd, Calgary, Alberta• Materials and Systems Research, Inc. (MSRI), Salt Lake City, UT• University Of Utah, Salt Lake City, UT• Gas Technology Institute (GTI), Des Plaines, IL
Pacific Northwest National Laboratory (PNNL), Richland, WA
Presentation OverviewFCE’s SECA SOFC Programs:
SECA Phase I 3-10kW SOFC System Development Program:• Objectives - Status• Technology Developments• 3-1 System Test Results• Factory Cost Audit • Summary
SECA Phase I Coal Based, Multi-MW SOFC/Hybrid System Development Program:
• Objectives• Technical Approach
SECA Phase I, 3-10kW Development ProgramObjectives:
Development of a kW-Class (3-10kW) SOFC Power Plant System With:3-10kW Net Power Output.At least 35% overall efficiency from natural gas (stationary product requirement). Less than 4%/1000hours steady state performance degradation. Less that 1%
performance degradation after DOE specified transient tests (load and thermal cycles).
System Cost Less Than $800/kW.
Status:Verified performance of scaled up cell area and stack size components.Completed 3-1 system test (DOE Program Metric).Completed system cost analysis and report for audit. 3rd party consultant
has been selected and approved by DOE to conduct audit of system cost (DOE Program Metric).
FCE on accelerated program schedule to end program early, to merge with Coal Based Program.
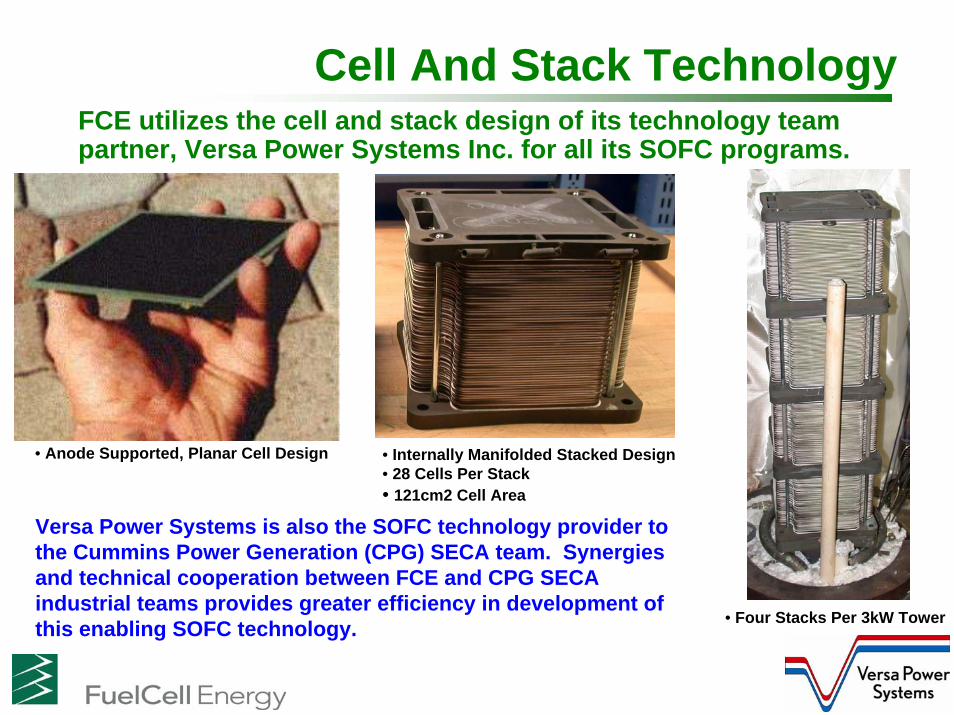
Cell And Stack TechnologyFCE utilizes the cell and stack design of its technology team partner, Versa Power Systems Inc. for all its SOFC programs.
• Four Stacks Per 3kW Tower
• Anode Supported, Planar Cell Design • Internally Manifolded Stacked Design• 28 Cells Per Stack• 121cm2 Cell Area
Versa Power Systems is also the SOFC technology provider to the Cummins Power Generation (CPG) SECA team. Synergies and technical cooperation between FCE and CPG SECA industrial teams provides greater efficiency in development of this enabling SOFC technology.
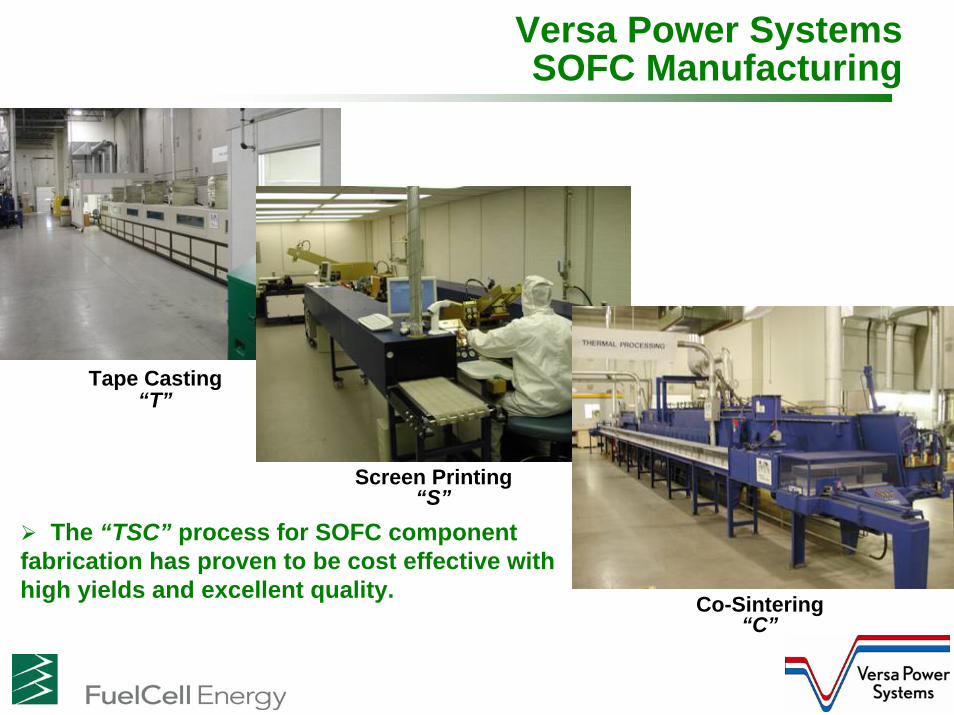
Versa Power Systems SOFC Manufacturing
The “TSC” process for SOFC component fabrication has proven to be cost effective with high yields and excellent quality.
Tape Casting “T”
Screen Printing“S”
Co-Sintering“C”
SECA Phase I Program Technical HighlightsFCE:
• Evaluated alternative gasket materials and designs for improved cell and stack sealing efficiency.• Lab tested internal reforming options for improved thermal management.
VPS:• Successfully developed, tested and validated scaled-up cell area components and tall stack (number of cells) designs.• Developed manufacturing processes for scaled up components with improved yields and reduced cost.• Completed the development of the integrated stack & BOP for the 3kW Prototype System. • Completed the Phase 1 Prototype System Technical Metric: tested at VPS and now being demonstrated at NETL.• Completed Factory Cost analysis. Report submitted for 3rd party audit.
MSRI/UU:• Analyzed and developed alternative anodes with improved strength, redox tolerance and resistance to sulfur poisoning.• Evaluated alternative electrolyte materials for improved performance.• Studied and developed a better understanding of charge transfer mechanism for reduced area specific resistance (ASR) of the active cell component.
GTI:• Developed the sulfur cleanup subsystem for a 10kW NG system. Evaluated absorbent materials from alternative vendors. Analyzed ambient (low) temperature absorbent (ATA) materials for sulfur removal. • Characterized utility NG compositions at VPS, Calgary and NETL, Morgantown WV.• Developed heat exchange and thermal management subsystems for the advanced 10kW System
PNNL:• Developed computational modeling tool that includes cell and stack thermomechanical, electromechanical and electrochemical properties. This provides a mechanistic tool to analyze stress and failure conditions of alternative designs considered for improved performance and scale-up.
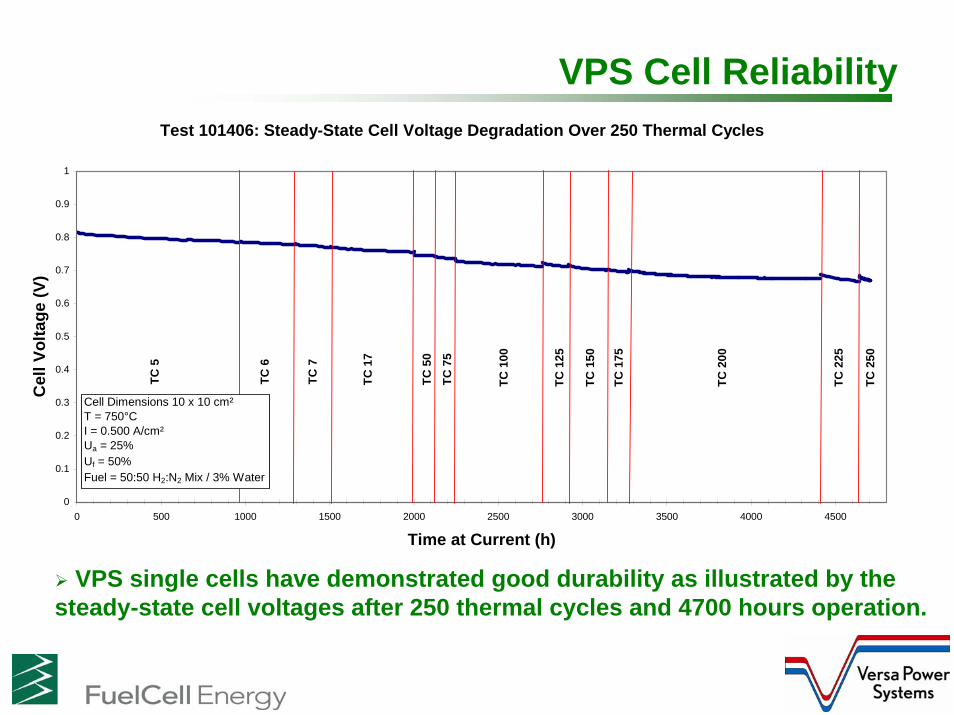
VPS Cell ReliabilityTest 101406: Steady-State Cell Voltage Degradation Over 250 Thermal Cycles
0
0.1
0.2
0.3
0.4
0.5
0.6
0.7
0.8
0.9
1
0 500 1000 1500 2000 2500 3000 3500 4000 4500
Time at Current (h)
Cel
l Vol
tage
(V)
TC 5
TC 1
00
TC 7
5TC
50
TC 1
7
TC 7
TC 6
TC 1
50
TC 1
25
Cell Dimensions 10 x 10 cm²T = 750°CI = 0.500 A/cm²Ua = 25%Uf = 50%Fuel = 50:50 H2:N2 Mix / 3% Water
TC 2
00
TC 1
75
TC 2
25
TC 2
50
VPS single cells have demonstrated good durability as illustrated by the steady-state cell voltages after 250 thermal cycles and 4700 hours operation.
Core Cell Technology Development at MSRI/UU
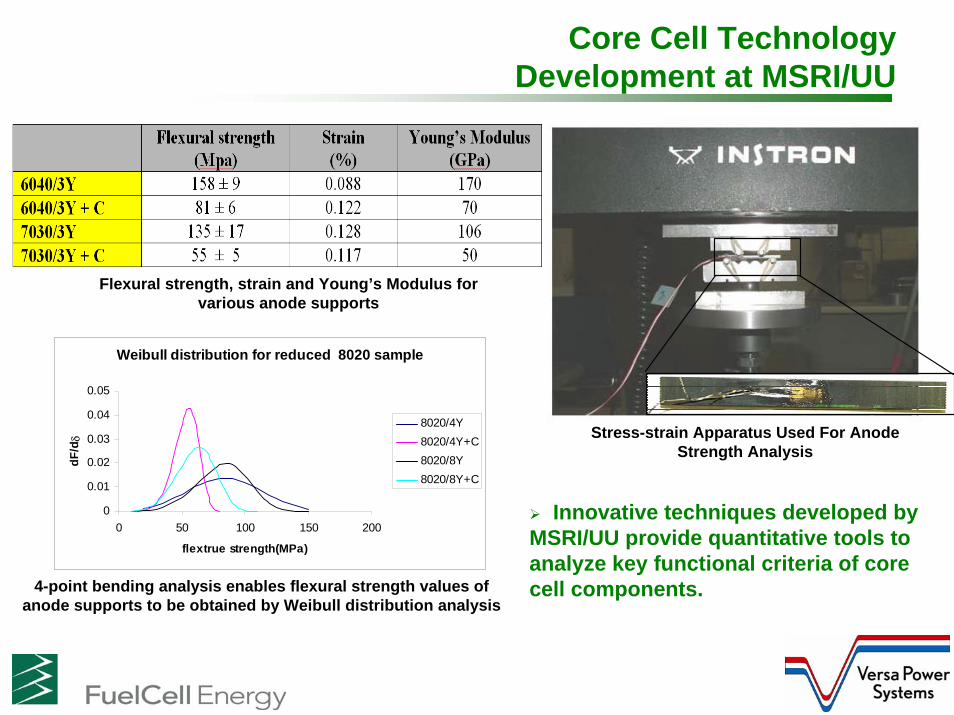
Weibull distribution for reduced 8020 sample
0
0.01
0.02
0.03
0.04
0.05
0 50 100 150 200
flextrue strength(MPa)
dF/dδ
8020/4Y8020/4Y+C8020/8Y8020/8Y+C
Flexural strength, strain and Young’s Modulus for various anode supports
Innovative techniques developed by MSRI/UU provide quantitative tools to analyze key functional criteria of core cell components.4-point bending analysis enables flexural strength values of
anode supports to be obtained by Weibull distribution analysis
Stress-strain Apparatus Used For Anode Strength Analysis
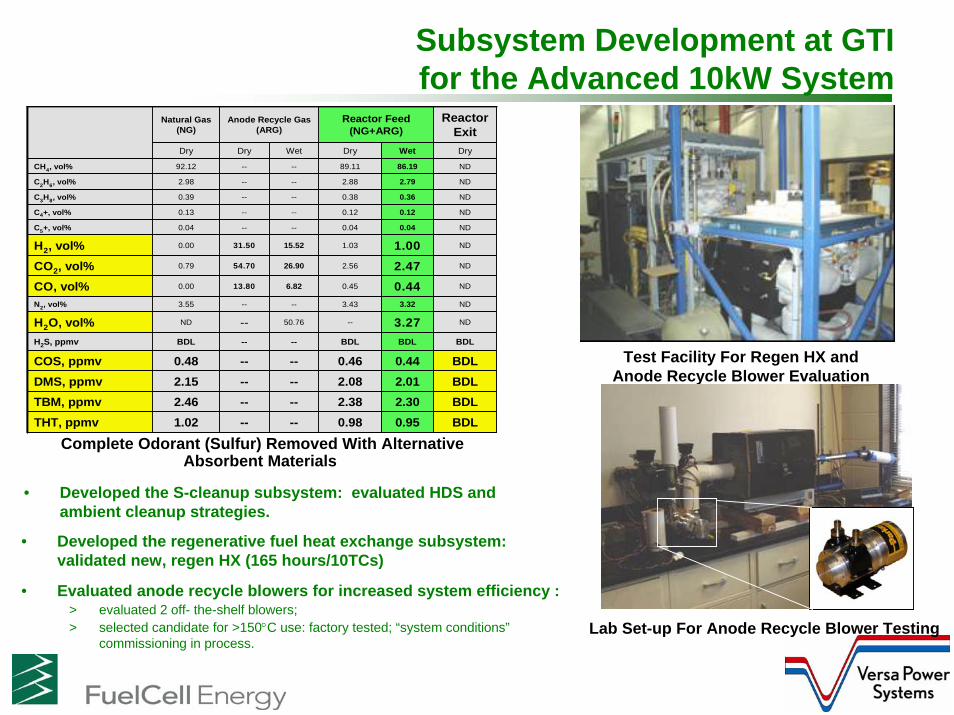
Subsystem Development at GTI for the Advanced 10kW System
• Developed the S-cleanup subsystem: evaluated HDS and ambient cleanup strategies.
BDL0.950.98----1.02THT, ppmvBDL2.302.38----2.46TBM, ppmvBDL2.012.08----2.15DMS, ppmvBDL0.440.46----0.48COS, ppmvBDLBDLBDL----BDLH2S, ppmv
ND3.27--50.76--NDH2O, vol%ND3.323.43----3.55N2, vol%
ND0.440.456.8213.800.00CO, vol%
ND2.472.5626.9054.700.79CO2, vol%
ND1.001.0315.5231.500.00H2, vol%ND0.040.04----0.04C5+, vol%
ND0.120.12----0.13C4+, vol%
ND0.360.38----0.39C3H8, vol%
ND2.792.88----2.98C2H6, vol%
ND86.1989.11----92.12CH4, vol%
DryWetDryWetDryDry
Reactor Exit
Reactor Feed (NG+ARG)
Anode Recycle Gas (ARG)
Natural Gas (NG)
Complete Odorant (Sulfur) Removed With Alternative Absorbent Materials
Test Facility For Regen HX and Anode Recycle Blower Evaluation
• Developed the regenerative fuel heat exchange subsystem: validated new, regen HX (165 hours/10TCs)
Lab Set-up For Anode Recycle Blower Testing
• Evaluated anode recycle blowers for increased system efficiency :> evaluated 2 off- the-shelf blowers; > selected candidate for >150°C use: factory tested; “system conditions”
commissioning in process.
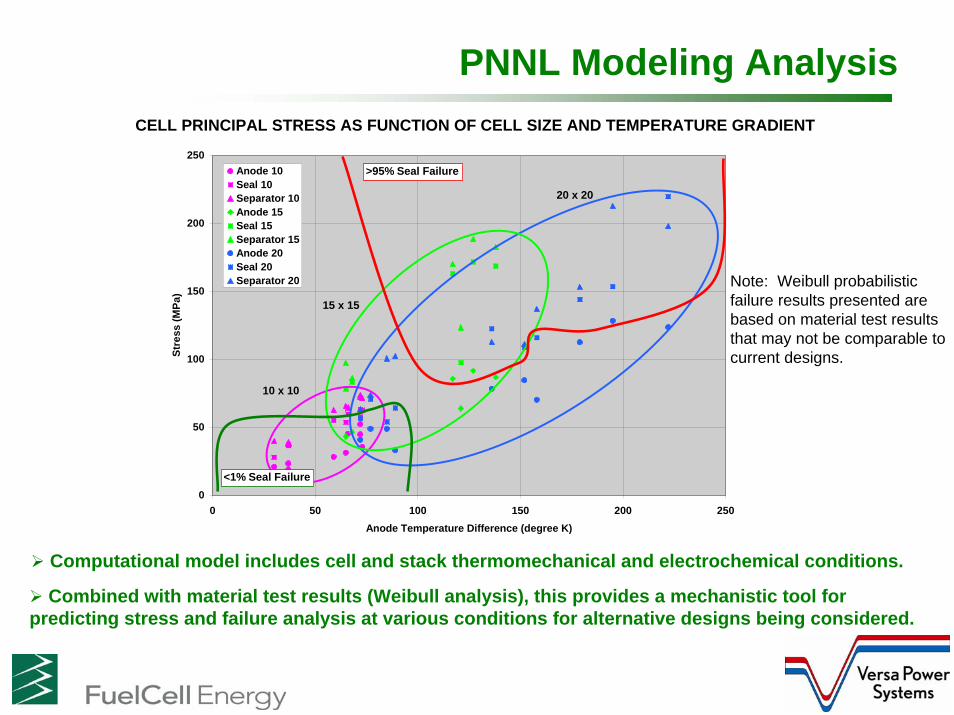
PNNL Modeling AnalysisCELL PRINCIPAL STRESS AS FUNCTION OF CELL SIZE AND TEMPERATURE GRADIENT
0
50
100
150
200
250
0 50 100 150 200 250Anode Temperature Difference (degree K)
Stre
ss (M
Pa)
Anode 10Seal 10Separator 10Anode 15Seal 15Separator 15Anode 20Seal 20Separator 20
20 x 20
10 x 10
15 x 15
Computational model includes cell and stack thermomechanical and electrochemical conditions.
Combined with material test results (Weibull analysis), this provides a mechanistic tool for predicting stress and failure analysis at various conditions for alternative designs being considered.
0
50
100
150
200
250
0 50 100 150 200 250Anode Temperature Difference (degree K)
Stre
ss (M
Pa)
Anode 10Seal 10Separator 10Anode 15Seal 15Separator 15Anode 20Seal 20Separator 20
20 x 20
10 x 10
15 x 15
<1% Seal Failure
>95% Seal Failure
Note: Weibull probabilistic failure results presented are based on material test results that may not be comparable to current designs.
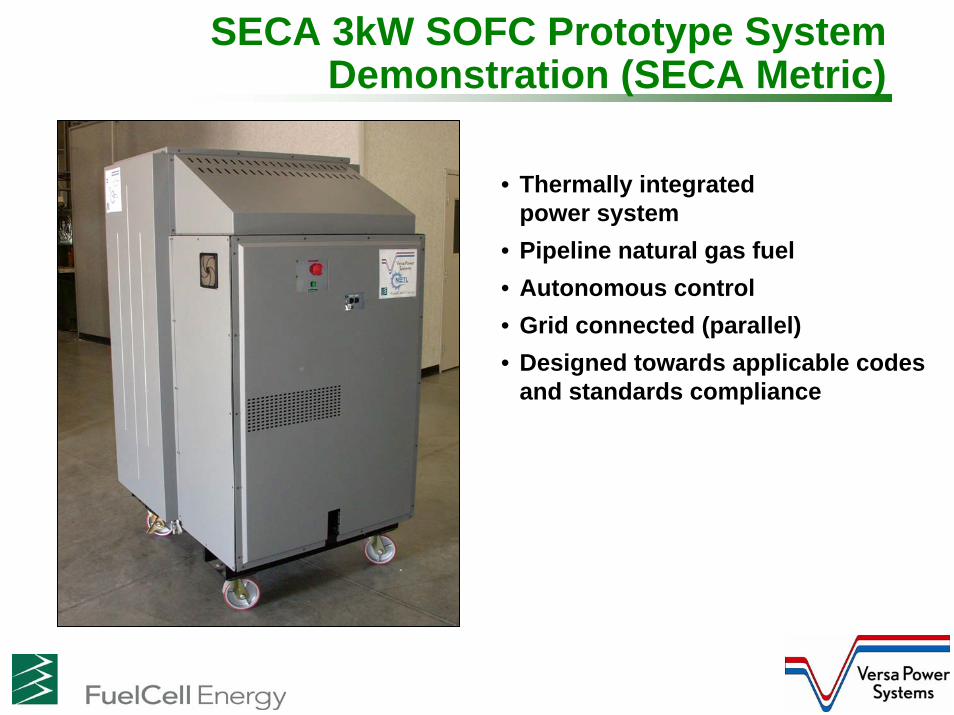
SECA 3kW SOFC Prototype System Demonstration (SECA Metric)
• Thermally integratedpower system
• Pipeline natural gas fuel • Autonomous control• Grid connected (parallel)• Designed towards applicable codes
and standards compliance
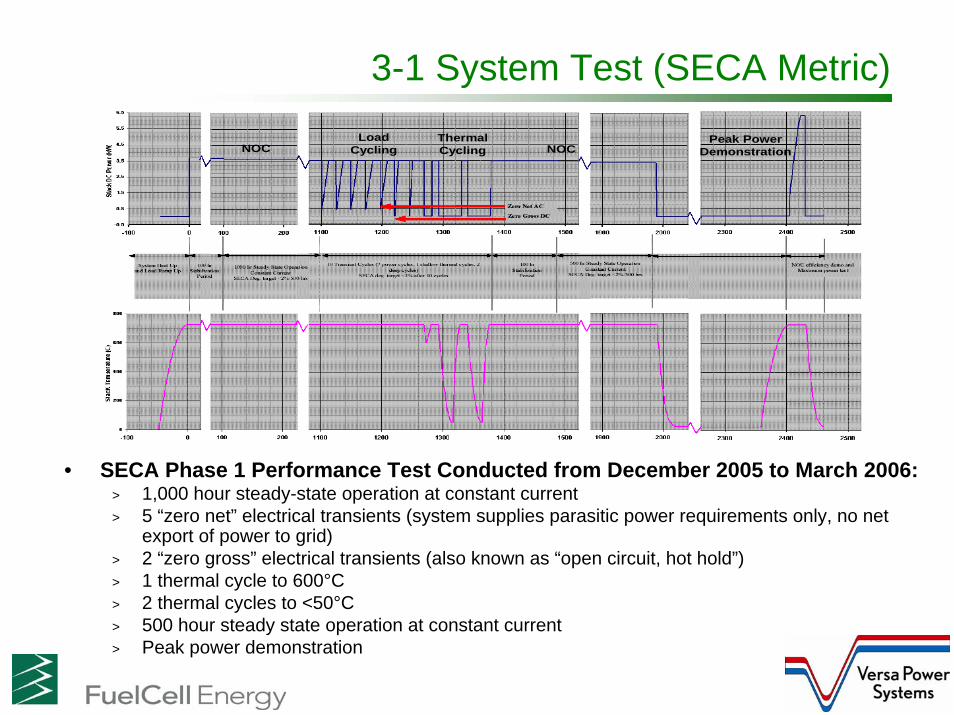
3-1 System Test (SECA Metric)
NOCLoad
CyclingThermal Cycling NOC
Peak Power DemonstrationNOC
Load Cycling
Thermal Cycling NOC
Peak Power Demonstration
• SECA Phase 1 Performance Test Conducted from December 2005 to March 2006:> 1,000 hour steady-state operation at constant current> 5 “zero net” electrical transients (system supplies parasitic power requirements only, no net
export of power to grid)> 2 “zero gross” electrical transients (also known as “open circuit, hot hold”) > 1 thermal cycle to 600°C> 2 thermal cycles to <50°C> 500 hour steady state operation at constant current> Peak power demonstration
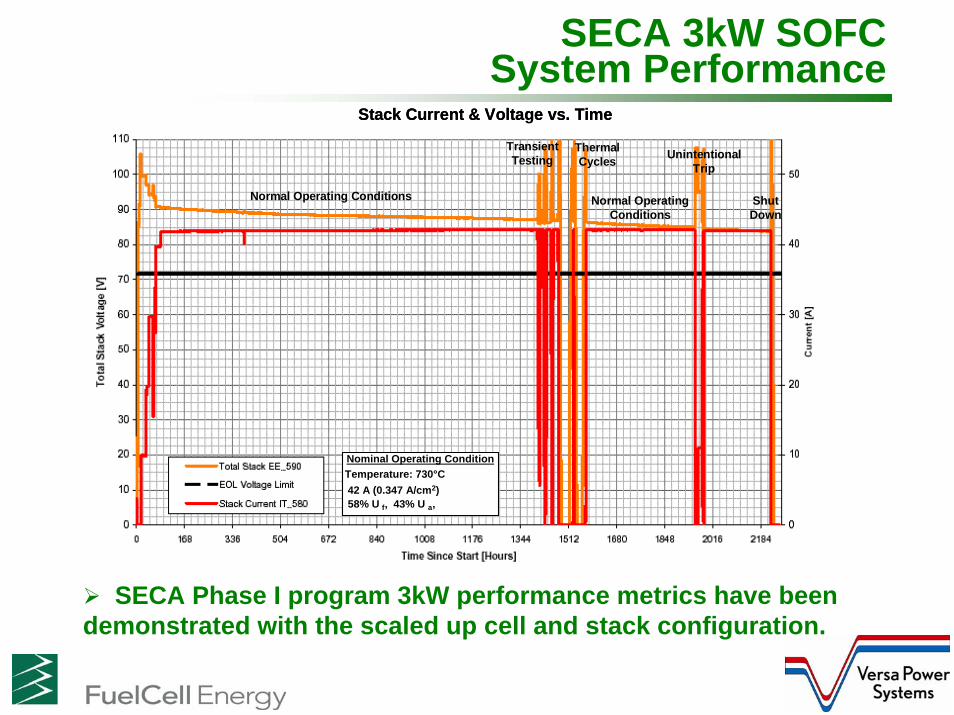
SECA 3kW SOFC System Performance
Normal Operating Conditions Normal Operating Conditions
Transient Testing Unintentional
Trip
Shut Down
Stack Current & Voltage vs. Time
Thermal Cycles
Normal Operating Conditions Normal Operating Conditions
Transient Testing Unintentional
Trip
Shut Down
Stack Current & Voltage vs. Time
Thermal Cycles
Temperature: 730°C42 A (0.347 A/cm2)58% U f, 43% U a,
Nominal Operating ConditionTemperature: 730°C42 A (0.347 A/cm2)58% U f, 43% U a,
Nominal Operating Condition
SECA Phase I program 3kW performance metrics have been demonstrated with the scaled up cell and stack configuration.
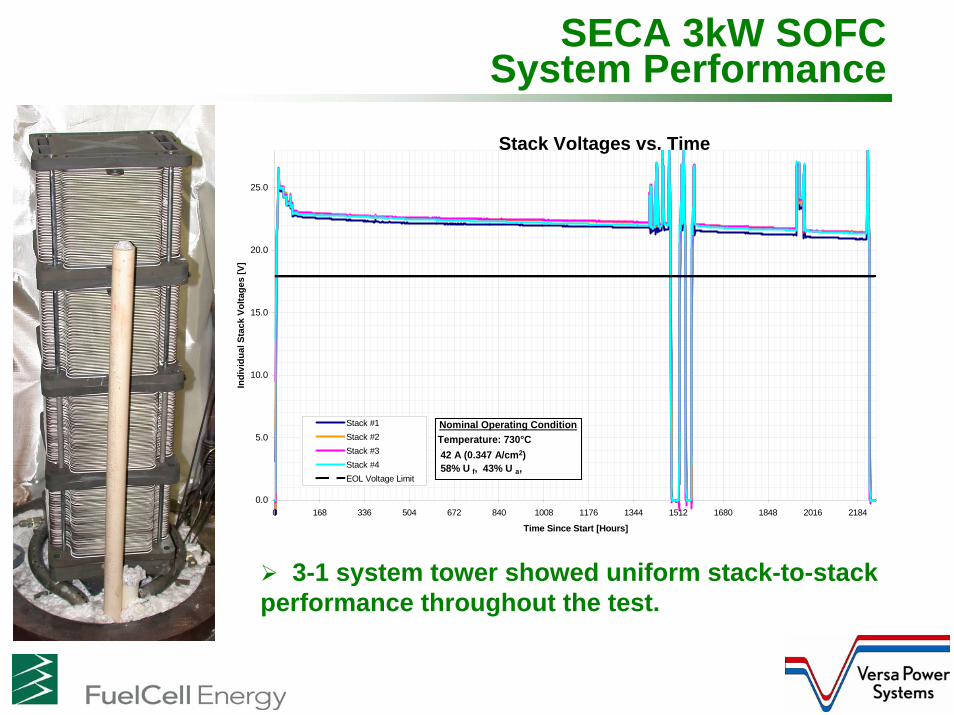
SECA 3kW SOFC System Performance
3-1 system tower showed uniform stack-to-stack performance throughout the test.
0.0
5.0
10.0
15.0
20.0
25.0
0 168 336 504 672 840 1008 1176 1344 1512 1680 1848 2016 2184
Time Since Start [Hours]
Indi
vidu
al S
tack
Vol
tage
s [V
]
Stack #1 EE_581Stack #2 EE_582Stack #3 EE_583Stack #4 EE_584EOL Voltage Limit
Temperature: 730°C42 A (0.347 A/cm2)58% U f, 43% U a,
Nominal Operating ConditionTemperature: 730°C42 A (0.347 A/cm2)58% U f, 43% U a,
Nominal Operating Condition
Stack Voltages vs. Time
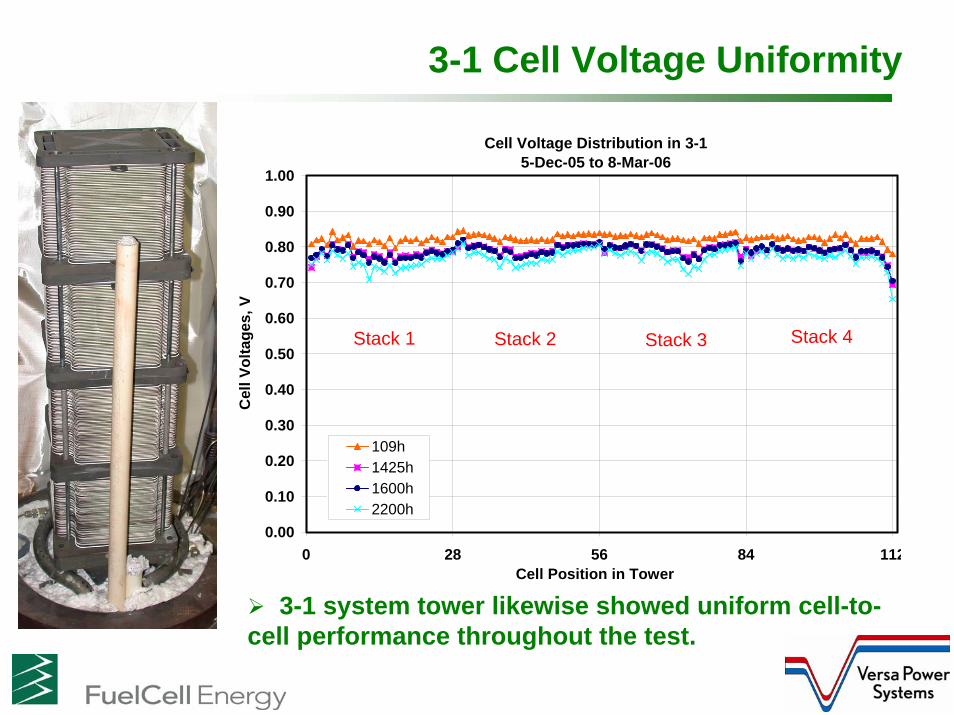
3-1 Cell Voltage Uniformity
Cell Voltage Distribution in 3-15-Dec-05 to 8-Mar-06
0.00
0.10
0.20
0.30
0.40
0.50
0.60
0.70
0.80
0.90
1.00
0 28 56 84 112Cell Position in Tower
Cel
l Vol
tage
s, V
109h1425h1600h2200h
Stack 4Stack 2 Stack 3Stack 1
3-1 system tower likewise showed uniform cell-to-cell performance throughout the test.
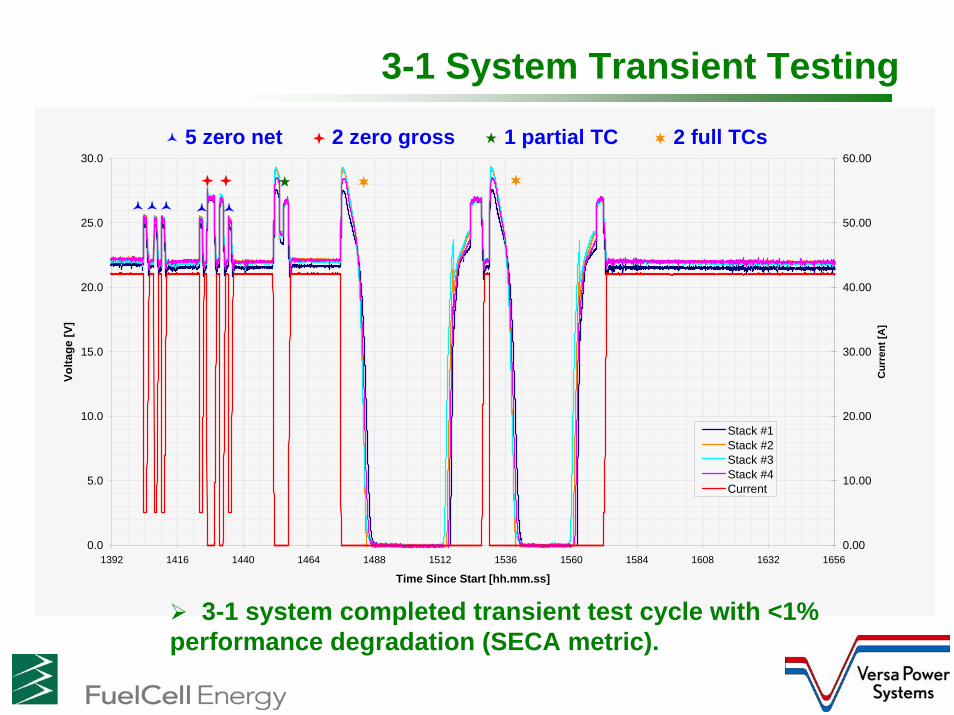
3-1 System Transient Testing
0.0
5.0
10.0
15.0
20.0
25.0
30.0
1392 1416 1440 1464 1488 1512 1536 1560 1584 1608 1632 1656
Time Since Start [hh.mm.ss]
Volta
ge [V
]
0.00
10.00
20.00
30.00
40.00
50.00
60.00
Cur
rent
[A]
EE_581EE_583EE_584EE_582IT_580
5 zero net 2 zero gross 1 partial TC 2 full TCs
Stack #1Stack #2Stack #3Stack #4Current
3-1 system completed transient test cycle with <1% performance degradation (SECA metric).
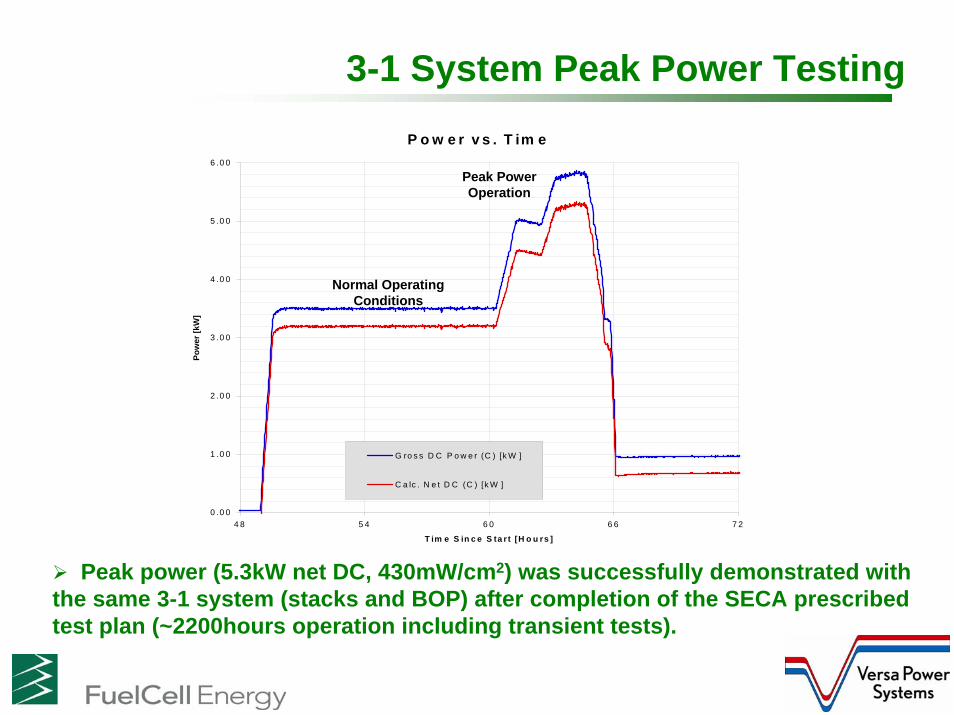
3-1 System Peak Power TestingP o w e r v s . T im e
0 .0 0
1 .0 0
2 .0 0
3 .0 0
4 .0 0
5 .0 0
6 .0 0
4 8 5 4 6 0 6 6 7 2
T im e S in c e S ta r t [H o u rs ]
Pow
er [k
W]
G ro s s D C P o w e r (C ) [k W ]
C a lc . N e t D C (C ) [k W ]
Normal Operating Conditions
Peak Power Operation
Peak power (5.3kW net DC, 430mW/cm2) was successfully demonstrated with the same 3-1 system (stacks and BOP) after completion of the SECA prescribed test plan (~2200hours operation including transient tests).
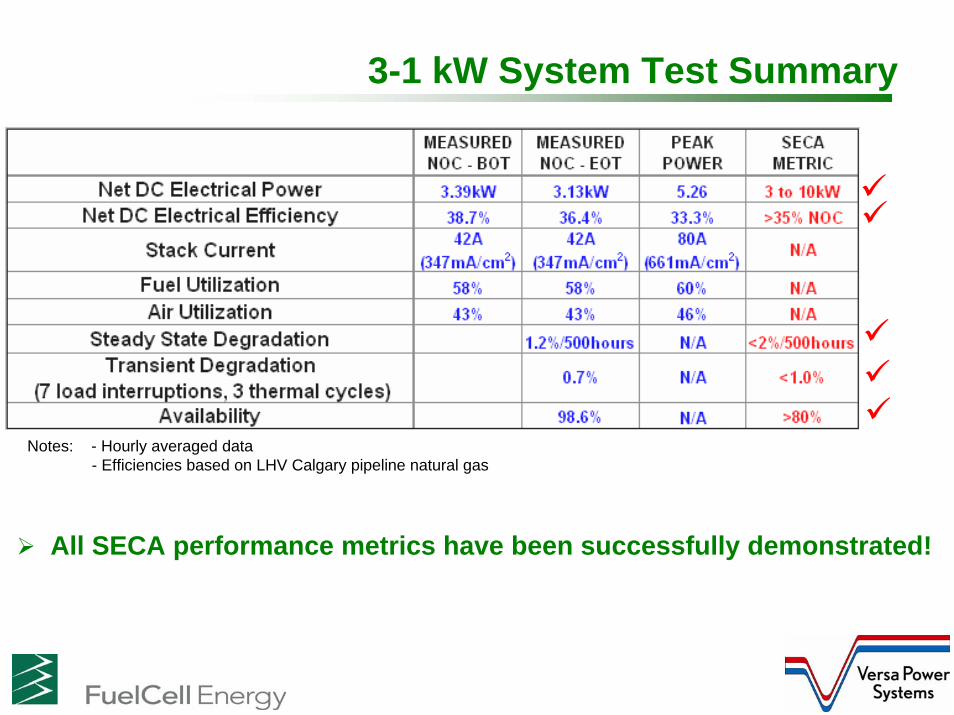
3-1 kW System Test Summary
Notes: - Hourly averaged data- Efficiencies based on LHV Calgary pipeline natural gas
All SECA performance metrics have been successfully demonstrated!
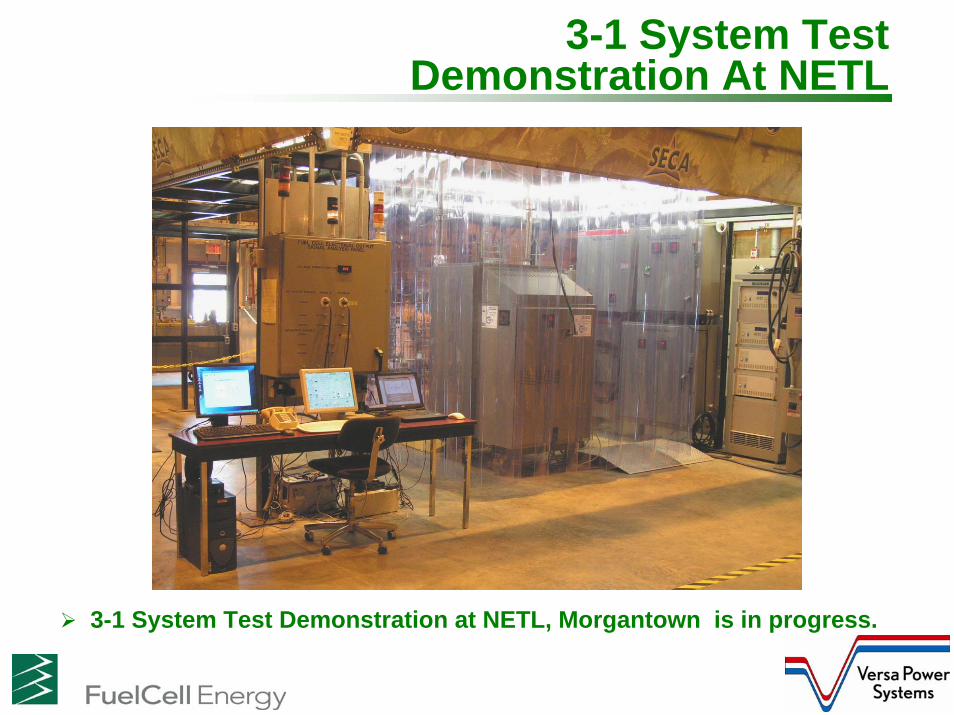
3-1 System Test Demonstration At NETL
3-1 System Test Demonstration at NETL, Morgantown is in progress.
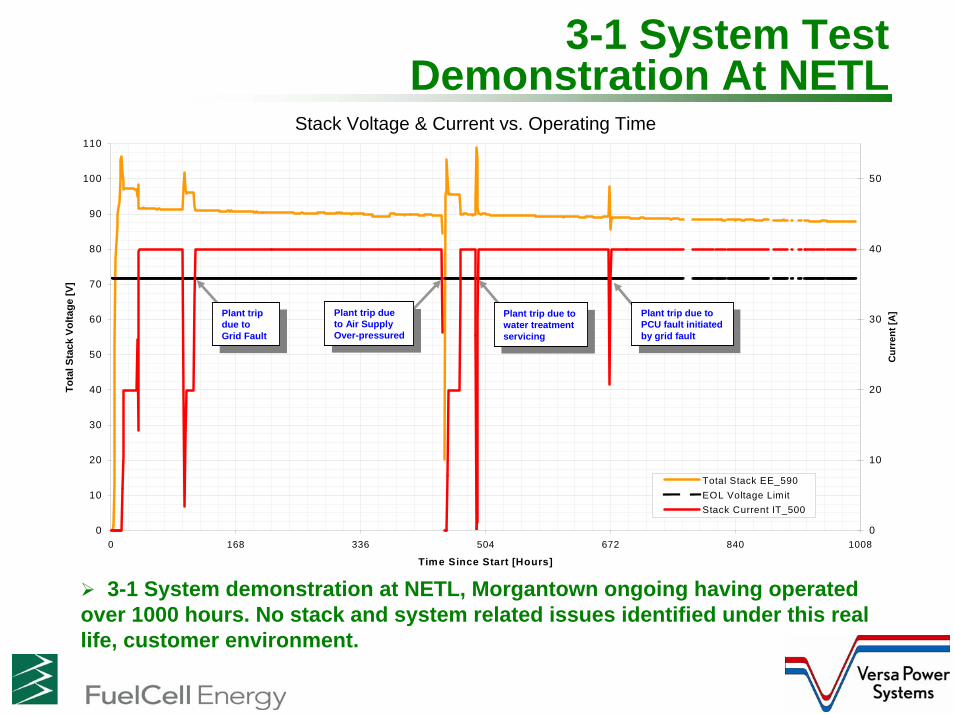
3-1 System Test Demonstration At NETL
0
10
20
30
40
50
60
70
80
90
100
110
0 168 336 504 672 840 1008
Time Since Start [Hours]
Tota
l Sta
ck V
olta
ge [V
]
0
10
20
30
40
50
Cur
rent
[A]
Total Stack EE_590EOL Voltage LimitStack Current IT_500
Plant trip due to Grid Fault
Plant trip due to Grid Fault
Plant trip due to Air SupplyOver-pressured
Plant trip due to Air SupplyOver-pressured
Plant trip due to water treatment servicing
Plant trip due to water treatment servicing
Plant trip due to PCU fault initiated by grid fault
Plant trip due to PCU fault initiated by grid fault
3-1 System demonstration at NETL, Morgantown ongoing having operated over 1000 hours. No stack and system related issues identified under this real life, customer environment.
Stack Voltage & Current vs. Operating Time
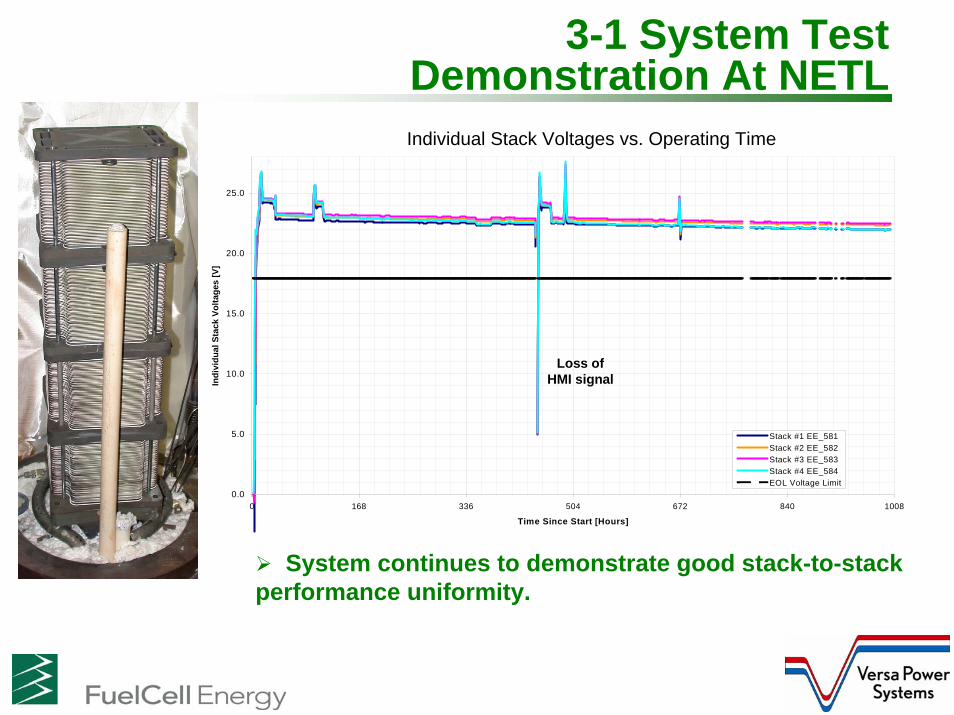
3-1 System Test Demonstration At NETLIndividual Stack Voltages vs. Operating Time
System continues to demonstrate good stack-to-stack performance uniformity.
0.0
5.0
10.0
15.0
20.0
25.0
0 168 336 504 672 840 1008
Time Since Start [Hours]
Indi
vidu
al S
tack
Vol
tage
s [V
]
Stack #1 EE_581Stack #2 EE_582Stack #3 EE_583Stack #4 EE_584EOL Voltage Limit
Loss of HMI signal
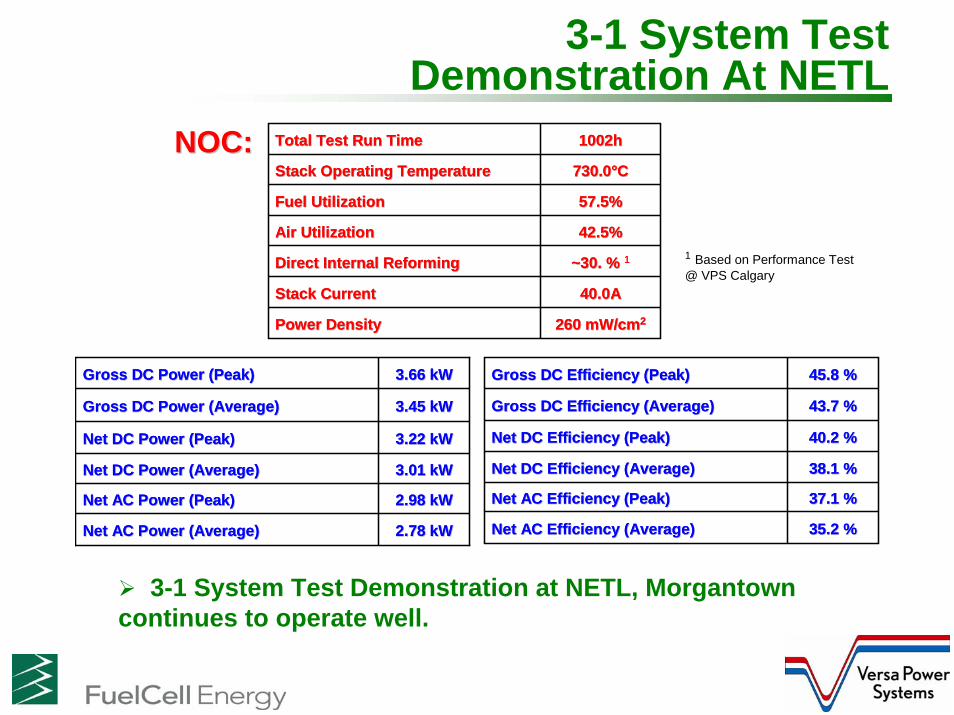
3-1 System Test Demonstration At NETL
1002h1002hTotal Test Run TimeTotal Test Run Time
40.0A40.0AStack CurrentStack Current
~30. % ~30. % 1Direct Internal ReformingDirect Internal Reforming
730.0730.0°°CCStack Operating TemperatureStack Operating Temperature
260 mW/cm260 mW/cm22Power DensityPower Density
42.5%42.5%Air UtilizationAir Utilization
57.5%57.5%Fuel UtilizationFuel Utilization
3.22 kW3.22 kWNet DC Power (Peak)Net DC Power (Peak)
2.78 kW2.78 kWNet AC Power (Average)Net AC Power (Average)
2.98 kW2.98 kWNet AC Power (Peak)Net AC Power (Peak)
3.45 kW3.45 kWGross DC Power (Average)Gross DC Power (Average)
3.01 kW3.01 kWNet DC Power (Average)Net DC Power (Average)
3.66 kW3.66 kWGross DC Power (Peak)Gross DC Power (Peak)
40.2 %40.2 %Net DC Efficiency (Peak)Net DC Efficiency (Peak)
35.2 %35.2 %Net AC Efficiency (Average)Net AC Efficiency (Average)
37.1 %37.1 %Net AC Efficiency (Peak)Net AC Efficiency (Peak)
43.7 %43.7 %Gross DC Efficiency (Average)Gross DC Efficiency (Average)
38.1 %38.1 %Net DC Efficiency (Average)Net DC Efficiency (Average)
45.8 %45.8 %Gross DC Efficiency (Peak)Gross DC Efficiency (Peak)
NOC:NOC:
1 Based on Performance Test@ VPS Calgary
3-1 System Test Demonstration at NETL, Morgantown continues to operate well.
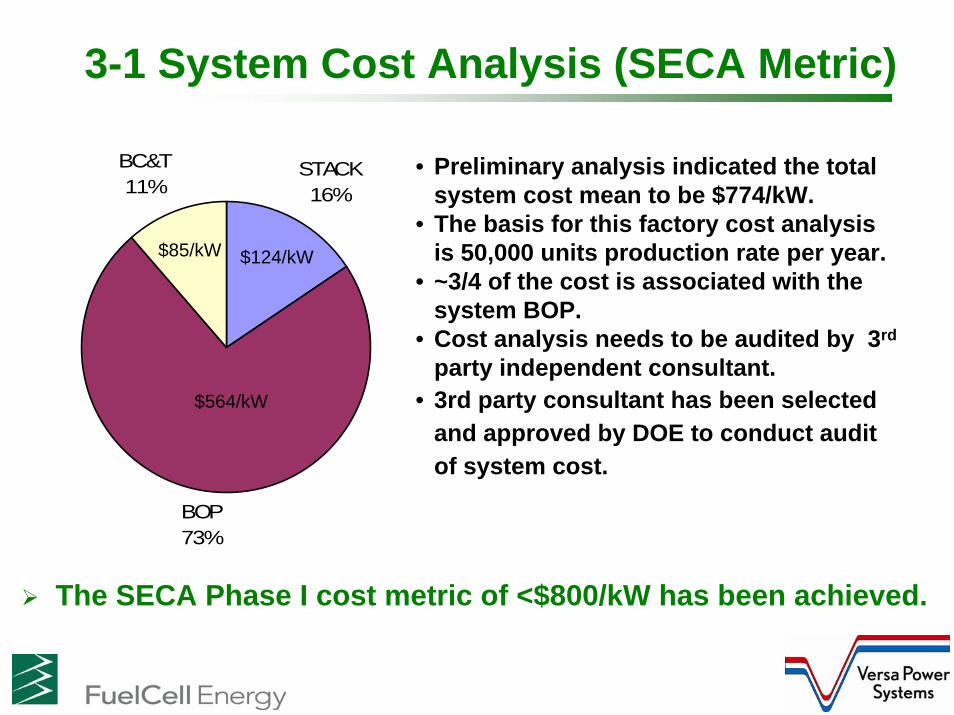
3-1 System Cost Analysis (SECA Metric)
STACK16%
BOP73%
BC&T11%
$564/kW
$124/kW$85/kW
• Preliminary analysis indicated the total system cost mean to be $774/kW.
• The basis for this factory cost analysis is 50,000 units production rate per year.
• ~3/4 of the cost is associated with the system BOP.
• Cost analysis needs to be audited by 3rd
party independent consultant.• 3rd party consultant has been selected
and approved by DOE to conduct audit of system cost.
The SECA Phase I cost metric of <$800/kW has been achieved.
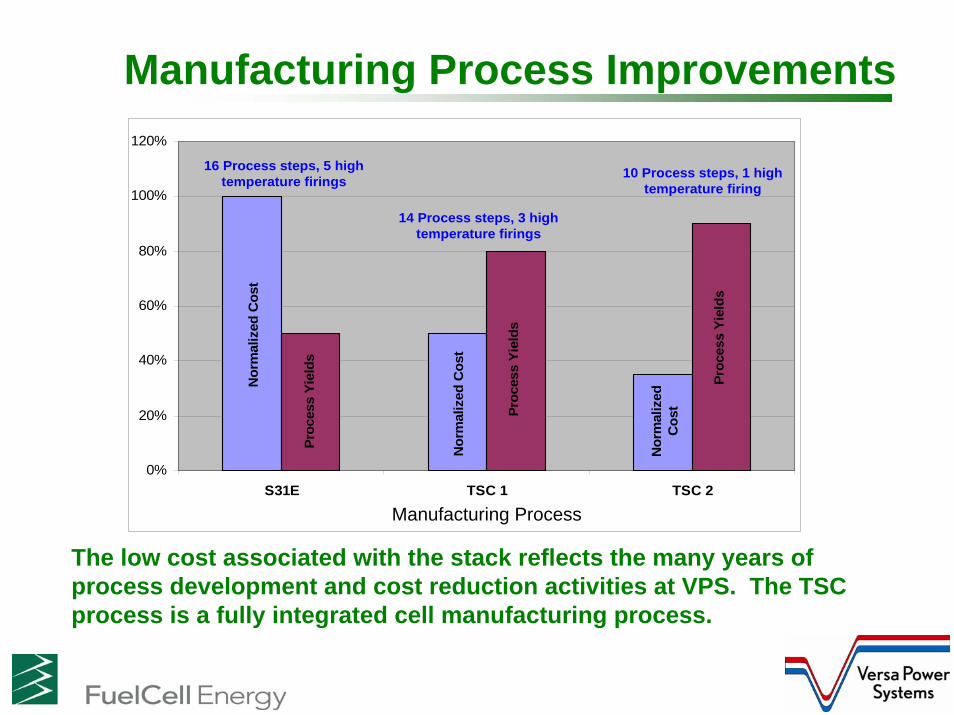
Manufacturing Process Improvements
The low cost associated with the stack reflects the many years of process development and cost reduction activities at VPS. The TSC process is a fully integrated cell manufacturing process.
0%
20%
40%
60%
80%
100%
120%
S31E TSC 1 TSC 2
16 Process steps, 5 high temperature firings
14 Process steps, 3 high temperature firings
10 Process steps, 1 high temperature firing
Nor
mal
ized
Cos
t
Nor
mal
ized
Cos
t
Nor
mal
ized
C
ost
Proc
ess
Yiel
ds
Proc
ess
Yiel
ds
Proc
ess
Yiel
ds
Manufacturing Process
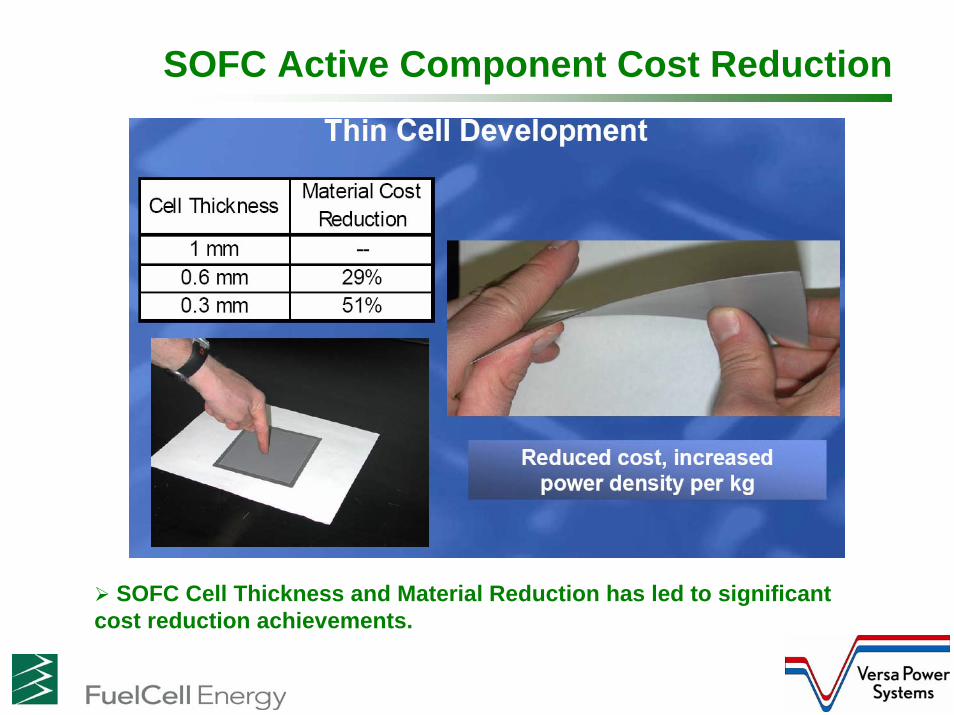
SOFC Active Component Cost Reduction
SOFC Cell Thickness and Material Reduction has led to significant cost reduction achievements.
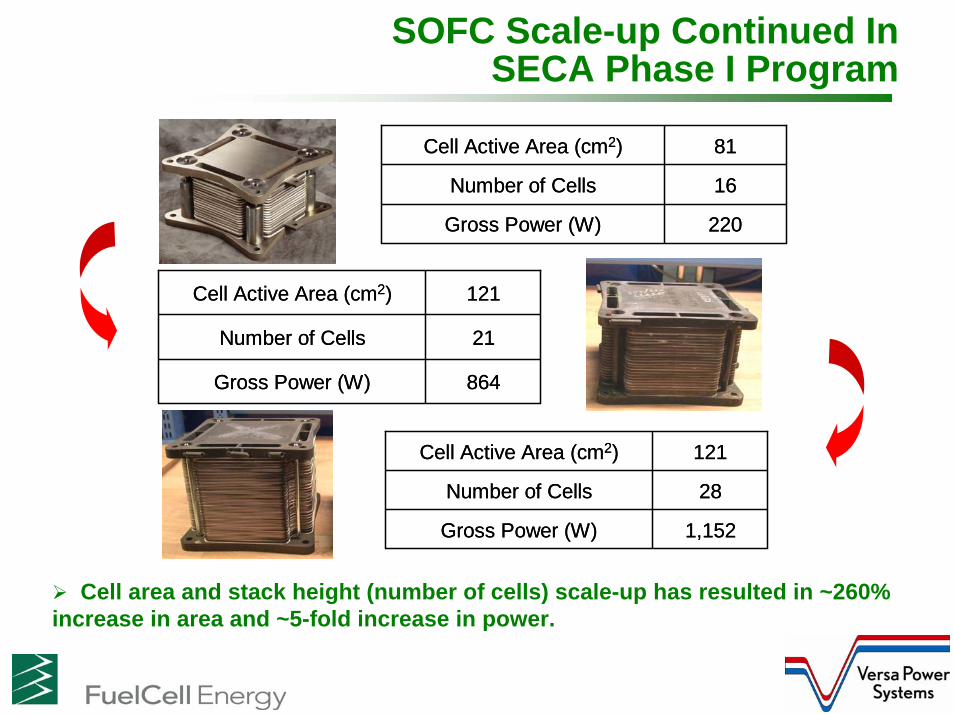
SOFC Scale-up Continued In SECA Phase I Program
220Gross Power (W)
16Number of Cells
81Cell Active Area (cm2)
220Gross Power (W)
16Number of Cells
81Cell Active Area (cm2)
864Gross Power (W)
21Number of Cells
121Cell Active Area (cm2)
864Gross Power (W)
21Number of Cells
121Cell Active Area (cm2)
1,152Gross Power (W)
28Number of Cells
121Cell Active Area (cm2)
1,152Gross Power (W)
28Number of Cells
121Cell Active Area (cm2)
Cell area and stack height (number of cells) scale-up has resulted in ~260% increase in area and ~5-fold increase in power.
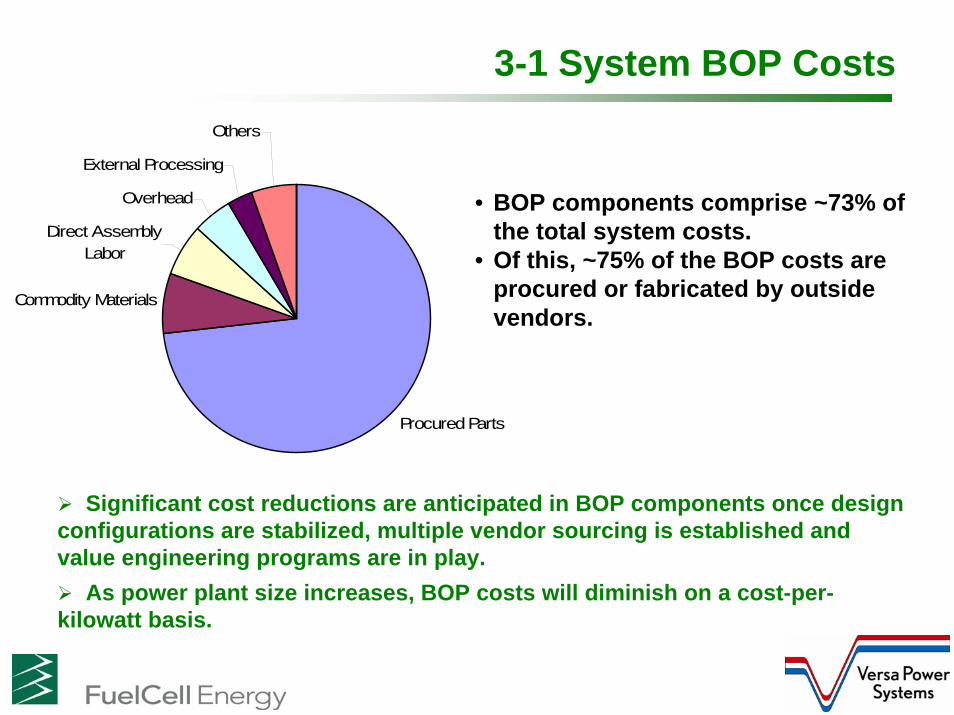
3-1 System BOP Costs
Procured Parts
Commodity Materials
Direct Assembly Labor
Overhead
External Processing
Others
• BOP components comprise ~73% of the total system costs.
• Of this, ~75% of the BOP costs are procured or fabricated by outside vendors.
Significant cost reductions are anticipated in BOP components once design configurations are stabilized, multiple vendor sourcing is established and value engineering programs are in play.
As power plant size increases, BOP costs will diminish on a cost-per-kilowatt basis.
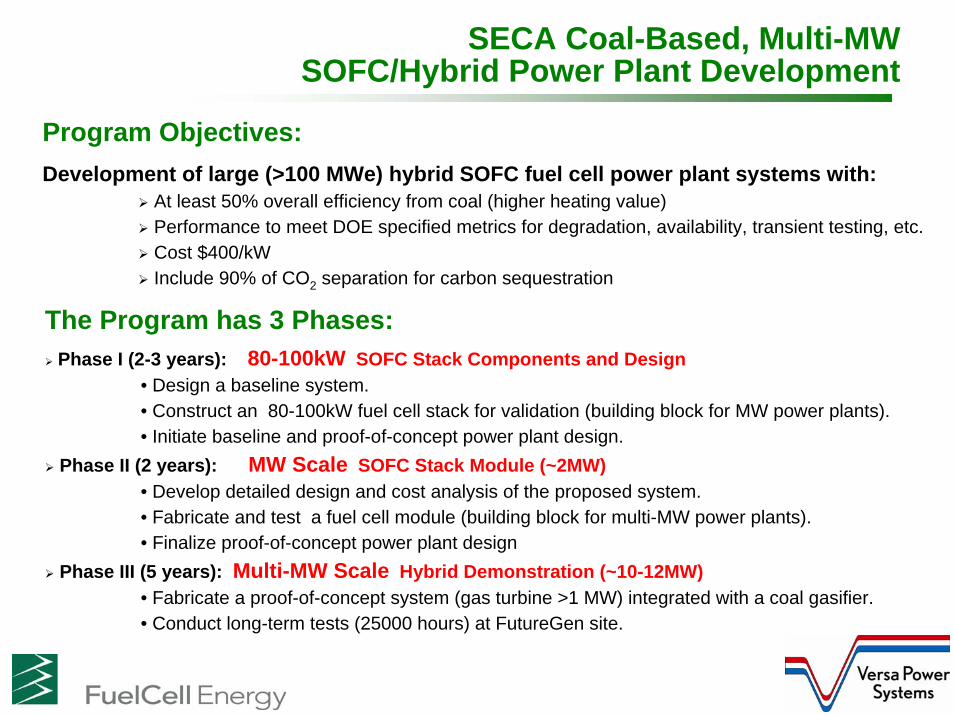
SECA Coal-Based, Multi-MW SOFC/Hybrid Power Plant Development
Program Objectives:Development of large (>100 MWe) hybrid SOFC fuel cell power plant systems with:
At least 50% overall efficiency from coal (higher heating value) Performance to meet DOE specified metrics for degradation, availability, transient testing, etc.Cost $400/kW Include 90% of CO2 separation for carbon sequestration
The Program has 3 Phases:Phase I (2-3 years): 80-100kW SOFC Stack Components and Design
• Design a baseline system. • Construct an 80-100kW fuel cell stack for validation (building block for MW power plants). • Initiate baseline and proof-of-concept power plant design.
Phase II (2 years): MW Scale SOFC Stack Module (~2MW)• Develop detailed design and cost analysis of the proposed system.• Fabricate and test a fuel cell module (building block for multi-MW power plants).• Finalize proof-of-concept power plant design
Phase III (5 years): Multi-MW Scale Hybrid Demonstration (~10-12MW)• Fabricate a proof-of-concept system (gas turbine >1 MW) integrated with a coal gasifier.• Conduct long-term tests (25000 hours) at FutureGen site.
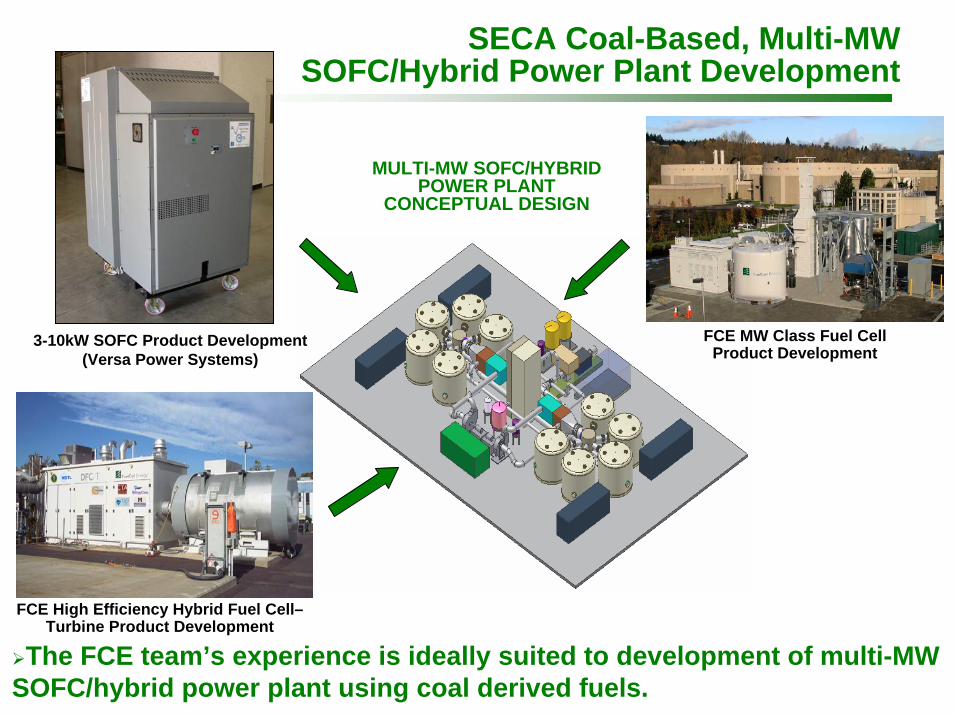
MULTI-MW SOFC/HYBRID POWER PLANT
CONCEPTUAL DESIGN
SECA Coal-Based, Multi-MW SOFC/Hybrid Power Plant Development
The FCE team’s experience is ideally suited to development of multi-MW SOFC/hybrid power plant using coal derived fuels.
FCE High Efficiency Hybrid Fuel Cell–Turbine Product Development
FCE MW Class Fuel Cell Product Development
3-10kW SOFC Product Development (Versa Power Systems)
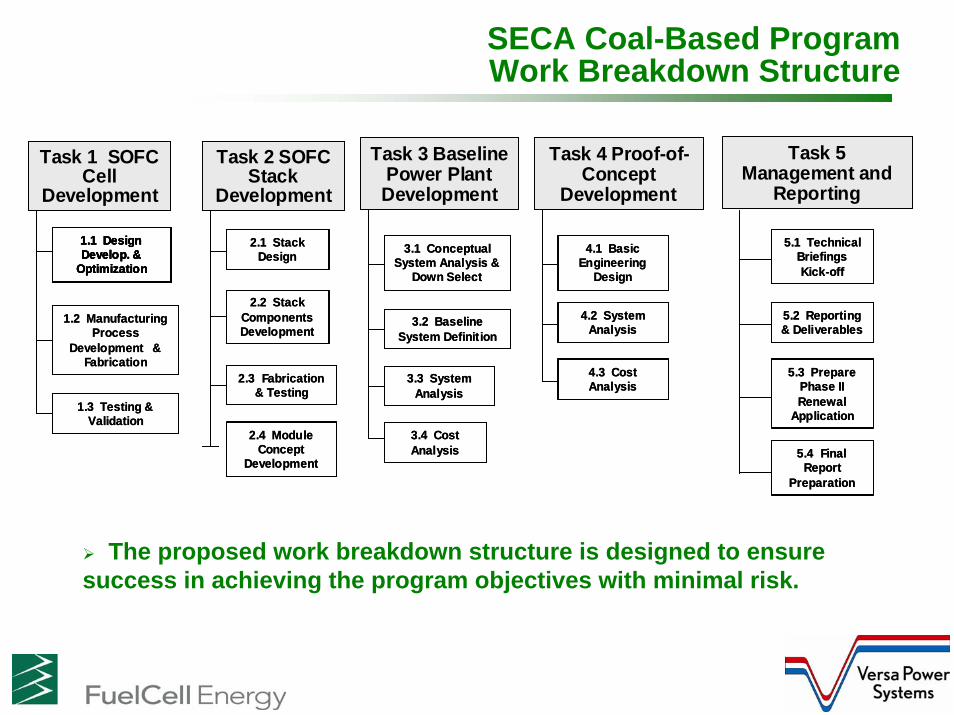
SECA Coal-Based Program Work Breakdown Structure
Task 5 Management and
Reporting
Task 4 Proof-of-Concept
Development
Task 3 Baseline Power Plant Development
1.1 Design Develop. &
Optimization
1.2 Manufacturing Process
Development & Fabrication
1.3 Testing & Validation
2.1 Stack Design
1.1 Design Develop. &
Optimization
2.2 Stack Components Development
2.3 Fabrication & Testing
2.4 Module Concept
Development
3.1 Conceptual System Analysis &
Down Select
3.2 Baseline System Definition
3.3 System Analysis
3.4 Cost Analysis
4.1 Basic Engineering
Design
4.2 System Analysis
4.3 Cost Analysis
5.1 Technical Briefings Kick-off
5.2 Reporting & Deliverables
5.3 Prepare Phase II Renewal
Application
5.4 Final Report
Preparation
Task 2 SOFC Stack
Development
Task 1 SOFC Cell
Development
The proposed work breakdown structure is designed to ensure success in achieving the program objectives with minimal risk.
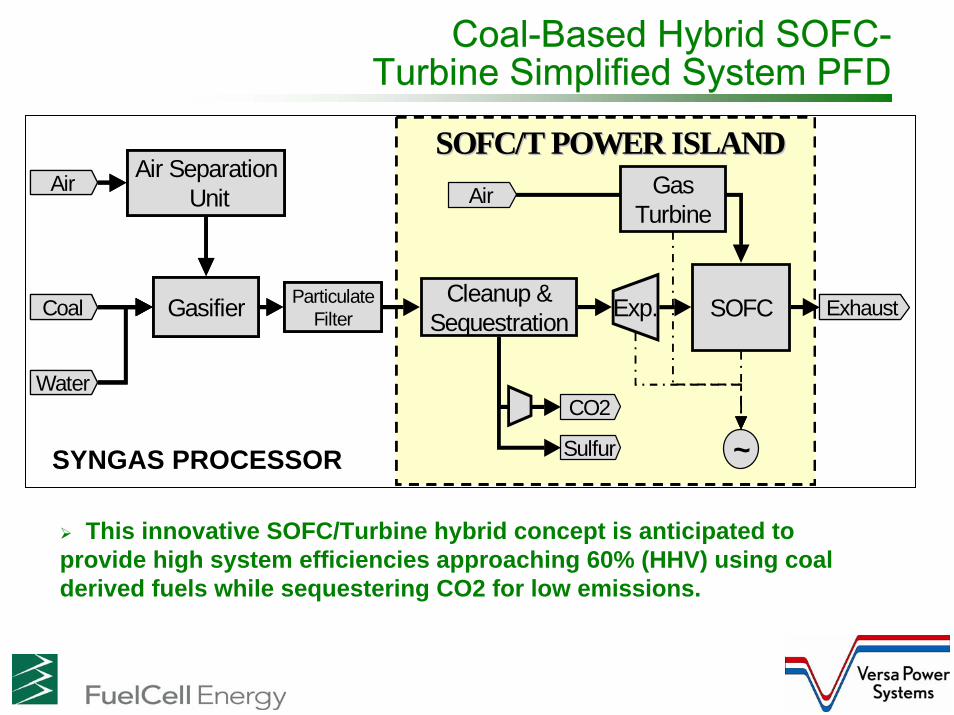
Coal-Based Hybrid SOFC-Turbine Simplified System PFD
~
Gasifier ParticulateFilter
Cleanup &Sequestration Exp. SOFC ExhaustCoal
CO2
Sulfur
Water
Air AirAir Separation
Unit
SOFC/T POWER ISLANDSOFC/T POWER ISLANDGas
Turbine
~
Gasifier ParticulateFilter
Cleanup &Sequestration Exp. SOFC ExhaustCoal
CO2
Sulfur
Water
Air AirAir Separation
Unit
SOFC/T POWER ISLANDSOFC/T POWER ISLANDGas
Turbine
SYNGAS PROCESSOR
This innovative SOFC/Turbine hybrid concept is anticipated to provide high system efficiencies approaching 60% (HHV) using coal derived fuels while sequestering CO2 for low emissions.
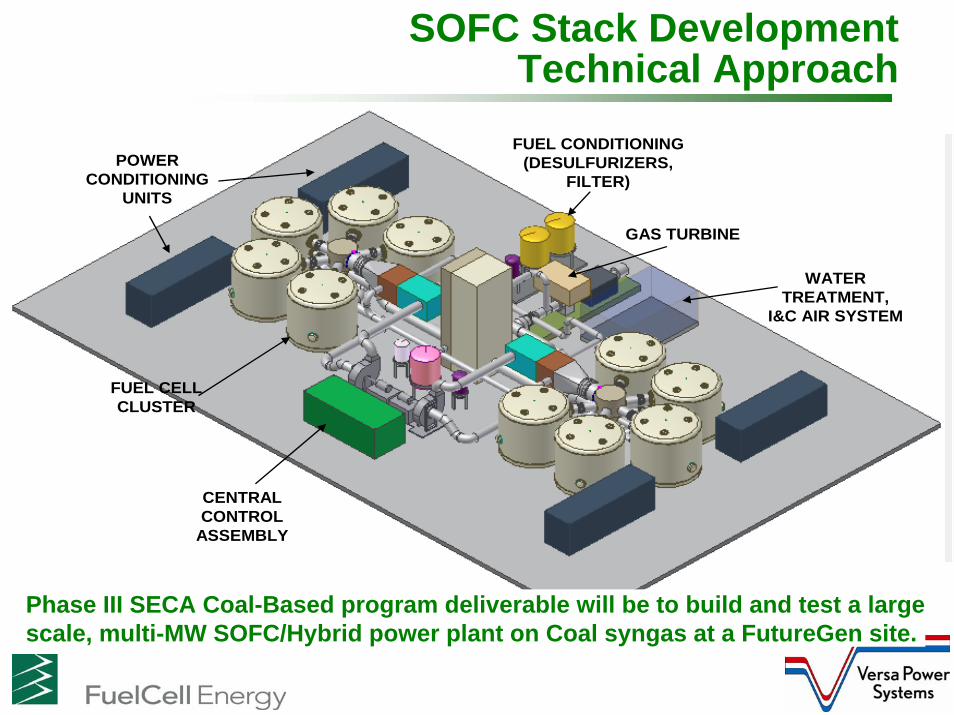
SOFC Stack Development Technical Approach
Phase I Coal Based Program
• Cell and stack scale-up to 100kW size• Performance Improvement• Manufacturing Process Enhancement• Cost Reduction
Phase I 3-10kW Program
• Cell and stack scale-up to 3-10kW size• Performance Improvement• Manufacturing Process Enhancement• Cost reduction
Phase II Coal Based Program
• MW Module Development• Performance Improvement• Cost Reduction
Phase III Coal Based Program
• Multi-MW Module Development
POWER CONDITIONING
UNITS
CENTRAL CONTROL
ASSEMBLY
FUEL CELL CLUSTER
WATER TREATMENT,
I&C AIR SYSTEM
GAS TURBINE
FUEL CONDITIONING (DESULFURIZERS,
FILTER)
Phase III SECA Coal-Based program deliverable will be to build and test a large scale, multi-MW SOFC/Hybrid power plant on Coal syngas at a FutureGen site.
Acknowledgements
The support and guidance provided by the Department of Energy is acknowledged and gratefully appreciated by the FCE team, most notably Travis Shultz, Magda Rivera, Don Collins and Wayne Surdoval.


