Environment and Conservation Division, with assistance of Climate Change Study Team Ministry of Environment, Lands and Agricultural Development KIRIBATI GOVERNMENT Second Communication under the United Nations Framework Convention on Climate Change June 2013
Transcript
Environment and Conservation Division, with assistance of Climate Change Study Team
Ministry of Environment, Lands and Agricultural Development
KIRIBATI GOVERNMENT
Second Communication under theUnited Nations Framework Convention on
Climate Change
June 2013
2
Preface
In 1999 through the initial communication report, Kiribati underscored the grave concerns
faced by climate change. The Government of Kiribati is thankful for some initial reactions
from the international community responding to these concerns with few adaptation projects.
These efforts are not adequate in so far!
In this second report the same premises upon which Kiribati underlined the concerns in the
initial communication report have not been changed but rather intensified and complex over
time as observed in the last 10 years. The status of national circumstances, measures
undertaken, including constraints toward meeting our obligation under the UNFCCC are all
explicitly detailed in this report. This is also in recognition of the fact that Kiribati, as a Least
Developed Country, can do very little to prevent the damages and impacts it is now facing.
This also demonstrates our trust in the UNFCCC which is the only multilateral fora
responsible for avoiding dangerous climate change impacts and enhances environmental
integrity.
The Government and people of Kiribati have been and will continue to be mentally,
physically worried and apprehensive by risks brought in by climate change, extreme events,
slow onset events and sea level rise in the near and longer term future.
On that note, I would like to express my sincere appreciation to those who have contributed
to this significant Second communication report by Kiribati to the UNFCCC, and to invite
development partners particularly Developed Country Parties to consider the real issues
highlighted in this report with optimism for their immediate support in the less distant future.
”... we must listen, take heed of whatis happening in the most vulnerablestates in the frontline, like Kiribati
and act accordingly, act withurgency... ”
3
Tekeraoi!
Hon. Tiarite Kwong
Minister of Environment, Lands and Agricultural Development.
Date: 27th June 2013
4
Acknowledgement
The successful completion of this report has been made possible through consistent
participation and contributions of members of the National Climate Change Study Team from
the early inception of this Second National Communication project in 2008 toward the end.
The details of the team members can be viewed in the Annex of this report.
The content of the report owed credits to outcomes of several nationally and internationally
driven projects and programs that have occurred from 2000. The undertakings produced
some of the most up to date data and information that were employed to inform this report as
well as practical measures to responding to climate change.
It would be a remiss not to mention consultancy based firms and organisations that have been
contracted to fill in the information and capacity gaps relevant to specific components of the
SNC report. This includes Pitt&Sherry from Australia for substantive work on Greenhouse
Gas Inventory Calculation and Clim-systems from New Zealand for the substantial provision
of, and training on, the vulnerability assessment tool.
The technical comments were received from National Communication Support Programme
(NCSP) – UNDP, Climate Change Division of the Secretariat for Pacific Regional
Environment Program (SPREP), Secretariat for Pacific Community (SPC), Pacific Australia
Climate Change Science & Adaptation Planning Program (PACCSAP) and National Institute
for Water and Atmospheric Research (NIWA). These comments have been extremely useful
toward shaping the final structure of the report.
Last but not least, is to acknowledge other local consultants like Ben Namakin, local
stakeholders, functional government’s committees such as National Adaptation Steering
Committee, Secretaries’ level meeting; and finally Cabinet for appreciation and approval of
this Kiribati’s national communication report to the United National Convention of Climate
Change herein.
5
Acronyms
ADB Asian Development Bank
BNPL Basic Need Poverty Line
COP Conference of the Parties
CCU Climate Change Unit
CCST Climate Change Study Team
CRP Climate Risk Profile
CSIRO Australian Commonwealth Scientific and Industrial Research Organisation
CGCCM Canada Global Climate Change Model
CCDMS Climate Change Database Management System
CDM Clean Development Mechanism
DSI Drought Severity Index
DCC Development Coordinating Committee
EbA Ecosystem-Based Adaptation
ECD Environment and Conservation Division
EDB Equatorial Doldrums’ BeltENSO El Nino and Southern Oscillation Oscillation
EPU Energy Planning Unit
FPL Food Poverty Line
FAR Fourth Assessment Report of the IPCC
FAO Food and Agricultural Organisation
EIA Environment Impact Assessment
GHG Green House Gas
GDP Global Domestic Product
GCM Global Circulation Models
GEF Global Environment Facility
GFOL Goddard Fluid Dynamics Laboratory
HFC Hydro-fluoro Carbons
IPCC Inter-governmental Panel on Climate Change
IMR Infant Mortality Rate
INC Initial National Communication
ISME International Society for Mangrove Ecosystems
1.2 PROCESS AND METHODOLOGY....................................................................................26
1.3 LINKAGES OF SNC TO ENVIRONMENT ACT AND NATIONAL DEVELOPMENTPLAN ..............................................................................................................................................29
2.0 NATIONAL CIRCUMSTANCES ...........................................................................................32
5.0 VULNERABILITY AND ADAPTATION ..............................................................................99
5.1 NATIONAL FRAMEWORKS FOR VULNERABILITY AND ADAPTATIONASSESSMENT.................................................................................................................................99
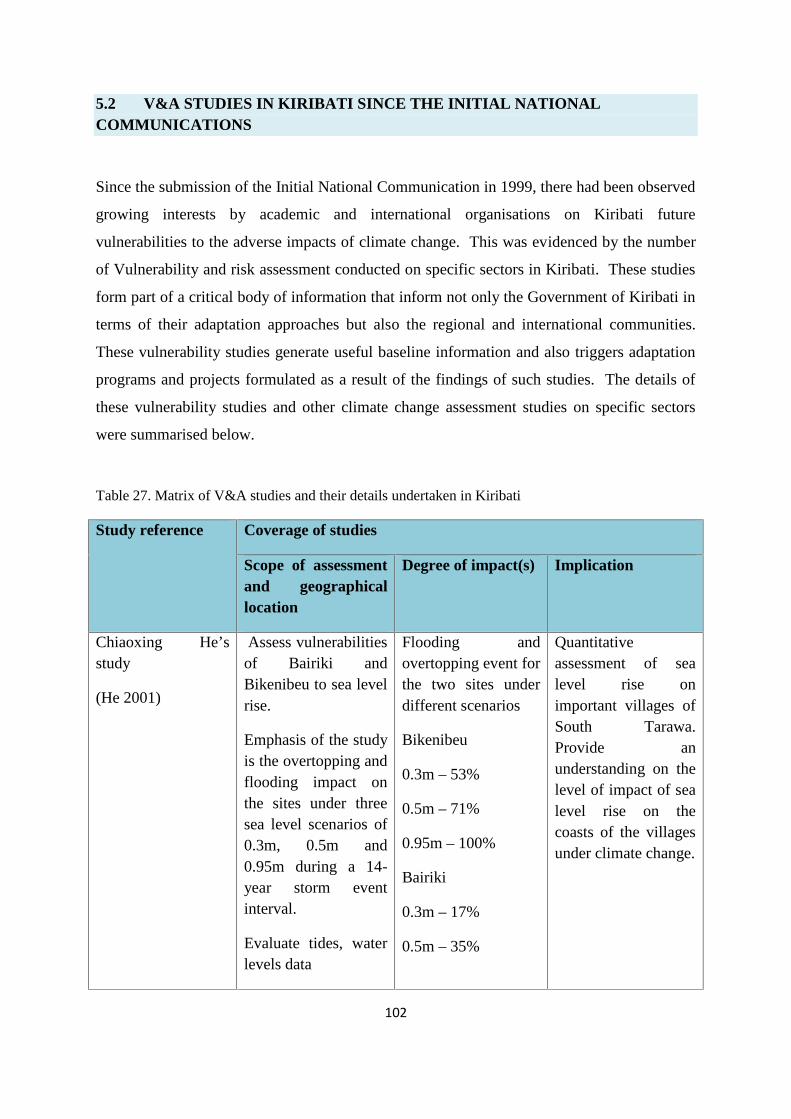
5.2 V&A STUDIES IN KIRIBATI SINCE THE INITIAL NATIONAL COMMUNICATIONS102
5.3 EXISTING CLIMATE CHANGE AND SEA LEVEL RISE SCENARIOS .....................106
5.6 VULNERABILITIES AND IMPACTS OF CLIMATE CHANGE ON KEY ISLANDCOMPONENTS IN KIRIBATI......................................................................................................144
5.7 ADAPTATION OPTIONS AND MAINSTREAMING CLIMATE CHANGEADAPTATION INTO NATIONAL DEVELOPMENT ................................................................164
6.0 CAPACITY BUILDING AND TRAINING ..........................................................................175
7.0 RESEARCH, DATA AND SYSTEMATIC OBERVATION................................................177
8.0 CONSTRAINTS AND GAPS ................................................................................................179
8.1 STATUS OF CONTRAINTS AND GAPS ........................................................................179
8.2 CONSTRAINTS AND GAPS RELEVENAT TO IMPLEMENTING UNFCCC .............181
8.3 CONSTRAINTS AND GAPS RELEVANT TO ARTICLE 6 OF UNFCCC....................185
ANNEX 1. List of the Kiribati Climate Change Study Team and other local stakeholders who havecontributed to the SNC Document ......................................................................................................194
10
List of Tables and Figures
Tables
Table 1: Roles of key institutions in the National Communication process .........................................33
Table 2. Description of island geographical features............................................................................39
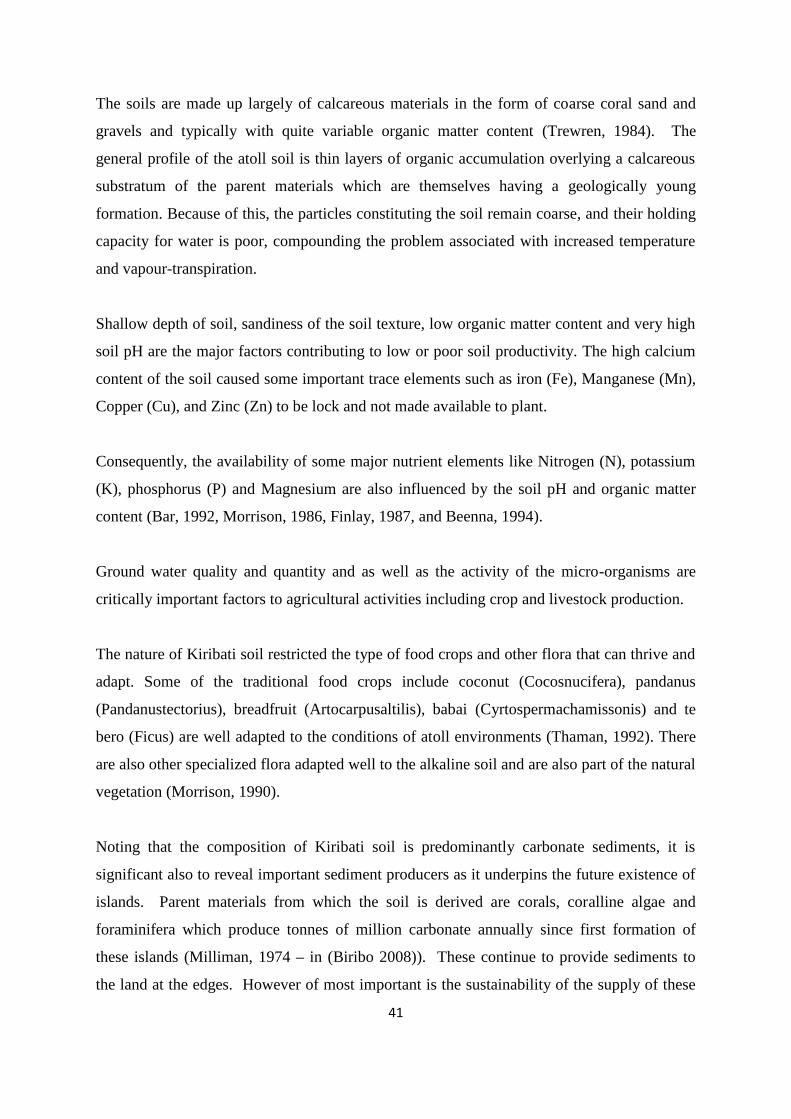
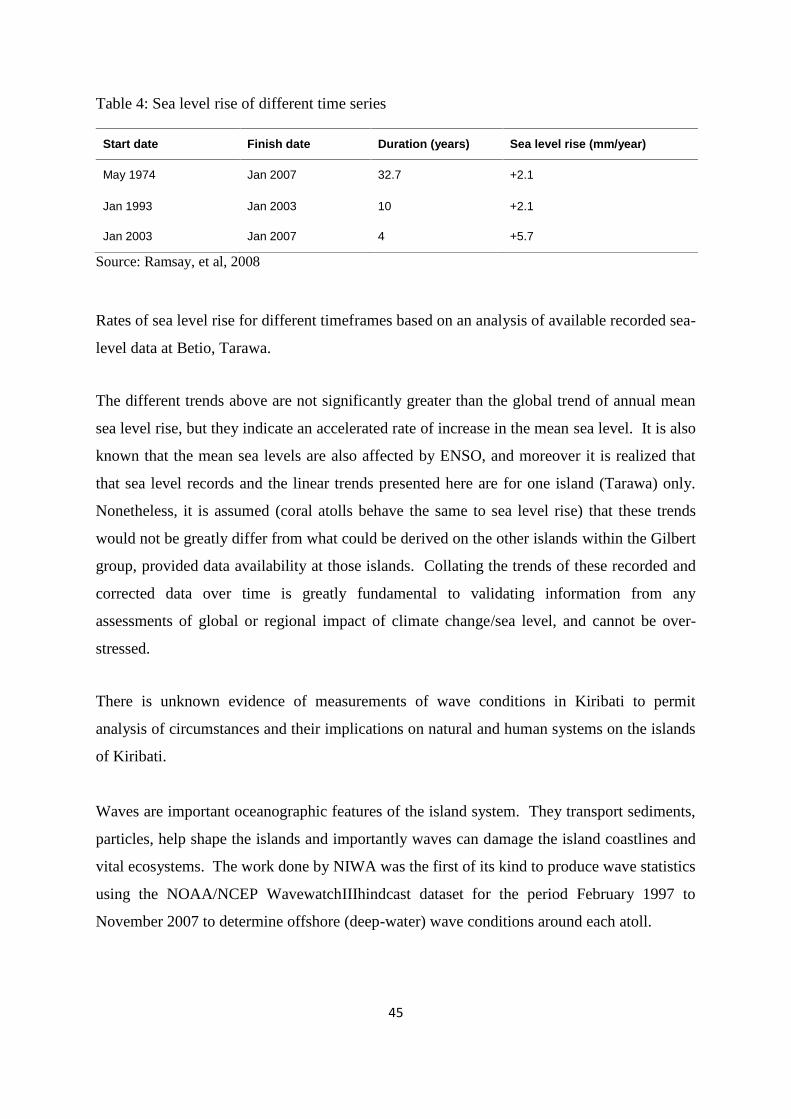
Table 3: Record of sea level from different gauges showing datum shifts ...........................................43
Table 4: Sea level rise of different time series......................................................................................45
Table 5 : Temperature averages ............................................................................................................52
Table 6: Average, maxima, minima of annual rainfall in mm for period 1947-2004...........................55
Table 7: Trends of rainfall on different stations for period 1947-2004 ................................................56
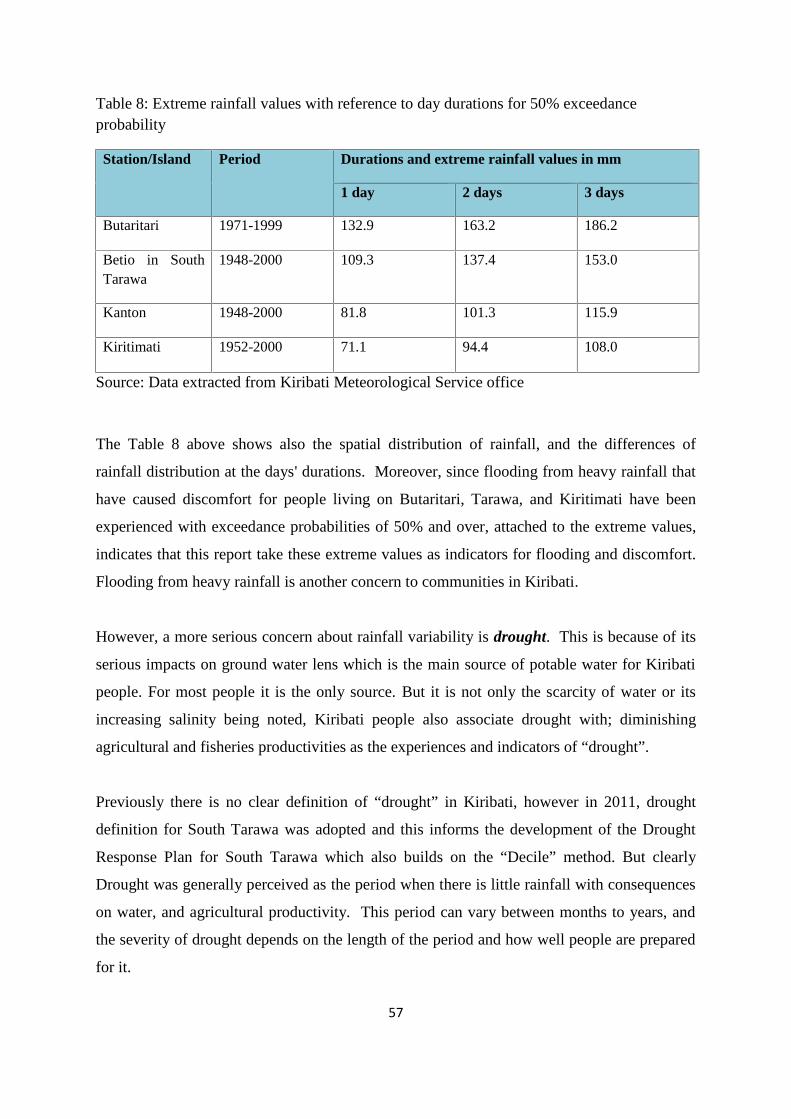
Table 8: Extreme rainfall values with reference to day durations for 50% exceedance probability.....57
Table 9: Annual Return Interval for rainfall .........................................................................................59
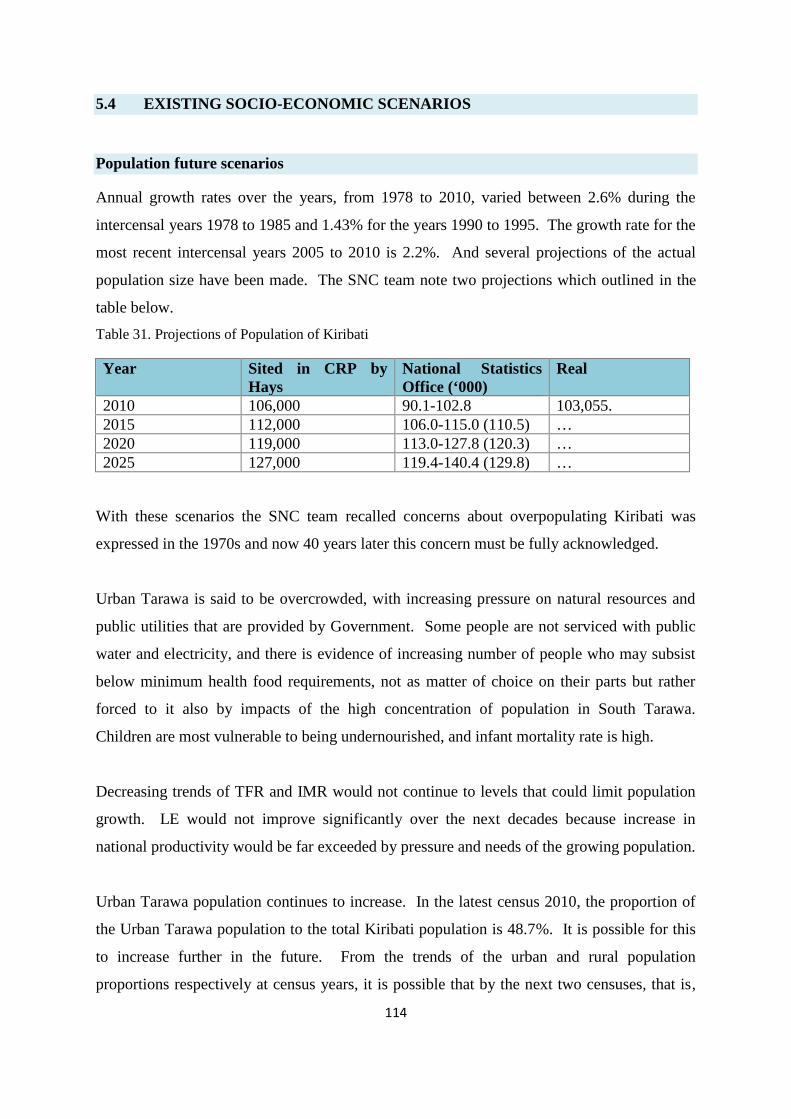
Table 31. Projections of Population of Kiribati ..................................................................................114
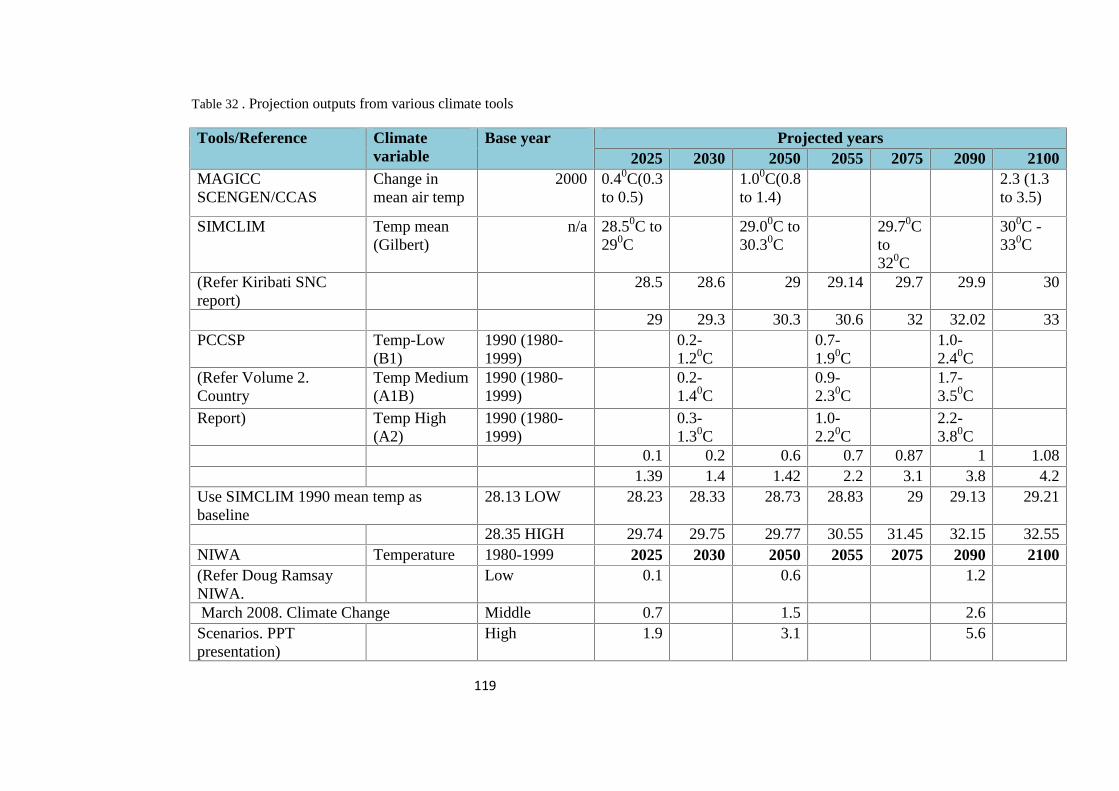
Table 32 . Projection outputs from various climate tools ...................................................................119
Table 33. Results of interpolating projection outputs from various climate tools ..............................121
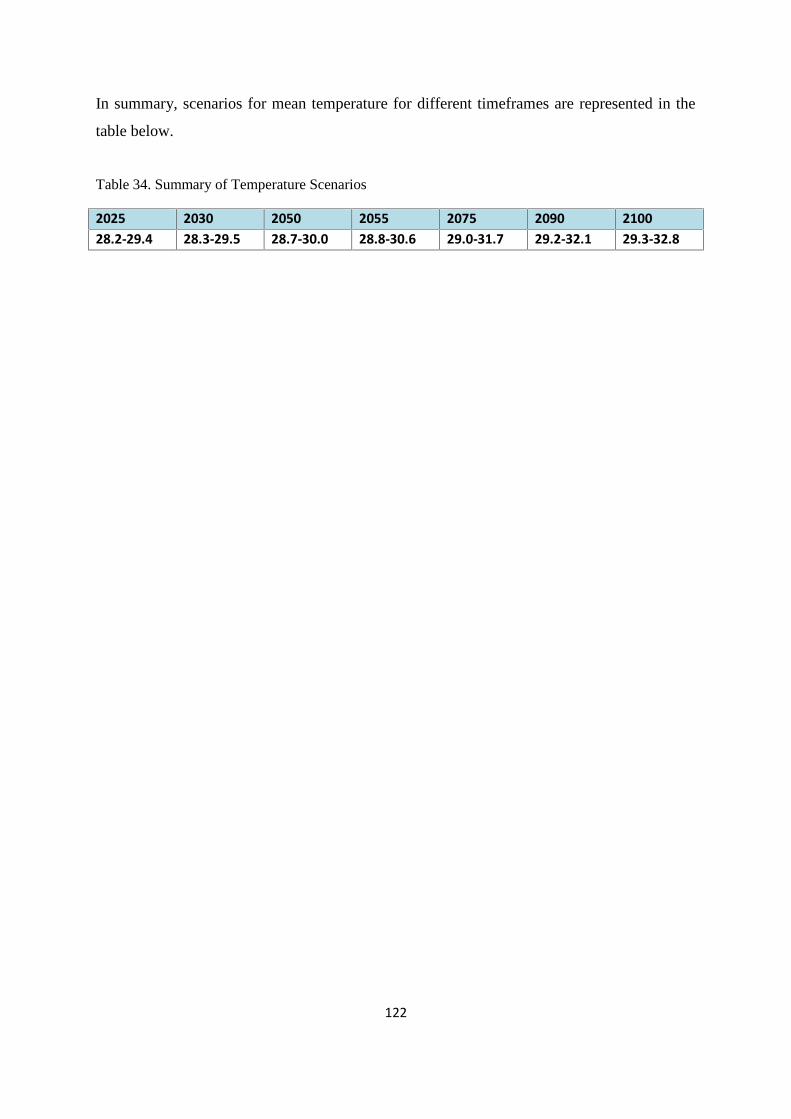
Table 34. Summary of Temperature Scenarios...................................................................................122
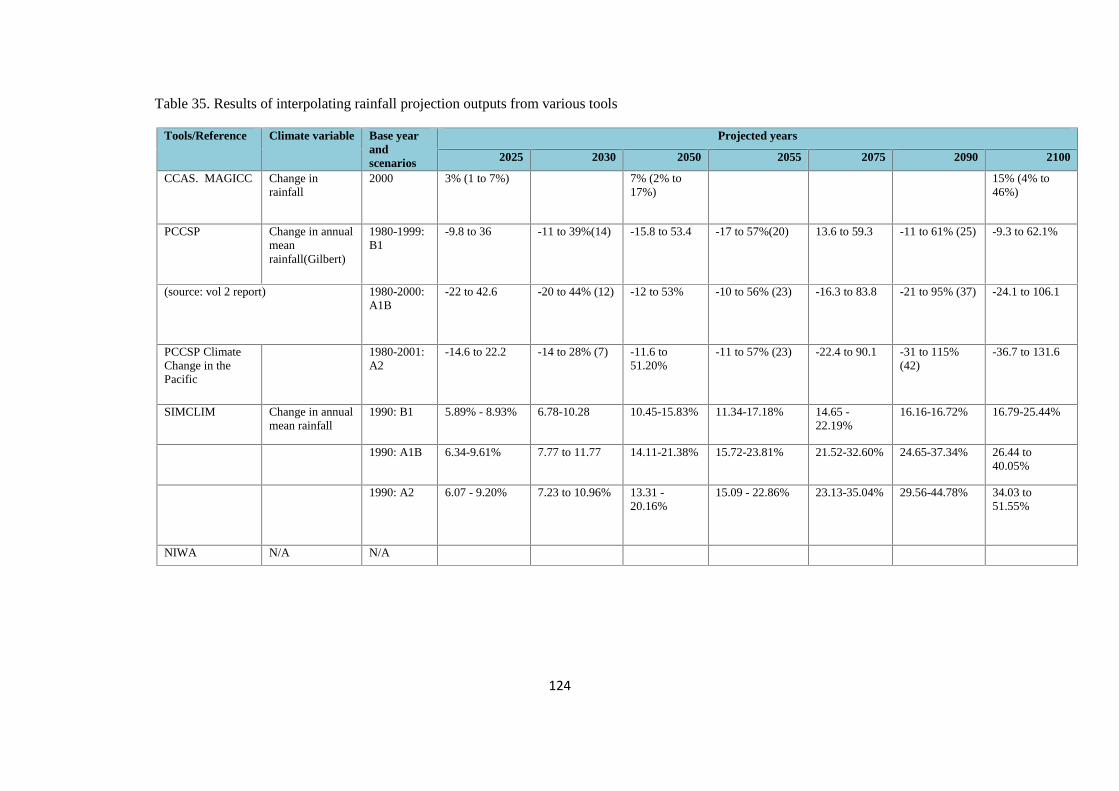
Table 35. Results of interpolating rainfall projection outputs from various tools ..............................124
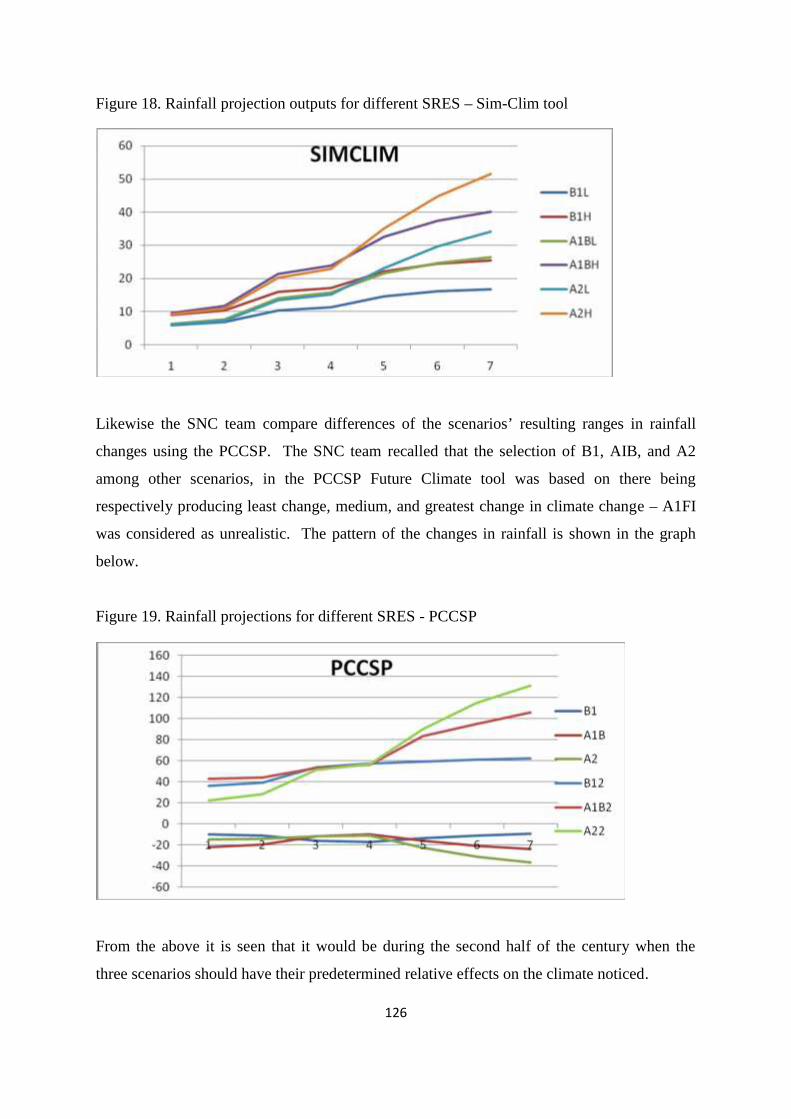
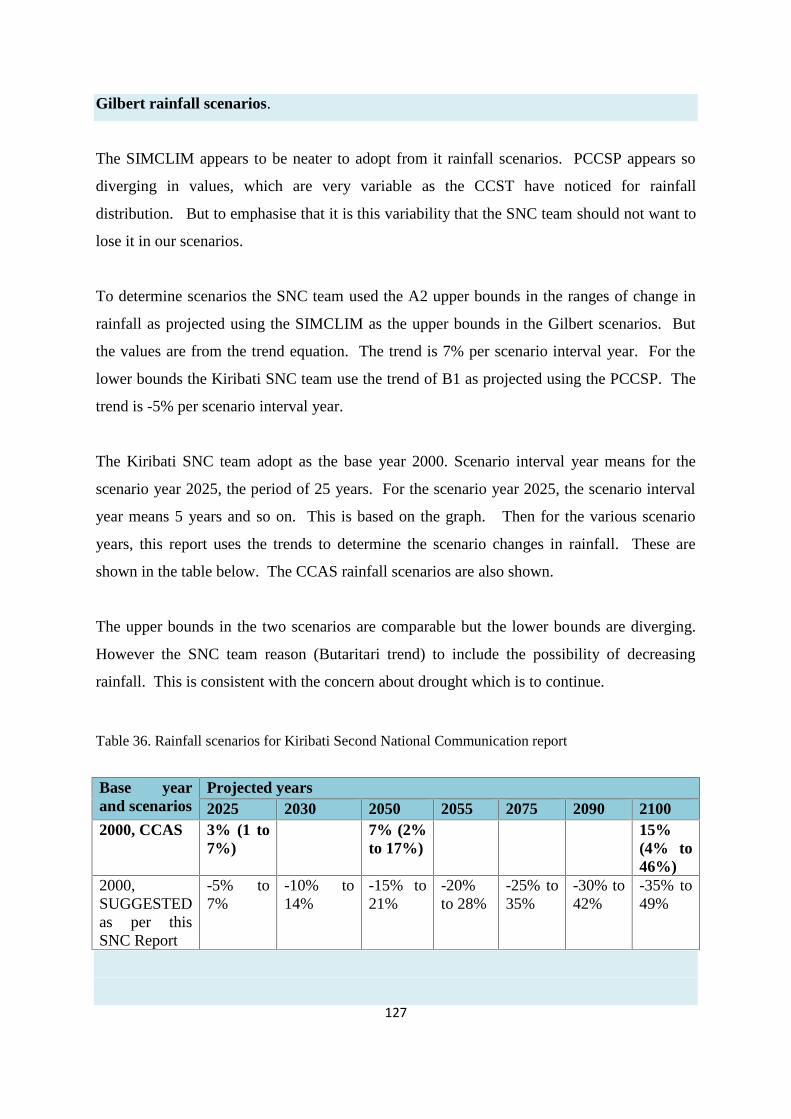
Table 36. Rainfall scenarios for Kiribati Second National Communication report ............................127
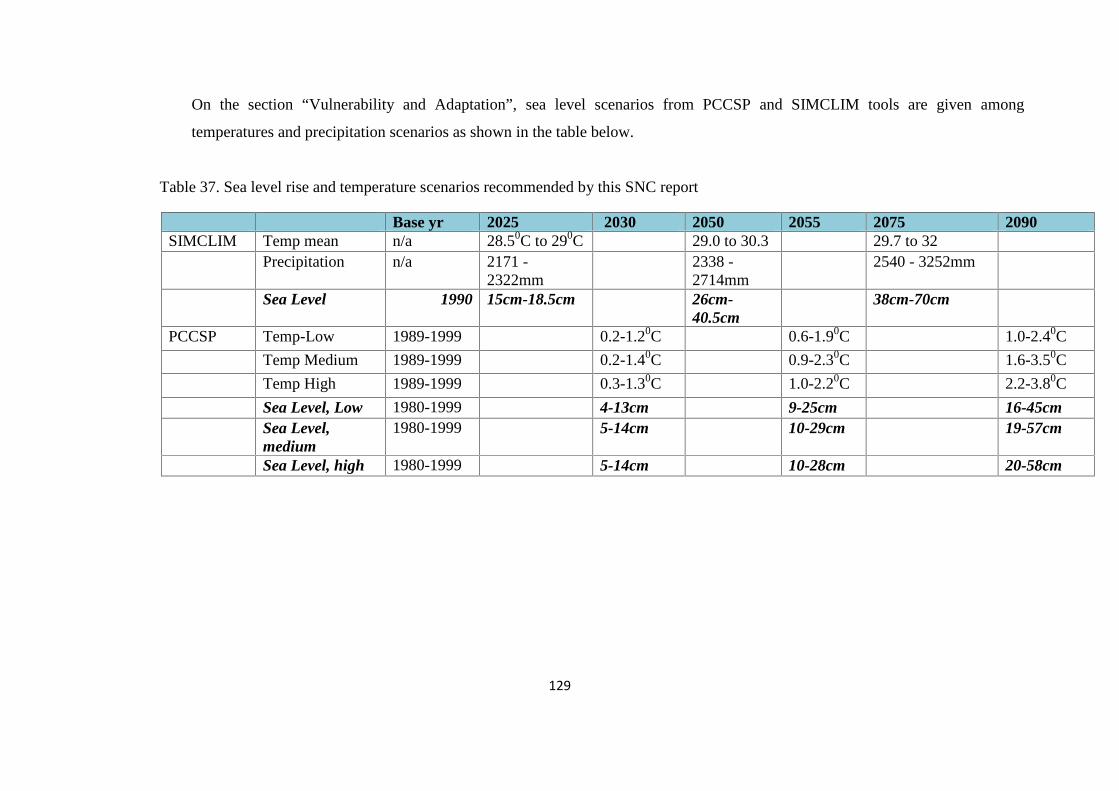
Table 37. Sea level rise and temperature scenarios recommended by this SNC report ......................129
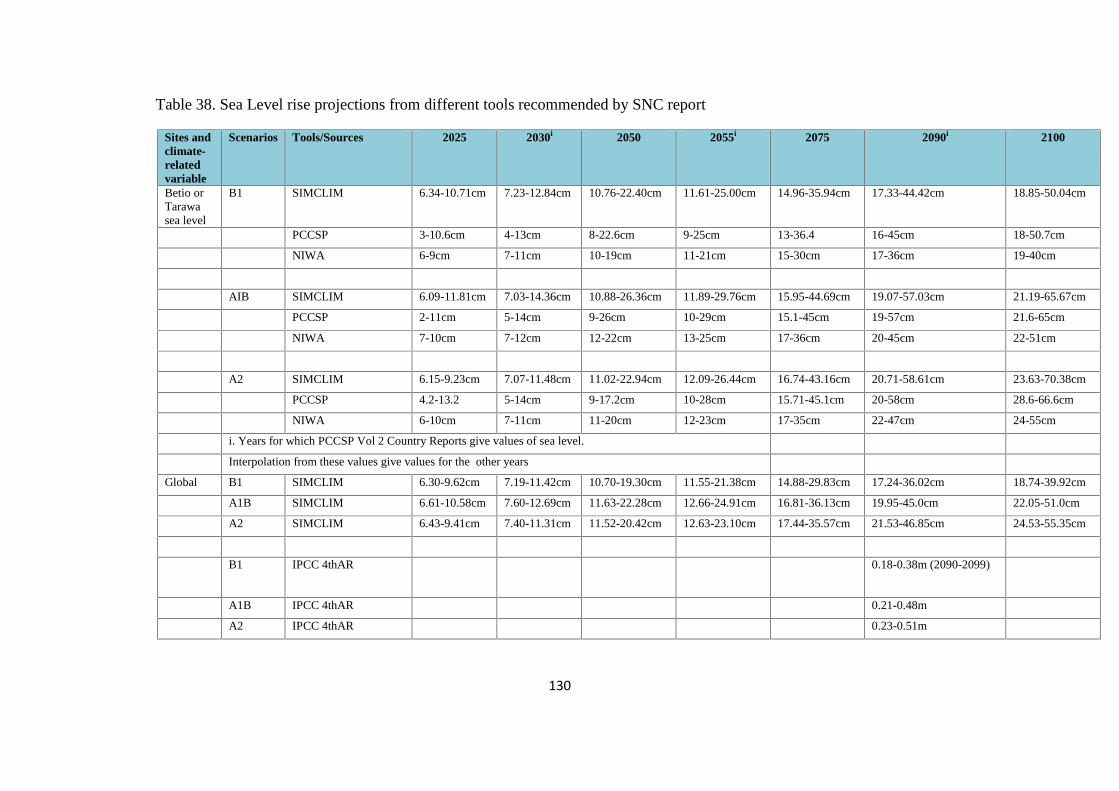
Table 38. Sea Level rise projections from different tools recommended by SNC report ...................130
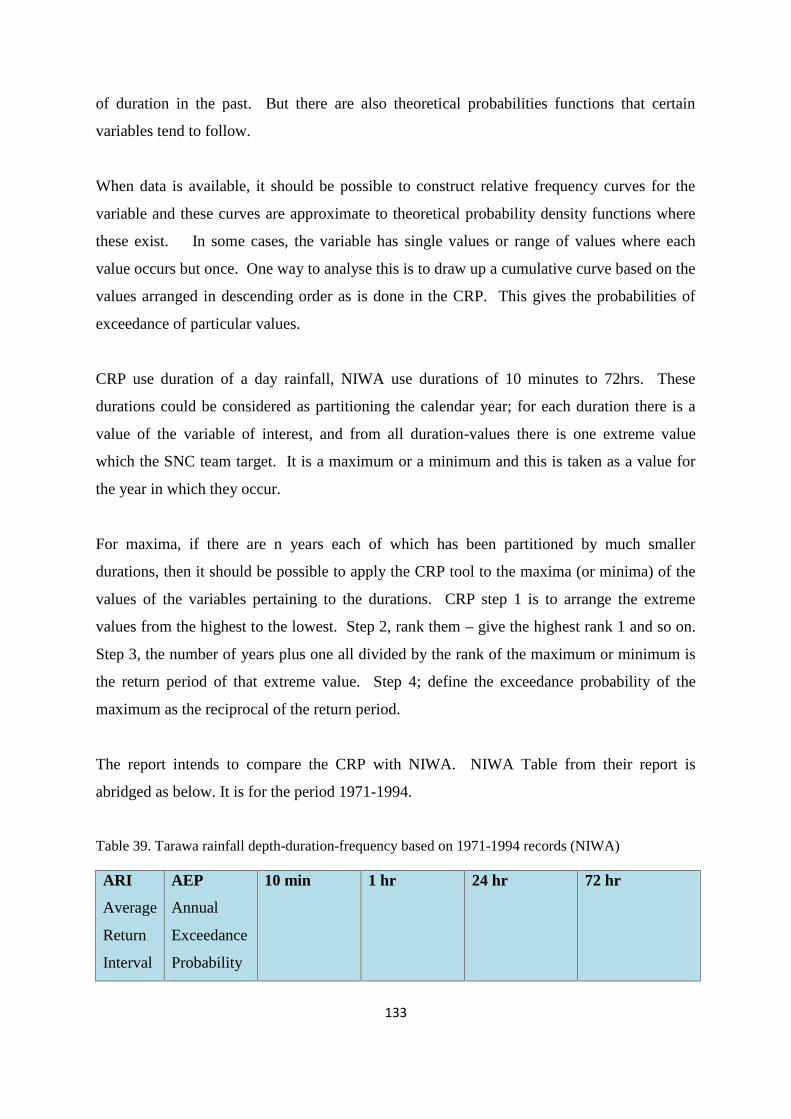
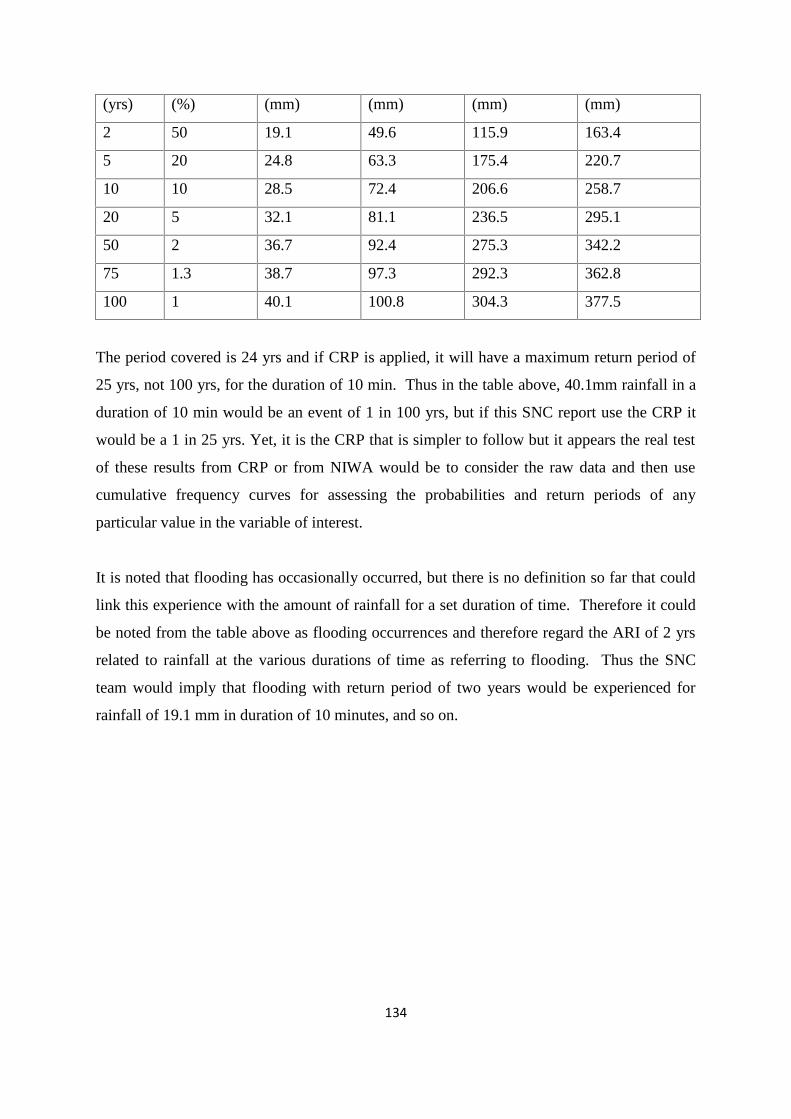
Table 39. Tarawa rainfall depth-duration-frequency based on 1971-1994 records (NIWA)..............133
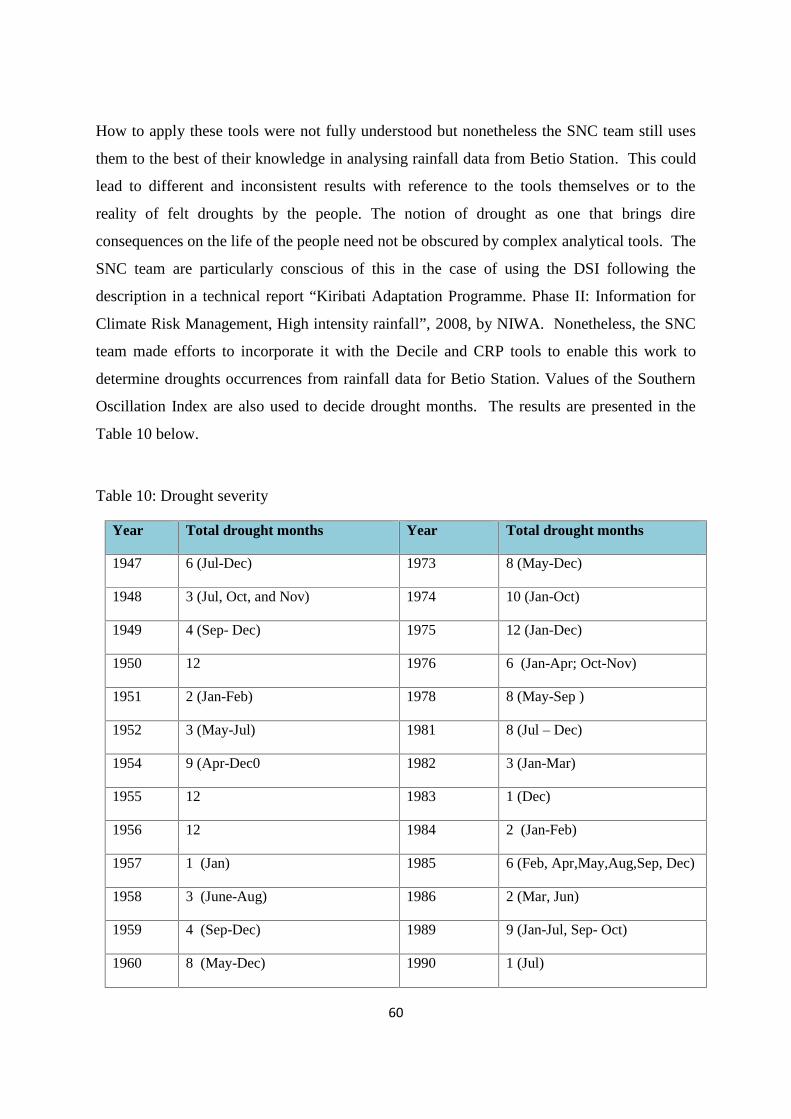
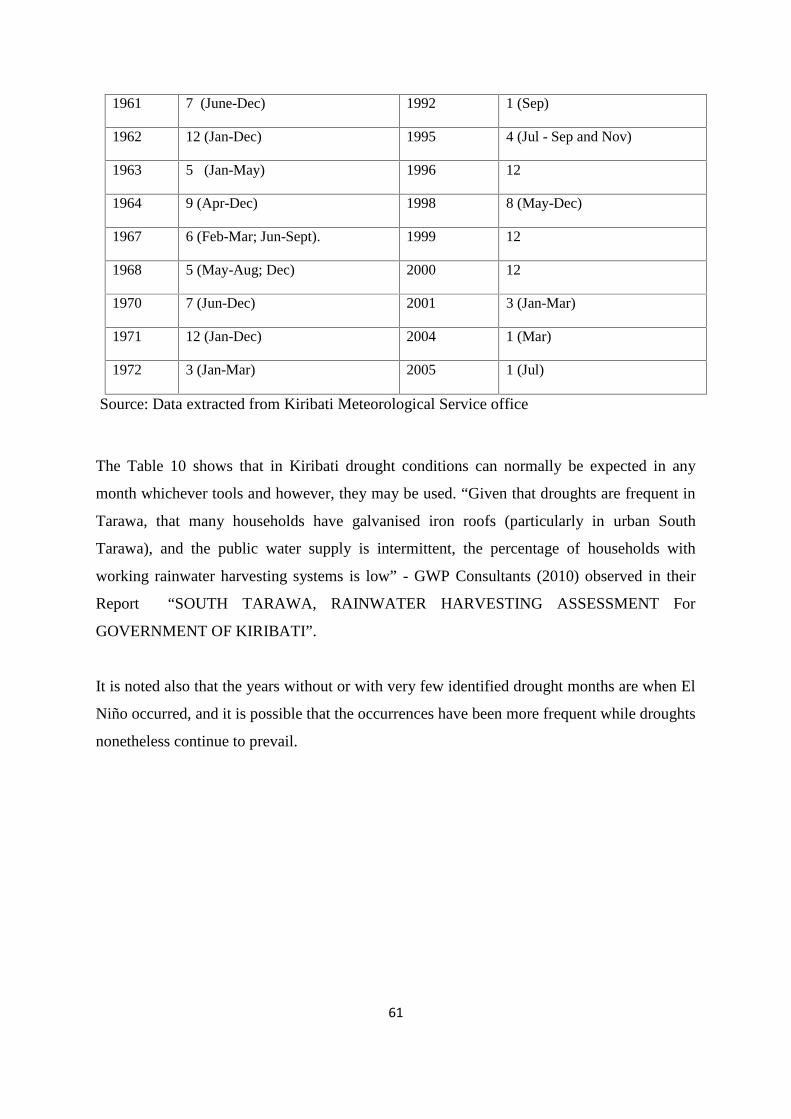
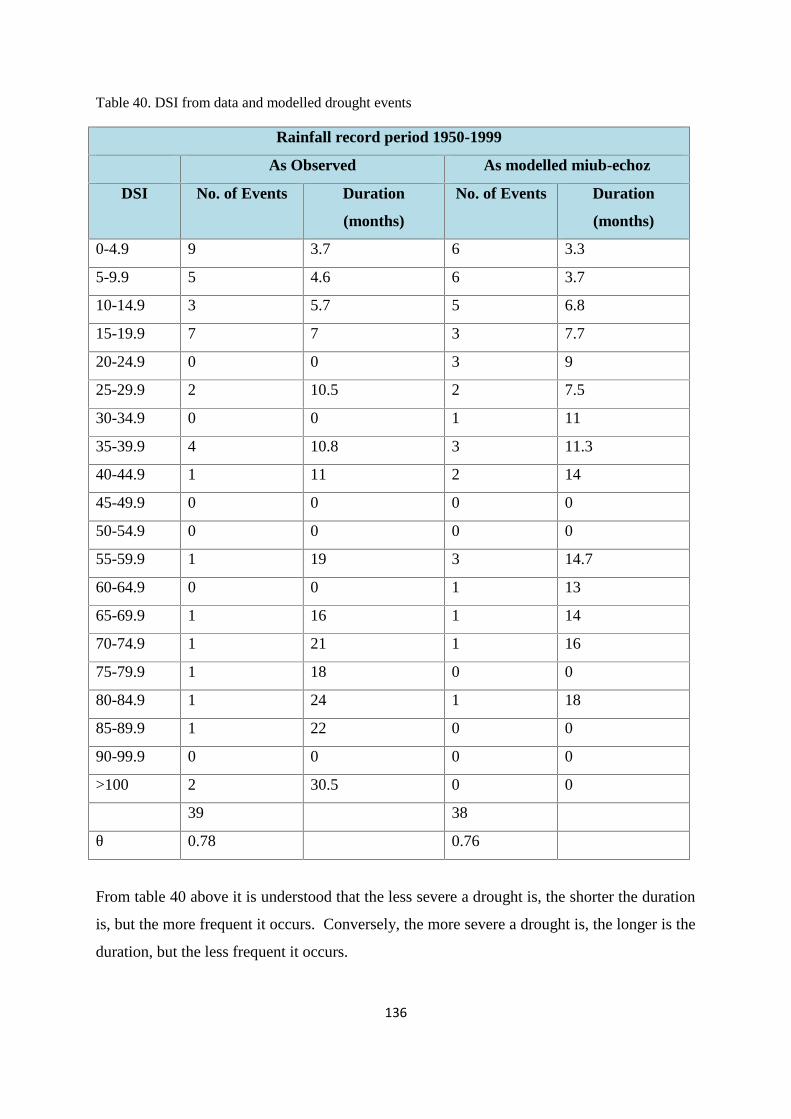
Table 40. DSI from data and modelled drought events ......................................................................136
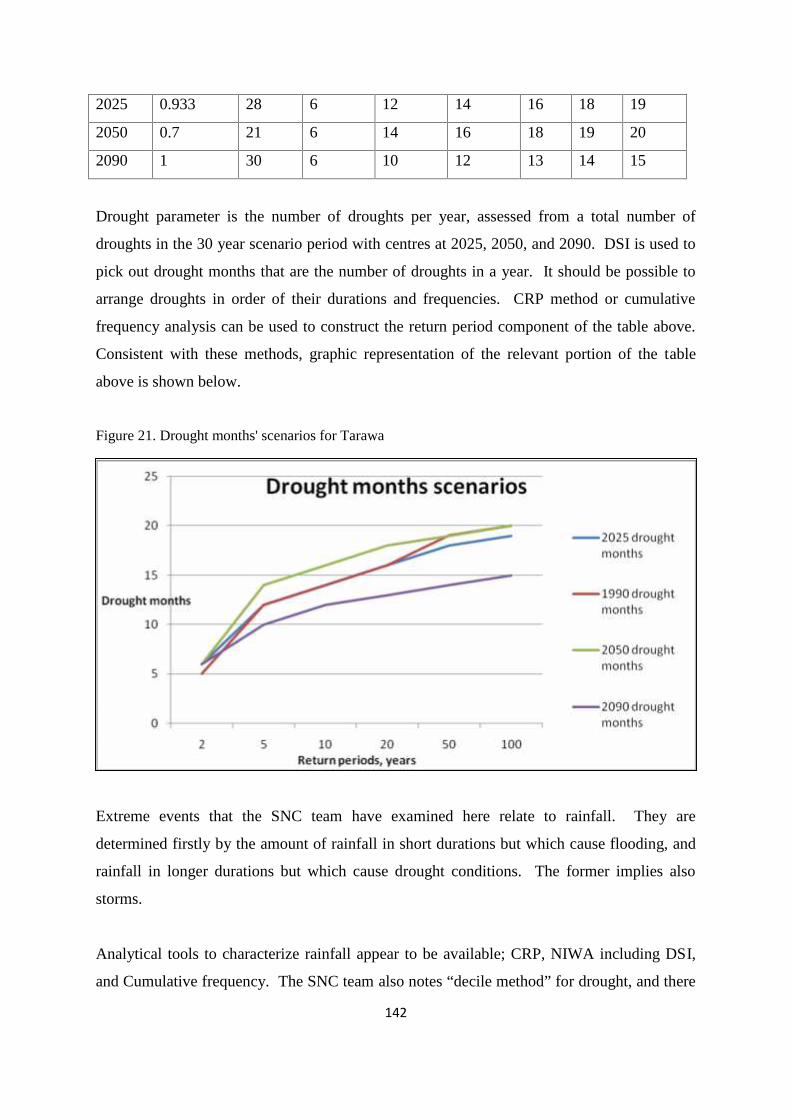
Table 41. Droughts at each of the Kiribati islands..............................................................................137
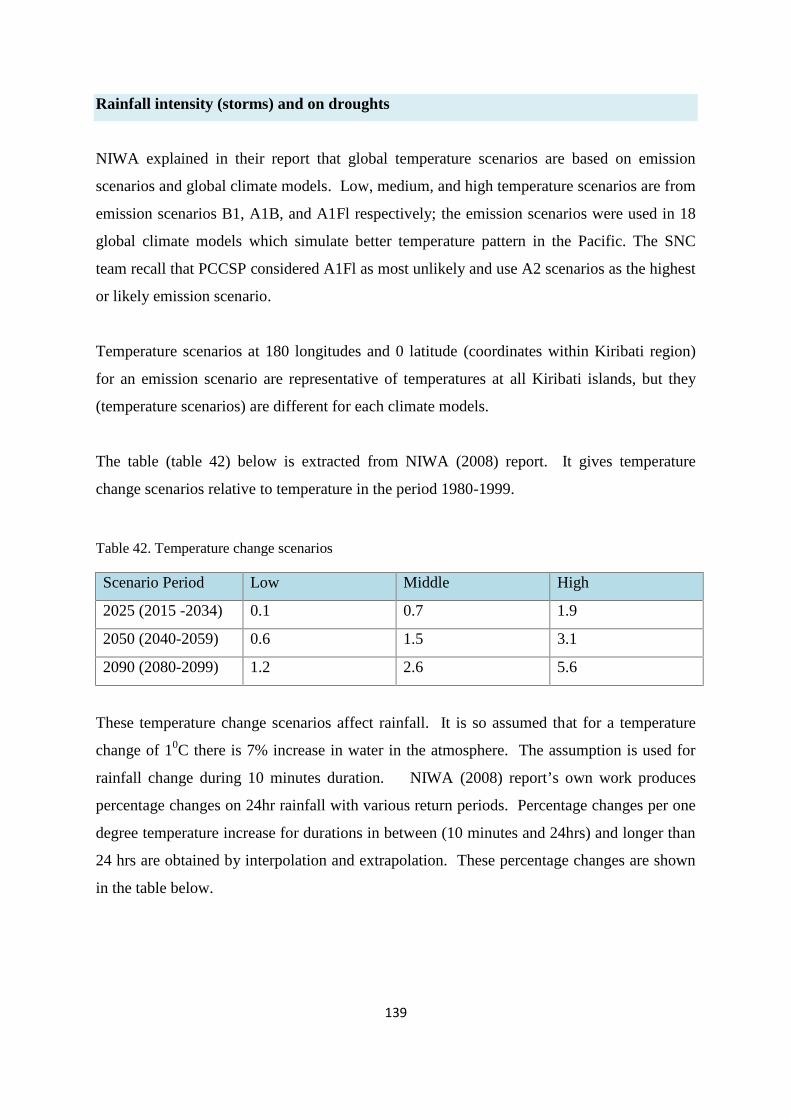
Table 42. Temperature change scenarios............................................................................................139
Table 43. Percentage changes of rainfall depths per temperature increase.........................................140
Table 44. Tarawa historical data scenario for 2090 on rainfall intensity............................................140
Table 45. Tarawa expected drought durations for various years (NIWA)..........................................141
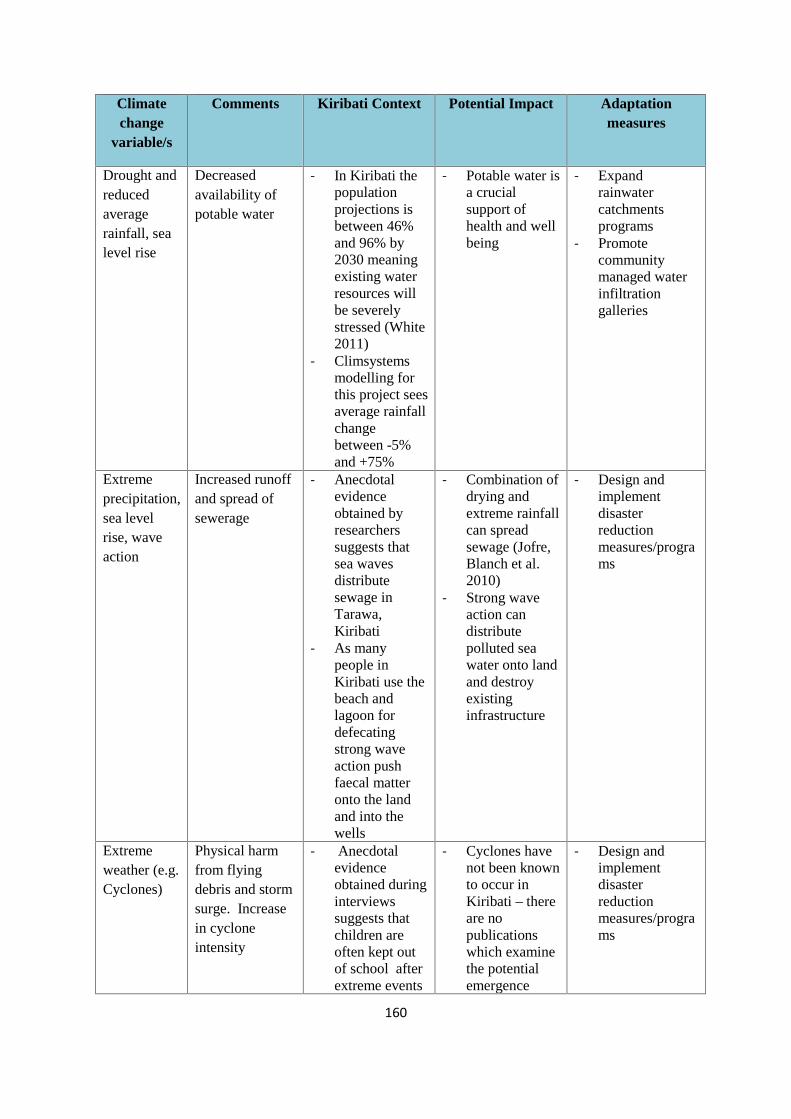
Table 46. Impact of different climate change variables and their degree of their projections on thechildren and communities - Kiribati ...................................................................................................158
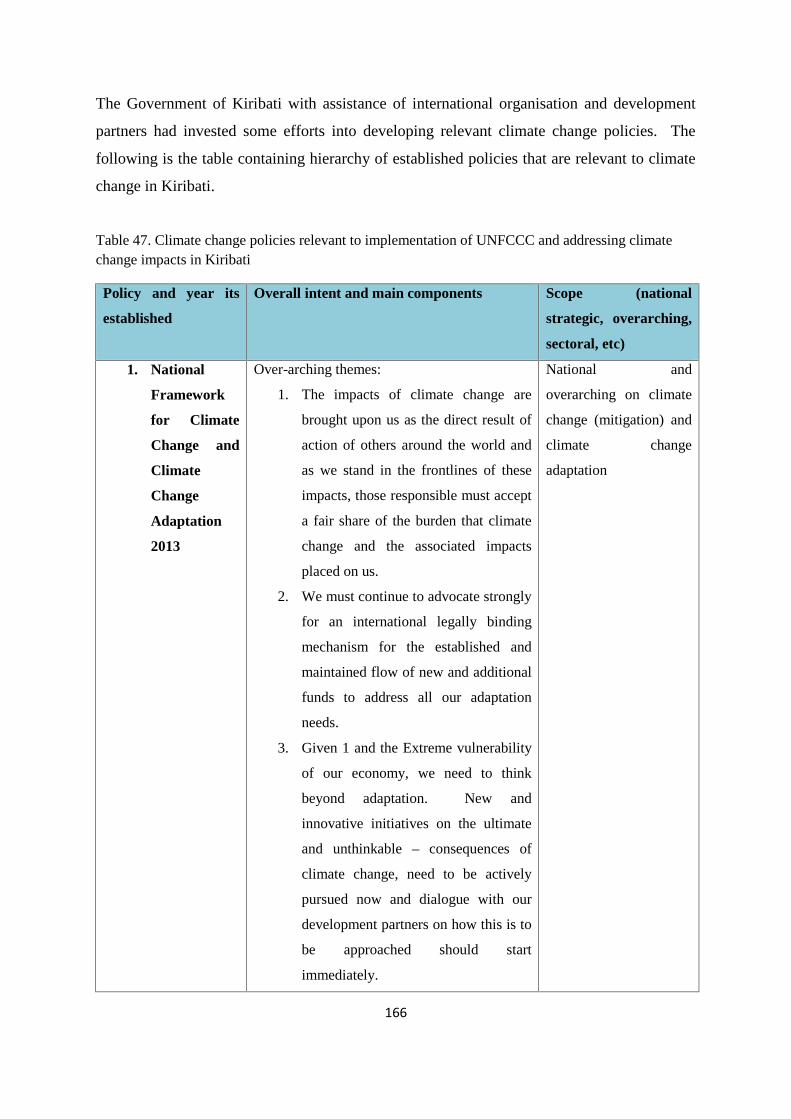
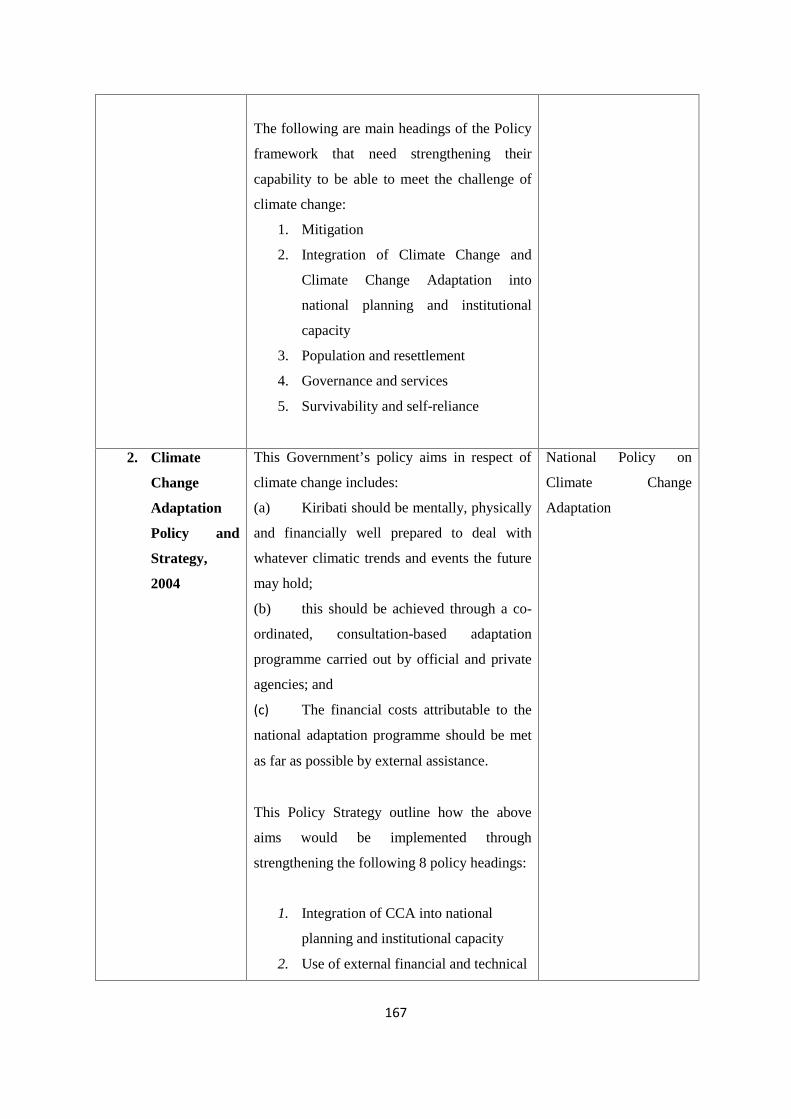
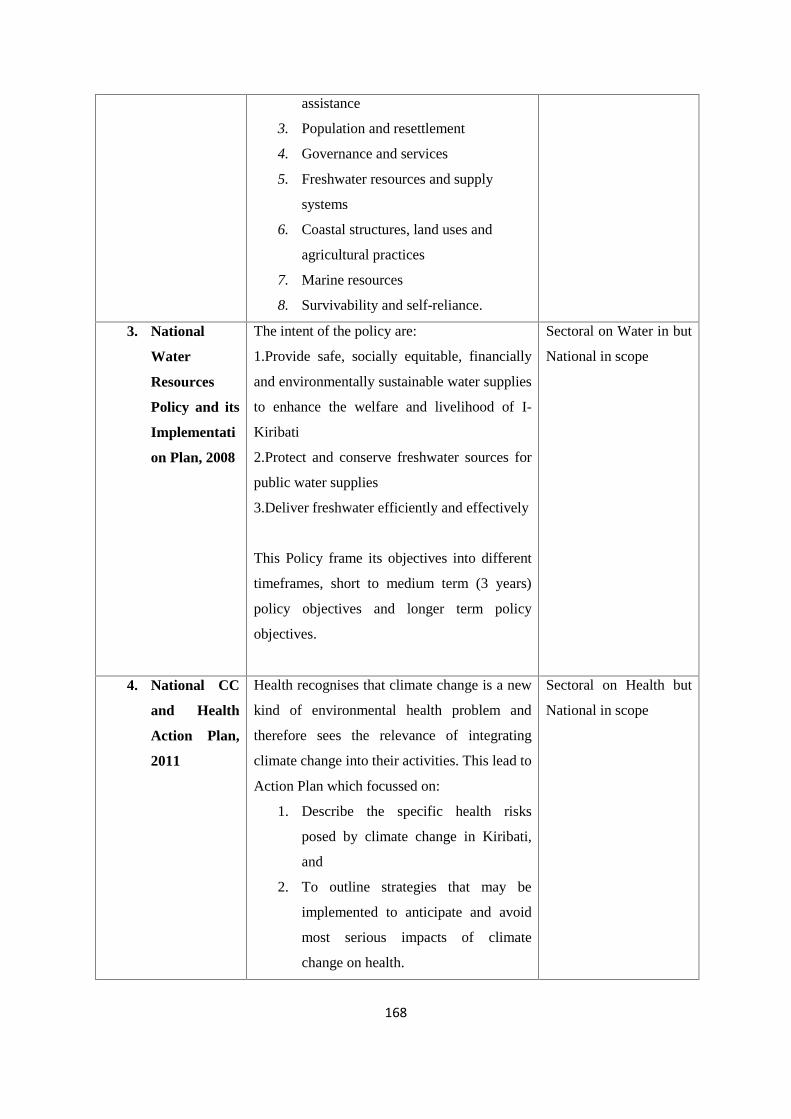
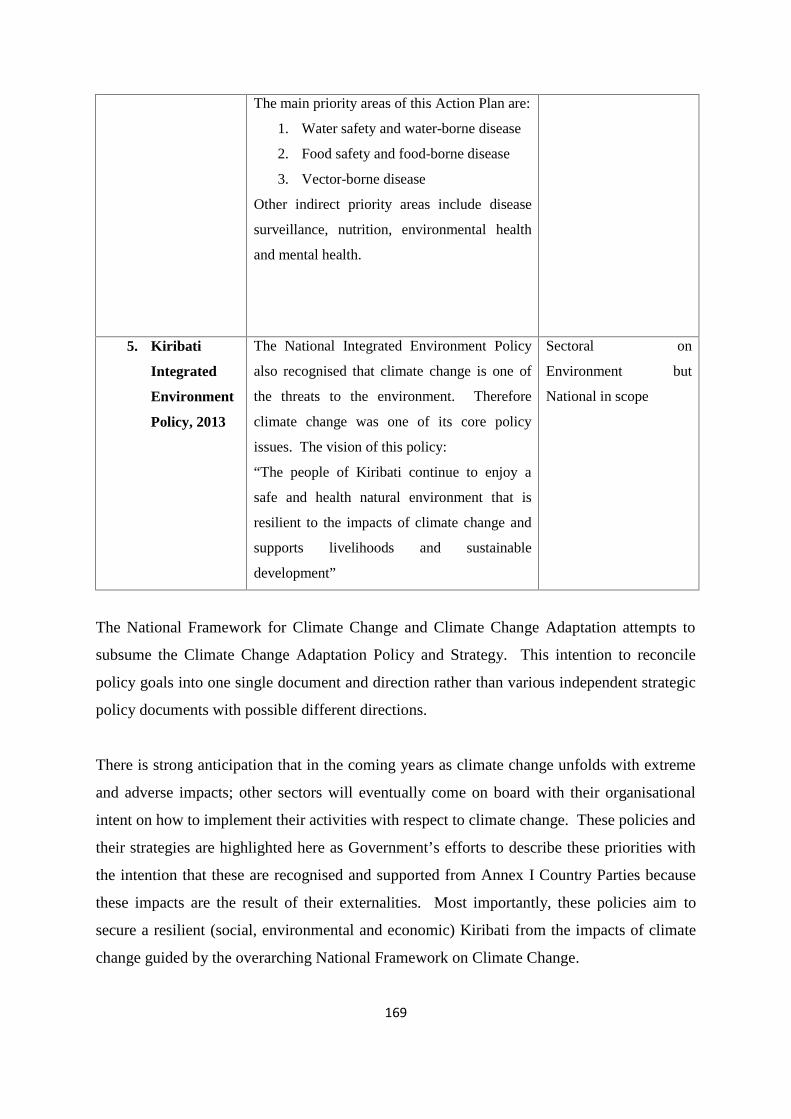
Table 47. Climate change policies relevant to implementation of UNFCCC and addressing climatechange impacts in Kiribati ..................................................................................................................166
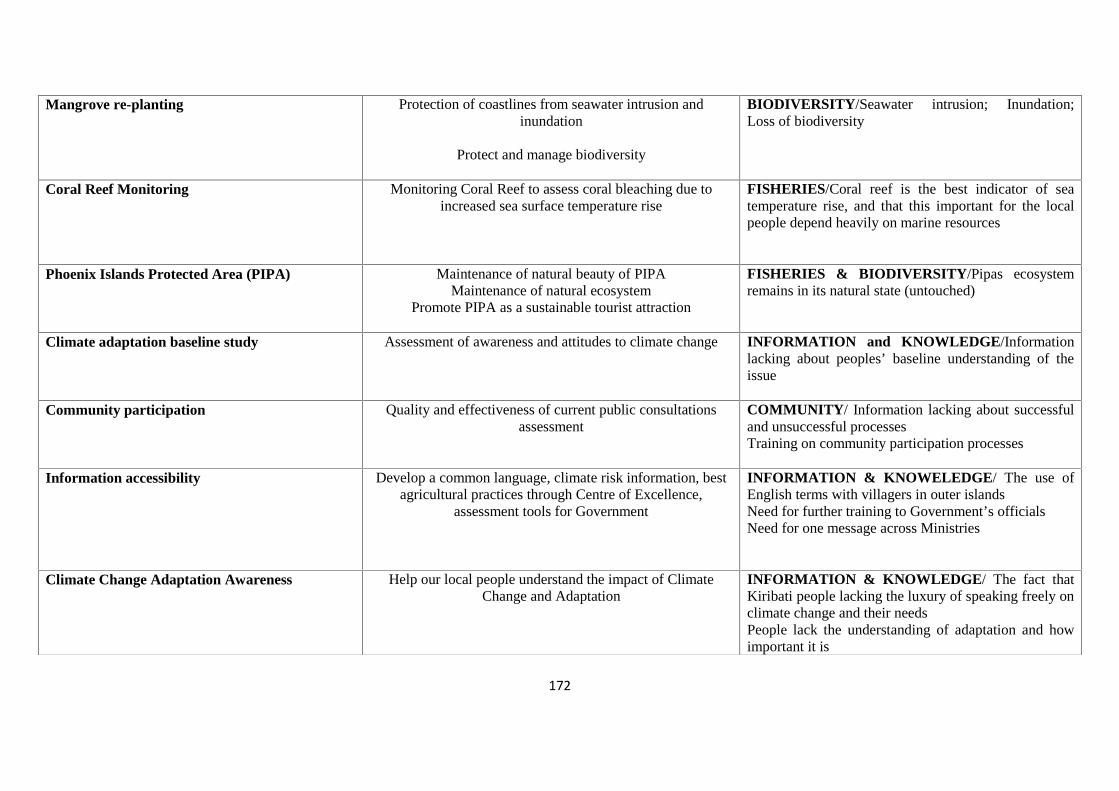
Table 48. Compendium of adaptation efforts implemented in Kiribati. .............................................171
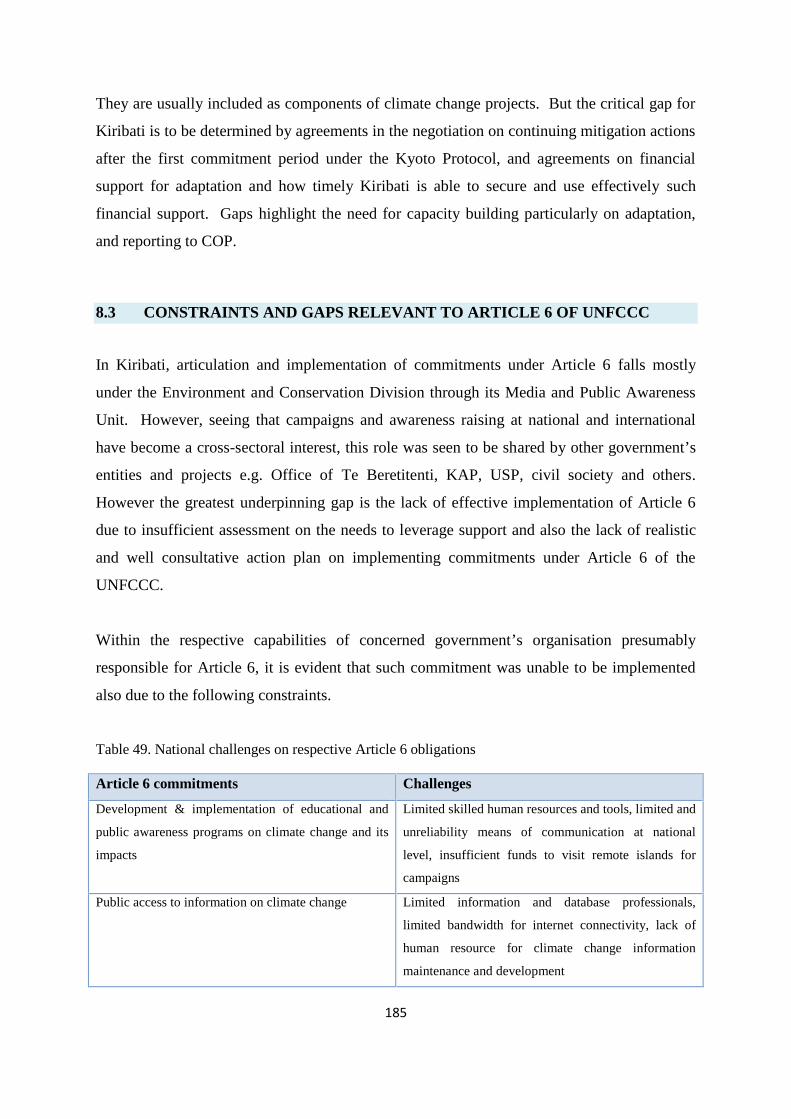
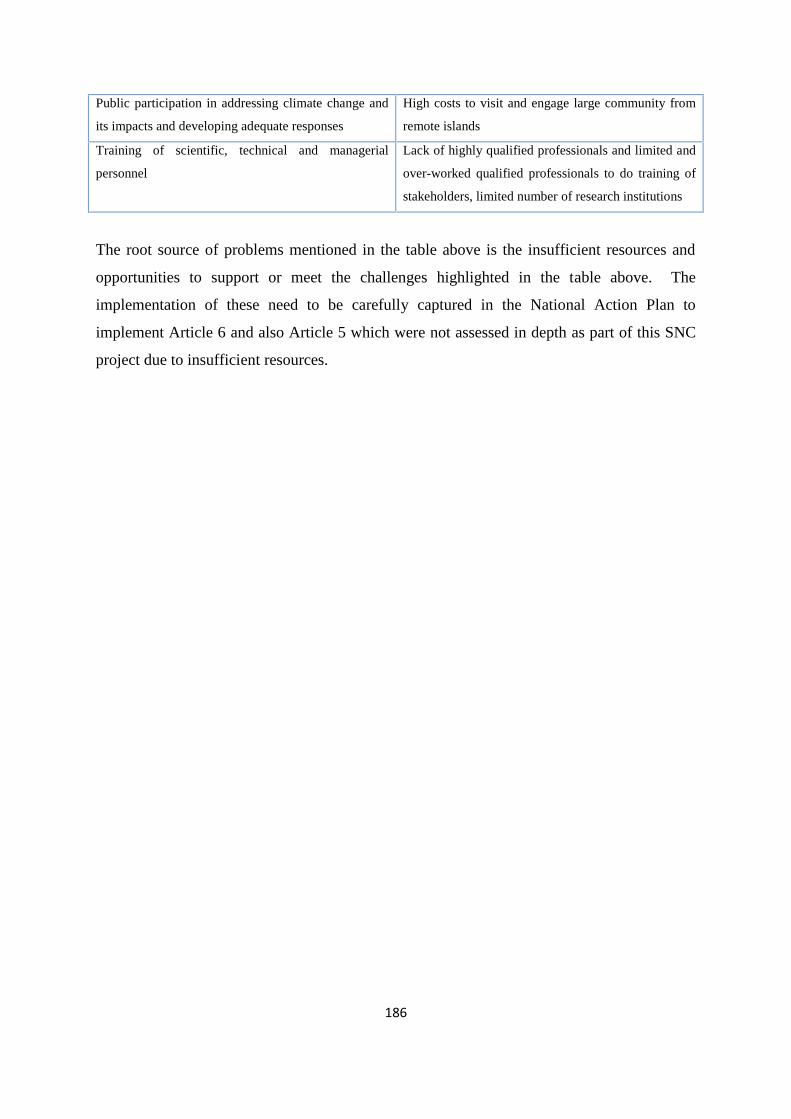
Table 49. National challenges on respective Article 6 obligations .....................................................185
12
Figures
Figure 1: Map of Kiribati ......................................................................................................................36
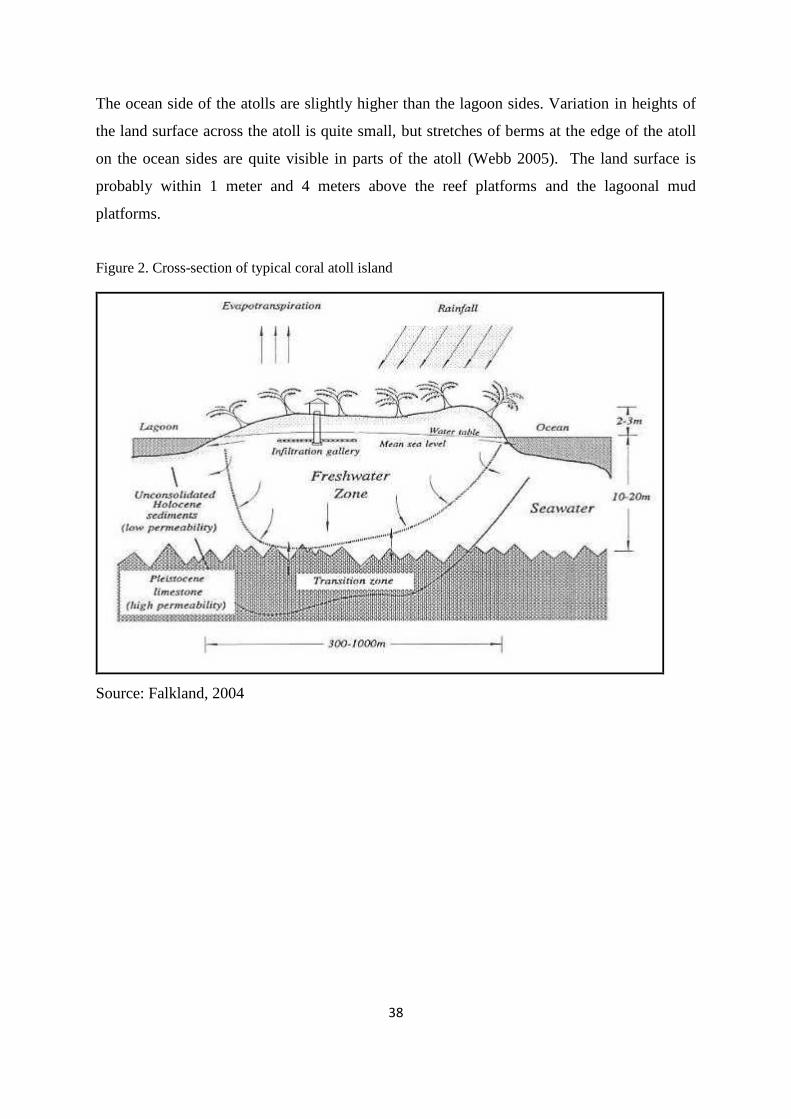
Figure 2. Cross-section of typical coral atoll island..............................................................................38
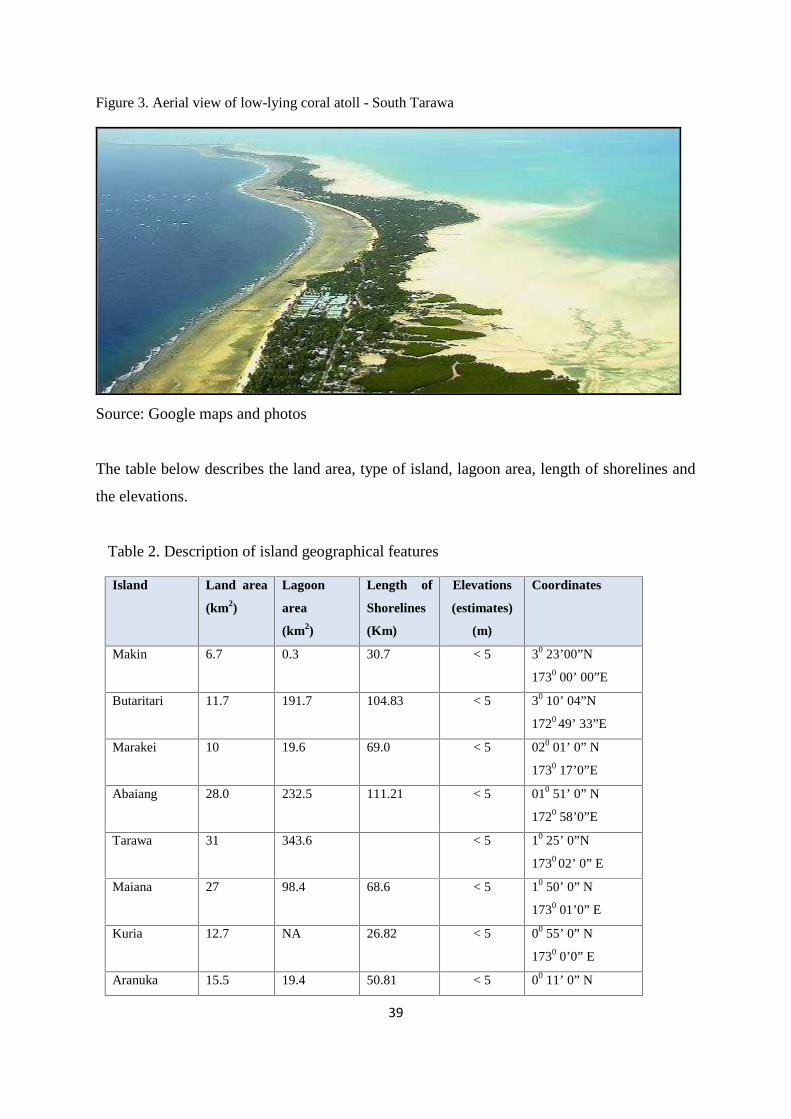
Figure 3. Aerial view of low-lying coral atoll - South Tarawa .............................................................39
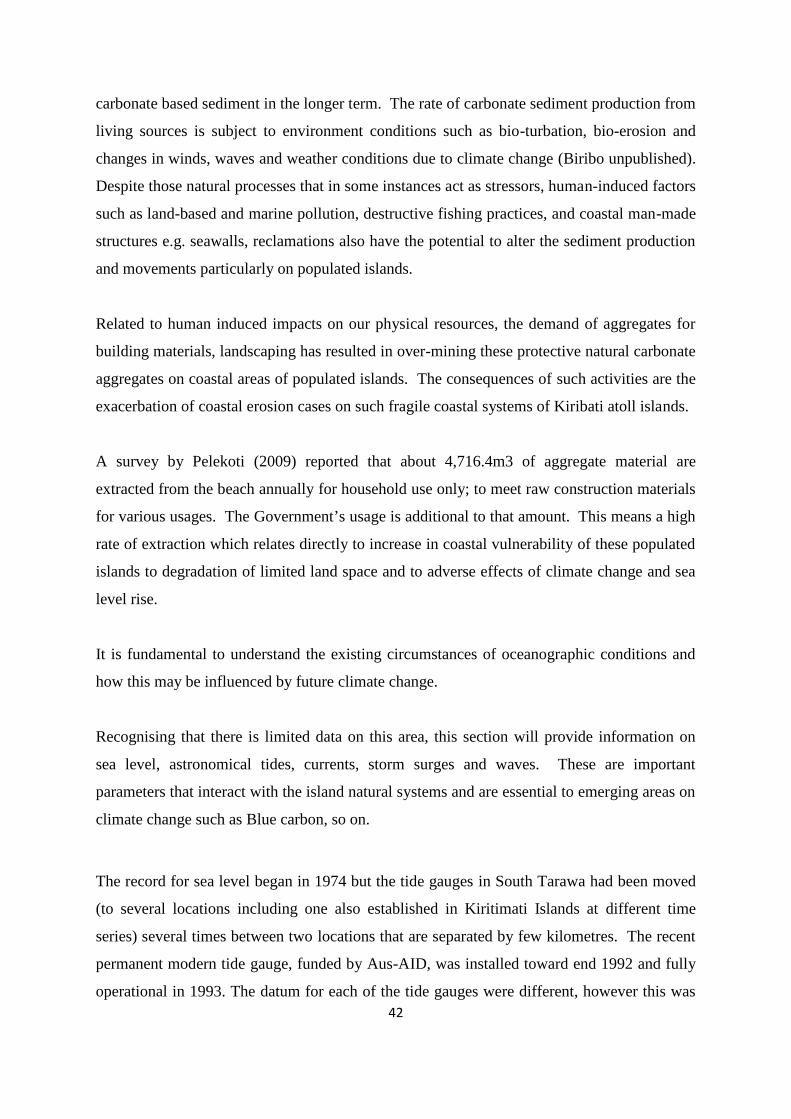
Figure 4: Sea level time series from different tidal gauges...................................................................43
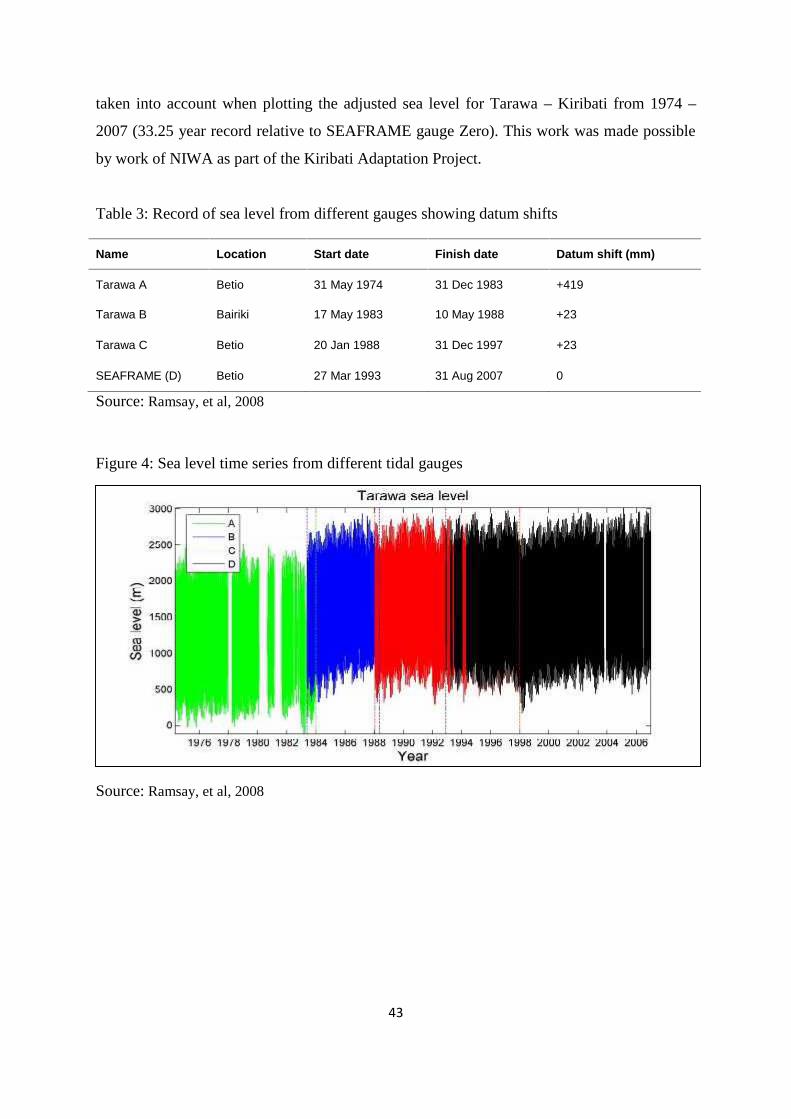
Figure 5: Adjusted sea level using Sea-frame as reference datum........................................................44
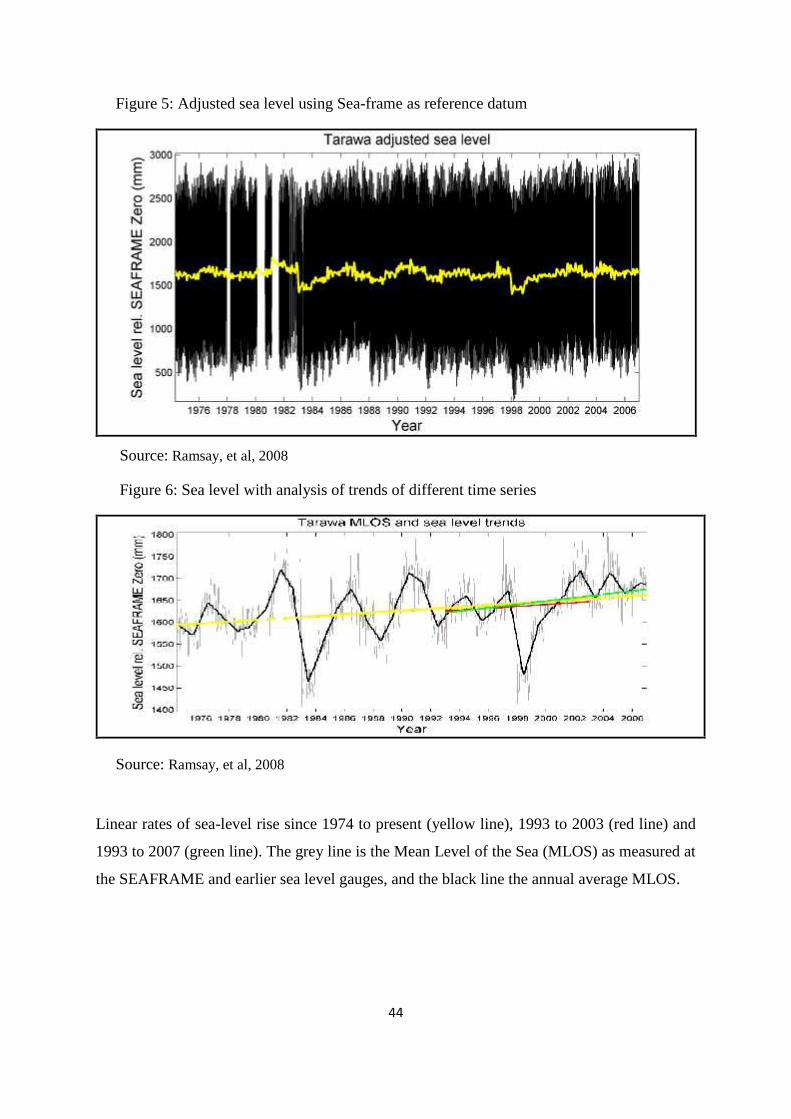
Figure 6: Sea level with analysis of trends of different time series ......................................................44
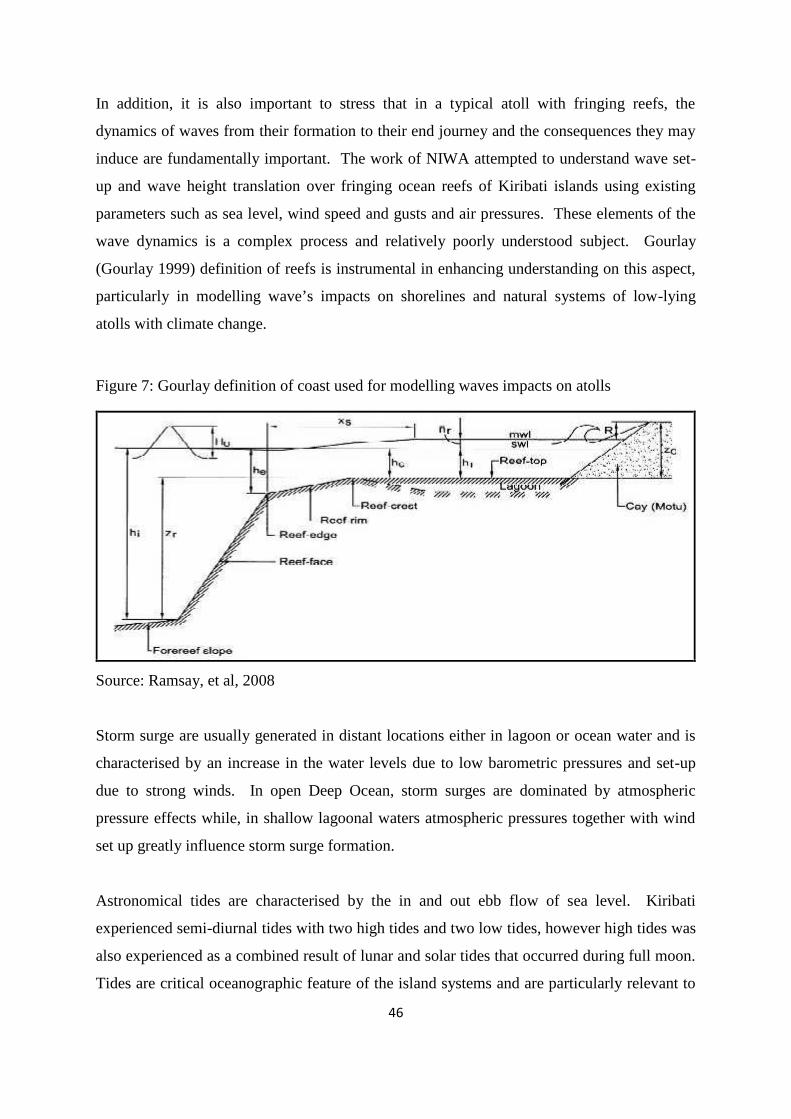
Figure 7: Gourlay definition of coast used for modelling waves impacts on atolls..............................46
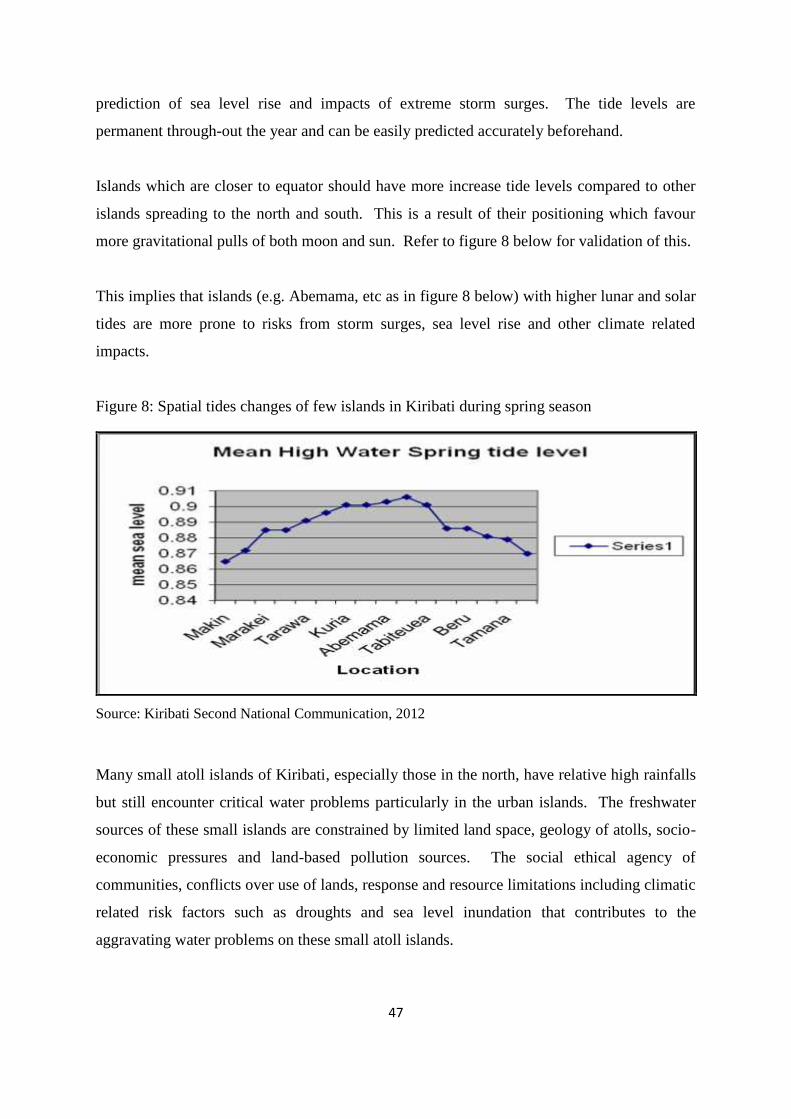
Figure 8: Spatial tides changes of few islands in Kiribati during spring season...................................47
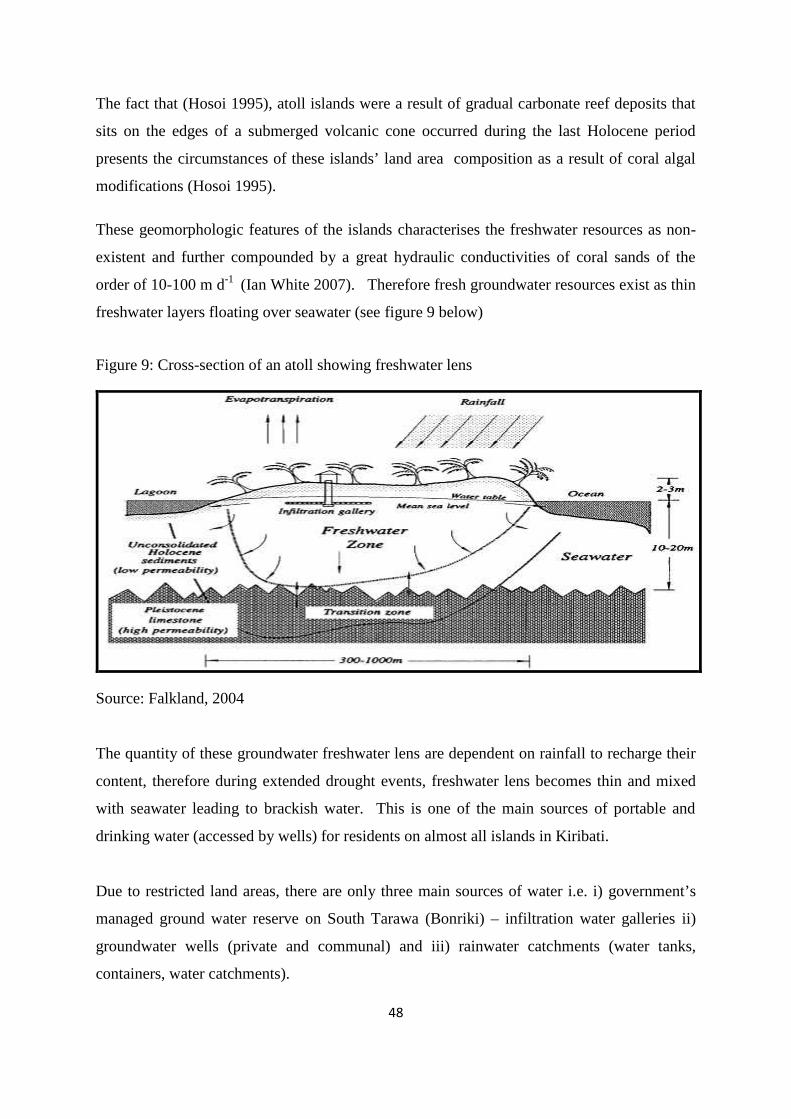
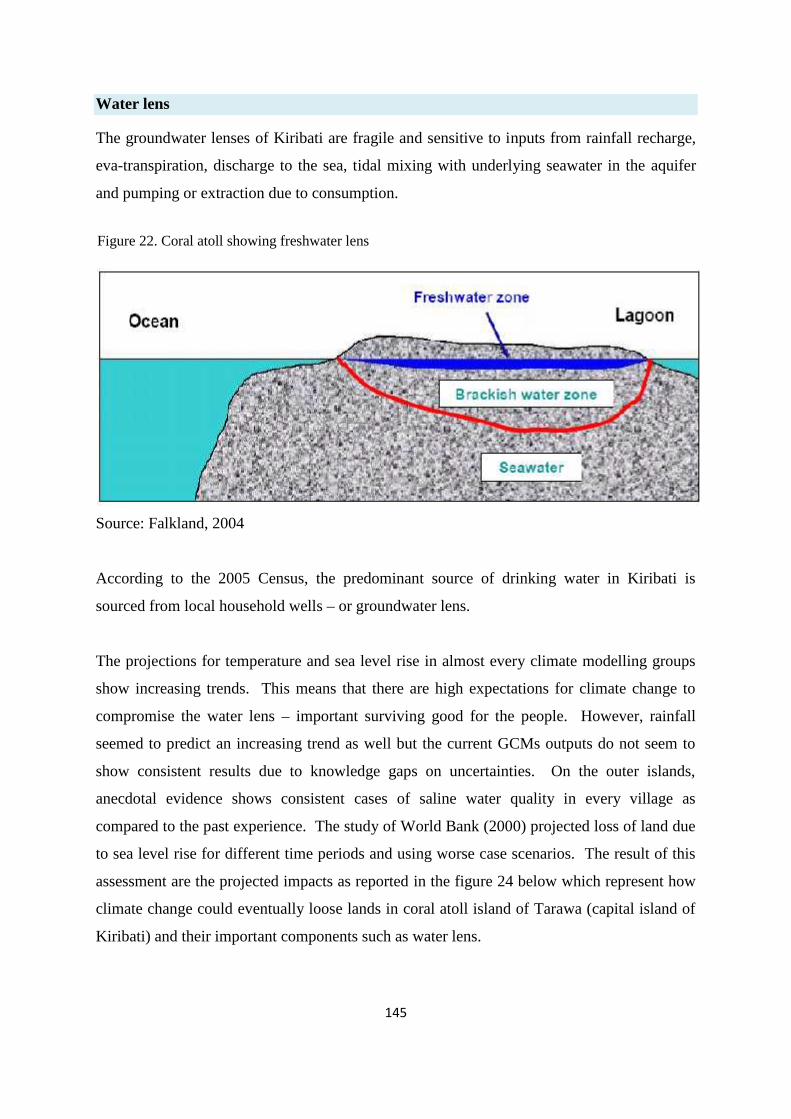
Figure 9: Cross-section of an atoll showing freshwater lens ................................................................48
Figure 10. Contributions to the national economy of some key sectors in 2005 ..................................77
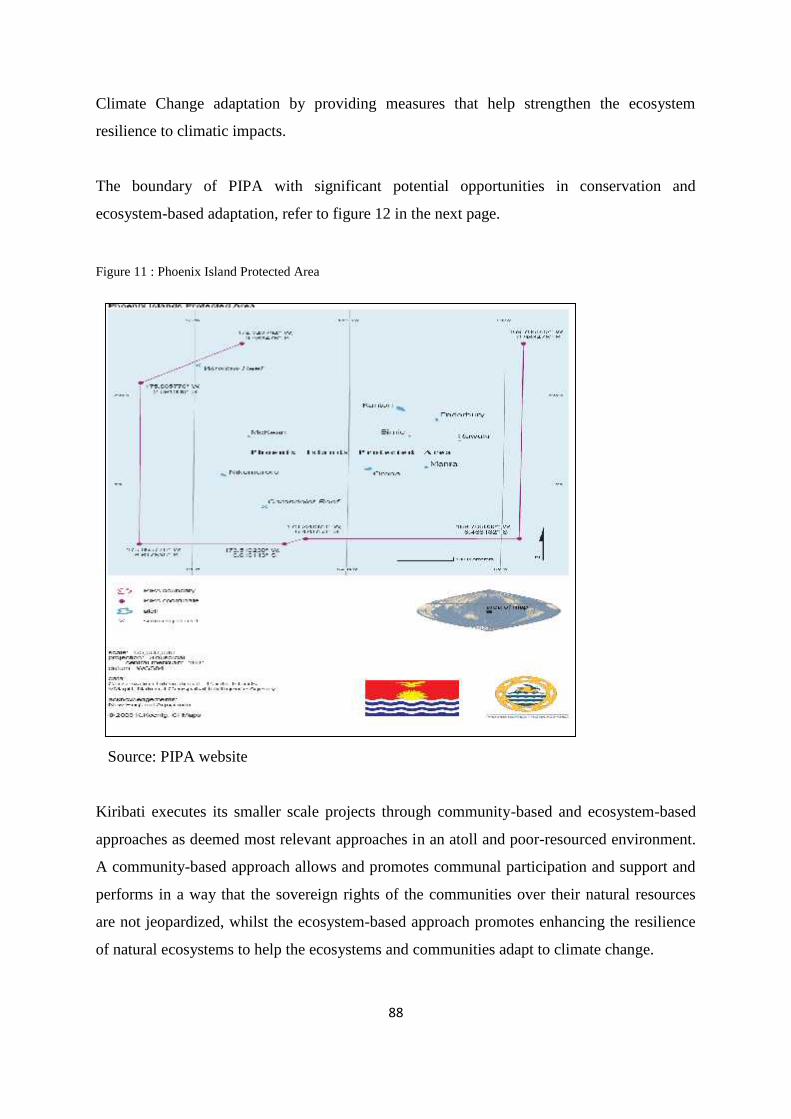
Figure 12 : Phoenix Island Protected Area ...........................................................................................88
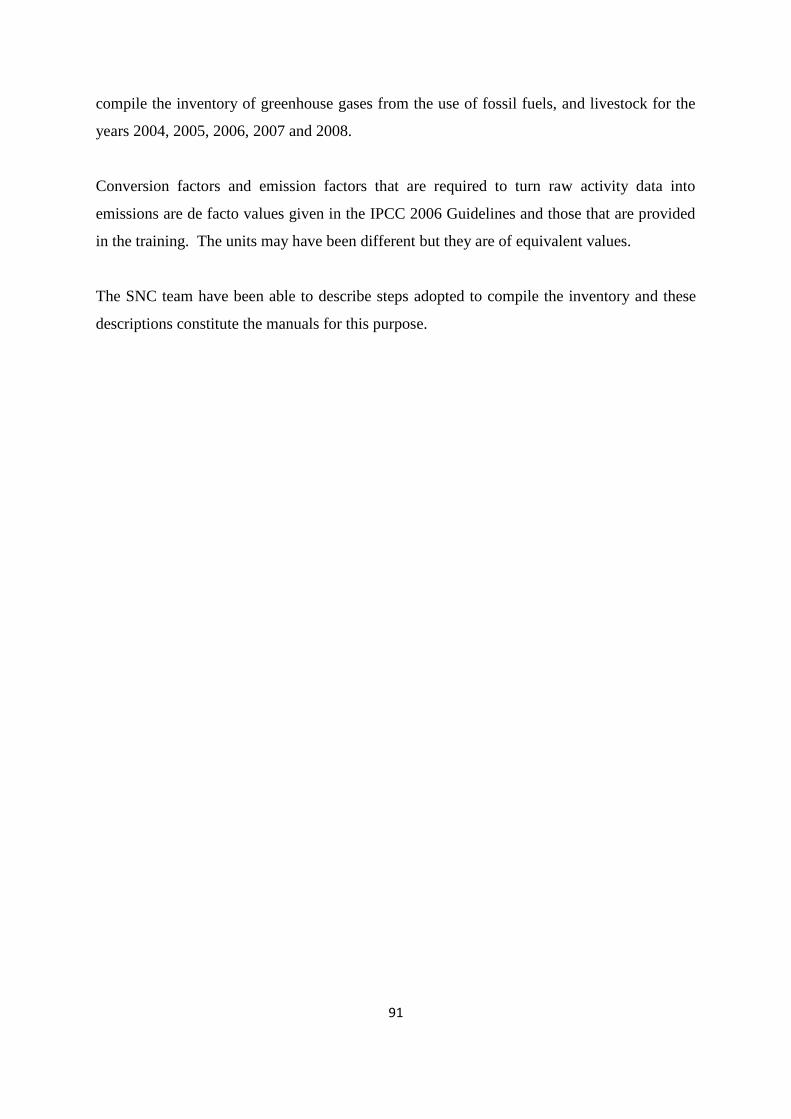
Figure 13. Kiribati total emission trends (in Giga gram - Gg) for periods 2004 – 2008 ......................93
Figure 24. Scenarios for inundation of lands of Bikenibeu village - Tarawa Island due to sea level rise............................................................................................................................................................146
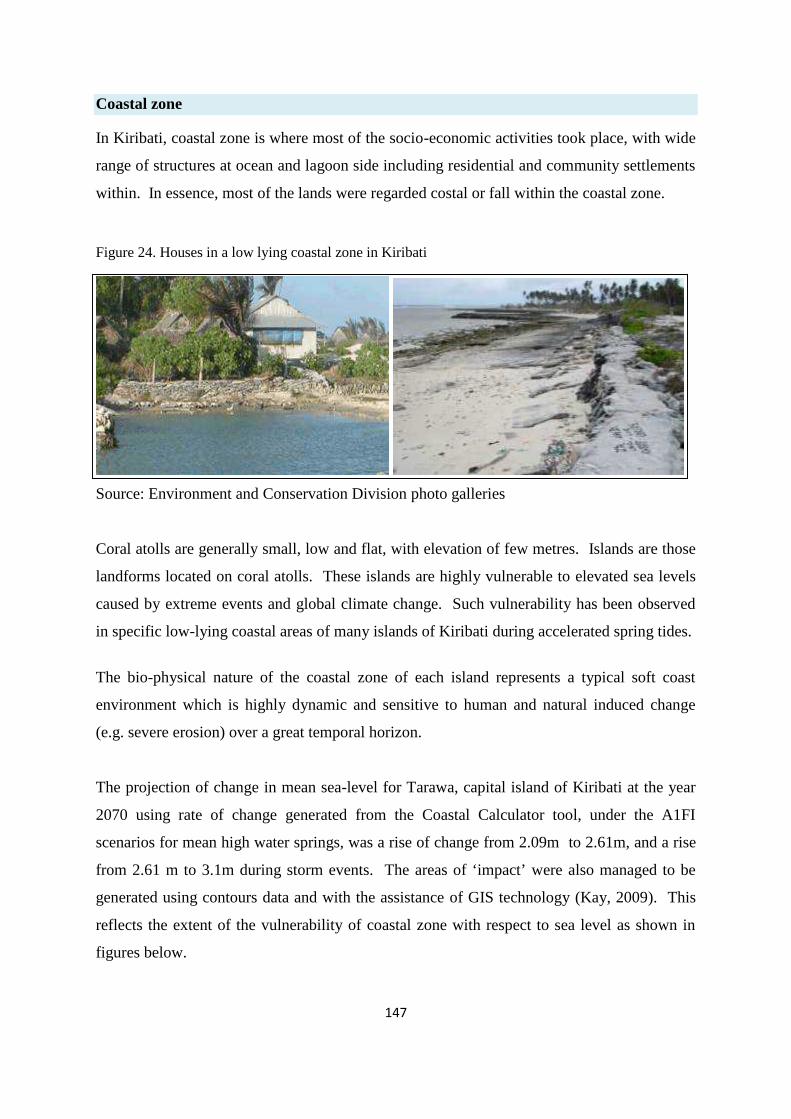
Figure 25. Houses in a low lying coastal zone in Kiribati ..................................................................147
13
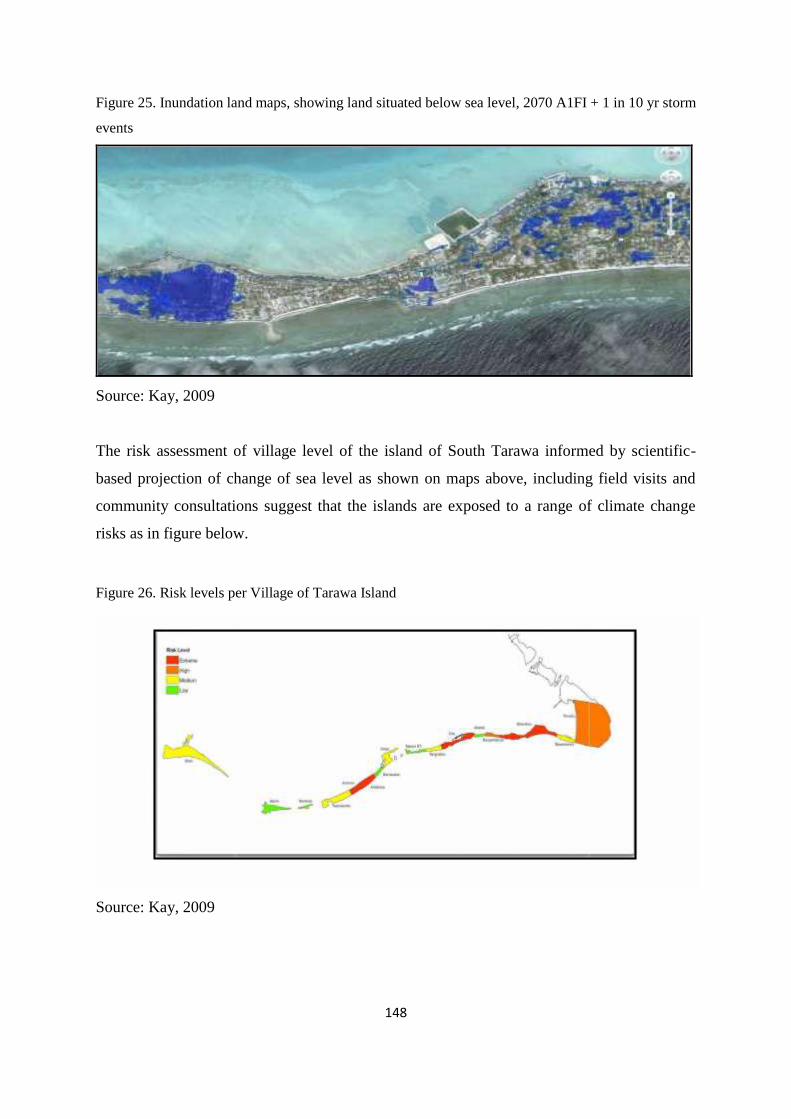
Figure 26. Inundation land maps, showing land situated below sea level, 2070 A1FI + 1 in 10 yr stormevents ..................................................................................................................................................148
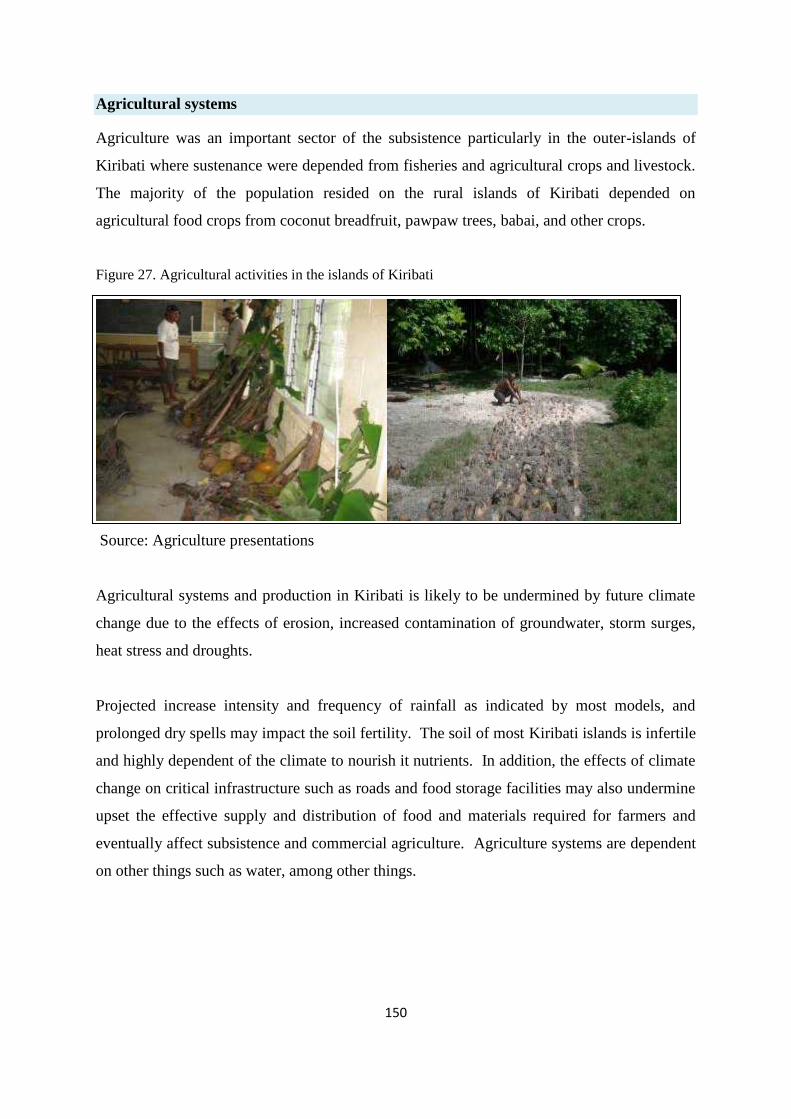
Figure 27. Risk levels per Village of Tarawa Island...........................................................................148
Figure 28. Agricultural activities in the islands of Kiribati ................................................................150
Figure 29. Fisheries activities and tuna resources in Kiribati .............................................................151
Figure 30. Island crops polluted by sea water intrusion......................................................................155
Figure 31. Coral reefs bleaching in Phoenix Islands - Kiribati...........................................................156
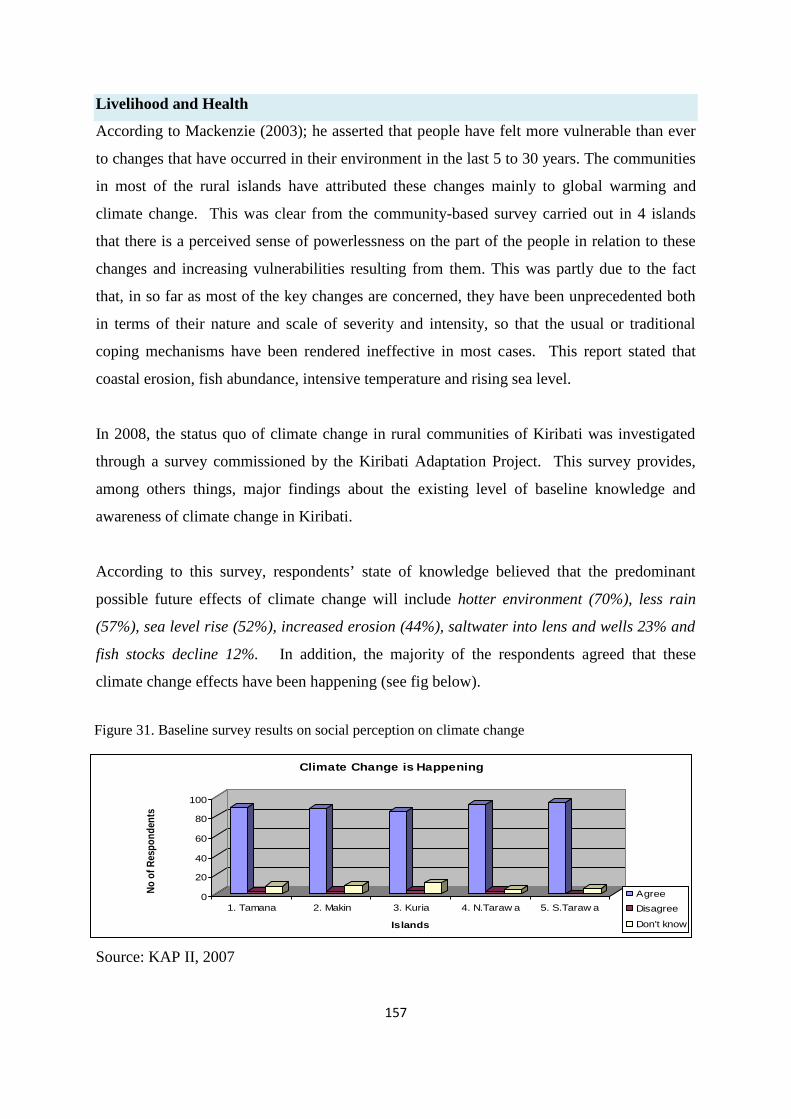
Figure 32. Baseline survey results on social perception on climate change .......................................157
Figure 33. Population distribution on sources of portal water sources in Tarawa – Kiribati..............163
Figure 34. Toilet facilities in Tarawa Island, Kiribati and population distribution over them ...........163
Figure 35. Climate change institutional settings in Kiribati ...............................................................164
Figure 36. Mainstreaming process in Kiribati ....................................................................................174
14
EXECUTIVE SUMMARY
The compilation of Kiribati’s Second National Communication (SNC) to the United Nations
Framework Convention on Climate Change (UNFCCC) adopts a participatory approach
through contributions of members of the National Climate Change Study team (CCST). The
process begins with designing the overall content of the report (building on the Initial
Communication report), followed by allocation of responsibilities for data gathering
pertaining to each information as relevant to chapters, and sub-sections contained in the
structure of the report. The thematic working groups (on National Circumstances, Adaptation
and Mitigation) were then formed in an effort to cluster the work of Climate Change Study
Team on specific topics of the report. Each thematic working group proceeded with
identification of available data and also those that are not available or somewhat difficult to
collate. Data collected were gathered and weaved in consistency with the content of the
report. Fragmented or absent data were augmented through engagement of
international/regional and national consultants where applicable and produce input to such
gaps. The overall coordination and steering of the process involving compiling SNC was the
responsibility of the Project Management Unit and the Environment & Conservation
Division, MELAD.
The SNC project’s approach uplifts important elements of building capacity of members of
CCST on climate change, increase knowledge on how climate change was directly linked to
other institutions’ roles and hence the need for more integration of climate change into
relevant planning processes. Despite the success aspect of this approach, this does not mean
that there are no constraints faced during the entire implementation of the project. The
greatest challenge faced with involving national stakeholders was the sporadic availability of
members, limited level of capacity and knowledge on climate change, unpredictable
consistency in pursuing tasks as agreed tasks by thematic groups. These challenges were
compounded by the members’ own routine tasks and over-burden commitments within their
own institutions.
Nevertheless, the report was completed according to what it was initially planned in terms of
contents and structure. The draft went through several institutions including regional and
international bodies, Secretaries and Cabinet for review and endorsement.
15
There are still missing data that require further assessments and research but due to
inadequacy of resources and time with current project, these information were planned to
form part of the subsequent Third National Communication.
The report has 5 mains chapters on National Circumstances, Island Biodiversity, Greenhouse
Gas Inventory and Emission, Vulnerability and Adaptation and Other Matters. The executive
summary presents key information from each chapter only.
The Republic of Kiribati as a sovereign state is committed to be mentally and physically
prepared to the risks that climate change may bring. From 2000 to date, slow onset adverse
impacts and extreme events were the driving forces for Kiribati to forge ahead with planning
her response to climate change. The Kiribati Climate Change Adaptation Strategy includes
institutionalising a nationally coordinated and participatory based adaptation approach and
programs, in addition to securing bilateral and multilateral donor support to help meet the
costs of the national climate change strategies.
Key technical, steering institutions and committee structures (Climate Change Study Team
and the National Adaptation Steering Committee) were established and whose work have
been integrated into the current national development planning process and make appropriate
reporting and advice in a coherent manner. This is done so in the same spirit of building
island resilience from the adverse impacts and extreme events of climate change and in
parallel with achieving the common development goals of Kiribati.
Kiribati is a country that comprise of no more than coral atoll (lagoonal and non-lagoonal)
and raised limestone islands but with a large ocean space (Economic Exclusive Zone).
Except for Ocean island or Banaba (with more than 10m elevation), all islands of Kiribati are
raised not more than 5m above mean sea level. The shorelines of the islands range from as
short as 11.3km to 221km (refer to table 2). The width of liveable lands on each islands only
range from 5.2km2 to 321km2. These geo-morphological features are not expected to
increase substantially either in size or elevations in the future. This is an important aspect in
addition to layers of demographic elements, environmental and climate change pressures.
The soil was made up of largely calcareous materials in the form of coarse coral sand, gravels
16
and typically quite variable organic matter contents. This presents a very poor fertility soil
for agricultural productivity, and therefore confined to a limited variety of food crops. Such
characteristics of small atoll islands, determine that freshwater resources are almost non-
existent. The freshwater resource is known to exist as a thin layer of freshwater over
seawater underground due to the high hydraulic conductivity soil of coral atolls. The
existence of the freshwater lens is dependent on the discharge from rainfall only, and is the
main source of portal water of rural communities in Kiribati.
The rate of sea level, waves and other oceanographic features of islands and how these
function in the dynamic coastal system of each islands, are also equally fundamental in
determining the national circumstances of Kiribati. However the following were noted, sea
level rise has been increasing with a rate of between +2.1mm to +5.7mm per year. The range
represents different pools where data were collected and are also results of differences in
mean level of sea (MLOS) as datum or reference points. It was also noted that modelling
waves in the context of enhanced understanding on the different types and definition of reefs
will assist inform baseline knowledge in this area, and its significant relationship with the
climate change and sea level rise.
Nevertheless, according to the current body of information on this particular geo-
morphological subject, reef islands or atolls are still regarded as some of the most vulnerable
and threatened coastal systems among reviewed systems, particularly in the face of climate
change and sea level rise.
The climate of Kiribati has been described as a hot and humid tropical climate. However,
there are marked differences in rainfall across the 3 main groups of islands of Kiribati
(Gilbert, Line and Phoenix groups), and also within the groups. Temperature and winds were
also uniquely differing with their own trends.
It is important to consider the traditional knowledge regarding the characterisation and
prediction of weather and climate. This is the knowledge that appears to stress astronomical
factors as principal drivers of the climate of Kiribati. With this knowledge, I-Kiribati
identified two known seasons in Kiribati – “Te Aumeang” and “Te Aumaiaki”. Te Aumeang
is characterized by stormy and rainy climate and weather for six months, from November to
17
April. For the rest of the months, from May to October, the climate and weather is normally
calm and dry – Te Aumaiaki.
The climate of Kiribati is governed mainly by the movement of Inter-tropical Convergence
Zone (ICTZ) and the equatorial doldrums’ belt (EDB) which is present through-out the year
in the western pacific. The South Pacific Convergence Zone (SPCZ) has an effect on the
climate of the southernmost islands but to a lesser extent.
The Walker Circulation and associated El Nino Southern Oscillation (El Niño and La Niña)
with their marked opposite conditions of flooding (excessive rainfall and severe weather
events) and drought for different parts of the South Pacific and the wider tropical region of
the globe are the predominating phenomena that determine or have direct relationship with
the Kiribati’s climate.
The temperature averages are best described as increasing for the past decades (last 30 to 40
years). Annual monthly mean temperature range from 27.8oC – 28.4oC, Annual monthly
average of max temperature range from 31.1oC – 31.2oC and the Annual monthly average
minimum temperature are 25.25oC – 25.41oC. The mean monthly sea temperatures for each
of the years (1940 to date) are finally averaged to give what considered as the mean annual
sea temperature which is 29.60C.
For observations and characterisation of rainfall in Kiribati, only 4 rainfall stations were able
to retain more than 30 years datasets, and these are stations in Butaritari Island, Betio Island,
Kanton Island and Kiritimati Island.
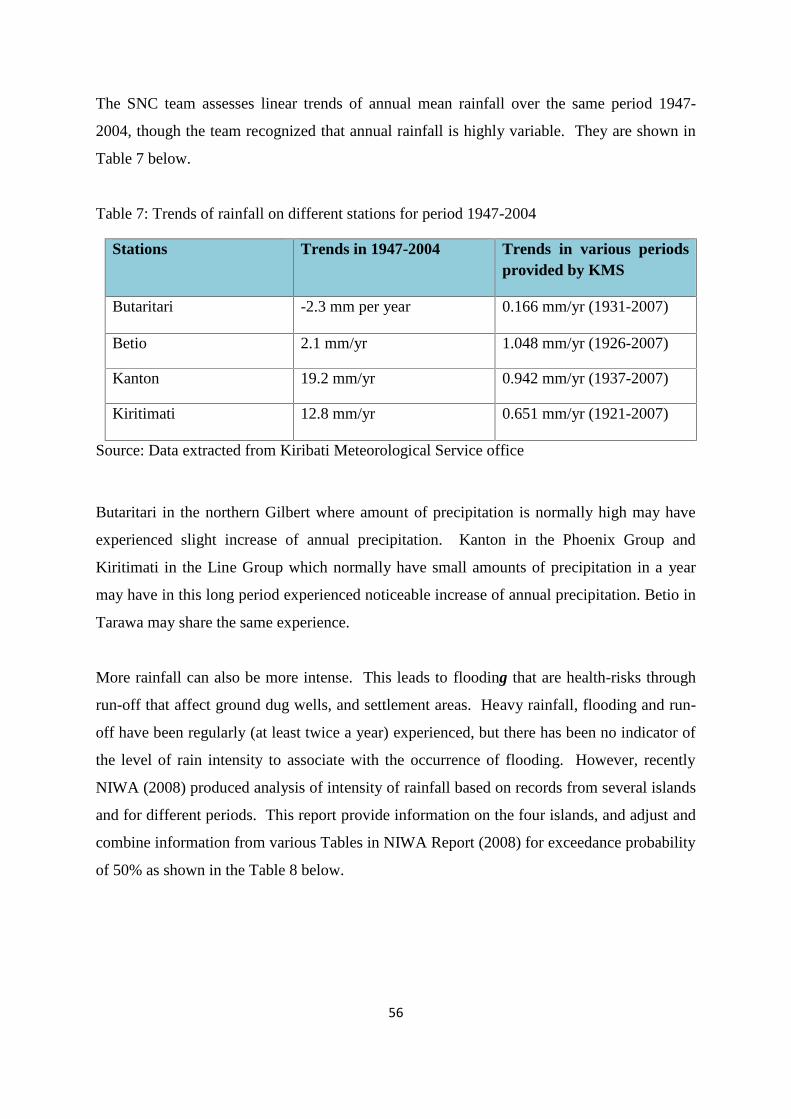
The trends vary a lot but they can be best summed up in annual averages and ranges for each
island representing the entire Kiribati as follows; Annual average rainfall from 940 – 3160
(mm), Maximum ranges fluctuate from as high as 3473 to 4823 mm, and minimum ranges
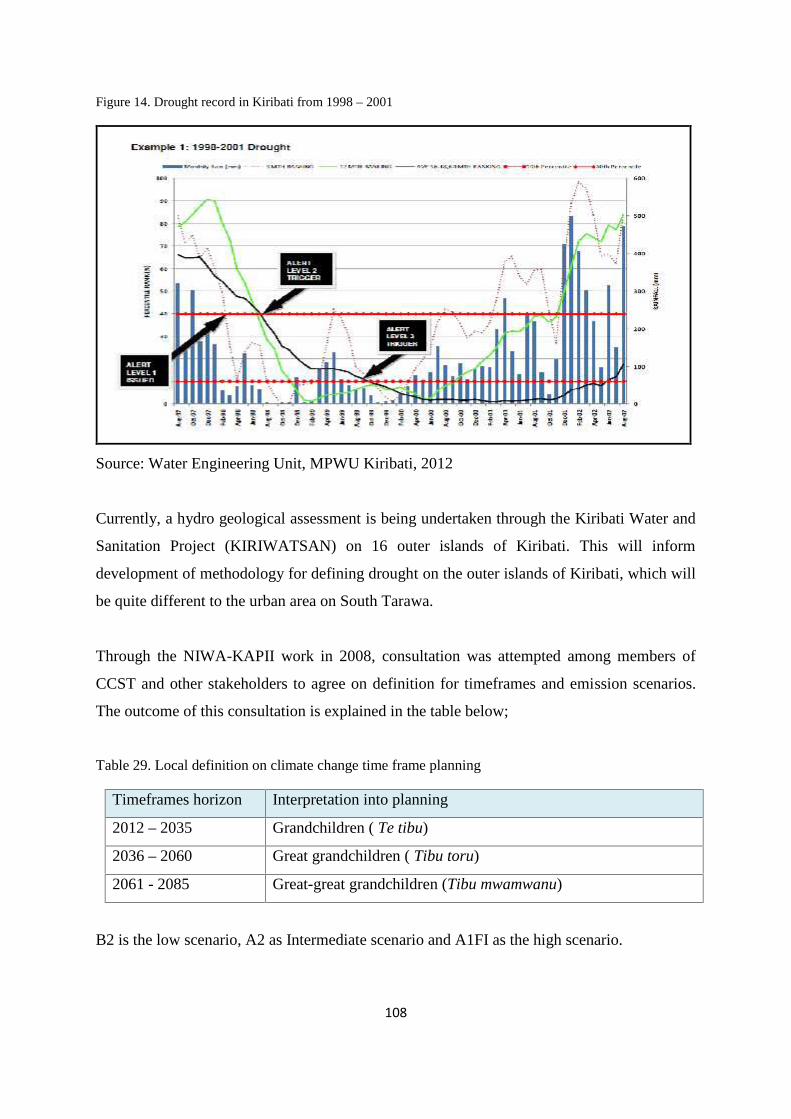
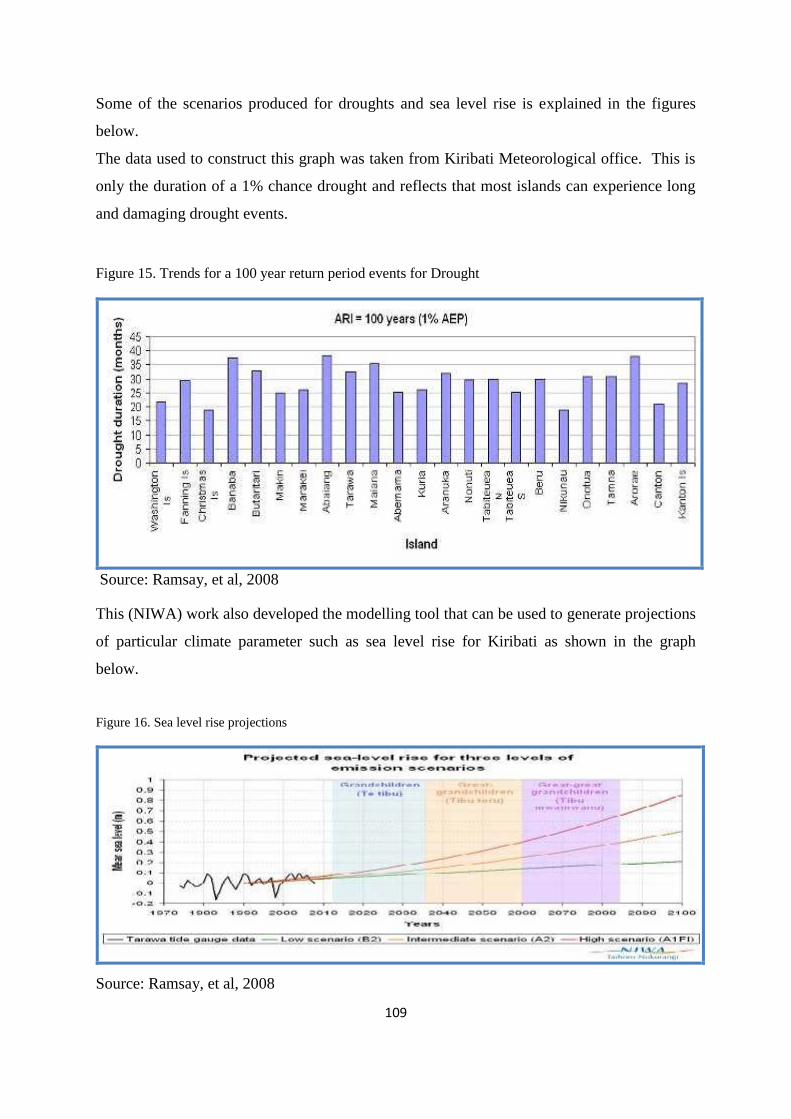
from as low as 177 to 1447mm. The analysis of drought duration for a 1% Annual
Exceedance of Probabilities or Annual Return Interval of 100 years indicates that many
islands in Kiribati can experience long and damaging drought events (more than 12months).
18
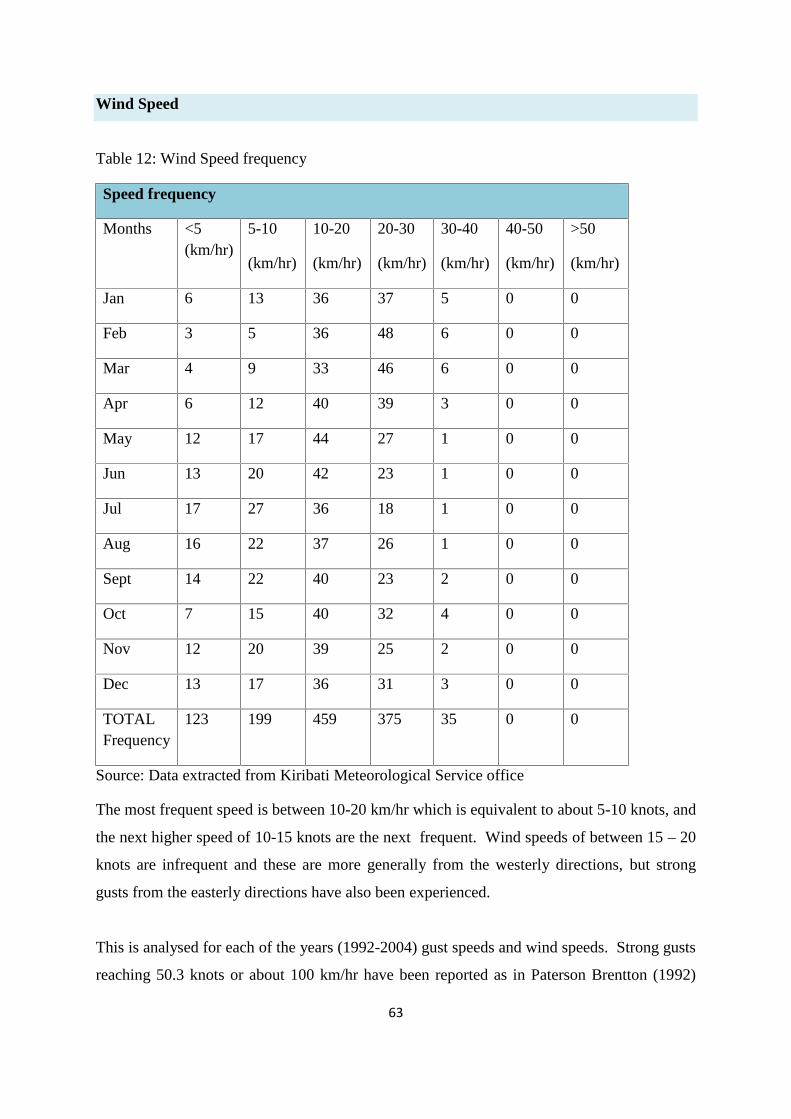
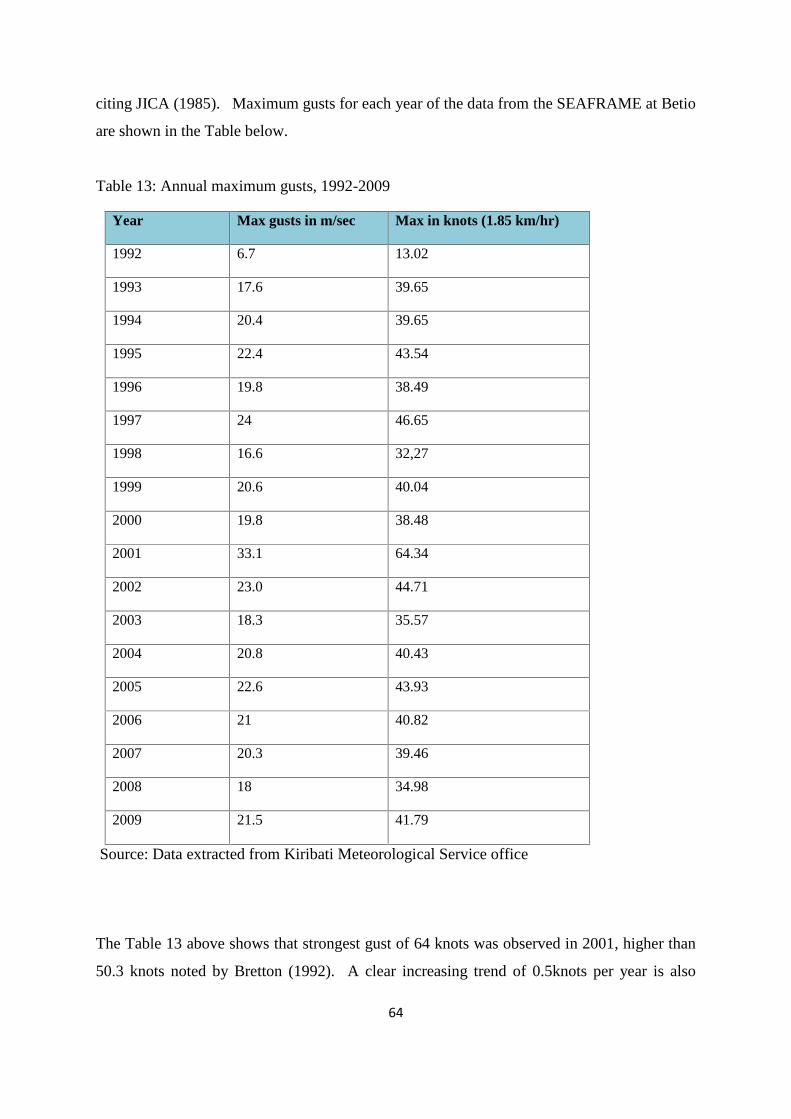
The most frequent wind speed is between 5-10knots and an increasing trend of 0.5knots per
year was also observed for Kiribati. The mean cloud cover for stations in Kiribati is 5.56 to
5.86.
The population of Kiribati over the period spanned by censuses intervals indicates an
increasing trend i.e. from 72,335 in 1990 to 92, 533 in 2005. The distribution of this increase
over the 3 main groups of islands of Kiribati indicates that the Gilbert and Line & Phoenix
group shares have increased.
The Total Fertility Rate “declined quite dramatically from about 4.5 during the 1990s to
about 3.5 in 2005” (Kiribati Government. 2007. Kiribati 2005 Census, Volume 2: Analytical
Report). Likewise, Infant Mortality Rate has declined to 52 at the 2005 Census compared to
estimated value of 61 in the 1995 Census. And life expectancy at birth is 63.1 years in 2005
Census compared to 62.8 yrs in the 2000 Census.
Preliminary population data on the 2010 Census indicate urbanization at 48.4% of all
population and rural population of 51.6%. If Kiritimati is taken as an urban area because the
livelihoods and services there are quite similar to those on South Tarawa, then urbanization
proportion of the population in the 2010 Census is 53.3%, exceeding the rural population
proportion.
From the three census years intervals, the levels of education achieved by people of working
age group and above may indicate that there is general increase in the number of people aged
15 years and over, who never attended formal schools during the period 1986-1990. This is
because during 1995 Census, there were 2788 persons aged 15 years and over, who never
attended school compared to 4781 of the same category in the 2005 Census. This increase
would mostly be from persons born between 1986 and 1990 and who at the 2005 Census are
aged between 15 and 20 and never attended school. This implies that there are increasingly
more children not attending any schools and more adults not having opportunities to attend
formal schools.
19
The records in the two census (1990 and 1995), show increases in the number of employees
with the level of education above the secondary level in the rest of employment categories.
Since 1995 there has been significant increase in the number of persons with post graduate
degrees up to doctorate qualification.
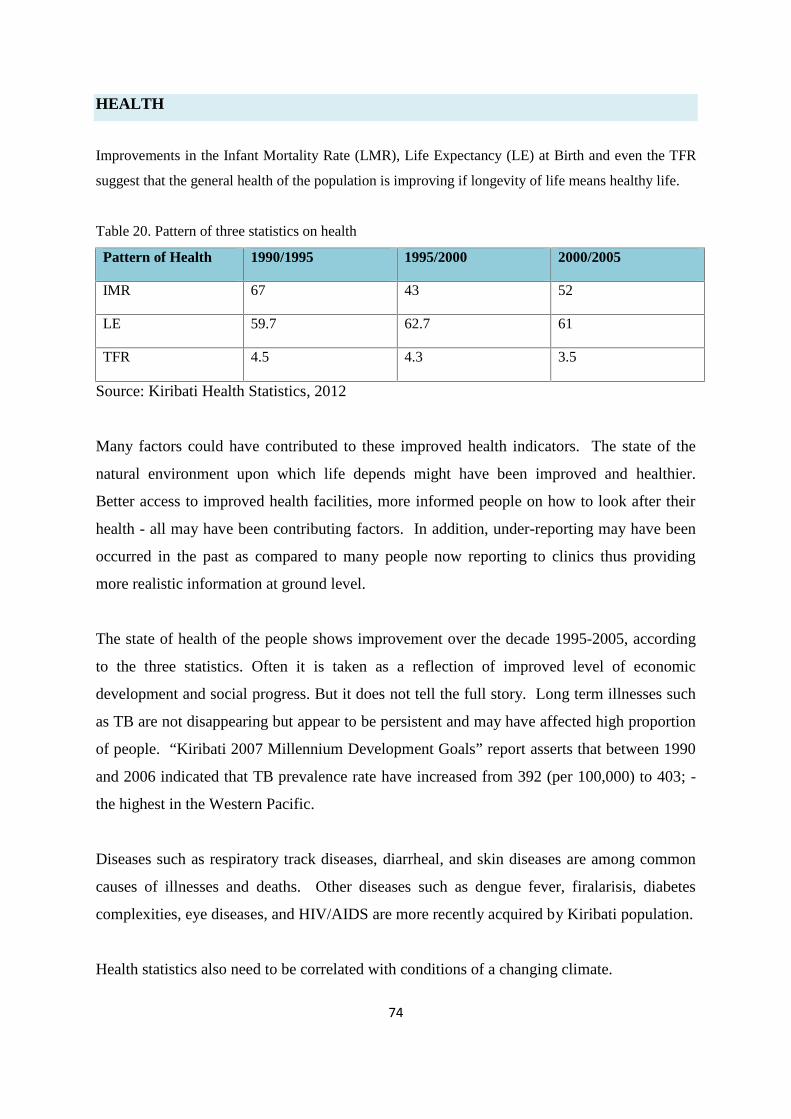
Improvements in the Infant Mortality Rate (IMR), Life Expectancy (LE) at Birth and even
the TFR (Total Fertility Rate) suggest that the general health of the population is improving if
longevity of life means healthy life. This implies that state of health of the people shows
improvement over the decade 1995-2005. The IMR (Infant Mortality Rate) has declined
from 67 in 1990 to 52 in 2005.
Kiribati is still recognized as a Least Developed Country (LDC) in the United Nations
categorization of countries on the basis of their wealth and stages of socio economic
development. The need for external assistance will continue into the foreseeable future. It is
also the precarious economic situation of Kiribati that makes the need of external assistance
unavoidable. Government’s recurrent revenue sources include from income tax and
corporate tax, license fees paid by foreign fishing vessels, import duties, and drawdown from
Revenue Equalization Reserve Fund.
The GDP per capita for Kiribati ranged from $969 in 2001 to $1,085 in 2009. Government’s
sector contribution to GDP shows an increasing trend, indicating more government’s services
have been established and are addressing areas that have received less attention in the past.
Over the period 2001-2009, government’s contributions to GDP have varied between 32%
and 42% but with a positive trend. This suggests that Government’s budgets will remain a
significant contributor to Kiribati’s GDP and its growth.
Unemployment rate is very high. The Kiribati Millennium Goals Report 2007 gives the rates
of unemployment of 78.1% in 2000 and 66.5% in 2005 but notes that the rates are obscured
in Census Reports since people who do not work for wages always regard themselves as self
employed fishermen or farmers. The group that is highly dependent on natural resources and
climate conditions.
20
This is where it brings into relevance the need for more government’s services on areas such
as environment protection and conservation as it also feeds into pillars of sustainable
economic social and livelihood development.
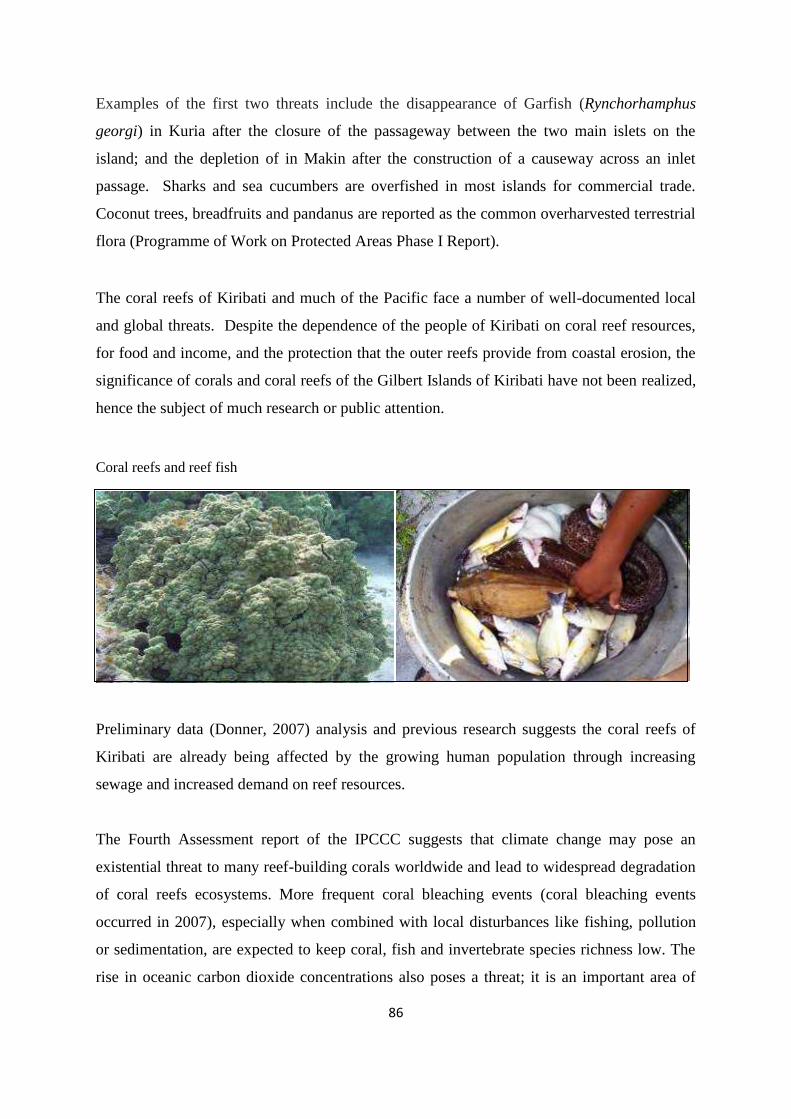
The natural state of biodiversity of Kiribati continues to face threats from several human and
natural induced factors including climate change and sea level rise. Their abundance and
services they harbour will be relied upon in the future for social livelihood and economic
development activities, in addition to the resilience of Kiribati to the adverse effects of
climate change.
The Government of Kiribati has and will continue to implement a number of conservation
projects and initiatives which have linkages to climate change in terms of adaptation and
mitigation measures. These projects are implemented by Ministry of Environment, Lands
and Agricultural Development and also through its Environment and Conservation Division.
Currently these ongoing projects and initiatives include: i) the Phoenix Islands Protected Area
(PIPA), ii) Mangrove Rehabilitation Project which is implemented continuously in
collaboration with an organization in Japan known as the International Society for Mangrove
Ecosystems (ISME), iii) KAP II Mangrove Project, iv) the Ramsar Small Grant Project
funded by the Ramsar Convention on Wetlands and vi) the Programme of Work on Protected
Areas Project.
Given the socio-economic situation of Kiribati’s where the dominant driving sector to
economic growth is government’s service(s) with very few small-scale industries; Kiribati
emissions of greenhouse gases (GHGs) are insignificant when compared to emissions in the
great majority of diversified economy countries.
The primary sector of emission for Kiribati includes Energy, Agriculture and Forestry. The
Inventory compiled for this national communication which uses the IPCC 2006 Guidelines
are for years from 2004 to 2008. The total emission trends for all sectors (for carbon dioxide
and other GHGs) can be viewed in the graph below.
21
Kiribati total emission trends (in Gg) for periods 2004 – 2008
Source: Kiribati SNC Document, 2012
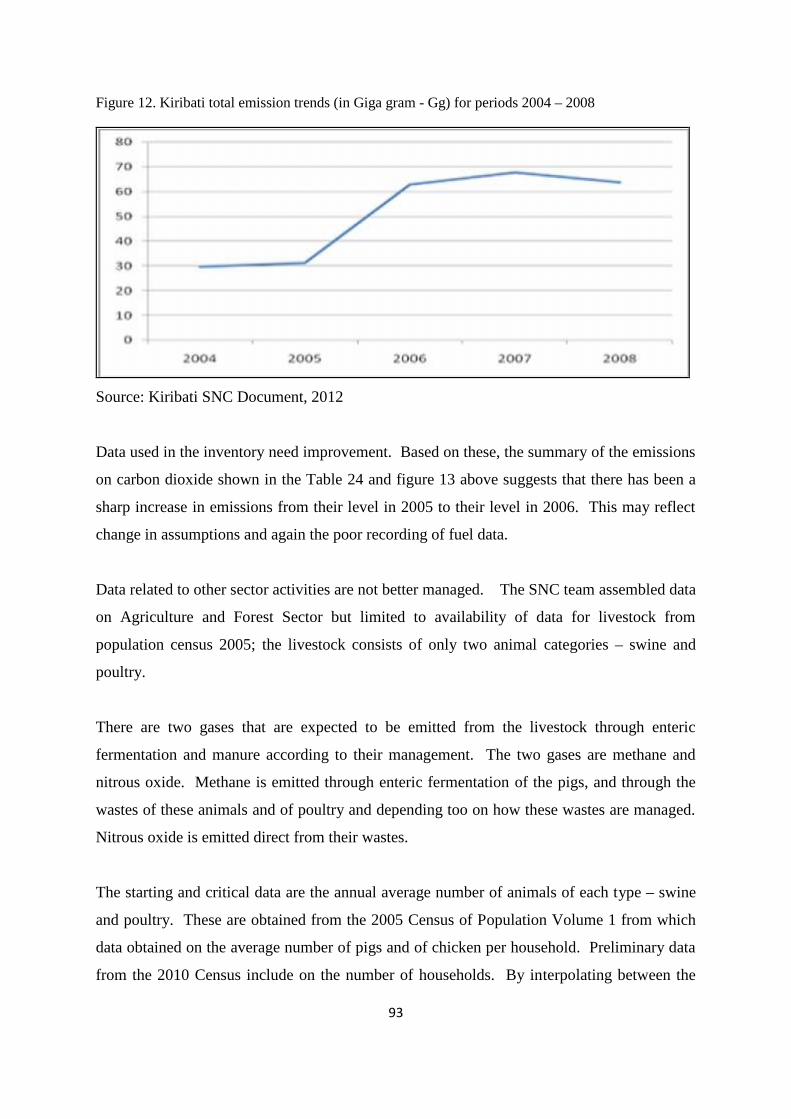
Data on wastes, agriculture livestock are not readily available for the compilation of methane
and nitrous oxide emissions. This report also attempt to construct Inventory for these
particular GHGs from such sectors but constrained by limited data available. However the
Inventory indicates a decreasing trend and insignificant emissions ranging from 0.336754 to
0.647988 Gg for a composite of sectors such as agriculture livestock and waste.
Kiribati has no obligation under the UNFCCC to reduce its emissions of greenhouse gases.
Nonetheless, the Government in its 2012 Policy Statement announced the aspiration to pursue
the 2% reduction of GHGs by 2015. The base year and plans to achieve this target is still
under discussion.
In any event, Kiribati recognises that efforts on emission reduction at the national level would
also mean economic growth and additionally a good indicator of a clean and sustainable
development. In demonstrating this recognition, Kiribati embarked on some small scale
mitigation related activities at the country level. This includes setting up of the Kiribati Solar
Energy Company which provides solar lightings on rural islands and market solar appliances,
trial of bio-fuel, Solar PV Grid initiatives on urban islands. Whilst Kiribati recognises that
fossil fuel underpins economic growth, she will continue to strive through its domestic
policies to explore and implement other renewable sources of energy to alleviate substantial
Government’s high dependence, albeit high expenditures, on imported fossil fuel.
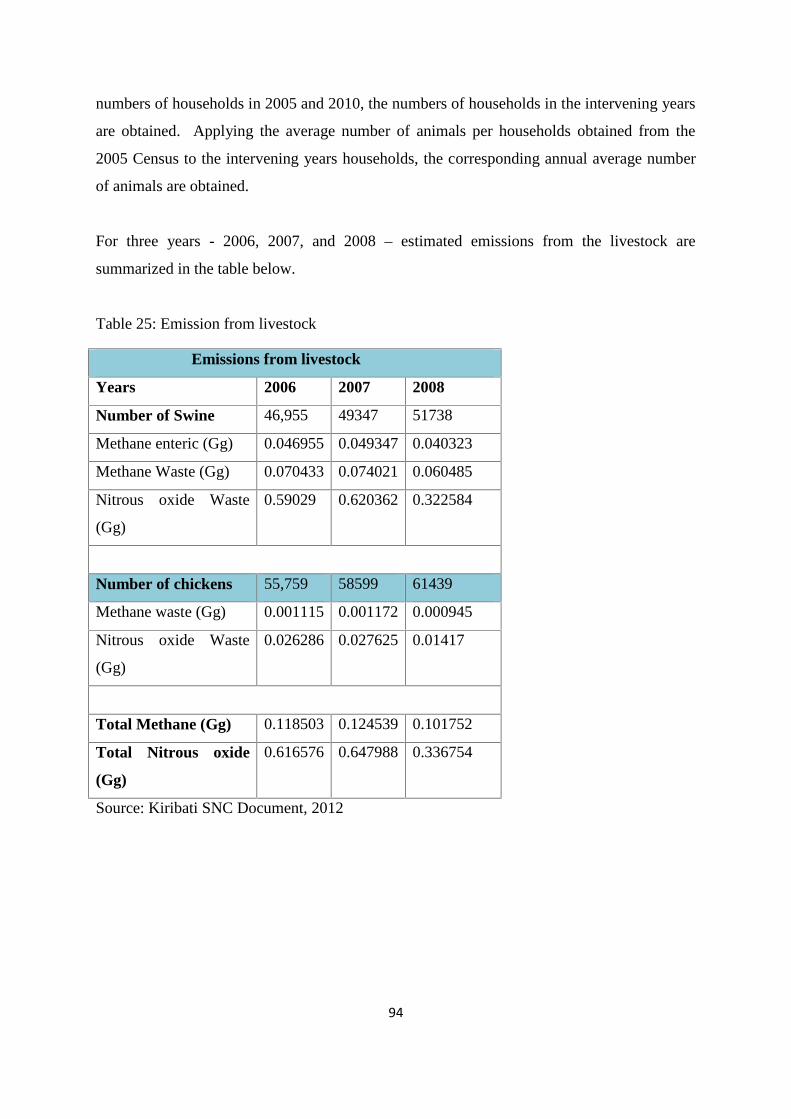
Because of the link between economic development and energy from fossil fuels, this
communication report examines possible correlations between the values of GDP and those
22
of the carbon dioxide emissions from fossil fuels. The correlations of carbon dioxide
emissions from fossil fuels used separately under some of the categories in the inventory of
emission, and the values of GDP contributions from the comparable categories of the
economy was also examined.
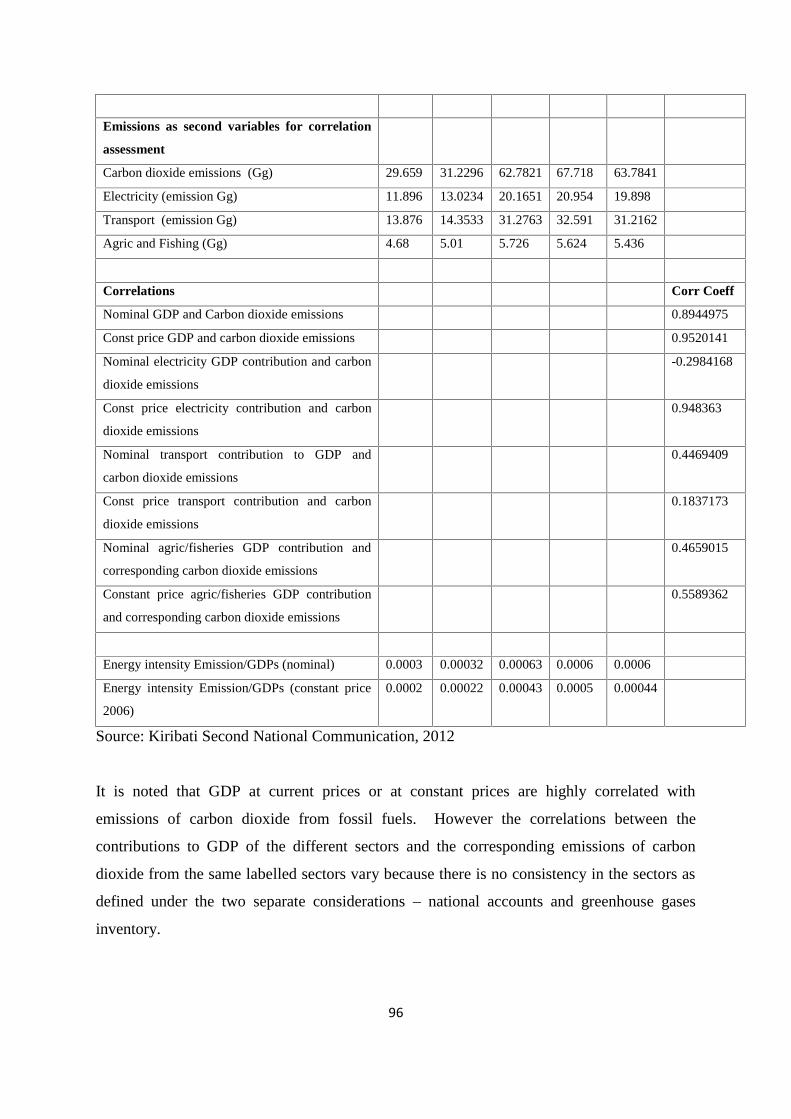
From the analysis, it is noted that GDP at current prices or at constant prices are highly
correlated with emissions of carbon dioxide from fossil fuels. However the correlations
between the contributions to GDP of the different sectors and the corresponding emissions of
carbon dioxide from the same labelled sectors vary because there is no consistency in the
sectors as defined under the two separate considerations – national accounts and greenhouse
gases inventory.
This denotes and further emphasizes the essential role of mitigation, not only, on domestic
development but also spin-off effects to protect the environment and global benefits as well.
This leads to the real need of directing future focus on in-depth mitigation analysis and how
to better facilitate voluntary appropriate mitigation of climate change in the near future.
In the context of climate change, defining “Vulnerability” has been very pivotal to
understanding measures and strategies to respond to the adverse impacts of climate change.
The IPCC defined vulnerability as “the extent to which climate change may damage or harm
a system”. It adds that vulnerability “depends not only on a system’s sensitivity, but also on
its ability to adapt to new climatic conditions”. Kiribati agreed with that definition and
continues to disclose elements of our vulnerability along the spectrum of that definition.
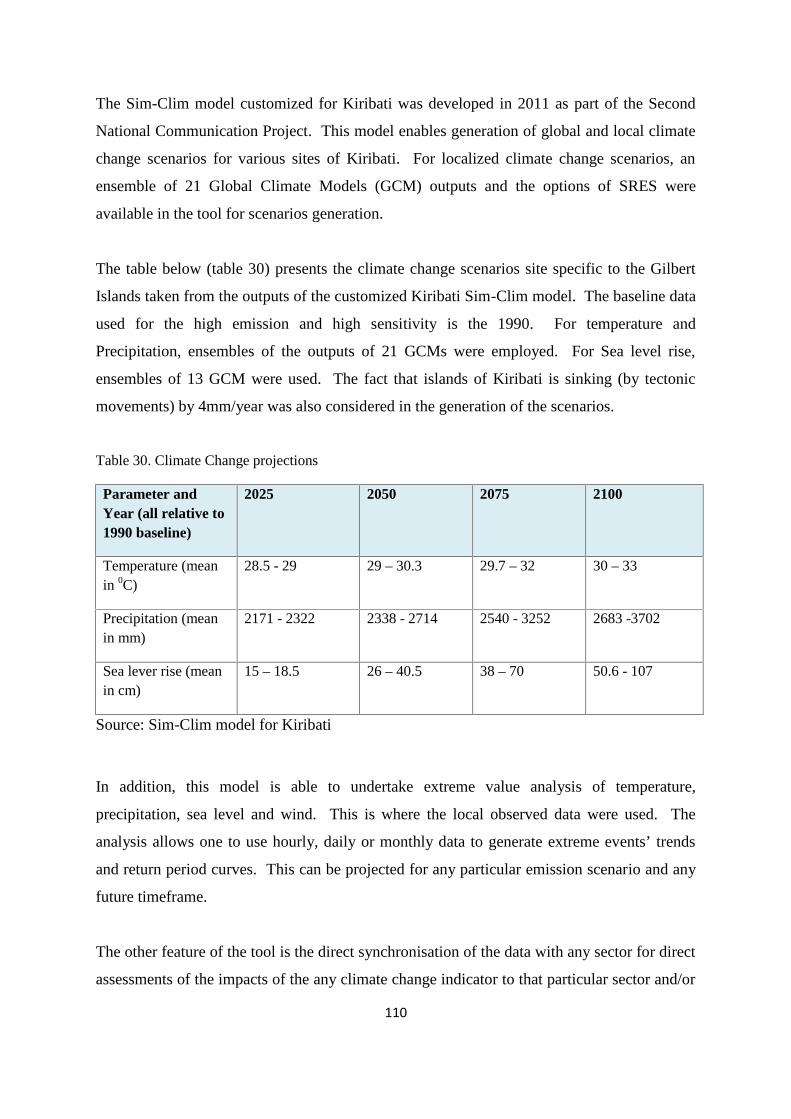
Since the last Initial communication report, there have been several climate modelling &
downscaling efforts aimed at understanding the extent of possible future climates, including
projected sea level rise for Kiribati. The details of these works including different scenarios
from different credible work of several international institutions can be found in the
Vulnerability and Adaptation section of this report.
Based on these scientific undertakings, there is consensus that i) both ambient and sea surface
temperatures will increase in the coming future i.e. from 2025 up to 2100 with a range of
28oC to 32oC; ii) precipitation will also increase on average but this is highly variable
23
spatially and there should be caution on possibility of prolonged devastating drought events;
iii) Sea level is also expected to rise in the future by several centimetres (range from 15cm to
70cm at different time scales). This confirms the notion that climate change in the future
could dangerously damage or harm Kiribati’s various systems.
As mentioned earlier, Kiribati is comprised mostly of coral atolls and therefore the
environment systems that provide sustenance to living population are sensitive to any drastic
or slow onset climatic conditions. Urban centres/settlements are among the many vulnerable
sectors due to socio-economic activities and that climate change could further exacerbate the
impacts.
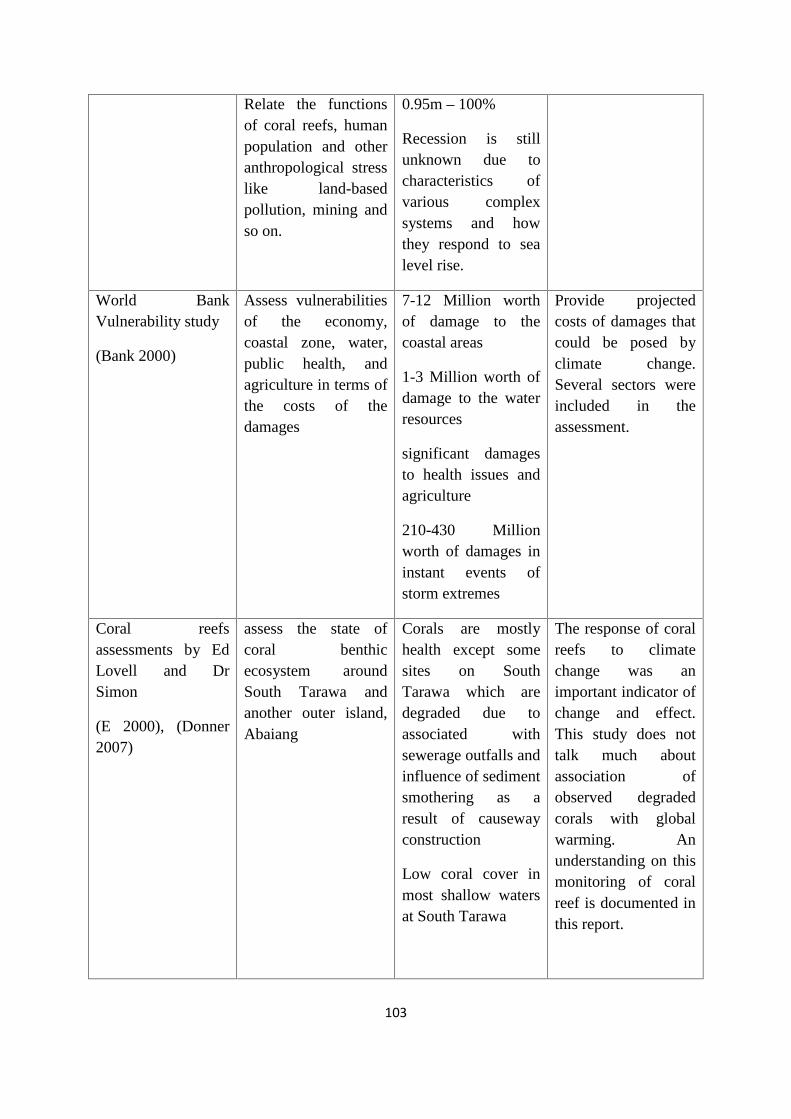
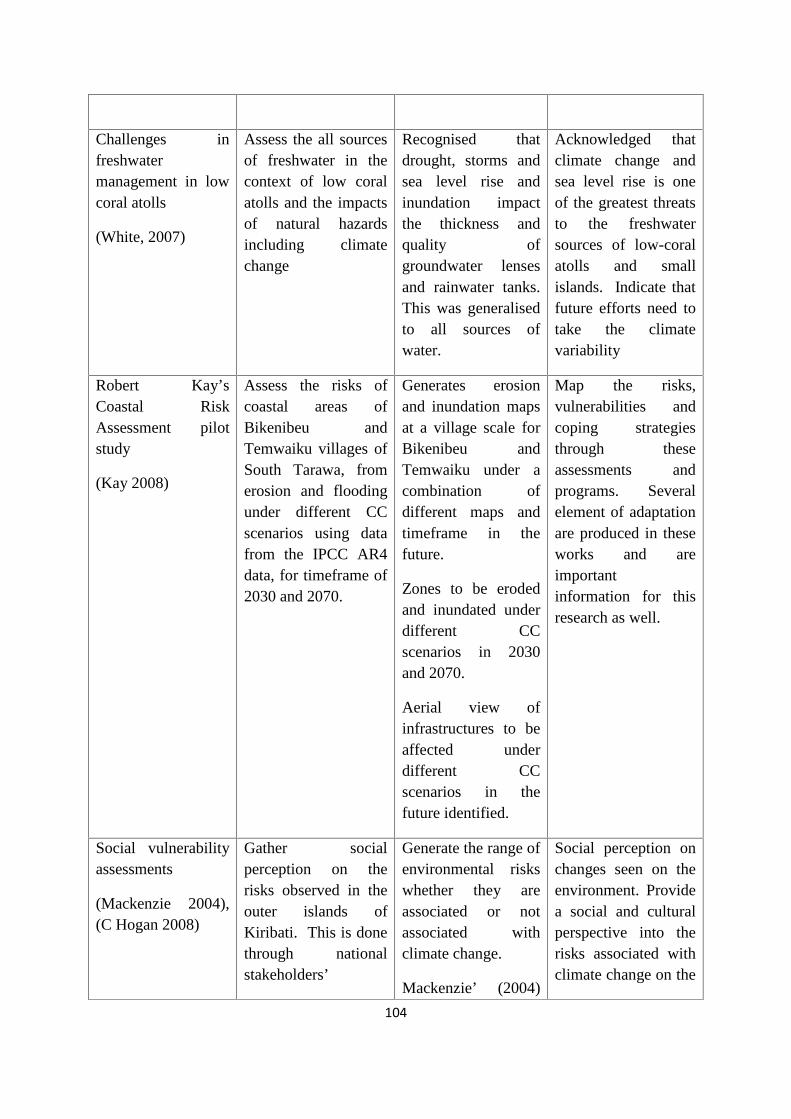
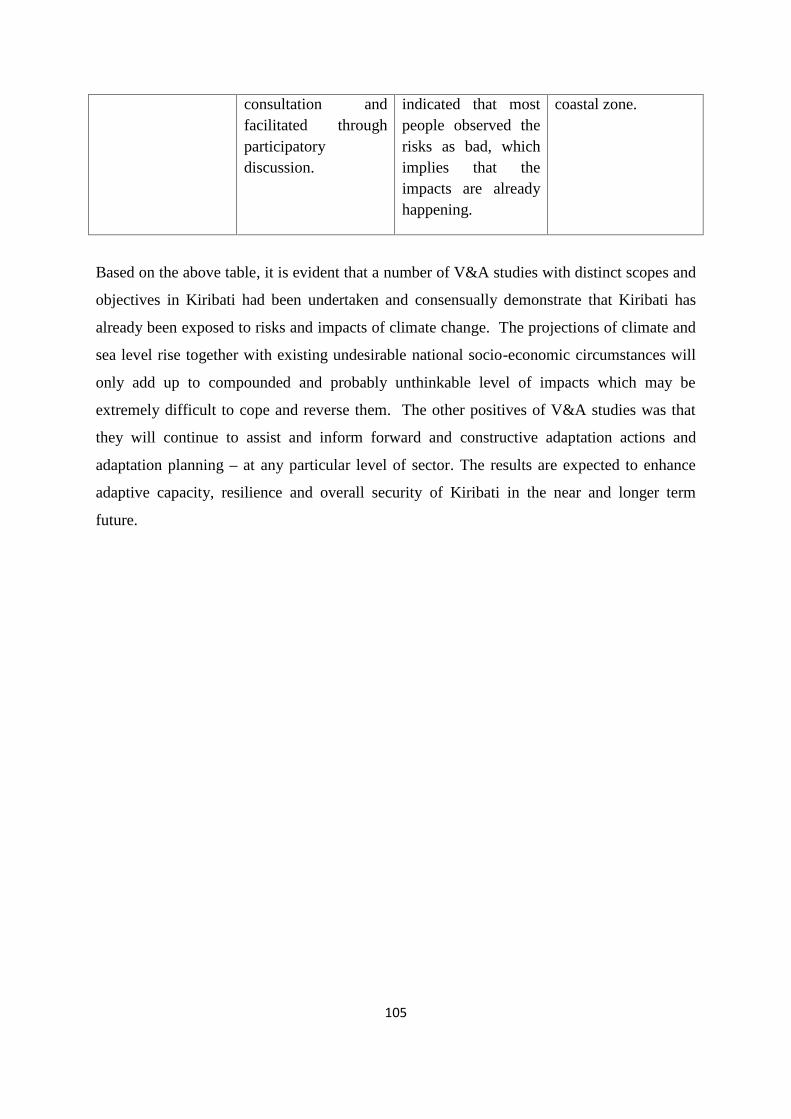
Several sectors and systems have also been examined in past vulnerability assessments and
consensually concluded that Kiribati has already been exposed to risks and impacts of climate
change coupled with additional layers of stress already existed over these systems.
With the low adaptive capacity of island systems compounded by limited resources (spatially
and financially) to deal with the adverse effects of climate change, this report finds
consistency with His Excellency President Tong in his arguments stating that Kiribati and
other low-lying island countries should be perceived within this phenomena as “Vulnerable
countries in the frontline”.
The projections of climate change and existing national fragile circumstances will only add
up to compounded and probably unthinkable level of impacts which may be extremely
difficult to neither cope with, nor reverse it in the longer term future.
The other advantage of V&A studies is that they will continue to assist to inform forward
planning, allowing the identification of suitable adaptation options and develop adaptation
planning strategies` – at any particular level of sector and scope which will be seen to have
results on adaptive capacity, resilience and overall security of Kiribati in the longer term
future.
Adaptation and Risk reduction was recognised by Kiribati as the only solution (with external
support) to safeguarding critical systems and Kiribati’s communities from what could
24
emanate from the scale of our vulnerability, and risks by climate change. This notion was
slowly happening and mainstreamed into sectoral and national planning priorities.
Institutional arrangements, mainstreaming processes e.g. mainstreaming of our CCA and
DRR efforts as being implemented by KAPIII, relevant policy instruments e.g. Climate
Change Policy Framework, etc from various sectors are beginning to emerge and come into
play. As this becomes to set its scene, coordination mechanism including climate change
policy formulation, coordination, capacity mechanism framework and adequate capacity of
sectors are essential elements that need to be in place and function properly as pre-requisites
of this process of effective adaptation.
The process of compiling national communications efficiently requires capacity at sectoral
levels for appropriate data generation and inputting to various components of the report. A
robust and systematically updated data framework, including a working institutional setting
that facilitate this reporting process and also translates the national communication into
policy relevant information tailored to specific needs of national communications as well as
sectoral operatives and priorities, will add value and inform the overall national approach to
respond to climate change in the future.
Kiribati as one of the least developed countries does not have the resources to focus
attention/actions on institutional strengthening needs. Evidently, there were already real
issues that certainly need more attention/assistance and this is one of the core reasons why
most of these institutional and capacity gaps were often sidelined or marginalized. These
characterised the main areas of constraints and gaps in this whole process of preparing
national communication.
Informed decision making requires accurate, consistent and timely provision of advices
which should be based on factual, science-based and rigorous planning. Research capacities
and capabilities in Kiribati that could alleviate this gap were chronically lacking at national
level. Most of the research needs have been supplemented by international and regional
organisations. Though these researches from these institutions are extremely critical to
inform decision making at the national level, they could be very prolonged and untimely.
25
These gaps and constraints will continue to impede the process of preparing subsequent
national communications, implementation of obligations under UNFCCC and overall national
response to climate change, unless addressed.
The Kiribati SNC report ends with proposed project concepts that emerged and were
identified during the preparation of this national communication report. These concepts could
be translated into programmatic proposals with the view of seeking assistance to address
some of the gaps and constraints identified in this report. This is an attempt to complement
on-going national efforts and priorities that have been planned and thought out to also resolve
the multifaceted challenges of responding to climate change.
26
1.0 INTRODUCTION
1.1 PURPOSE
Under Art 12.1 of the United Nations Framework Convention on Climate Change, each
Party is required to communicate to the Conference of the Parties information on its
implementation of the Convention. As a least developed low lying small island country,
Kiribati would not have been able to meet this obligation without financial support from
Annex 1 Parties. This support was received by Kiribati in April 2008, and has enabled
the submission of this Second National Communication to the UNFCCC.
The scope of information and how they are structured in the SNC are based on the
UNFCCC COP Decision 17/CP.8 “Guidelines for the preparation of the national
communications from Parties not included in Annex I to the Convention”, and Kiribati
Initial National Communication 1999.
1.2 PROCESS AND METHODOLOGY
The MELAD, through its Environment and Conservation Division (ECD), is the
implementing Ministry for the SNC Project. The Climate Change Unit within the ECD,
collaborating with other Ministries and stakeholders through Climate Change Study Team
and networking, has been responsible for technical information contained in this SNC
Report.
The Climate Change Unit started off with an initial strength of two employees but it
receives the support it requires from the whole staff of the ECD as and when necessary.
Two more individuals responsible for mitigation and adaptation were later recruited to
the Unit. With that mode of operation, the CCU produced initial elements of information
relevant for inclusion in the SNC while regularly referencing these to the CCST. The
information were then collated to produce an initial draft text of the SNC that finally
developed into the approved SNC.
27
The process and tasks undertaken for the SNC have engaged many individuals from other
Government’s line ministries, NGOs and the private sector. It is the Cabinet who approve
on 31st May 2013 this final version of the SNC. However representatives from wider
sections of the nation were involved from the formulation stage of the project document
to its completion stage.
At the inception workshop for the preparation of the SNC project held in 2006,
participants discussed broad areas of climate change issues that stakeholders consider to
be included in the SNC report. These include i) energy and greenhouse gas inventories to
understand Kiribati dependency on fossil fuels; ii) contribution to climate change and
opportunities to mitigate climate change from the sector; iii) key climatic systems and
their impacts on the economy to understand economic impacts of climate change; and iv)
vulnerability and adaptation to be emphasized in order to heighten the need for global
action to mitigate climate change and for Kiribati to be assisted in its adaptation. These
issues are reflected in the approved SNC project document.
Based on the Initial National Communication, a draft outline of the SNC was adopted by
the CCST. Major topics in the draft outline are greenhouse inventories and mitigation,
vulnerability and adaptation, national circumstances. For each of these topics, a working
group with core members from the CCST was established. The plan was for each of the
thematic working groups to work through its topics from data collection, analysis, and
finally to documenting information for inputting into the SNC Report. This plan was not
as successful as originally anticipated.
The working groups were only able to provide to the CCU copies of some reports related
to coastal vulnerability and adaptation, data on fuel consumptions, livestock, and on
population. Climate data were readily made available to CCU by the Kiribati
Meteorological Services (KMS). Thus leaving analytical work and the documenting of
information to the CCU to work through, which it was doing whilst at the same time
regularly referencing substantial outputs to CCST. This work also used information
available since 2000 as part of national climate change related programs.
28
It was obvious that CCST involvement in the work on the SNC was less than what was
expected. The reasons were that members of the CCST working groups have their own
areas of work and priorities which left them no time to undertake analytical work and
documenting of the information for the SNC. Moreover, high turnover of members who
represent different ministries contributed significantly to the lack of continuity in pursuing
the originally planned work of the Working Groups.
At the very start of the SNC project, CCU realized that some tasks would be very
technical for working groups and CCU to be able to undertake adequately. A framework
on vulnerability and adaptation that can set out what Kiribati wish to understand from any
vulnerability and adaptation assessments is one of these tasks. The CCU and the CCST
over several meetings have been able, however, to develop this type of framework as
highlighted in the Vulnerability and Adaptation Chapter.
There are technical tasks that present technical teams cannot carry on such as GHG
Inventory, so on. For these tasks, international experts were mobilized to conduct an in-
country training workshop of week duration. Members of the CCST and other
government’s employees were able to participate. A training manual was produced, and
moreover, a similar workshop training conducted by one of the trainees was organized for
members of the CCST who did not attend the one conducted by the international expert.
Nevertheless, the SNC Project faced difficulties in getting data on some of the remote
islands of Kiribati such as Kiritimati. Based on information and knowledge gained in
these trainings, the CCU has produced the greenhouse inventories that are included in this
SNC. An alternative approach is to train members of the CCST and ECD so that
whenever they travel to Kiritimati islands, they could conduct data collection for the
GHG Inventory.
But the pace of work had not been up to speed that it was necessary for UNDP to arrange
measures to fast track the project activities. Included was the acquisition of SIMCLIM
tool and demonstrations of how it can be used.
29
1.3 LINKAGES OF SNC TO ENVIRONMENT ACT AND NATIONALDEVELOPMENT PLAN
The SNC Project’s key objective is to strengthen the technical and institutional capacity
of Kiribati to prepare and submit its SNC Document to the UNFCCC. This project also
serves at the same time as a capacity building project for Kiribati to understand how
climate change and its impacts on national circumstances could evolve over time. It also
heightens the logical connection of key climate change issues with the whole components
of the environment.
This logical connection perhaps underpins Presidential allocations of climate change
portfolio with other environmental issues to the Ministry of Environment, Land and
Agriculture Development. “Environment”, according to the Environment Amendment
Act 2007 (which retains the definition in the original Environment Act 2000) defines
“environment” as “natural and social and cultural systems and their constituent parts and
the interaction of their constituent parts, including people, communities and economic,
aesthetic, culture and social factors”. This covers very broad areas of national issues.
All areas of national issues that got into the political agenda of government are reflected in
ministerial portfolios; government (including colonial administration) has been instituted
over a century; and until recently, it was thought that there was nothing left unattended to
form new agenda on “environment”. This has changed recently during the period from
late 1980s to early 1990s, when the concept of sustainable development was developing at
international level which made Kiribati to recognize the need for creating, a ministerial
responsibility for environment for the first time. The three Rio Conventions were
significant in bringing home the message that degradation in the global environment is real
and require actions by all countries at the national and local levels.
The first legislation on the Environment was unanimously adopted in 1999 by Parliament,
and came into force as the Environment Act 1999. Unanimous support for the conservation
and protection of the environment came from the visibility of the deterioration of the urban
environment. Parliamentarians welcomed the Environment Act and thought it was
something that was long overdue.
30
The object of the Act at Section 3 (b) (iv) reflects international agenda on the protection of
the global environment. Issues in the object include “to reduce risks to human health and to
protect prevent the degradation of the environment by all practical means, including the
following - (iv) to comply with and give effect to international and regional conventions
and obligations relating to the environment”. The importance of this section in the object
has been raised in the Environment Amendment Act 2007 to become Section 3 (e); it is no
longer a sub paragraph in the section. Also in this amendment Act, climate change was
integrated into the Environment Impact Assessment checklists and enacted in its
regulations.
The activities of the ECD in pursuing Kiribati obligations under the three Rio Conventions –
UNCBD, UNCCD, and UNFCCC – and other International Environment Agreements to
which Kiribati is a party are consistent with the object of the Environment Act 1999.
Nevertheless there is still more to be done in order for Kiribati to fully comply with its
obligations under the Rio Conventions, not that this means ECD has been able to fully
implement its Environment Act and Regulations. This is due to limited in-country capacity
and resources available to ECD.
With the limited resources, Kiribati has been able to increase established positions within
the ECD from one officer to about ten, within a period of about two decades for which
environment issues have been recognized to form part of the national agenda. The number
of project officers has also increased with the increasing number of activities related to
implementing at the country level commitments under those Multi-lateral Environmental
Agreements.
Although much of the obligations that are pursued are on preparation of plans and
reporting, these reinforce the need to undertake focused actions on implementing the
Environment Act and Regulations that have immediate benefits to the local environment.
These include activities such as pollution control and waste management, development
licensing system utilizing EIA procedures, inspection and monitoring of the enhancement
of key ecosystems such as corals, mangroves and seagrasses.
31
As for the fact that climate change is an economic issue, the SNC needs to be consistent
with national development objectives and strategies. During the period of between the
Initial National Communication and this SNC, there have been three serial National
Development Strategies, each of four year timeframe which is also the life time of the
Government. Economic growth, vibrant economy, sustainable development, distribution of
wealth, improved state of the environment, and people’s needs are recurring themes with
varying importance accorded to each relative to the others in the goals of National
Development Strategies.
Normally, the preparation of National Development Strategies involves consultations
among different line Ministries with the Ministry of finance and economic development as
the leading institution. The NDS is fundamentally the planning document of the
Government. It needs therefore to be consistent with “policy statements” of the present
Government that has been presented to Parliament at its first sitting after the Government
comes into power. Global and international issues bearing on economic development and
environment protection, such as those of the “Millennium Development Goals” and
“Agenda 21”, have drawn the government’s attention to some of the emerging issues e.g.
environment, climate change. These documents play an important role in informing the
formulation of the NDS.
Emerging issues include inadequate and substandard infrastructure in the urban area, high
unemployment rate among young people, and increasing overuse and consequential
degradation of the environment and natural resources. In addition, climate change is
recognized in the NDS2004-2007 as potentially causing costly risks to economic growth as
well as social adverse impacts. Understandably the climate change impacts on natural
systems are first to be experienced by local communities, and because of these impacts on
their natural systems, their livelihood and social organization would be affected in ways
that will produce outcomes that are less than optimal.
NDS 2008-2011 goal is “Enhancing economic growth for sustainable development” that
captures the thrust of Government’s policy statement which is ‘A vibrant economy for the
people of Kiribati’. Climate change is being integrated into the “Environment” Key Policy
Area.
32
2.0 NATIONAL CIRCUMSTANCES
2.1 INTRODUCTION
The purpose of this chapter is to provide bio-physical and socio-economic information and
characteristics that are vital for wider understanding on Kiribati’s vulnerability to the adverse
effects of climate change, its capacity and its options for adaptation, as well as its options for
addressing its GHG emissions within the broader context of sustainable development.
It is acknowledged that the UNFCCC has been the driver for past and existing programmes
related to climate change at the national, regional and international level. The chapter
proceeded with explaining institutional arrangements at the national level that are involved in
the preparation of the Second National Communication, including institutional settings for
planning and managing climate change adaptation and mitigation. The underlying
geographical and important morphology constructs of Kiribati that make it particularly
vulnerable to climate change. The current and future climate outlook with important trends
and elements are also explained. In the last section of this chapter, socio-economic
circumstances is detailed with important association with Kiribati’s vulnerabilities, capacity
and capability; necessary to address adaptation and mitigation at the national level.
The chapter aims to provide updated information on each sub-section of the national
circumstances since the submission of the Initial National Communication in 1999.
Therefore based on the efforts vested in this project, new scientific information or outcomes
of research that have recently produced since 1999 and are related to the sub-sections of
national circumstances was captured and presented in this second national communication.
33
2.2 INSTITUTIONS FOR IMPLEMENTING THE UNFCCC
The Government of Kiribati established climate change institutions, committees, introduced
the climate change adaptation policy and call for the whole of government’s approach to
tackling climate change. This is done so to effectively respond to the adverse effects of
climate change and also complying with its obligations under the UNFCCC.
Presently, there are four leading Ministries that are involved deeply in the overall
implementation of climate change activities (Abeta 2011). These include i)Strategic Risk
Management Unit of the Office of Te Beretitenti, ii) Environment and Conservation Division
of MELAD, iii) Kiribati Meteorology Service of MCTTD1 and iv) Energy Engineering Unit
of MPWU2. The functions assigned to each of the leading government’s agencies that relates
to climate change thematic areas is summarised below. The participation of other sectors in
climate change is expected to grow in the near future.
Table 1: Roles of key institutions in the National Communication process
Leading Agency 2012 Directed Ministerialfunctions by President(powers under section 45and 47 of the Constitution)
Climate Change thematicresponsibility
Office of the Beretitenti –OB
Ministerialcoordination
Cabinet taskforcechairmanship
National crisis Disaster Climate change
adaptation Policycoordination
Policy Development &Coordination
Mainstreaming Adaptation Climate Financing
Ministry of Environment,Lands and AgriculturalDevelopment – MELAD
Climate Change andSea level rise
EnvironmentAdaptation programs
Monitoring State ofEnvironment and CCimpacts
Capacity Building Knowledge management Adaptation Awareness and
Communication International (UNFCCC/KP)
negotiations
1MCTTD – Ministry of Communication, Transport and Tourism Development
2MPWU – Ministry of Public Works and Utilities
34
Focal point for internationaland regional climate changeagencies (SPREP, AOSIS.etc)
Climate Financing Overview of climate change
issues, maintaining climatechange information data andinformation
Source: Data extracted from Kiribati Meteorological Service office
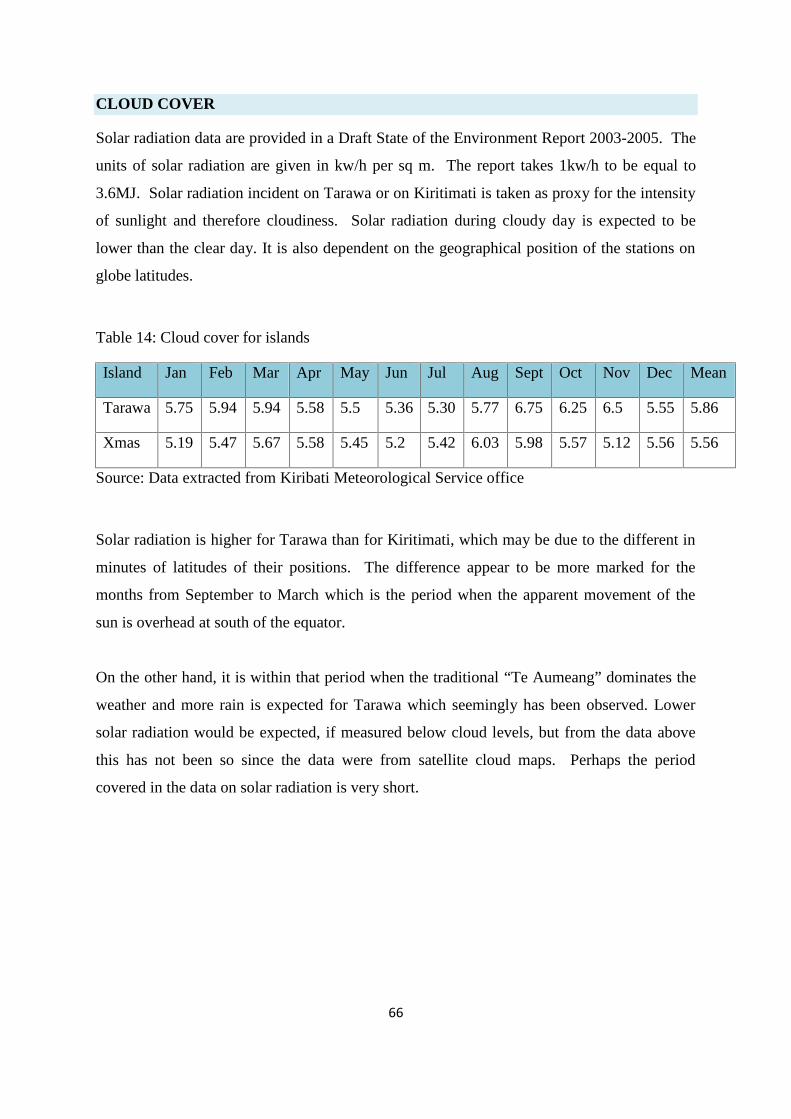
Solar radiation is higher for Tarawa than for Kiritimati, which may be due to the different in
minutes of latitudes of their positions. The difference appear to be more marked for the
months from September to March which is the period when the apparent movement of the
sun is overhead at south of the equator.
On the other hand, it is within that period when the traditional “Te Aumeang” dominates the
weather and more rain is expected for Tarawa which seemingly has been observed. Lower
solar radiation would be expected, if measured below cloud levels, but from the data above
this has not been so since the data were from satellite cloud maps. Perhaps the period
covered in the data on solar radiation is very short.
67
2.5 SOCIO-ECONOMIC CIRCUMSTANCES
2.5.1 DEMOGRAPHIC SITUATION
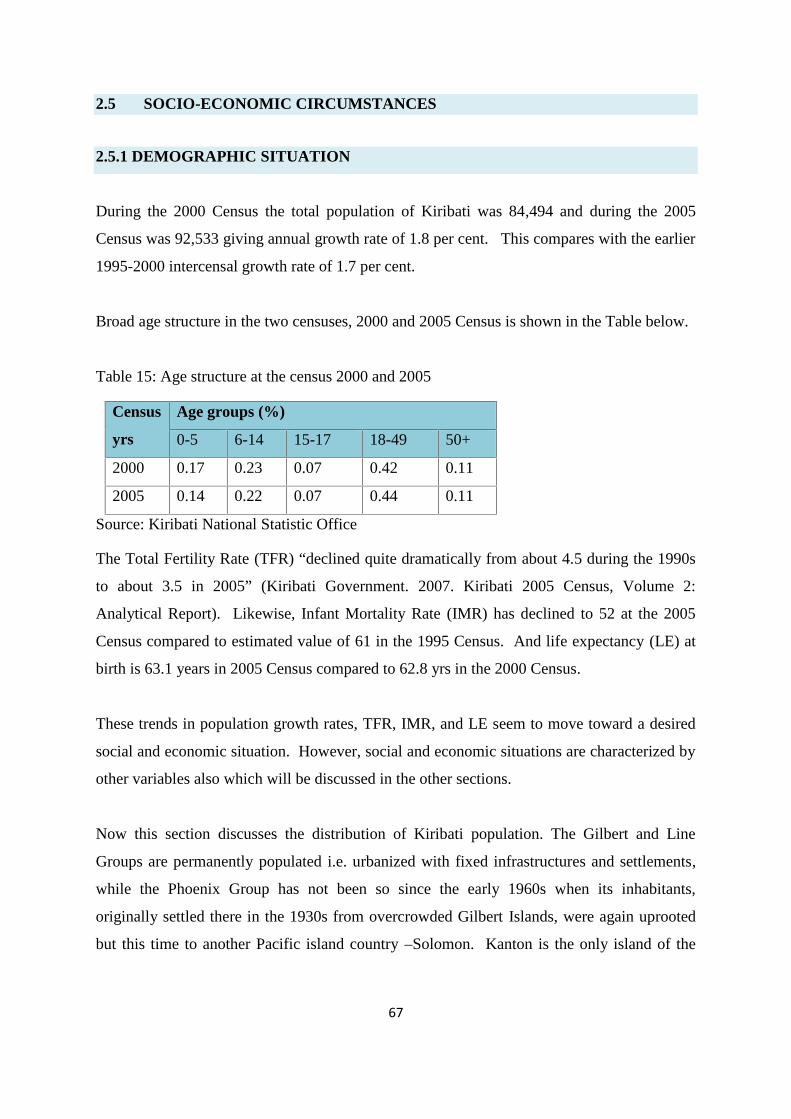
During the 2000 Census the total population of Kiribati was 84,494 and during the 2005
Census was 92,533 giving annual growth rate of 1.8 per cent. This compares with the earlier
1995-2000 intercensal growth rate of 1.7 per cent.
Broad age structure in the two censuses, 2000 and 2005 Census is shown in the Table below.
Table 15: Age structure at the census 2000 and 2005
Census
yrs
Age groups (%)
0-5 6-14 15-17 18-49 50+
2000 0.17 0.23 0.07 0.42 0.11
2005 0.14 0.22 0.07 0.44 0.11
Source: Kiribati National Statistic Office
The Total Fertility Rate (TFR) “declined quite dramatically from about 4.5 during the 1990s
to about 3.5 in 2005” (Kiribati Government. 2007. Kiribati 2005 Census, Volume 2:
Analytical Report). Likewise, Infant Mortality Rate (IMR) has declined to 52 at the 2005
Census compared to estimated value of 61 in the 1995 Census. And life expectancy (LE) at
birth is 63.1 years in 2005 Census compared to 62.8 yrs in the 2000 Census.
These trends in population growth rates, TFR, IMR, and LE seem to move toward a desired
social and economic situation. However, social and economic situations are characterized by
other variables also which will be discussed in the other sections.
Now this section discusses the distribution of Kiribati population. The Gilbert and Line
Groups are permanently populated i.e. urbanized with fixed infrastructures and settlements,
while the Phoenix Group has not been so since the early 1960s when its inhabitants,
originally settled there in the 1930s from overcrowded Gilbert Islands, were again uprooted
but this time to another Pacific island country –Solomon. Kanton is the only island of the
68
Phoenix Group that has few people; they are government’s officials and families living there
as caretakers.
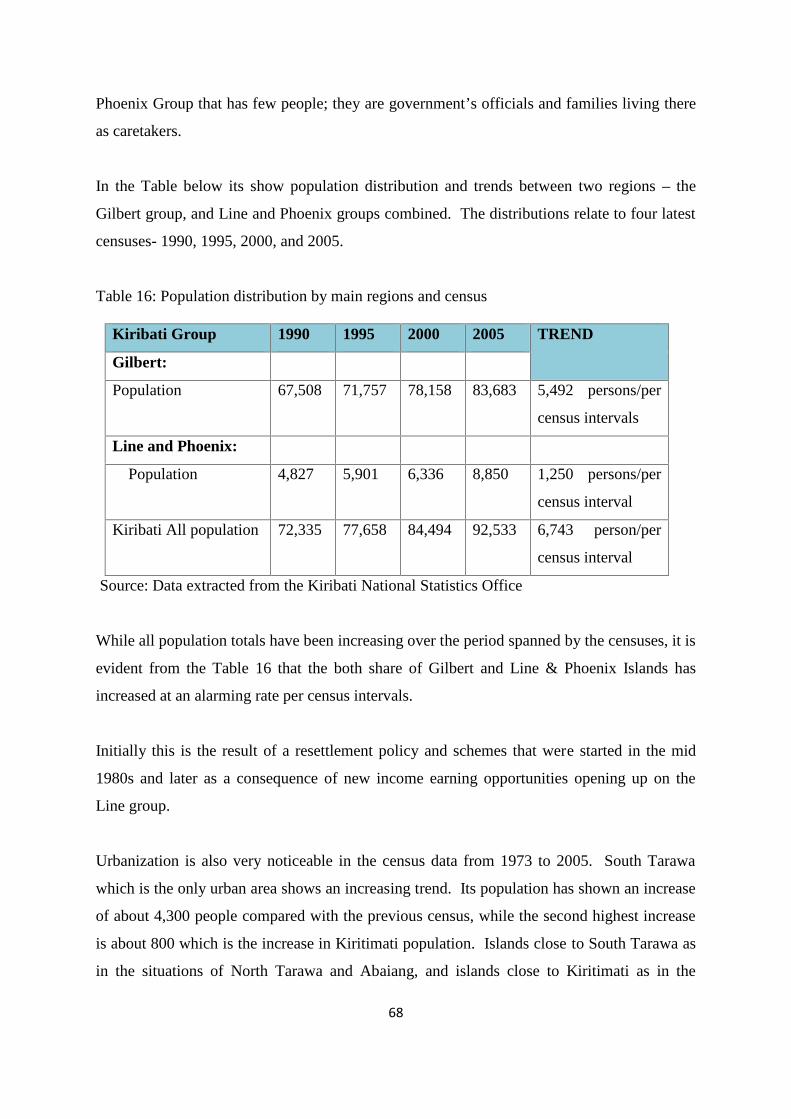
In the Table below its show population distribution and trends between two regions – the
Gilbert group, and Line and Phoenix groups combined. The distributions relate to four latest
censuses- 1990, 1995, 2000, and 2005.
Table 16: Population distribution by main regions and census
Source: Data extracted from the Kiribati National Statistics Office
While all population totals have been increasing over the period spanned by the censuses, it is
evident from the Table 16 that the both share of Gilbert and Line & Phoenix Islands has
increased at an alarming rate per census intervals.
Initially this is the result of a resettlement policy and schemes that were started in the mid
1980s and later as a consequence of new income earning opportunities opening up on the
Line group.
Urbanization is also very noticeable in the census data from 1973 to 2005. South Tarawa
which is the only urban area shows an increasing trend. Its population has shown an increase
of about 4,300 people compared with the previous census, while the second highest increase
is about 800 which is the increase in Kiritimati population. Islands close to South Tarawa as
in the situations of North Tarawa and Abaiang, and islands close to Kiritimati as in the
Kiribati Group 1990 1995 2000 2005 TREND
Gilbert:
Population 67,508 71,757 78,158 83,683 5,492 persons/per
census intervals
Line and Phoenix:
Population 4,827 5,901 6,336 8,850 1,250 persons/per
census interval
Kiribati All population 72,335 77,658 84,494 92,533 6,743 person/per
census interval
69
situation of Tabuaeran, have shown much higher increases (trend) of their population than
those observed for other islands. It is significant that the four most southerly islands in the
Gilbert all experience a decreasing trend of population, which is also the situation of the
population of Banaba. All the rest of the islands have increasing population but not as high
as the urban centres.
However, their population proportions to the total Kiribati population show decreasing trend,
implying the increasing dominance of the populations of Line island groups and the three
islands in the Gilbert group, that is South Tarawa, North Tarawa and Abaiang.
In the 2005 census the urban population, which is the population of South Tarawa, where
43.6% of all Kiribati population is located, and also reflects that this proportion could
increase further in the future. In figure 17 below the trend of urbanization is shown.
Preliminary population data on the 2010 Census indicate urbanization at 48.4% of all
population and rural population of 51.6%. If Kiritimati is taken as an urban area because the
livelihoods and services there are quite similar to those on South Tarawa, then urbanization
proportion of the population in the 2010 Census is 53.3%, exceeding therefore rural
population proportion. High urban population should not however be taken to imply that the
importance of subsistence livelihood based on natural resources is becoming less significant
relative to increasing importance of lifestyle based largely on monetary economy. In urban
areas, a high proportion of the population still depends on available natural resources that are
over harvested. Rural outer islands would still be populated whether or not decentralization
is a conscientious policy of government (given population growth rates).
70
Figure 17: Population trends of urban and rural areas of Kiribati
Sth Tarawa and Rest of Kiribati Trends
y = 0.0254x + 0.2594
y = -0.0254x + 0.7406
00.10.20.30.40.50.60.70.8
1973 1978 1985 1990 1995 2000 2005
Census Years
Prop
ortio
n to
all
Kirib
ati
popu
latio
n
Rest of Kiribati
South Tarawa
Linear (SouthTarawa)Linear (Rest ofKiribati)
Source: Data extracted from National Statistics Office for Kiribati SNC, 2012
71
EDUCATION AND SKILLS
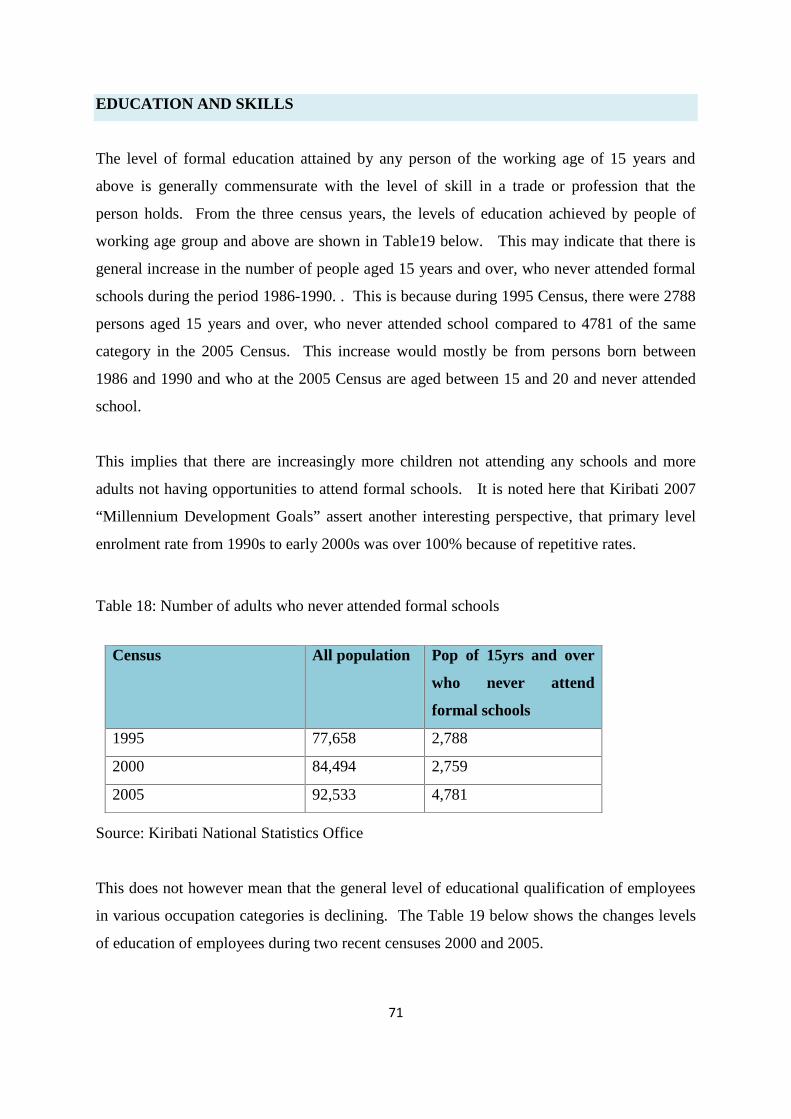
The level of formal education attained by any person of the working age of 15 years and
above is generally commensurate with the level of skill in a trade or profession that the
person holds. From the three census years, the levels of education achieved by people of
working age group and above are shown in Table19 below. This may indicate that there is
general increase in the number of people aged 15 years and over, who never attended formal
schools during the period 1986-1990. . This is because during 1995 Census, there were 2788
persons aged 15 years and over, who never attended school compared to 4781 of the same
category in the 2005 Census. This increase would mostly be from persons born between
1986 and 1990 and who at the 2005 Census are aged between 15 and 20 and never attended
school.
This implies that there are increasingly more children not attending any schools and more
adults not having opportunities to attend formal schools. It is noted here that Kiribati 2007
“Millennium Development Goals” assert another interesting perspective, that primary level
enrolment rate from 1990s to early 2000s was over 100% because of repetitive rates.
Table 18: Number of adults who never attended formal schools
Source: Kiribati National Statistics Office
This does not however mean that the general level of educational qualification of employees
in various occupation categories is declining. The Table 19 below shows the changes levels
of education of employees during two recent censuses 2000 and 2005.
Census All population Pop of 15yrs and over
who never attend
formal schools
1995 77,658 2,788
2000 84,494 2,759
2005 92,533 4,781
72
Table 19: Education levels of the workforce at two recent censuses 2000 and 2005
Occupation
category
Census
yr
Level of education achieved
None Prim Secondary Certificate Diploma Degree Post grad
degree
PhD
Agric and
Fisheries
2000 1 38 64 0 3 1 1 0
2005 92 488 253 4 1 0 0 0
Legislators
and Snr
Officials
2000 7 39 305 6 18 37 12 1
2005 2 146 316 34 38 68 44 2
Professionals 2000 7 109 848 12 30 38 8 0
2005 21 254 1654 261 133 138 17 2
Technicians
and
Associate
Professionals
2000 11 151 653 2 6 4 1 0
2005 14 259 772 74 37 16 11 0
Clerks 2000 0 60 766 4 5 3 3 0
2005 21 215 1438 91 19 21 4 1
Service
workers
2000 46 454 584 0 2 2 0 0
2005 108 945 1165 24 9 3 3 0
Trade
workers
2000 31 294 273 0 1 0 1 0
2005 49 460 480 27 11 3 0 1
Plant and 2000 22 225 184 0 0 3 0 0
73
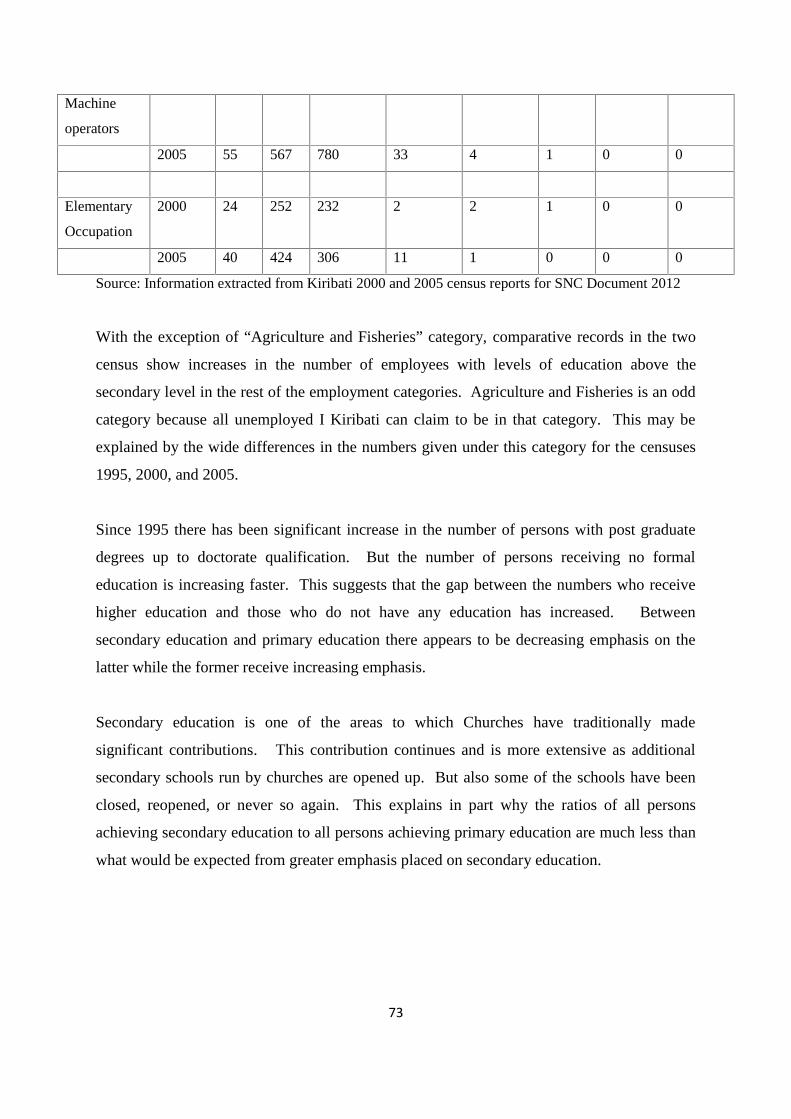
Source: Information extracted from Kiribati 2000 and 2005 census reports for SNC Document 2012
With the exception of “Agriculture and Fisheries” category, comparative records in the two
census show increases in the number of employees with levels of education above the
secondary level in the rest of the employment categories. Agriculture and Fisheries is an odd
category because all unemployed I Kiribati can claim to be in that category. This may be
explained by the wide differences in the numbers given under this category for the censuses
1995, 2000, and 2005.
Since 1995 there has been significant increase in the number of persons with post graduate
degrees up to doctorate qualification. But the number of persons receiving no formal
education is increasing faster. This suggests that the gap between the numbers who receive
higher education and those who do not have any education has increased. Between
secondary education and primary education there appears to be decreasing emphasis on the
latter while the former receive increasing emphasis.
Secondary education is one of the areas to which Churches have traditionally made
significant contributions. This contribution continues and is more extensive as additional
secondary schools run by churches are opened up. But also some of the schools have been
closed, reopened, or never so again. This explains in part why the ratios of all persons
achieving secondary education to all persons achieving primary education are much less than
what would be expected from greater emphasis placed on secondary education.
Machine
operators
2005 55 567 780 33 4 1 0 0
Elementary
Occupation
2000 24 252 232 2 2 1 0 0
2005 40 424 306 11 1 0 0 0
74
HEALTH
Improvements in the Infant Mortality Rate (LMR), Life Expectancy (LE) at Birth and even the TFR
suggest that the general health of the population is improving if longevity of life means healthy life.
Table 20. Pattern of three statistics on health
Pattern of Health 1990/1995 1995/2000 2000/2005
IMR 67 43 52
LE 59.7 62.7 61
TFR 4.5 4.3 3.5
Source: Kiribati Health Statistics, 2012
Many factors could have contributed to these improved health indicators. The state of the
natural environment upon which life depends might have been improved and healthier.
Better access to improved health facilities, more informed people on how to look after their
health - all may have been contributing factors. In addition, under-reporting may have been
occurred in the past as compared to many people now reporting to clinics thus providing
more realistic information at ground level.
The state of health of the people shows improvement over the decade 1995-2005, according
to the three statistics. Often it is taken as a reflection of improved level of economic
development and social progress. But it does not tell the full story. Long term illnesses such
as TB are not disappearing but appear to be persistent and may have affected high proportion
of people. “Kiribati 2007 Millennium Development Goals” report asserts that between 1990
and 2006 indicated that TB prevalence rate have increased from 392 (per 100,000) to 403; -
the highest in the Western Pacific.
Diseases such as respiratory track diseases, diarrheal, and skin diseases are among common
causes of illnesses and deaths. Other diseases such as dengue fever, firalarisis, diabetes
complexities, eye diseases, and HIV/AIDS are more recently acquired by Kiribati population.
Health statistics also need to be correlated with conditions of a changing climate.
75
2.5.2 ECONOMIC SITUATION
Kiribati is recognized as a Least Developed Country (LDC) in the United Nations
categorization of countries on the basis of their wealth and stages of socio economic
development. The UNFCCC acknowledge that special considerations for funding and
transfer of technologies should be given to LDC needs.
Accordingly, Kiribati deserves assistance from UNFCCC processes and international funds
that are established, so as for Kiribati to be able to meet the challenges of climate change.
These challenges include the impacts of sea level rise, increasing frequency and severity of
storms and storm surges on crucial islands ecological resources such as coastal areas, ground
water lens, traditional agricultural plantations and systems. Assistance to Kiribati has been
forthcoming since 1990, with significant increases during the recent decade.
There is a need to investigate the level of assistance that Kiribati had received either directly
from the UNFCCC process or indirect through bilateral arrangements. This external
assistance must also be fully understood in terms of which sectors and categories they have
been vested into e.g. technical assistance, capacity building, and investments. These are
important baseline climate finance information that is fundamental to inform Kiribati on
notion of climate finance as should “new and additional” to aid funding. These are current
issues that need to be ascertained in the subsequent Third National Communication.
There is no doubt that the need for external assistance will continue into the foreseeable
future (Kiribati had preliminary assessed it financial needs with respect to climate change and
was quite substantial). This is supported by anticipated increase in the severity of the impacts
of sea level rise and storms on the coastal zone where development and settlement
infrastructures concentrate. Ground water lenses are most vulnerable as well. And
ecosystems and biodiversity need protecting from slow onsets, and creeping or unexpected
impacts of climate change.
Due to its poor economic situation the need for external assistance seems to be unavoidable
in Kiribati. Main sources of Government’s recurrent revenue come from income tax and
corporate tax, license fees paid by foreign fishing vessels, import duties, and drawdown from
76
Revenue Equalization Reserve Fund (RERF). The RERF is one of Kiribati’s foreign
investments set up from sales/tax of phosphate mining in Banaba. The purpose of RERF is to
cover shortfall on revenue during the post phosphate period. The amounts of drawdown
varied from year to year. However, in most recent years the amounts have been significant to
meet in part, new or increased amounts of public expenditures dealing with various issues.
The figure 10 below highlights the main fabrics of the economy of Kiribati with the category
“other” as mainly Government and some private services. The detail of GDP by various
industries in Kiribati is shown in the table below.
Table 21: Kiribati GDP by Industry for 2011 ($A'000) – revised June 2012
Industry 2011eAgriculture & Fishing 43,009Mining and Quarrying 45Manufacturing 9,461Electricity, Gas & Water Supply 1,700Construction 2,250Wholesale & Retail trade 12,539Hotel & Restaurants 1,069Transport and Storage 9,431Communications 5,004Financial Intermediation 8,623Real Estate (housing business) 18,295Business Services (3) 1,618Government sector 47,494Other Community, Social & Personal Services 2,914
Less imputed bank service charges (7,000)GDP at factor cost 156,453Plus taxes on products 20,082less subsidies (8,583)Nominal GDP at market prices 167,952 Nominal GDP growth rate 2.4%
Population 103,197
Nominal GDP per capita 1,627
Source: Kiribati National Statistic Office
77
Figure 10. Contributions to the national economy of some key sectors in 2005
Source: Hay and Onorio, 2006
At present, there is however no intention by Government to use local resources such as
drawdown from the RERF for any climate change activities. However, given the severity of
these climate change associated impacts – the Government may have committed significant
amount of local resources (through normal budgeting and other funds already). This notion
of externally financing of the climate change impacts was reflected in its Climate Change
Policy 2005 whereby, it states that “climate change needs will be met as far as possible by
external funds”. On the other hand, Kiribati makes in kind contributions to support project
based activities on climate change such as SNC or Kiribati Adaptation Project but these
contributions are not clearly identified, valued, and allocated. There is also need to include
project funds in government’s multiyear (3yrs) budget and in annual operational planning and
budgets of relevant ministries that implement the project activities.
If Kiribati needs to be able to address climate change, in particular adaptation, and if the need
are to be met from multinational financial mechanisms then there is the need to emerge a
workable arrangement for cooperation in the implementation of project based activities,
between international implementing agencies and Kiribati. Kiribati is going through this
process in its association with the WB as the Implementing Agency for KAP.
Any mal-adaptation or misplaced focused area selected for adaptation will have adverse
repercussions in Kiribati’s economy. Hence, it is critically important that these climate
78
change projects are nationally driven but not dictated by development partners. Large
portions of adaptation funds may end up in the production of complex reports which may
never be used, or in excessive management services for the funds, while on the other hand a
much needed physical work could be starved of funds. Any adaptation need that can be
identified now but which is not addressed immediately will at some later time be so critical as
to demand urgent action at a much higher costs. It may also turn out that the impacts of
climate change that originally generate such adaptation need have been so aggravated,
widespread, severer, and irreversible that there is no longer any adaptation option to consider
- may be too expensive or difficult to secure funding. In such situation, it is a fact that
climate change is not only an environmental issue but also an economic issue which needs to
be highlighted and addressed.
Kiribati is a LDC. The level of formal education and skill of the general population is low;
economic development opportunities are limited, and the national economy is open and
subject to global economic fluctuations. Since 2002, GDP per capita have remained rather
constant and annual growth rates do not suggest any sustained long term positive trend. This
could be a reflection of the state of the global economy. The table below shows the rather
unhealthy socio economic circumstances over the last decade.
Source: Kiribati Second National Communication, 2012
This framework was developed to be used as a manual for all Government’s stakeholders
particularly those who are members of the National Climate Change Study Team. The
Climate Change Unit of the Environment and Conservation is the key responsible agency
mandated to advocate and integrate this method into work programs of key sectors of
Government.
101
Although, the framework was placed to build national capacity on V&A, it is recognized that
technical capacity building on climate change science, modelling, in-depth understanding on
models used in studies and others are necessary to increase competencies of local sectors to
understand and contribute in any V&A assessments. This is considered one of the technical
capacity building needs for members of CCST on this particular subject.
102
5.2 V&A STUDIES IN KIRIBATI SINCE THE INITIAL NATIONALCOMMUNICATIONS
Since the submission of the Initial National Communication in 1999, there had been observed
growing interests by academic and international organisations on Kiribati future
vulnerabilities to the adverse impacts of climate change. This was evidenced by the number
of Vulnerability and risk assessment conducted on specific sectors in Kiribati. These studies
form part of a critical body of information that inform not only the Government of Kiribati in
terms of their adaptation approaches but also the regional and international communities.
These vulnerability studies generate useful baseline information and also triggers adaptation
programs and projects formulated as a result of the findings of such studies. The details of
these vulnerability studies and other climate change assessment studies on specific sectors
were summarised below.
Table 27. Matrix of V&A studies and their details undertaken in Kiribati
Study reference Coverage of studies
Scope of assessmentand geographicallocation
Degree of impact(s) Implication
Chiaoxing He’sstudy
(He 2001)
Assess vulnerabilitiesof Bairiki andBikenibeu to sea levelrise.
Emphasis of the studyis the overtopping andflooding impact onthe sites under threesea level scenarios of0.3m, 0.5m and0.95m during a 14-year storm eventinterval.
Evaluate tides, waterlevels data
Flooding andovertopping event forthe two sites underdifferent scenarios
Bikenibeu
0.3m – 53%
0.5m – 71%
0.95m – 100%
Bairiki
0.3m – 17%
0.5m – 35%
Quantitativeassessment of sealevel rise onimportant villages ofSouth Tarawa.Provide anunderstanding on thelevel of impact of sealevel rise on thecoasts of the villagesunder climate change.
103
Relate the functionsof coral reefs, humanpopulation and otheranthropological stresslike land-basedpollution, mining andso on.
0.95m – 100%
Recession is stillunknown due tocharacteristics ofvarious complexsystems and howthey respond to sealevel rise.
World BankVulnerability study
(Bank 2000)
Assess vulnerabilitiesof the economy,coastal zone, water,public health, andagriculture in terms ofthe costs of thedamages
7-12 Million worthof damage to thecoastal areas
1-3 Million worth ofdamage to the waterresources
significant damagesto health issues andagriculture
210-430 Millionworth of damages ininstant events ofstorm extremes
Provide projectedcosts of damages thatcould be posed byclimate change.Several sectors wereincluded in theassessment.
Coral reefsassessments by EdLovell and DrSimon
(E 2000), (Donner2007)
assess the state ofcoral benthicecosystem aroundSouth Tarawa andanother outer island,Abaiang
Corals are mostlyhealth except somesites on SouthTarawa which aredegraded due toassociated withsewerage outfalls andinfluence of sedimentsmothering as aresult of causewayconstruction
Low coral cover inmost shallow watersat South Tarawa
The response of coralreefs to climatechange was animportant indicator ofchange and effect.This study does nottalk much aboutassociation ofobserved degradedcorals with globalwarming. Anunderstanding on thismonitoring of coralreef is documented inthis report.
104
Challenges infreshwatermanagement in lowcoral atolls
(White, 2007)
Assess the all sourcesof freshwater in thecontext of low coralatolls and the impactsof natural hazardsincluding climatechange
Recognised thatdrought, storms andsea level rise andinundation impactthe thickness andquality ofgroundwater lensesand rainwater tanks.This was generalisedto all sources ofwater.
Acknowledged thatclimate change andsea level rise is oneof the greatest threatsto the freshwatersources of low-coralatolls and smallislands. Indicate thatfuture efforts need totake the climatevariability
Robert Kay’sCoastal RiskAssessment pilotstudy
(Kay 2008)
Assess the risks ofcoastal areas ofBikenibeu andTemwaiku villages ofSouth Tarawa, fromerosion and floodingunder different CCscenarios using datafrom the IPCC AR4data, for timeframe of2030 and 2070.
Generates erosionand inundation mapsat a village scale forBikenibeu andTemwaiku under acombination ofdifferent maps andtimeframe in thefuture.
Zones to be erodedand inundated underdifferent CCscenarios in 2030and 2070.
Aerial view ofinfrastructures to beaffected underdifferent CCscenarios in thefuture identified.
Map the risks,vulnerabilities andcoping strategiesthrough theseassessments andprograms. Severalelement of adaptationare produced in theseworks and areimportantinformation for thisresearch as well.
Social vulnerabilityassessments
(Mackenzie 2004),(C Hogan 2008)
Gather socialperception on therisks observed in theouter islands ofKiribati. This is donethrough nationalstakeholders’
Generate the range ofenvironmental riskswhether they areassociated or notassociated withclimate change.
Mackenzie’ (2004)
Social perception onchanges seen on theenvironment. Providea social and culturalperspective into therisks associated withclimate change on the
Impact on coralreef (e.g.bleaching),changes to fishmigration, fishbreedingpatterns, carbonionconcentrationsetc leading topotentialdecrease in somefish stocks(Hoegh-Guldberg 2011)
- Fish are astaple food inKiribati
- Fish stocks inTarawa Lagoonare alreadydwindling fromover fishingand pollution(Beets 2000)
3 These results are based on an assumption that the correlation of temperature change stated in Kolstad andJohannson 2011 can be replicated for Kiribati and Vanuatu. As the results have not considered any othervariables (e.g. development pressures, health etc) they are indicative only.
Source: adapted from UNESCO report on Children and Climate Change, 2011
Kiribati with most of its communities do not have sufficient space to avoid risks, projected
increased sea level rise will have direct and indirect consequences on their livelihood. Some
of the examples of such communities in Kiribati include, Betio – densely populated islet and
Tebunginako, Abaiang – community had had to relocate due to coastal erosion over past few
decades (Reed, 2011). - REED, B. (2011) Climate Change And Faith Collide In Kiribati. National
Public Radio, available from http://www.npr.org/2011/02/16/133650679/climate-change-and-faith-
collide-in-kiribati?ft=3&f=133681251
162
Reiterating impacts under coastal zone, mapping of sea level rise impacts (out to 2100) has
been undertaken for parts of Tarawa, although the resolution does not clearly show hospitals
and schools in the publication (Elrick, Kay et al. 2009). The impact mapping undertaken by
Elrick et al. (2009) identifies that under an IPCC high scenario (A1FI) the villages in South
Tarawa with high and extreme risks include Antenon, Antebuka, Eita, Bangantebure,
Bikenibeu and Temaiku (although the study also recommended the need for better elevation
data). High end sea level rise projections will challenge the very existence of the country.
The change in the state of society’s livelihood due to climate change will also incur the
gradual change in the public health. There is a strong correlation between these changing
climate patterns and health trends.
According to NCCHAP (2011), it stated that night-time temperatures are projected to
increase more markedly than day-time temperatures. This change will have direct effects on
health (for instance, outdoor workers will be exposed more frequently to extreme heat).
Increased force of floods and storms will increase risk of injuries. The changes will also
favour many disease-causing micro-organisms (for instance, those responsible for food
poisoning).
Heavy downpour of rain and extreme waves' action would make it more likely for bacterial
and chemical contaminants to be washed into reservoirs for drinking water. The forecast
climate conditions (increased temperatures and heavier rainfall) will boost mosquito breeding
and increase the potential for transmission of diseases such as dengue fever. Note that these
statements are all framed here in terms of probabilities. Whether or not the potential for harm
is actually translated into outbreaks of disease will depend on factors other than climate
change, such as the presence of mosquito breeding sites close to homes, protection of
drinking water sources, levels of food hygiene, crowding, and housing quality. This means
climate change could harm or exacerbate existing health risks that have been due to domestic
infrastructures’ inconveniences. Some of these include the lack of proper toilet facility for
population of Kiribati and good and reliable portable water sources (refer to figures 33 and
34).
There are several intertwined reasons for the absence of these infrastructures and systems.
163
Figure 32. Population distribution on sources of portal water sources in Tarawa – Kiribati
Source: Kiribati Climate Change and Health Action Plan 2011.
Figure 33. Toilet facilities in Tarawa Island, Kiribati and population distribution over them
Source: Kiribati Climate Change and Health Action Plan 2011.
164
5.7 ADAPTATION OPTIONS AND MAINSTREAMING CLIMATE CHANGEADAPTATION INTO NATIONAL DEVELOPMENT
The concept of adaptation was first introduced in Kiribati through preparation of National
Adaptation Program of Action project and coincided with the execution of the Kiribati
Adaptation program in 2004. This was relatively the time when adaptation as a subject and
as a process was still not clearly understood by many key sectors.
In view of the felt impacts reported and documented as referred to above and coincidence of
implementing these two similar Climate Change Adaptation - CCA projects; the Government
was able to craft the nation’s institutional approach to adaptation. This give rise to the
establishments of committees and how these functioned within the existing Government’s
overall administrational configuration – climate change governance. This can be depicted in
the figure 35 below.
Figure 34. Climate change institutional settings in Kiribati
Source: Project Appraisal Document of KAP II, 2007
The National Adaptation Steering Committee (NASC), which was established during KAP-I,
is responsible for promoting and monitoring coordination among project activities across the
165
implementing agencies, including the utilization and sharing of technical expertise. The
NASC is chaired by the Secretary of the OB, and includes higher level officials from all key
Ministries, as well as representatives of the Kiribati Council of Churches, the Kiribati
Association of NGOs (KANGO), the national women’s organization, All Women of Kiribati
(AMAK), and the Kiribati Chamber of Commerce. The NASC will continue to provide
overall policy analysis, quality control and advice to the Government of Kiribati on matters
related to climate risk management, covering both NAPA and KAP-II issues and activities.
The Climate Change Study Team (CCST), established as a committee for Kiribati Initial
Communication Project, which was later implemented NAPA preparation along with KAP I,
contains technical officers from all key departments affected by climate risks. The CCST
will continue to provide expert analysis and technical advice to the Government of Kiribati
on climate-related matters, as well as coordinate scientific activities relevant to the planning
and execution of the NAPA preparation Project and KAP-III Project implementation.
These two committee engineered by two different institutions, Strategic Policy and Risk
Management Unit, Office of Te Beretitenti and the Climate Change Unit – Environment and
Conservation under the Ministry of Environment, Lands and Agricultural Development will
be guided by the overall Policy framework of the Government on climate change, and with
support of line Ministries and sectors.
The existing committees of more specific responsibilities are expected to provide
complementary role to the overarching committee reference above. However, coordination
and direction of overall Policies should not be compromised given any situation, which are
equally extremely important. This is where the role of the NASC and the Office of Te
Beretitenti would eventually come into play.
The roles of different committees and how they are being supported by each administration is
fundamental to achieving overall adaptation or increasing resilience of the country. There is
also further thinking to link the role of these committees with disaster committee. However
this is still in discussion.
166
The Government of Kiribati with assistance of international organisation and development
partners had invested some efforts into developing relevant climate change policies. The
following is the table containing hierarchy of established policies that are relevant to climate
change in Kiribati.
Table 47. Climate change policies relevant to implementation of UNFCCC and addressing climatechange impacts in Kiribati
Policy and year its
established
Overall intent and main components Scope (national
strategic, overarching,
sectoral, etc)
1. National
Framework
for Climate
Change and
Climate
Change
Adaptation
2013
Over-arching themes:
1. The impacts of climate change are
brought upon us as the direct result of
action of others around the world and
as we stand in the frontlines of these
impacts, those responsible must accept
a fair share of the burden that climate
change and the associated impacts
placed on us.
2. We must continue to advocate strongly
for an international legally binding
mechanism for the established and
maintained flow of new and additional
funds to address all our adaptation
needs.
3. Given 1 and the Extreme vulnerability
of our economy, we need to think
beyond adaptation. New and
innovative initiatives on the ultimate
and unthinkable – consequences of
climate change, need to be actively
pursued now and dialogue with our
development partners on how this is to
be approached should start
immediately.
National and
overarching on climate
change (mitigation) and
climate change
adaptation
167
The following are main headings of the Policy
framework that need strengthening their
capability to be able to meet the challenge of
climate change:
1. Mitigation
2. Integration of Climate Change and
Climate Change Adaptation into
national planning and institutional
capacity
3. Population and resettlement
4. Governance and services
5. Survivability and self-reliance
2. Climate
Change
Adaptation
Policy and
Strategy,
2004
This Government’s policy aims in respect of
climate change includes:
(a) Kiribati should be mentally, physically
and financially well prepared to deal with
whatever climatic trends and events the future
may hold;
(b) this should be achieved through a co-
ordinated, consultation-based adaptation
programme carried out by official and private
agencies; and
(c) The financial costs attributable to the
national adaptation programme should be met
as far as possible by external assistance.
This Policy Strategy outline how the above
aims would be implemented through
strengthening the following 8 policy headings:
1. Integration of CCA into national
planning and institutional capacity
2. Use of external financial and technical
National Policy on
Climate Change
Adaptation
168
assistance
3. Population and resettlement
4. Governance and services
5. Freshwater resources and supply
systems
6. Coastal structures, land uses and
agricultural practices
7. Marine resources
8. Survivability and self-reliance.
3. National
Water
Resources
Policy and its
Implementati
on Plan, 2008
The intent of the policy are:
1.Provide safe, socially equitable, financially
and environmentally sustainable water supplies
to enhance the welfare and livelihood of I-
Kiribati
2.Protect and conserve freshwater sources for
public water supplies
3.Deliver freshwater efficiently and effectively
This Policy frame its objectives into different
timeframes, short to medium term (3 years)
policy objectives and longer term policy
objectives.
Sectoral on Water in but
National in scope
4. National CC
and Health
Action Plan,
2011
Health recognises that climate change is a new
kind of environmental health problem and
therefore sees the relevance of integrating
climate change into their activities. This lead to
Action Plan which focussed on:
1. Describe the specific health risks
posed by climate change in Kiribati,
and
2. To outline strategies that may be
implemented to anticipate and avoid
most serious impacts of climate
change on health.
Sectoral on Health but
National in scope
169
The main priority areas of this Action Plan are:
1. Water safety and water-borne disease
2. Food safety and food-borne disease
3. Vector-borne disease
Other indirect priority areas include disease
surveillance, nutrition, environmental health
and mental health.
5. Kiribati
Integrated
Environment
Policy, 2013
The National Integrated Environment Policy
also recognised that climate change is one of
the threats to the environment. Therefore
climate change was one of its core policy
issues. The vision of this policy:
“The people of Kiribati continue to enjoy a
safe and health natural environment that is
resilient to the impacts of climate change and
supports livelihoods and sustainable
development”
Sectoral on
Environment but
National in scope
The National Framework for Climate Change and Climate Change Adaptation attempts to
subsume the Climate Change Adaptation Policy and Strategy. This intention to reconcile
policy goals into one single document and direction rather than various independent strategic
policy documents with possible different directions.
There is strong anticipation that in the coming years as climate change unfolds with extreme
and adverse impacts; other sectors will eventually come on board with their organisational
intent on how to implement their activities with respect to climate change. These policies and
their strategies are highlighted here as Government’s efforts to describe these priorities with
the intention that these are recognised and supported from Annex I Country Parties because
these impacts are the result of their externalities. Most importantly, these policies aim to
secure a resilient (social, environmental and economic) Kiribati from the impacts of climate
change guided by the overarching National Framework on Climate Change.
170
Kiribati considers climate change adaptation seriously and most of its adaptation activities
were project-based activities. However, the Government of Kiribati understood it very well
that despite the fact that while Kiribati strive hard to attract external assistance to support our
adaptation needs, significant amount of annual budgeted resources have already been
assimilated and projected to increase in the future to protect our shorelines, install water
catchments and to name a few.
The domestic pressures was already burdening the existing environment, social and economic
trajectories of future Kiribati, while noting that climate change had already add slow and
immediate onsets of climate change adverse impacts.
This implies that significant amount of efforts and interventions are required now to build
resilience of atoll systems, social and economic stability in the coming years.
Kiribati had implemented a number of adaptation measures and also assessed their
effectiveness with a view to recommend better approaches, measures and areas for adaptation
in the future. The table (table 48) below summarises the list of adaptation measures (both
soft and hard) that have been implemented through different initiatives. This table 48 does
not include other interventions by line Ministries of the Government which were also graded
as adaptation measures but were not supported as incremental costs occurred due to climate
change.
Kiribati believed that next phase of adaptation will involve implementation of the National
Adaptation Program of Action and other relevant climate policies and action plans that have
been or will be developed in the future by various departments. Some of the emerging and
immediate adaptation options that are likely to dominate future adaptation agendas in Kiribati
may range from food security, ecosystem approach to adaptation, sustainable local
governments’ involvement in climate change adaptation, integrated coastal and water
management adaptation, to name a few. However, these areas need to be re-prioritised and
implemented in a coordinated manner so as to avoid duplication, best use of limited resources
and improve synergies and lessons learned for a resilient socio-economic and physical
environment of Kiribati.
171
Table 48. Compendium of adaptation efforts implemented in Kiribati.
Adaptation option Objectives Sector/Triggers
Installing Groundwater monitoring boreholes Monitor the quantity and quality of groundwater whereboreholes are located
WATER/Poor water quality and quantity
Improve Water leakage detection capacity To reduce and replace some sections of pipelines whereleakages are found to occur – thus ensure the sustainability of
supply of freshwater to the densely populated Betio andSouth Tarawa
WATER/More drought and less water and ,morewasted water, population concentration with highdemands of water
Increase options for Rainwater Harvesting Clean Drinking water, Increase Rainwater Harvestingreservoir (Best case practices). Increase in potable rainwater
availability
WATER/Rainfall variability leading to morefrequent/worse droughts; Poor /inadequate watersupply infrastructure; Depletion of groundwaterreserves (pollution from human activities, sea-level risecontamination); Potable freshwater shortages (OuterIslands)
Water Services Rehabilitation Groundwater abstraction from other water gallery reserves;Rehabilitate water infrastructure.
WATER/Rainfall variability leading to morefrequent/worse droughts; Poor /inadequate watersupply infrastructure; Depletion of groundwaterreserves (pollution from human activities, sea-level risecontamination); Potable freshwater shortages (OuterIslands)
Install rain gauge in outer-islands Install rainfall monitoring stations on each inhabited island;Improve ability to predict (extreme) weather; Conduct more
accurate water resource assessments
WATER/Rainfall is an important determinant ofweather pattern
Water supply infiltration gallery on rural islands Increase groundwater abstraction and distribution to selectedcommunity/village in rural islands
WATER/Potable freshwater shortages on outer islands
Engineered Seawall Improving the protection of public assets (KAP II -Component 2) eroded on coastal low-lying areas
COASTAL/Increase Storm surges; Coastal erosion
Ecosystem Monitoring Ecological gap assessment to identify Key Biodiversity Areas(KBA)
Identification and monitoring of ecosystems
BIODIVERSITY/National consultations andhousehold surveys; Destructive human activities;Unsustainable over-exploitation of natural resources
172
Mangrove re-planting Protection of coastlines from seawater intrusion andinundation
Protect and manage biodiversity
BIODIVERSITY/Seawater intrusion; Inundation;Loss of biodiversity
Coral Reef Monitoring Monitoring Coral Reef to assess coral bleaching due toincreased sea surface temperature rise
FISHERIES/Coral reef is the best indicator of seatemperature rise, and that this important for the localpeople depend heavily on marine resources
Phoenix Islands Protected Area (PIPA) Maintenance of natural beauty of PIPAMaintenance of natural ecosystem
Promote PIPA as a sustainable tourist attraction
FISHERIES & BIODIVERSITY/Pipas ecosystemremains in its natural state (untouched)
Climate adaptation baseline study Assessment of awareness and attitudes to climate change INFORMATION and KNOWLEDGE/Informationlacking about peoples’ baseline understanding of theissue
Community participation Quality and effectiveness of current public consultationsassessment
COMMUNITY/ Information lacking about successfuland unsuccessful processesTraining on community participation processes
Information accessibility Develop a common language, climate risk information, bestagricultural practices through Centre of Excellence,
assessment tools for Government
INFORMATION & KNOWELEDGE/ The use ofEnglish terms with villagers in outer islandsNeed for further training to Government’s officialsNeed for one message across Ministries
Climate Change Adaptation Awareness Help our local people understand the impact of ClimateChange and Adaptation
INFORMATION & KNOWLEDGE/ The fact thatKiribati people lacking the luxury of speaking freely onclimate change and their needsPeople lack the understanding of adaptation and howimportant it is
173
The table 48 above suggests that some effective adaptation options have been implemented in
an effort to build resilience of some of the critical systems/sectors and invigorate other areas
particularly information and knowledge. It is obvious that adaptation is a huge burden,
expensive exercise and will continue to be part of everyday or normal routines of the country.
It is expected to see emergence of new sectors and areas for adaptation (which were not also
sufficiently covered in the list thus far) as the need arises in the future. These will include
health, local governments (sub-national) and cities, food security, human resource
development including up-skilling programs, tourism, gender based adaptation, ecosystem
based adaptation.
To make adaptation become part of everyday life, mainstreaming comes into play as been
advocated and progressed also in Kiribati through adaptation programs recently in 2004 until
these days.
Therefore, Mainstreaming climate change adaptation into national development processes
becomes an important element of effective adaptation as it ensures that climate change
adaptation was given more prominence at the national level. It is also significant that climate
change as an urgent issue is mainstreaming into the national planning frameworks to gain
“whole of nation” participation in its various implementation phases. This mainstreaming
process requires a clear and elaborate system of communication and reporting information
and other outputs. In Kiribati, the system was set up to act in parallel with the reporting
mechanisms of the National Sustainable Development Strategy or what commonly known as
the Kiribati Development Plan. In Kiribati, the mainstreaming process was understood and
conceptualized to be working in the logical steps as described in the flow chart (figure 36)
below.
Although the mainstreaming process is a new concept, it has been practiced at it early stage
in Kiribati and is expected to be a continuous and reiterative process that will involve
eventually all sectors/institutions/communities in Kiribati.
There is much to do and understand further how this process is actually working. This
implies that proper data and reporting mechanisms need to be in place to support the
174
monitoring and evaluation process of ensuring that climate change efforts are being
mainstreamed adequately into national planning and by which resources.
Figure 35. Mainstreaming process in Kiribati
Source: Adapted from World Bank 2006 report
This whole system of mainstreaming climate change adaptation and how its results were fully
understood and relevant to adapting to the impacts of climate change, was chronically lacking
due to capacity constraints and other challenges from concerned sectors. Effective adaptation
require a good framework for mainstreaming and it is evident at this stage that mainstreaming
still require capacity and structural developments to realize what is really meant for achieving
mainstreaming climate change adaptation into national response capabilities and overall
development systems.
175
6.0 CAPACITY BUILDING AND TRAINING
The status quo of institutional capacity, training and research in Kiribati was chronically
lacking. The biggest challenge towards achieving an improved cognitive, research and
training sector is funding, and the source to generate funding is economy – which was
relatively weak as indicated in Kiribati being categorised among the Least Developed
Countries. Like other developing countries, the Government of Kiribati priority aspiration is
to build economic wealth which could then later assist other pillars of development e.g. social
and environment pillars. Therefore, training, capacity building and research were commonly
viewed among other sectors or services that do not generate revenue but rather funnel out the
resources.
Capacity building, training and research needs of the Government were often supported by
development partners and internationally recognised organisation, e.g. UN based
organisation, international and regional banks, regional agencies and to name a few.
Since the Initial National Communication report, there is increased acceptance of the
relevance of having capacity building, training and research to be amalgamated in the
workings and activities of the Government. This was seen as an opportunity to improve
decision making and overall state of innovation and creativity which can have positive
benefits to the developmental agenda and the community as a whole. Though this was more
effectively managed at the personnel level; the systemic, institutional and research areas were
still independently vested within each individual organisation to handle.
Nevertheless, through an enabling environment project on national capacity self assessment
for the three Rio Conventions; the component of this project for one of the Conventions –
UNFCCC becomes very relevant to addressing the needs to understanding capacity needs on
climate change at the national level. As identified by this report, some of the overall capacity
development outputs anticipated to address capacity constraints in Kiribati with respect to
implementing obligations under the UNFCCC or relatively benefiting the national capacity
needs for undertaking climate change activities on the ground, includes;
176
1. Improved understanding of climate change across sectors of the population (such as
work force, communities, etc)
2. Enhanced capacity at all levels to undertake V&A assessments, prioritize and
implement adaptation actions
3. Enhance capacity to undertake research, conduct systematic observations in areas of
meteorology, ecosystem and hydrology.
The details on the capacity development actions on each of the three outputs above can be
extracted from the Kiribati NCSA 2011 Report. Again the NCSA report is not an exhaustive
means to report on the capacity needs of Kiribati with respect to climate change. There are
other aspects of climate change which deals with infrastructures, economic planning and
social well-being which are not necessarily reflected in this enabling environment capacity
assessment project.
Opportunities for training were observed to have been increased since the last decade on
climate change. These opportunities need to be extended to other sectors and policy makers.
The Government’s entity for training public civil servants need to work closely with other
government’s organisations in designing and coordinating training needs and opportunities
geared for an anticipated climate change response required in the future.
The research is critical to inform the process of decision making and more over to accurately
monitor and advice on state of climate change and the responses that community need to be
aware of, from time to time. In the past, this need have been largely facilitated or supported
by academia, regional organisations and other well-resourced international organisations.
With this normalcy, Government‘s decisions at national level may have been strongly
associated with international advice in many cases. This could be seen positive or negative, as
in certain incidences the urgency of needing those required technical advice instantly
(whether it is climate change or any other issue) may not always readily available. This leads
to the proposition to consider establishing a national institution with research capability on
pressing and emerging issues. Other more in-depth and sophisticated issues which require
similar weight of research’s attention could be dealt with by international organisations with
proper research expertise on such matter.
177
7.0 RESEARCH, DATA AND SYSTEMATIC OBERVATION
As previously stressed in section 6.0, research capacities and capabilities in Kiribati are
chronically limited at the national level. Nevertheless, these needs have been greatly
substantiated and supported with programs, project-based activities and initiatives of regional
and international institutions with more research/analytical capabilities and resources. With
the urgency and prominence of climate change issues in the context of future developments
and survivability of Kiribati, immediate and responsive informed planning and decision
making is required. Therefore considering the strengthening of national research capacities
and frameworks may address this issue. To what extent this may be feasible, require future
assessment and deployment of investments to this cause.
Data/information are necessary to not only complementing efficient technical assistance from
regional and international entities but would also aid in addressing some of the critical issues
which require on-the-ground focussed undertakings that require timely response for decision
making and more importantly implementation of Kiribati’s obligations under the UNFCCC.
Informed decision making requires accurate and consistent-based advices which should be
based on factual, science-based and rigorous planning. One of the main ingredients to
achieving this is data and information. Two national websites (www.climate.gov.ki and
www.environment.gov.ki) were developed during since 2009 and contains both data and
information on climate change. Unfortunately, limited quantitative scientifically proven data
has been one of the many challenges of Kiribati. This problem applies to almost every key
institutions with relatively poor institutional frameworks and capacity to gather data, archive
data systematically, tailor data to performance indicators and more over analyse data to
generate relevant information. Most of the institutions have data structures but often ad-hoc,
poorly managed and fragmented. This leads to the proposition of reiterating a request to
developed country Parties with advanced data knowledge and resources to support Kiribati as
clearly highlighted in the provisions of Article 5 of the UNFCCC.
The Kiribati National Meteorological Service had developed the 2009 National Strategic
Policy with the intent to set it strategic policy goals and directions through improvements and
strengthening of various specific areas. The Policy recognised it very well that these strategic
178
policy objectives will still be impossible with the provision of financial support from
international donor communities. Some of the areas proposed under this strategic policy
include institutional capacity building, maintenance and upgrading of stations and data
infrastructure of the KMS, to name a few. These specific needs on data and systematic
observation can be found in the Strategic Policy document of the Kiribati Meteorological
Service.
179
8.0 CONSTRAINTS AND GAPS
8.1 STATUS OF CONTRAINTS AND GAPS
Kiribati national circumstances focusing on the states of its environment, social and cultural,
and economic development aspects are pooled and considered together against the backdrop
of global climate change. The challenge of climate change that Kiribati is facing, suggestive
of gaps between what it is assured of and what is considered to be timely, adequate, and
appropriate action will be appreciated. Sector policies and institutional issues to marshal
efforts to meet the challenge are also factors that contribute to the gaps.
From those considerations, Kiribati continues increasingly to be vulnerable to climate change
and its impacts. The national sense of Kiribati’s current and future vulnerability to climate
change has weakened (among key Government’s officials) confidence in the UNFCCC
processes to be able to timely mitigate climate change. This is apparently due to the slow
pace and lack of ambition in reaching decisions (at the UNFCCC level) which are expected to
curb emission of greenhouse gas emissions (GHGs) and the required financial support to
address impacts felt now by Parties to the UNFCCC. The important gap was therefore
embedded on the question of not knowing whether or not; the UNFCCC processes will be
able to prevent dangerous anthropogenic interference to the climate system.
Key environment aspects such as low lying, narrow coral islands, calcareous and poor
agriculture soil, and precarious ground water lens as the main source of water, droughts, and
storm surges inundating villages are well recognized. However, this knowledge and
experience is considered in the UNFCCC process as insufficient to define vulnerability, to
design adaptation measures, and to proceed to seek external assistance.
Vulnerability and adaptation assessments and studies are still demanded as pre-requirements
to physical structural adaptation. The demand of rigorous science on the vulnerability and
adaptation options assessment is unfair to the realities about Kiribati; on the other hand it
provides opportunities for international consultants to contribute to the planning of adaptation
options. In turn this implies there is gap in the available national human resource to provide
180
the required scientific information or to sufficiently understand such information as may be
provided by international consultants.
The gaps exist between information provided by international consultants and the national
capability to understand them, between any justifications for conducting vulnerability studies
and the experienced incidences of vulnerability of the national circumstances, and between
national capability and the need that this too should be able to provide scientific information
on the vulnerability of Kiribati to climate change.
Moreover the requirement of rigorous science which usually only confirms experienced
aspects of Kiribati vulnerability to climate change will only lead to delayed planning and
implementation of appropriate adaptation actions. There is therefore a gap between the time
that the rigorous science has or can be provided, and when appropriate adaptation actions
based on the rigorous science may start. Furthermore, the scattered nature of the islands of
Kiribati means the range for which to understand the nature of vulnerability in a rigorous
scientific framework would be very large that there would never be an end to be able to
justify more and more scientific assessment of Kiribati vulnerability to climate change.
Associated with the need of rigorous scientific information are data and approved tools and
models. Data usually lack good geographical and temporal coverage. The quality of the data
is also questionable except data that are systematically collected as part of well established
monitoring procedures such as for the weather and sea levels by the Kiribati Meteorological
Services. Computer based tools to understand future climate change and impacts on various
sectors could be expensive, highly complex, but must be used. Other useful tools for
integrated vulnerability and adaptation assessments would also be useful. Kiribati national
capability to make use any of these tools has not been assessed, but it is most certain that
these are areas where serious gaps are expected.
National capacity to plan adaptation activities and to access available international assistance
or climate change finance is limited. This is further complicated by the difficult requirements
or conditions of external assistance usually require “middle men” type arrangements (e.g.
Implementing Agencies) for the execution of the activities. At times, these create more
181
layers of processes and gaps between priorities or how to implement activities that middle
organisations decide and those that national authorities would prefer.
Institutional arrangements to enhance holistic national approach to address climate change
through effective leadership, consultation among key officials, and coordination have much
need of improvement. In addition, it is also noted that externally funded projects on climate
change tend to also have influence over the national priorities and how things should be
improved within the existing processes of Government. This is an opportunity to take
advantage of.
8.2 CONSTRAINTS AND GAPS RELEVENAT TO IMPLEMENTING UNFCCC
Themes are taken from the UNFCCC Articles. And key themes are the objective, principles,
adaptation, preparation of GHG inventories, mitigation, reporting, research and systematic
observation, education, training and public awareness, international negotiations under the
UNFCCC processes, and financial mechanism.
Parties to the UNFCCC are concerned that human activities have been substantially
increasing the atmospheric concentrations of greenhouse gases, leading to enhanced warming
of the Earth’s surface and atmosphere, and affecting natural ecosystems and humankind.
Most recently, IPCC FAR (2007) affirms that the warming of the climate system is
unequivocal, and this is most likely due to emissions of anthropogenic greenhouse gases. The
ultimate objective of stabilizing atmospheric concentration of greenhouse gases at a safe level
for ecosystems to be able to adapt naturally and economic development to proceed in a
sustainable manner (Art.2 of the UNFCCC) presents therefore a big challenge.
Various parties have proposed different concentration levels: one group proposed 350 ppm
(Parts Per Million) while another group proposed 450 ppm, and then there were proposed
levels of temperature increases of 1.50C, and 2.00C. These are gaps when compared together,
concluded the fact that these have implications for Kiribati survival. Thus the gaps between
the different concentration levels and between temperature levels, and between these and
what may turn out to be realistic for the objectives, considered on global scale and for
182
Kiribati geographical scale are important considerations to Kiribati. Current assessments are
that these gaps are ominous for the future survival of Kiribati because any value within the
gaps would make climate change and sea level impacts far in excess of the adaptive capacity
of Kiribati. Moreover, scientific guidance on concentration or emission levels that will cause
dangerous interference with the climate system will never be provided explicitly and so the
gap in any agreed concentration level and 350 ppm would be determined solely by prevailing
political and economic forces in the negotiations.
Among the principles that were adapted to guide actions to address climate change are
sustainable development principles and common but differentiated responsibilities. The fact
that the latter has been too often referred to may suggest that many parties hold that this
principle override concern about the sustainability of the global environment for future
generations. In other words, there cannot be progress on agreed global mitigation unless the
Parties consider that their individual set mitigation targets conform to their individual
understanding of their share in, and how is to be shared the “differentiated responsibilities”.
Individual countries place their interest above the global interest even if part of the global
would be destroyed.
The precautionary principle has been acknowledged, but also that economic development is
necessary to be able to address climate change. If climate change is occurring because of
past and current economic development, then it is also acknowledged that the latter contains
opportunities to be able to address climate change. The facts on the gap between the intent
in the precautionary principle and any actions that are accordingly stopped or reduced, after
having recognized the problem of global warming, is from the profiles of global emissions
which is nonetheless increasing. Therefore, global actions are departing greatly from the
precautionary principle.
Adaptation is visibly required in natural systems in Kiribati as already noted. Coastal
ecosystems and water resources are affected by rising sea levels, increasing storm surges, and
extremes of rainfall – flooding and droughts. The UNFCCC accord favourable
considerations for international assistance to various characteristics of countries such as for
being small islands, low lying coastal, least developed among the developing countries – and
these properly describe Kiribati circumstances. Perhaps encouraged by these considerations
183
and the attractiveness of justice, Kiribati has considered that external assistance should be
sought for all its adaptation needs, and at the same time that it is recognized that local
resources are very limited for the national needs were there being no climate change.
External assistance that have been secured for adaptation has been inadequate to address
adequate adaptation throughout the atolls, and Kiribati has no option but to use its local
resources to meet part of the costs of damage experienced by communities from extreme
weather conditions including storm surges.
An important element of information that Parties should communicate to the COP is their
national inventories of greenhouse gas emissions. These gases include carbon dioxide (CO2),
methane (CH4), and nitrous oxide (N2O) and it is emission of these gases only that this report
is now reporting. Other gases are hydro-fluorocarbons (HFCs), perfluorocarbons (PFCs), and
sulphur hexafluoride (SF6). In this exercise, Kiribati activities data are from the energy sector,
and agriculture. In the energy sector, these data consists of imports and consumptions of
three major fossil fuel types – diesel, petrol (benzene), and kerosene. Activity data of
different purposes in the use of energy such as for public electricity, transport, navigation,
and residential are estimated rather than being based on available disaggregated data for these
different purposes. In the agriculture sector, activities data are the number of livestock, that
is, pigs and chicken, and include estimated data on fuels used for fishing outboard motors.
The inventory presented is compiled with the knowledge that there were significant gaps in
the processes and procedural steps that were circumvented through estimations. These
highlight the inadequate data collection and management systems in the entities that are
involved. Improvement for the sake of the compilation of the inventories of emissions of
greenhouse gases would not be critical since national emissions are insignificant compared to
global emissions but very important for informing policy options that promote cleaner and
sustainable development.
National system for compilation of inventory of greenhouse gases need therefore to be
improved and widely appreciated among relevant sectors. Currently mitigation option
through more use of renewable energy such as the use of photovoltaic cells for lighting,
cooling medical supplies in rural areas is being pursued. Kiribati Copra Mill is producing
bio-fuel and promoting its use. However there are no programmes devoted to specific
options for mitigation involving technology acquisition and diffusion. But technology is
184
present in all sectors and human activities and as already noted, the economy may be
increasingly less efficient; emissions per dollar GDPs appear to have been increasing.
There is limited research capacity that nationals could undertake on topics relevant to climate
change. It may be helpful to work closely with the University of the South Pacific (USP) and
suggest topics that require in-depth research for them to incorporate in their future academic
research programs. Their involvements in any such research undertaken by international
scientists were often minimal that the research programs the Government approved could be
enlisted in their programs and their results could be useful information to feed the current
research deficient status at the national level. However, ministries and divisions may have
data that they collect on the aspects of national affairs and circumstances for which they are
responsible and may have carried out analysis for their use and some for public information.
But until most recently, there have been very little opportunities for sharing information and
research among ministries.
More qualified nationals now recognize the relevance of climate change to their particular
areas of interest. Kiribati Meteorological Service personnel are very aware about global
warming as they continue monitoring the weather and occasionally analyse climate data.
Officials of the Fisheries and the Environment Divisions in undertaking coral monitoring do
so with awareness of climate change and potential effects on coral health. But there is still a
big gap between the desired level of integrating climate change into sector policy and
planning and actions.
In the education sector, it is felt desirable for schools to teach topics that are specific on
climate change. However, it is not easy to come up with such topics because climate change
being multidisciplinary would have been implicit in normal subjects covered in schools.
Nonetheless, effort is being made to construct a course that aims to focus on science and
issues about climate change. This seems to be a huge challenge due to resources. The GIZ,
UNICEF and SPC are currently assisting this area in the Curriculum Development and
Resource Division in Kiribati. Public awareness raising on climate change is conducted in
the form of workshops, visits to communities and schools, displays and disseminations of
prepared posters and pamphlets. Current radio programs are also contributing from NGOs
and other sectors so it is important to capitalize also on those efforts.
185
They are usually included as components of climate change projects. But the critical gap for
Kiribati is to be determined by agreements in the negotiation on continuing mitigation actions
after the first commitment period under the Kyoto Protocol, and agreements on financial
support for adaptation and how timely Kiribati is able to secure and use effectively such
financial support. Gaps highlight the need for capacity building particularly on adaptation,
and reporting to COP.
8.3 CONSTRAINTS AND GAPS RELEVANT TO ARTICLE 6 OF UNFCCC
In Kiribati, articulation and implementation of commitments under Article 6 falls mostly
under the Environment and Conservation Division through its Media and Public Awareness
Unit. However, seeing that campaigns and awareness raising at national and international
have become a cross-sectoral interest, this role was seen to be shared by other government’s
entities and projects e.g. Office of Te Beretitenti, KAP, USP, civil society and others.
However the greatest underpinning gap is the lack of effective implementation of Article 6
due to insufficient assessment on the needs to leverage support and also the lack of realistic
and well consultative action plan on implementing commitments under Article 6 of the
UNFCCC.
Within the respective capabilities of concerned government’s organisation presumably
responsible for Article 6, it is evident that such commitment was unable to be implemented
also due to the following constraints.
Table 49. National challenges on respective Article 6 obligations
Article 6 commitments Challenges
Development & implementation of educational and
public awareness programs on climate change and its
impacts
Limited skilled human resources and tools, limited and
unreliability means of communication at national
level, insufficient funds to visit remote islands for
campaigns
Public access to information on climate change Limited information and database professionals,
limited bandwidth for internet connectivity, lack of
human resource for climate change information
maintenance and development
186
Public participation in addressing climate change and
its impacts and developing adequate responses
High costs to visit and engage large community from
remote islands
Training of scientific, technical and managerial
personnel
Lack of highly qualified professionals and limited and
over-worked qualified professionals to do training of
stakeholders, limited number of research institutions
The root source of problems mentioned in the table above is the insufficient resources and
opportunities to support or meet the challenges highlighted in the table above. The
implementation of these need to be carefully captured in the National Action Plan to
implement Article 6 and also Article 5 which were not assessed in depth as part of this SNC
project due to insufficient resources.
187
9.0 PROPOSED PROJECT CONCEPTS
1. Kiribati Climate Change Database Management System and Sectoral data
strengthening
National reporting as a UNFCCC obligation covers a compilation of greenhouse gas
inventories, description of the national circumstances, vulnerability and adaptation
assessments, and national mitigation measures. For these different purposes and
applications, specific data are required. Types of data have to be identified, located
throughout governments and private sectors, collected and organized systematically at
one central location within the Climate Change section of the ECD, and regularly
updated. These institutions therefore need support to construct data relevant to
climate change responses (e.g. asset inventory for loss and damages, so on) and NC
reporting accordingly. The CCDMS would also provide data for SOE required under
the Environment (Amendment) Act 2007.
2. National Adaptation Programme of Action and Support to other National
Climate change Priorities
Food security is becoming a serious concern including ecosystem-based services.
Health adaptation, Traditional agricultural systems, ecosystem-based adaptation
measures, also exploring blue carbon concept, building social adaptive capacity based
adaptation programs including educational reforms, up-skilling initiatives are some of
the new areas for adaptation.
There is already some thinking at the national level to advance adaptation efforts
beyond Kiribati shores. These are outlined in the related climate change policies of
Kiribati such as National Framework for CC and CCA, Kiribati Integrated
Environment Policy, and the upcoming Kiribati Joint Implementation Plan for CC and
DRM.
Environmental sustainability is the foundation of resilience building and therefore
requires support in order to play their vital role. Existing environment protection and
188
management systems must be fully supported to envision their goals which are
aligned to emission reductions and adaptation.
3. Morphological development of reef islands over different time scales to support
appropriate coastal management plans
Low-lying reef islands formed on the rim of atolls in Kiribati appear threatened by the
impacts of anticipated sea-level rise. There is general agreement that the responses of
reef islands to sea-level rise are largely negative. To have a better understanding of
how these reef island will cope with future sea-level rise requires an understanding of
their past behaviour at different time scales. In turn, the development of appropriate
coastal management plans will depend largely on the assessment of the past
morphological changes of reef islands. In order to capture the past behaviour of reef
islands at different time scales will involve the following three studies a) examination
of the morphological evolution of reef islands morphological evolution of reef islands,
b) investigation of the topography of reef islands to water levels using detailed
topographic information and, c) historical shoreline changes
4. Kiribati Adaptation Project focussing on protecting key infrastructures
Low lying reef islands of the atolls, extending seaward from the top of the beach to
the sloping beach to the intertidal reef platform are subject to erosion and inundation
from high sea level and storm surges. Roads, water pipes, electrical cables, buildings
in South Tarawa are being exposed to high risks from coastal erosion and inundation
that can be attributed to sea level rise and storm surges associated with climate
change.
Ground water lens in South Tarawa is highly vulnerable from erosion, saltwater
intrusion, and inundation. With increasing urbanization in terms of the increase in
population and economic development activities, the shortage of ground water
resources would be highlighted when so many people would be affected.
KAP should continue to provide assistance to Kiribati to be able to protect its public
assets from the risks of climate change impacts, maintain urban services in particular
water supplies to the increasing population of South Tarawa, and to improve water
189
supplies and chronic coastal erosion issues at outer islands for local communities that
are most in need.
5. Raising public understanding of technical information about the environment
Efforts need is required to identify near parallel ideas that exist within the Kiribati
language to those key ideas and concepts that are found in relevant technical reports
and information.
Support programs focussing on behavioural change is required more in the future to
inform and educate the public on this important issue.
Support is also needed for the establishment of core working group, with local
professionals to work separately and as a group, to review and expand any available
“bilingual vocabulary” about the environment, in particular where words and ideas are
about climate change.
6. Analyzing scientific information that has been produced on the vulnerability of,
and adaptation options for Kiribati.
Various tools and methodologies have been used to characterize the vulnerability of
and to come up with adaptation options for Kiribati. These include the several reports
since 2000, and tools and methodologies that are acquired or produced through KAP
or SNC or other initiatives. These include the works of NIWA, SIMCLIM, and
PCCSP. There is a need for a capacity building program for local stakeholders to
understand the relevance, and application of these tools within their respective
sectors. There is also a need to build local capacity to be able to optimise the use of
these vulnerability tools with establishing baseline information and data for
quantification of the impacts, losses and damages associated with climate change.
7. Support to CDM and overall Nationally appropriate mitigation framework and
actions
Financing opportunities that could lead to better promotion, deployment and
implementation of applicable clean and renewable energy technologies in Kiribati.
The establishment of a formal institution to manage CDM and NAMAs require
support.
190
REFERENCES
Abeta, R. (2011). Institutional analysis of the organisation and allocation of
responsibilities across Government for an improved level of collaboration on Climate
Change E. a. C. D. Climate Change Unit. Tarawa, Government of Kiribati: 10.
Bank, W. (2000). Cities, Seas and Storms. Managing change in the pacific island economies.
November 30, 2000, World Bank. IV: 135.
Beets, J. (2000). Declines in fin fish resources in Tarawa Lagoon, Kiribati emphasize the
need for increased conservation effort. National Museum of Natural History, Smithsonian
Institution, available from http://www.botany.hawaii.edu/faculty/duffy/arb/481-493/490.pdf.
Biribo, N. (2008). Analyses of spatial and multi-temporal coastal changes of selected sites
in Tarawa, Kiribati. Department of Marine Science. Suva, University of the South Pacific.
Master of Science: 239.
Biribo, N. (unpublished). Composition of carbonate sediment for Betio and Marenanuka
islets. Suva, University of the South Pacific: 39.
C Hogan, T. K. (2008). Baseline Report: Survey of Public Awareness and Altitudes towards
climate change issues and challenges. Tarawa, Kiribati Adaptation Project: 22.
Doherty, T. J. and S. D. Clayton (2011). "The psychological impacts of global climate
change." American Psychologist 66: 265-276.
Donner, D. S. (2007). Coral Reef Benthic Monitoring - Final Report. G. o. K. Kiribati
Adaptation Project. Tarawa, unpublished: 29.
E, L. (2000). Coral Reef benthic surveys of Tarawa and Abaiang Atolls, Republic of Kiribati.
SOPAC Technical Report 310. Suva, SOPAC: 88.
191
Elrick, C., R. Kay, et al. (2009). Planning Manual: Supporting land use decision making in
the Republic of Kiribati. Prepared for Kiribati Adaptation Project Phase II (KAP II).
Title: Kiribati Second National Communication ReportSubject:Author: Riibeta AbetaKeywords:Comments:Creation Date: 27/06/2013 5:31:00 PMChange Number: 7Last Saved On: 27/06/2013 5:33:00 PMLast Saved By: EnvironmentTotal Editing Time: 4 MinutesLast Printed On: 27/06/2013 5:34:00 PMAs of Last Complete Printing
Number of Pages: 195Number of Words: 53,185 (approx.)Number of Characters: 288,269 (approx.)