Second Five-Year Review Report for Kin-Buc Landfill Superfund Site Edison Township, Middlesex County, New Jersey Prepared by: U.S. Environmental Protection Agency Region II New York, New York September 2004
Transcript
Second Five-Year Review Report
for
Kin-Buc Landfill Superfund Site
Edison Township, Middlesex County, New Jersey
Prepared by:
U.S. Environmental Protection AgencyRegion II
New York, New York
September 2004
2
Table of Contents
List of Acronyms 4
Five-Year Review Summary Form 5
I. Introduction 6
II. Site Chronology 6
III. Background 6
Site Location and Description 6Topography 7Geology/Hydrogeology 7Land and Resource Use 7History of Contamination 8Initial Response 8Basis for Taking Action 8Contaminants 9
Question A: Is the remedy functioning as intended by the decision documents? 14Question B: Are the exposure assumptions, toxicity data, cleanup levels, and remedial
action objectives (RAOs) used at the time of the remedy selection still valid? 14
Changes in Standards and To Be Considered 15
3
Question C: Has any other information come to light that could call into question the protectiveness of the remedy? 15
Remedy Assessment Summary 16
VIII. Recommendations and Follow-up Actions 17
IX. Protectiveness Statement(s) 17
X. Next Review 17
Tables 18Table 1 – Chronology of Site Events 19Table 2 – Contaminants 21Table 3 – ARARs and TBCs for groundwater that were presented in the
Human Health Risk Assessment (Table 4-2) 22Table 4 – ARARs and TBCs for surface water that were presented in the
Human Health Risk Assessment (Table 4-3) 23
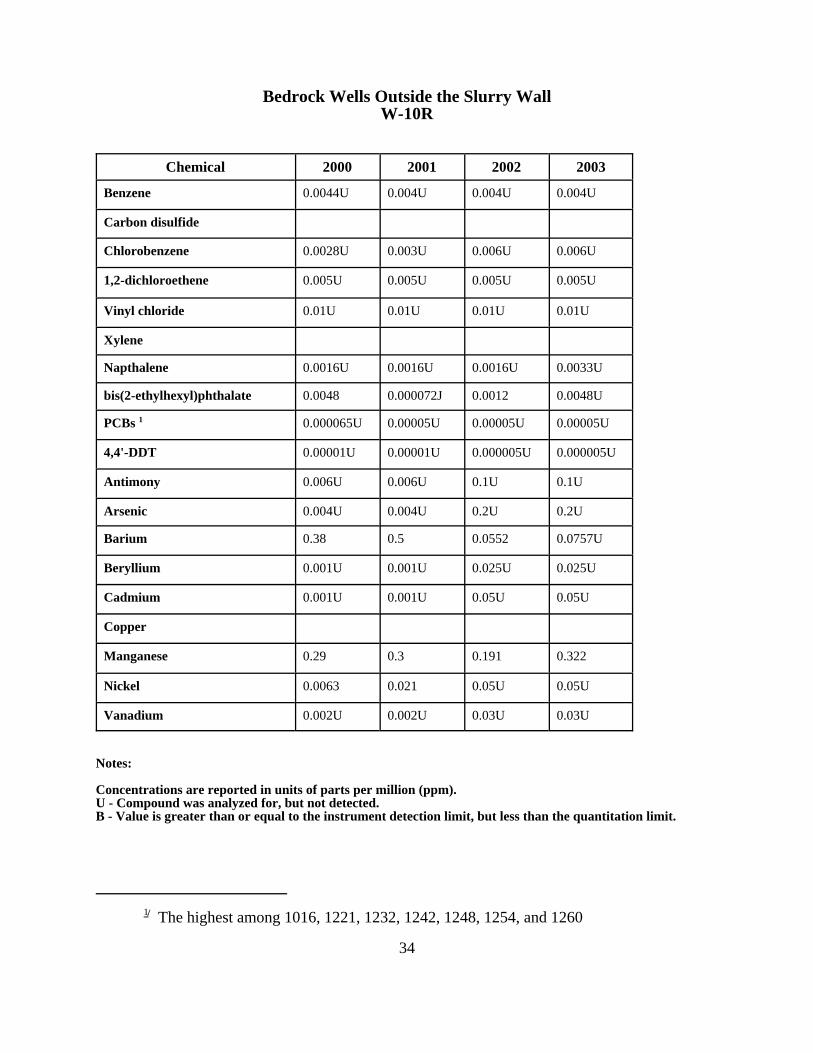
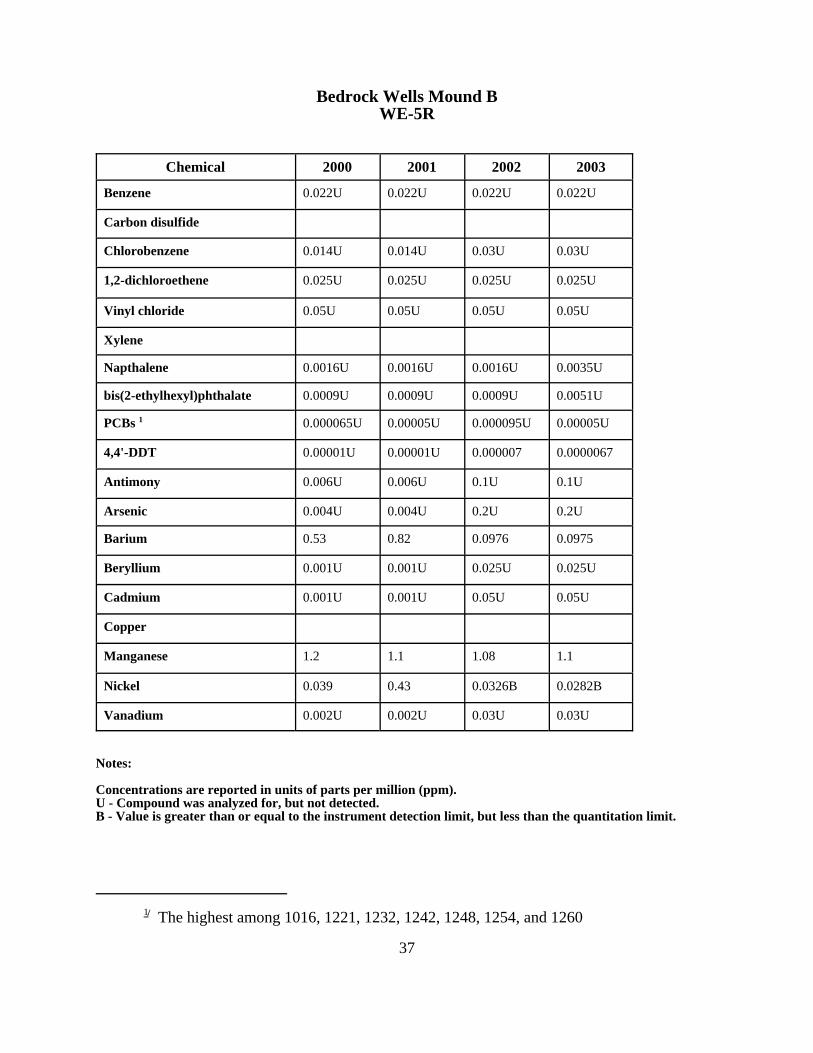
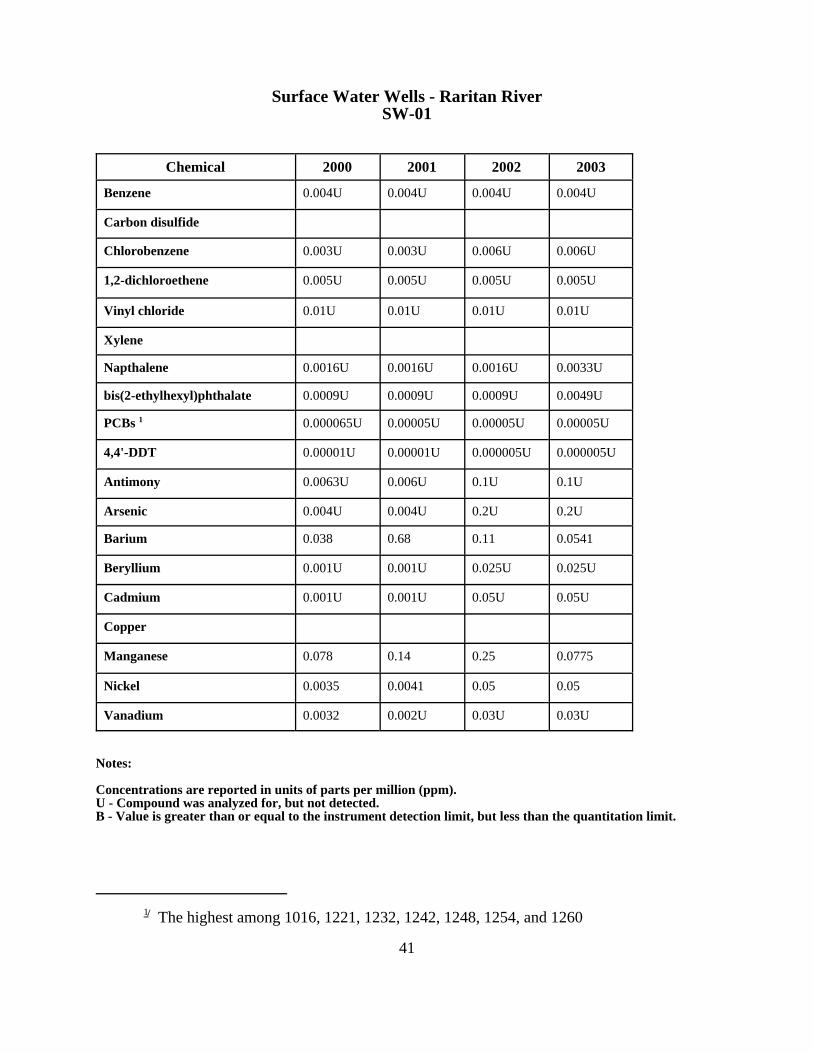
Groundwater and Surface Data Summary 24
Attachments 45List of Documents Reviewed 46
Figure 1 - Site Location 47Figure 2 - Site and Surrounding Area 48
4
List of AcronymsARAR Applicable or Relevant and Appropriate Requirement
CD Consent Decree
CERCLA Comprehensive Environmental Response, Compensation, and Liability Act
EPA United States Environmental Protection Agency
CFR Code of Federal Regulations
ESD Explanation of Significant Difference
HHRA Human Health Risk Assessment
NJDEP New Jersey Department of Environmental Protection
MCL Maximum Contaminant Level
MCLG Maximum Contaminant Level Goal
NCP National Contingency Plan
NPL National Priorities List
O&M Operation and Maintenance
PAH Polyaromatic Hydrocarbon
PCB Polychlorinated Biphenyl
PRP Potentially Responsible Party
RA Remedial Action
RAO Remedial Action Objective
RD Remedial Design
RI/FS Remedial Investigation/Feasibility Study
ROD Record of Decision
SARA Superfund amendments & Reauthorization Act
SDWA Safe Drinking Water Act
VOC Volatile Organic Compound
5
Five-Year Review Summary Form
SITE IDENTIFICATIONSite Name (from WasteLAN): Kin-Buc Landfill Superfund Site
Actual RA Onsite Construction at OU#___ Actual RA Start at OU#______ Construction Completion Previous Five-Year Review Report Other (specify)___________
Triggering action date (from WasteLAN): 03/3/1999
Due date (five years after action date): 03/3/2004
Does the report include recommendation(s) and follow-up action(s)? yes noIs human exposure under control? yes noIs the contaminated groundwater under control? yes noIs the remedy protective of the environment? yes no
6
Five-Year Review Report
I. Introduction
Authority. The Agency is preparing this five-year review pursuant to CERCLA §121 and theNational Contingency Plan (NCP). CERCLA §121 states:
If the President selects a remedial action that results in any hazardous substances,pollutants, or contaminants remaining at the site, the President shall review suchremedial action no less than each five years after the initiation of such remedial action toassure that human health and the environment are being protected by the remedial actionbeing implemented. In addition, if upon such review it is the judgement of the presidentthat action is appropriate at such site in accordance with section [104] or [106], thePresident shall take or require such action. The President shall report to the Congress alist of facilities for which such review is required, the results of all such reviews, and anyactions taken as a result of such reviews.
The Agency interpreted this requirements further in the NCP; 40 CFR §300.430(f)(4)(ii) states:
If a remedial action is selected that results in hazardous substances, pollutants, orcontaminants remaining at the site above levels that allow for unlimited use andunrestricted exposure, the lead agency shall review such action no less often than everyfive years after the initiation of the selected remedial action.
This second five-year review for the Kin-Buc Landfill Superfund Site, located in EdisonTownship, Middlesex County, New Jersey, was conducted by United States EnvironmentalProtection Agency (EPA) Remedial Project Manager (RPM), Grisell V. Díaz-Cotto. This reviewcovers the inclusive dates of January 1999 to December 2003. The five-year review wasconducted in accordance with the Comprehensive Five-Year Review Guidance, OSWERDirective 9355.7-03B-P (June 2001). The purpose of five-year reviews is to assure thatimplemented remedies protect human health and the environment and that they are functioningas intended by the decision documents. This report will become part of the site file. Reportspertinent to this five-year review are listed in the references section of the report.
This is the second five-year review for the Kin-Buc Landfill Superfund Site. The triggeringaction for this review is the completion of the first five-year review on March 3, 1999.
II. Site Chronology
Table 1 (attached) summarizes the site related events from discovery to the first five-yearreview.
III. Background
Site Location and Description:
The Kin-Buc Landfill Superfund site is located at 383 Meadow Road, Edison Township,Middlesex County, New Jersey. The site, which consists of several inactive disposal areas, occupies approximately 220 acres and is bordered by the Edison Township Landfill
7
(approximately 600 feet to the south), on the east by wetlands and the inactive ILR landfill(approximately a mile away), on the west by the Raritan River, and on the north by the EdisonSalvage Yard, the Edison Township boat launch, and a chemical manufacturing plant. TheEdgeboro Landfill is located approximately 0.5 miles away across the Raritan River southwestfrom the Kin-Buc and Edison landfills. The Heller Industrial Park, a light-industrial andcommercial complex, is located approximately one mile to the north of the site.
Topography:
The Kin-Buc I mound covers approximately 30 acres and rises to a maximum elevation ofapproximately 93 feet above mean sea level (MSL). The Kin-Buc II mound, just north of Kin-Buc I, covers about 12 acres and rises to approximately 51 feet above MSL. Mound B coversapproximately nine acres along the shoreline of the Raritan River with an elevation ofapproximately 15 to 20 feet above MSL.
Geology/Hydrogeology:
There are four stratigraphic units present at the site (top to bottom): refuse fill; meadow mat;sand-and-gravel; and bedrock.
The site is underlain by sedimentary rocks of Triassic Age, the Brunswick Formation and theLockatong formation. These formations consist chiefly of siltstone, mudstone and shale, andoccur at depths ranging between 25 and 46 feet below the area. A sand-and-gravel unit,representing recent Raritan River channel fill, overlies the bedrock locally at an averagethickness of 16 feet. Within Mound B and the Low-lying area, a layer of organic-rich clay andsilt known as “meadow mat” overlies the sand-and-gravel deposit at an average thickness ofseven feet. A refuse layer of varying thickness (between seven and 24 feet) overlies the meadowmat deposit. The refuse contains relatively old waste materials, such as household and municipalsolid waste, debris, white goods (household appliances), industrial wastes and fill materials. This layer is overlain by clay over Mound B and a layer of cover soil over Mound B and theLow-lying area.
All four stratigraphic units are water-bearing, although only the bedrock unit is regionallyextensive and used for water supply. In the refuse layer, groundwater flows radially from theKin-Buc I mound toward the Pool C area, the Edison landfill, and the Raritan River, and is nottidally influenced by the river. The underlying meadow mat layer acts as a semi-confining layer;its fine-grained organic-rich matrix exhibits very low permeability, indicating that groundwaterdoes not readily flow in this unit either vertically or laterally. The sand-and-gravel unit is indirect hydraulic contact with the river, and is therefore affected by tidal influence. At low tide,groundwater in this unit flows across the site from southeast to northwest. At high tide, this flowis reversed when groundwater flows from Mound B toward the Low-lying Area. However, netflow is west, towards the river. Groundwater flows in the bedrock unit towards the south. However, where bedrock is directly overlain by the sand-and-gravel unit, bedrock flow is tidallyinfluenced, causing a general oscillation of flow in the Mound B and Low-lying areas. Verticalgradients within the four units indicate that net discharge from these units is to the Raritan River,either directly or indirectly. The refuse and sand-and-gravel units discharge directly into theRaritan River at high and low tides, respectively, while the bedrock unit discharges upward intothe sand-and-gravel unit, from which groundwater discharges to the river.
Land and Resource Use:
8
The Kin-Buc Site is located within an industrial and commercial area of Edison Township,which is zoned for light industry. Some residences are located between one and a half and twomiles to the north of the site. No drinking water supply wells, municipal or private, are locatedwithin a two-mile radius of the site. Upstream of the site, the city of New Brunswick withdrawswater from the Weston’s Mill Pond, which is fed by the Lawrence Brook, a tributary to theRaritan River which enters the river from the west, and the Delaware and Raritan Canal.
History of Contamination:
Landfilling began at the site in about 1947, accepting municipal, industrial, and hazardous waste. Kin-Buc, Inc. began operating the site in 1968. Between 1971 and 1976, Kin-Buc, Inc. operatedthe site as a state-approved landfill for industrial (solid and liquid) and municipal wastes. Hazardous wastes were disposed in the main landfill mound, Kin-Buc I, as well as in Kin-Buc II. EPA estimates, on the basis of owner-operator records, that approximately 70 million gallons ofliquid waste and at least one million tons of solid waste were disposed of at Kin-Buc between1973 and 1976. In 1976, the New Jersey Department of Environmental Protection (NJDEP)revoked Kin-Buc’s permit to operate because of violations of both state and federalenvironmental statutes. Little is known of the waste disposal history of Mound B, other than thefact that primarily municipal wastes were buried in the Mound.
The landfilled areas associated with the site are the Kin-Buc I and Kin-Buc II mounds; an areaeast of Kin-Buc I referred to as Pool C; the Low-Lying Area, which begins just south of Kin-BucI; and, Mound B, which is on the Raritan River south and west of Kin-Buc I and the Low-LyingArea. The following adjacent areas have also been affected by contaminant migration from thesite: Edmonds Creek, the wetlands associated with Edmonds Creek, and Mill Brook/MartinsCreek.
Initial Response:
EPA’s involvement with the site began in 1976 during investigation of an oil spill at the site,which revealed discharge of hazardous substances from the facility. EPA filed initial chargesagainst the owner-operators in 1979, under such statutes as the Water Pollution Control Act, andthe Solid Waste Disposal Act as amended by the Resource Conservation and Recovery Act(RCRA). Under a 1980 partial settlement, Kin-Buc, Inc. (and not the other defendants) agreed toinstall a landfill cap and initiate a long-term monitoring program, but not to remediate the site orcontrol the further migration of contaminants in the area. Therefore, in 1980, EPA begancleanup activities under Section 311 (k) of the Clean Water Act, collecting aqueous and oilyleachate from the Pool C area for treatment and disposal.
In September 1983, the site was added to the National Priorities List (NPL).
Basis for Taking Action:
Operable Unit 1. The RI identified highly contaminated landfill leachate and groundwatercontamination emanating from the refuse in the Kin-Buc I and Kin-Buc II mounds, containingvolatile organic compounds (VOCs), metals, pesticides, and polychlorinated byphenyls (PCBs). These constituents appeared to have migrated from the Kin-Buc I and Kin-Buc II mounds towardthe Low-Lying Area, Mound B, and the Raritan River to the west, and Pool C and the EdmondsCreek marsh to the east. The RI also concluded that the landfill closure efforts were inadequateand that releases from the source areas were continuing. A ROD for this unit was issued inSeptember 1988. OU1 consists of the following components: Kin-Buc I and II, Pool C, and the
9
Low-lying area between Kin-Buc I and the Edison Landfill.
Operable Unit 2. The second operable unit (OU2) included adjacent areas affected bycontaminant migration from the landfill and was focused on evaluation that nature and extent ofgroundwater contamination in the Low-lying Area and Mound B; wetlands contamination in theEdmonds Creek/Marsh system; and, surface water contamination in Edmonds Creek and MillBrook/Martins Creek. The OU1 ROD required that an RI/FS be conducted for these OU2 areas.
The OU2 ROD was signed in September 1992.
Contaminants:
Contaminants were found in the refuse unit leachate, as well as in groundwater from the sand-and-gravel unit and, at very low levels, in the bedrock aquifer. Leachate in the refuse unitcontains volatile organic compounds (VOCs), base-neutral/acid extractable compounds (BNAs),metals and pesticides, and polychlorinated byphenyls (PCBs), these being similar to thecontaminants found emanating from Kin-Buc I and Kin-Buc II. The sand-and-gravel unitcontained similar VOCs and BNAs as were found in the refuse unit, although at lowerconcentrations. These constituents also appear to have migrated from the landfill mounds. Thebedrock unit contained very low levels of VOCs, which may also be attributed to migration fromKin-Buc I.
While Table 8 of the OU2 ROD identified 16 Chemicals of Concern in the sediments, surfacewater and groundwater, including VOCs, PAHs, Phthalates, Pesticides, PCBs, and metals, theOU2 ROD only established one cleanup goal of 5 ppm PCBs in sediments. The rationale behindthis decision was that the implementation of source control, provided for in the OU1 remedialaction, would be sufficient to prevent further migration into the environment. In addition,contaminants which have already migrated into the groundwater would be gradually reduced bynatural attenuation to acceptable levels.
IV. Remedial Actions
OU1 Remedy Selection:
The EPA issued the first of two RODs for the site on September 30, 1988. This first RODdivided the site into two remedial phases known as operable units: Operable Unit 1 (OU1)consists of the Kin-Buc I and II mounds, as well as portions of the Low-Lying Area (betweenKin-Buc I and the Edison Landfill) and Pool C. The selected remedial action for OU1, intendedto provide source control for the landfill mounds, consisted of the following components:
# installation of a circumferential slurry wall to bedrock on all of the sides of thesite;
# maintenance, and upgrading if necessary, of the Kin-Buc I cap and installation ofa cap in accordance with RCRA Subtitle C and State requirements on Kin-Buc II,portions of the low-lying area between Kin-Buc I and the Edison Landfill andPool C;
# collection and off-site incineration of oily phase leachate;# collection and on-site treatment of aqueous phase leachate and contaminated
groundwater with disposal via direct surface water discharge;# periodic monitoring; and# operation and maintenance.
10
OU1 Remedy Implementation:
The OU1 Remedial Action construction was initiated in June 1993. The slurry wall and landfillcap were substantially completed in May 1995, and the leachate collection and groundwatertreatment system started operation in April 1995. A Remedial Action Report for the OU1remedy was approved by EPA on June 18, 1996. An addendum to this Remedial Action Report,(covering a portion of OU1 known as the Oil Seeps Area) was approved on May 9, 1997.
OU2 Remedy Selection:
On September 28, 1992, EPA issued the ROD for OU2. OU2 consisted in adjacent areasimpacted by contaminant migration for the landfill mounds. These areas were the remaining of the Low-Lying Area and Mound B; wetlands contamination in the Edmonds Creek/Marshsystem; and surface-water contamination in Edmonds Creek and Mill Brook/Martins Creek.
The major components of the remedy selected under the 1992 ROD for OU2 were:
# the excavation of an estimated 2,200 cubic yards of sediments withPolychlorinated Byphenyls (PCBs) at levels greater than 5 parts per million(ppm);
# consolidation of the excavated sediments within the OU1 containment system;# restoration of wetlands areas impacted by the excavation of contaminated
sediments; and# long-term monitoring of ground and surface water to ensure the effectiveness of
the remedy.
OU2 Remedy Implementation:
The Remedial Action for OU2 was initiated in June 1994. Approximately 9,400 cubic yards ofPCB-contaminated sediments were excavated from five separate zones located within theEdmonds Creek/Marsh system where PCB concentrations exceeded the cleanup goal of 5 ppm. The excavated sediments were placed within the OU1 slurry wall, and the wetland areas werethen restored. A Remedial Action Report for the OU2 Remedial Action was approved by EPAon January 29, 1996.
During the construction of the OU1 remedy, buried drums were detected in Mound B, an areanot previously thought to be used for hazardous waste disposal. Consequently, EPA conducted afurther investigation, which lead to the excavation and removal of drums containing suspectedhazardous materials. The details of this investigation and subsequent response action arememorialized in an Explanation of Significant Differences (ESD), issued in 2001, which is adocument that addresses and documents changes that occur to a remedy after a ROD is signed.
System Operations/Operation and Maintenance (O&M):
Operation and Maintenance (O&M) for both OU1 and OU2 encompass the following activities:
# aqueous phase leachate/groundwater collection and treatment system;# groundwater/surface water monitoring# landfill gas monitoring;# restoration and mitigation monitoring for two separate wetland areas;# and biota monitoring in the Edmonds Creek area.
11
The start dates for these activities span from April 1995 (start of collection and treatment plantsystems) to April 1998 (the beginning of OU1 wetlands mitigation monitoring).
The O&M program serves several purposes, among which are:
# to provide hydraulic containment (inward gradient) within the perimeter of theslurry wall (OU1);
# to assess the hydraulic performance of the slurry wall;# to monitor offsite gas migration;# and, by the scheduled sampling of the leachate influent, effluent, and of the
groundwater, to assess whether the remedy is working properly.
The primary objectives of the 1988 and 1992 RODs are to control the source of contamination atthe site, to mitigate any off-site impacts resulting from migration of contaminants, and tominimize any potential human health and ecological impacts resulting from the exposure tocontamination at the site. To evaluate the effectiveness of the remedial actions, a long-termprogram for the monitoring of water quality and landfill gas was designed. The long-termmonitoring program, which started in January 1996, included, for OU1, the installation of wellson either side of the slurry wall to monitor water quality and elevations in the three differenthydrogeologic units (refuse, sand and gravel, and bedrock), plus the monitoring of off-site gasmigration in those areas where gas migration or accumulation could cause potential problems. The OU2 groundwater and surface water network also provided for water quality monitoring inthe three water-bearing zones. In addition, wetlands monitoring (for OU1 and OU2) along withbiota monitoring requirements (for OU2) are also part of the remedy.
The parameters to monitor and the frequency of monitoring were as follows: once a year allmonitoring wells, as well as surface water locations, were tested for volatiles, semi-volatiles,pesticides/PCBs, dissolved metals, and chemistry (pH, BOD, COD, turbidity, etc.); the otherthree quarters only some of the dissolved metals and chemistry parameters were tested. However, gas monitoring wells were tested quarterly through the whole year for percentcombustible gas per volume (%GAS) and percent lower explosive limit (%LEL). Hydraulicmonitoring (to assess the hydraulic performance of the slurry wall, the desirable inward andupward flow conditions) was also to be conducted on a quarterly basis.
In addition, aqueous leachate (from the refuse zone) and groundwater (from the meadow mat)are extracted from several well locations and pumped to the Leachate Treatment Plant where it istreated to meet effluent limitations before discharging to the Raritan River. Waste oil (nonaqueous leachate) is not treated but is hauled for off-site disposal.
In February 1998, EPA agreed to the PRP’s petition for changing the frequency of thegroundwater and surface water monitoring program (from a quarterly to an annual basis) alongwith changes to the parameter list, including the addition of monitoring of groundwatergeochemical parameters. This change was approved after evaluating the appropriateness of theexisting monitoring program for detecting changes in water quality attributable to the completionof major components of the selected remedies for both operable units. The addition of thegroundwater geochemical parameters was necessary to adequately assess the long-term changes(trends) in the chemistry of groundwater in and around the landfill.
V. Progress Since the Last Review
12
This is the second five-year review for the site. The previous five-year review identifiedconcerns with the following remedy components: OU2 Wetlands Restoration and BiotaMonitoring Programs as well as with Mound B.
Wetlands and Biota. Edmonds Creek is an impacted waterway as a result of its proximity to avariety of water contaminant sources. The Kin-Buc OU2 remedy included sediment removal,wetlands restoration and follow up monitoring. This remedy was intended to reduce the impactof the Kin-Buc sources on the creek, wetlands, as well as the shoreline of the Raritan River.
The OU2 monitoring program was established in the OU2 Remedial Action Report, which wasapproved by EPA in January 1996 and included two separate monitoring activities: a WetlandsRestoration Monitoring Program (WRMP) and a Biota Monitoring Program (BMP). Eachmonitoring program required extensive field work and sampling for a period of five years. Thepurpose of the WRMP was to evaluate the effectiveness of the wetlands restoration that wasperformed after the remedy was implemented. The purpose of the BMP was to evaluate theoverall effectiveness of the OU2 remedy. Both five-year monitoring programs were complete bySeptember 2001 (2000 for the WRMP). The wetland restoration monitoring indicated that thecordgrass (Spartina Alterniflora) planting scheme for the area failed. The biota monitoringindicated that, while the levels of PCBs in sediments in Edmonds Creek were still substantiallyreduced from pre-remedial levels, measurements of PCBs greater than the cleanup goal of 5 ppmof PCBs had been detected periodically during the five years of monitoring, in addition to theevidence of PCB uptake in the biota of Edmonds Creek.
Given the fact that this monitoring suggested some remaining contamination, EPA has continuedecosystem monitoring in the creek and is considering other methods for investigating thepotential for continuing PCB-sources in the marsh area.
Mound B. Mound B remediation was conducted by the PRP following the issuance of theprevious five-year review. It consisted mainly of the removal of drums and is discussed in the2001 ESD.
VI. Five-Year Review ProcessAdministrative Components:
On February 17, 2004, Waste Management, through their representative and site manager, CarlJanuszkiewicz, was notified via electronic mail of the initiation of the five-year review.
The Kin-Buc Landfill Superfund Site Five-Year Review Team was led by Grisell V. Díaz-Cotto,Remedial Project Manager (RPM), Charles Nace, Risk Assessor, and Robert Alvey,Hydrogeologist.
The site inspection took place on March 18, 2004.
Community Notification and Involvement:
The EPA Community Relation Coordinator for the Kin-Buc Landfill Superfund Site, Pat Seppi, published a notice in the Home News Tribune, the area newspaper, on February 26, 2004,notifying the community of the initiation of the five-year review process. The notice indicatedthat upon completion of the five-year review, the document would be available to the public atthe Edison Public Library in Edison. In addition, the notice included the RPM’s name, addressand telephone number for questions related to the five-year review process or the Kin-Buc
13
Landfill Superfund Site in general.
Document Review:
This five-year review consisted of a review of the relevant documents including Operation andMaintenance records and Monitoring Data. Applicable ROD cleanup standards were reviewedas well as current groundwater cleanup standards.
Data Review:
Hydraulic Monitoring. In general, intragradient conditions in the OU1 refuse unit weremaintained, and overall, containment of groundwater in OU1 was achieved.
Leachate Withdrawal/Groundwater Pumping. Both groundwater and leachate collection weregenerally consistent with recommended withdrawal rates.
Landfill Gas Migration Monitoring. There is no apparent offsite gas migration.
Groundwater Sampling and Analysis (VOCs, SVOCs, Pesticides/PCBs, Metals, and GeneralChemistry for Refuse/Fill, Sand-and-Gravel, and Bedrock Monitoring Wells). In spite ofoccasional detections of concentrations and/or constituents in all or some of the different units,in general, there are no trends in the water quality data which would indicate that the remedy isnot protective.
Surface Water Sampling and Analysis (VOCs, SVOCs, Pesticides/PCBs, Metals, GeneralChemistry). In spite of occasional detections of concentrations and/or constituents in all or someof the four surface samples, in general, there are no trends in the data which would indicate thatthe site groundwater is impacting surface water quality.
Leachate treatment plant effluent. The analytical results, as reported in monthly DischargeMonitoring Reports, generally show compliance with the effluent limitations as established inthe New Jersey Discharge Elimination System permit equivalency.
Natural Attenuation Monitoring. In general, the data continues to suggest that there is a potentialfor biodegradation of chlorinated solvents in select areas of OU1 and OU2. However, additionaldata collection and evaluation is still required to determine the how attenuative is thebiodegradation mechanism at the site.
OU1 Wetlands. The monitoring program, which concluded in 2002, showed that the mitigationis progressing.
OU2 Wetlands. The monitoring period expired in 2000, with EPA’s conclusion that the plantingeffort was a failure. However, and given the fact that these restoration areas are concomitant tothose included in the Biota Monitoring Program, the PRPs were instructed to hold off on furtherrestoration efforts while the evaluation of any continuing sources of PCB was investigated.
Biota and Sediments. Sediment concentrations greater than the remediation goal of 5 ppm ofPCBs, in addition to evidence of biological uptake, continue to be found in portions of EdmondsCreek.
14
Site Inspection:
The site inspection was conducted on March 18, 2004, by the RPM and members of the ProgramSupport Branch. The purpose of the site inspection was to assess the protectiveness of theremedy, including the operation of the leachate and groundwater collection system, the treatmentplant, the landfill gas monitoring system, and the integrity of the soil covering the mounds aswell as the slurry wall.
No significant issues were identified during the inspection.
Interviews:
On March 11, 2004, a meeting took place with members of the Edison Wetlands Association(EWA) to discuss the present status of the site, including an update on the individual remedycomponents. Besides expressing some concerns, shared by EPA, regarding the monitoringresults on one of the study areas (Edmonds Creek), no significant problems regarding the sitewere identified during the meeting.
VII. Remedy Assessment
Question A: Is the remedy functioning as intended by the decision documents?
Yes. The primary objectives of the Record of Decision are being met. The former landfill hasbeen closed and fully capped, and the cap is maintained in appropriately protective condition. The methane collection system and slurry wall are functioning as intended. The groundwatercollection, treatment and disposal system continues to address the source of contamination at theSite.
It is noted that the groundwater treatment system appears to be in very good operating conditionand is well maintained. The monitoring well network consists of an adequate number andlocation of wells to address the site.
There is a sufficient groundwater sampling database available to recommend that the frequencyof sampling be re-evaluated. Some wells are difficult to sample due to lack of water, and anassessment should be conducted to determine if the wells need deepening. There may be a slightsavings in reducing the frequency of sampling (except for landfill gas) to a biannual basis. Theminor presence of semi-volatiles is noted, but do not appear to be a significant item of interest atthis point. On occasion, the intragradient conditions in the refuse unit were not fully maintainedat the well transects. EPA concurs that overall hydraulic control was maintained, and do notbelieve this to be a significant issue. Question B: Are the exposure assumptions, toxicity data, cleanup levels, and remedial actionobjectives (RAOs) used at the time of remedy selection still valid?
(a) The exposure assumptions that were used to estimate the potential risks and hazards that maybe present at the site could change as science or policies change. These changes could result inincreases or decreases to the risks or hazards that were calculated in the human health riskassessment. The exposure assumptions that are typically used have not significantly changedover the past twenty years and the exposure assumptions used in the risk assessment were similarto those that would currently be used. Therefore the calculated risk and hazards associated withthe site would only have minor fluctuations and would not result in a different decision being
1/ Federal: RCRA Standards and SDWA MCLS. State: NJAC Standards Class GW2 andSDWA MCLS. TBCs: NJDEPE Proposed GW Cleanup Standards and NJDEPE Proposed GWQuality Standards
15
made.
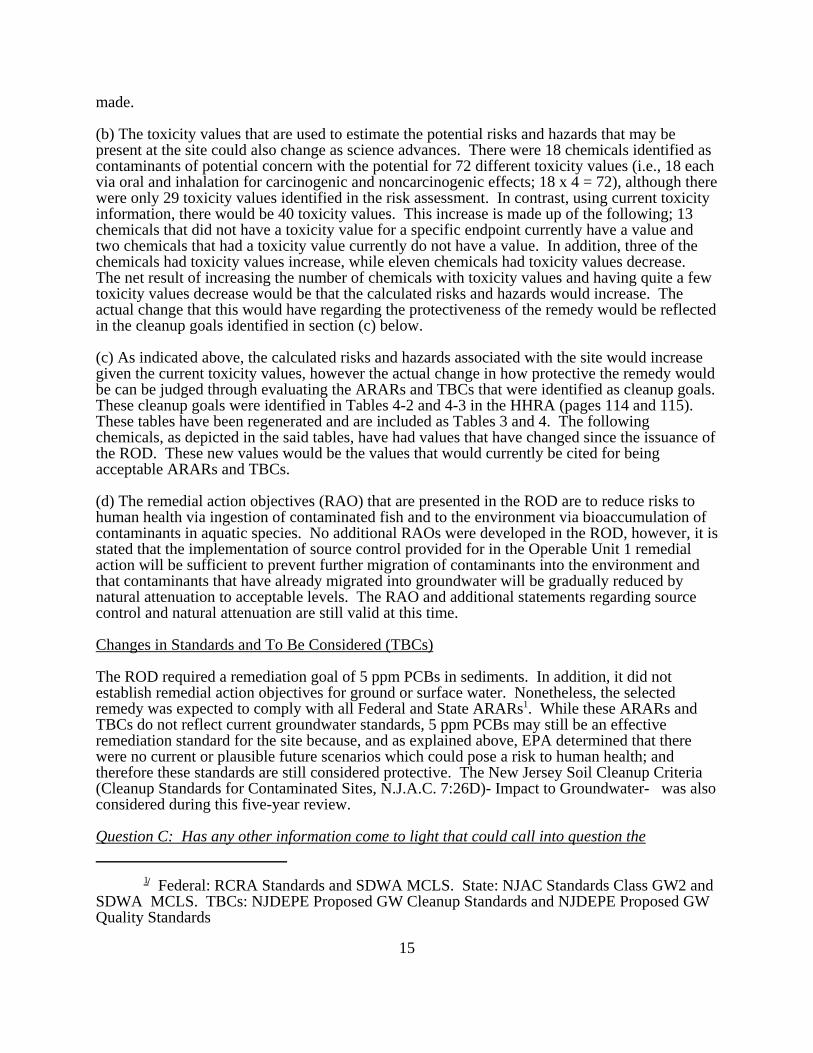
(b) The toxicity values that are used to estimate the potential risks and hazards that may bepresent at the site could also change as science advances. There were 18 chemicals identified ascontaminants of potential concern with the potential for 72 different toxicity values (i.e., 18 eachvia oral and inhalation for carcinogenic and noncarcinogenic effects; 18 x 4 = 72), although therewere only 29 toxicity values identified in the risk assessment. In contrast, using current toxicityinformation, there would be 40 toxicity values. This increase is made up of the following; 13chemicals that did not have a toxicity value for a specific endpoint currently have a value andtwo chemicals that had a toxicity value currently do not have a value. In addition, three of thechemicals had toxicity values increase, while eleven chemicals had toxicity values decrease. The net result of increasing the number of chemicals with toxicity values and having quite a fewtoxicity values decrease would be that the calculated risks and hazards would increase. Theactual change that this would have regarding the protectiveness of the remedy would be reflectedin the cleanup goals identified in section (c) below.
(c) As indicated above, the calculated risks and hazards associated with the site would increasegiven the current toxicity values, however the actual change in how protective the remedy wouldbe can be judged through evaluating the ARARs and TBCs that were identified as cleanup goals. These cleanup goals were identified in Tables 4-2 and 4-3 in the HHRA (pages 114 and 115). These tables have been regenerated and are included as Tables 3 and 4. The followingchemicals, as depicted in the said tables, have had values that have changed since the issuance ofthe ROD. These new values would be the values that would currently be cited for beingacceptable ARARs and TBCs.
(d) The remedial action objectives (RAO) that are presented in the ROD are to reduce risks tohuman health via ingestion of contaminated fish and to the environment via bioaccumulation ofcontaminants in aquatic species. No additional RAOs were developed in the ROD, however, it isstated that the implementation of source control provided for in the Operable Unit 1 remedialaction will be sufficient to prevent further migration of contaminants into the environment andthat contaminants that have already migrated into groundwater will be gradually reduced bynatural attenuation to acceptable levels. The RAO and additional statements regarding sourcecontrol and natural attenuation are still valid at this time.
Changes in Standards and To Be Considered (TBCs)
The ROD required a remediation goal of 5 ppm PCBs in sediments. In addition, it did notestablish remedial action objectives for ground or surface water. Nonetheless, the selectedremedy was expected to comply with all Federal and State ARARs1. While these ARARs andTBCs do not reflect current groundwater standards, 5 ppm PCBs may still be an effectiveremediation standard for the site because, and as explained above, EPA determined that therewere no current or plausible future scenarios which could pose a risk to human health; andtherefore these standards are still considered protective. The New Jersey Soil Cleanup Criteria(Cleanup Standards for Contaminated Sites, N.J.A.C. 7:26D)- Impact to Groundwater- was alsoconsidered during this five-year review.
Question C: Has any other information come to light that could call into question the
16
protectiveness of the remedy?
No other information has come to light that could call into question the protectiveness of theremedy.Remedy Assessment Summary
With the exception of the Biota monitoring results, as explained before, according to the datareviewed and the site inspection, the remedy is functioning as intended by the ROD.
There have been no changes in the physical conditions of the site that would affect theprotectiveness of the remedy.
Hydraulic Monitoring: The results show that overall, lower hydraulic heads inside the slurrywall (relative to outside of it) are maintained, representing intragradient flow conditions, andtherefore minimizing the potential for contaminant migration beyond the slurry wall.
Leachate Withdrawal/Groundwater Pumping: The leachate withdrawal and groundwaterpumping rates are generally achieving an upward vertical gradient between the bedrock and theoverlying sand-and-gravel deposits, and thus minimizing the potential for vertical migration ofcontaminants into the bedrock groundwater aquifer. There are no drinking water wells withinthe contaminated area and none are expected to be installed due to existing state restrictions.
Landfill Gas Migration monitoring: The active gas collection system appears to be functioningproperly, and there is no apparent offsite gas migration.
Groundwater Quality: Concentrations of constituents identified in OU1 and OU2 monitoringwells are ordinarily consistent with those identified during previous monitoring events.
Surface Water Quality: Results do not show the site’s groundwater to be impacting the surfacewater.
Leachate treatment plant effluent: In the overall, data show compliance with the effluentlimitations as established in the New Jersey Discharge Elimination System Permit Equivalency.
Natural Attenuation Monitoring: In general, the data continues to suggest that there is apotential for biodegradation of chlorinated solvents in select areas of OU1 and OU2.
OU1 Wetlands: The monitoring program, which concluded in 2002, showed that the restorationis progressing.
OU2 Wetlands, Surface Waters, Sediments and Biota: The Kin-Buc site is a large site located inan impacted urban area. The site remedy provided for the containment of site contaminants withthe long term expectation of the full recovery of wetlands, surface waters, sediments and biota. The remedy has been implemented and the monitoring indicates that the containment remedy iseffective. Monitoring indicates some remaining impacts remain. This site may contain someresidual contamination that is either associated with background concentrations or comes fromsources other than a release from this site. There are other local, state and federal environmentalcleanup authorities that may be needed to achieve a high level of ecological value. EPA, localenvironmental groups, NJDEP and local government need to continue a dialog on the generalarea and find appropriate responses outside of CERCLA.
This site does have long term operation, maintenance and monitoring responsibilities by the
17
PRPs. It is possible that future erosion could expose waste and contaminants, or groundwatermonitoring could suggest further action. The long term responsibility of the PRPs is importantfor the protection of the site.
Institutional and Access Controls: NJDEP has placed a Classification Exception Area at the site,which restricts groundwater use. Operating procedures, as specified in the operation andmaintenance manual for the site, impose other restrictions of land and resource use that protectthe engineered controls and minimize the potential for human exposure to contamination. Forinstance, the only road to the landfill is gated and signaled, dissuading unauthorized access. There is a chain-link fence and gates located around the land perimeter of the site which areinspected on a regular basis. The treatment plant building, located within the landfill premises,is also fenced and gated, providing double protection to its equipment and control systems. TheRaritan River and the Edmonds Creek Marsh Area serve as natural barriers which limit access inareas where it is impractical to locate a fence.
VIII. Recommendations and Follow-up Actions
This site is on an on-going operation and maintenance program which includes monitoringactivities. As expected by the decision documents, these activities are subjected to routinemodification and adjustment. This report contains no specific recommendations or follow-upactions necessary to protect human health or the environment.
IX. Protectiveness Statement(s)The implemented remedy at the Kin-Buc Landfill Superfund Site protects human health and theenvironment by containing site contaminants. There is no exposure to human receptors from sitecontaminants and none are anticipated during the next five years.
X. Next ReviewThe third five-year review for the Kin-Buc Landfill Superfund Site should be completed beforeSeptember 2009, five years after the date of this review.
Approved by:
___________________________ ____________________________George Pavlou, Director DateEmergency and Remedial Response Division
18
TABLES
19
Table 1: Chronology of Site Events
Events Date
Municipal, industrial and hazardous waste disposal site owned by InmarAssociates, Inc.
1947 to 1971
Operated as a landfill under a lease to Kin-Buc, Inc. 1968 to 1976
Operated as a state-approved landfill for industrial (solid and liquid) andmunicipal wastes. Hazardous wastes were also accepted.
1971 to 1976
An estimated 70 million gallons of liquid waste and at least one milliontons of solid waste were disposed of at the site. 1973 to 1976
NJDEPE revoked Kin-Buc’s permit to operate because of violations toboth state and federal environmental statutes.
1976
EPA’s involvement with the site began during an investigation of an oilspill which revealed the discharge of hazardous substances.
1976
EPA filed initial charges against owners/operators under twoenvironmental statutes.
1979
Under a partial settlement, Kin-buc, Inc. (and not the other defendants)agreed to install a landfill cap and initiate a monitoring program, but notto remediate the site or control further migration of contaminants.
1980
EPA began collection aqueous and oily leachate from the Pool C area fortreatment and disposal.
1980
Emergency permit issued by NJDEP to send pre-treated aqueous phaseleachate from Kin-Buc to the Middlesex County Utility Authority.
1981
Kin-Buc, Inc. assumed the Pool C removal operation from EPA. 1982
Final NPL listing. 1983
After failed negotiations, EPA issued a Unilateral Administrative Order(II-CERCLA-30102) against the initial 11 defendants requiring theongoing removal program, a RI/FS, and operation and maintenance.
1983
PRPs conducted a RI/FS. 1983 to 1988
EPA sent information requests to approximately 400 companies deemedPRPs.
1984
EPA issued and amended Unilateral Administrative Order (II-CERCLA-60105) to update the 1983 order to require the use of recent RI/FSguidance.
1986
88-2087, Consent Decree were EPA recovered 5 million in past andresponse cost form approximately half of the 400 PRPs.
1988
20
First of two RODs is issued. 1988
PRPs conducted a Remedial Design for OU1 1988 to 1993
PRPs conducted a RI/FS for OU2 1989 to 1992
II-CERCLA-00114, for a RI/FS for OU 2, and the RD/RA for OU 1 1990
ROD for OU2 is issued 1992
II-CERCLA-93-0101, for the OU2 RD/RA (design, construction andO&M)
1992
PRPs conducted a Remedial Action for OU1 1993 to 1997
PRPs conducted a Remedial Design for OU2 1992 to 1994
PRPs conducted a Remedial Action for OU2 1994 to 1996
EPA completed first five-year review 1999
EPA issued an ESD for the work performed at Mound B 2001
21
Table 2: Contaminants
1988 ROD’s Indicator Contaminants 1992 ROD’s Chemicals of Concern
VOCs VOCs
Benzene Benzene
Vinyl Chloride Carbon Disulfide
Chloroform Chlorobenzene
1, 1-Dichloroethene 1,2-Dichloroethene
Vinyl Chloride
Xylene
PAHs
Naphthalene
PHATHALATES
Bis(2-Ethylhexyl)Phathalate
PESTICIDES/PCBs PESTICIDES/PCBs
PCBs 4,4-DDT
PCBs
METALS METALS
Arsenic Antimony
Cadmium Arsenic
Lead Barium
Beryllium
Cadmium
Manganese
Nickel
Vanadium
Table 3: ARARs and TBCs for groundwater that were presented in theHuman Health Risk Assessment (Table 4-2)
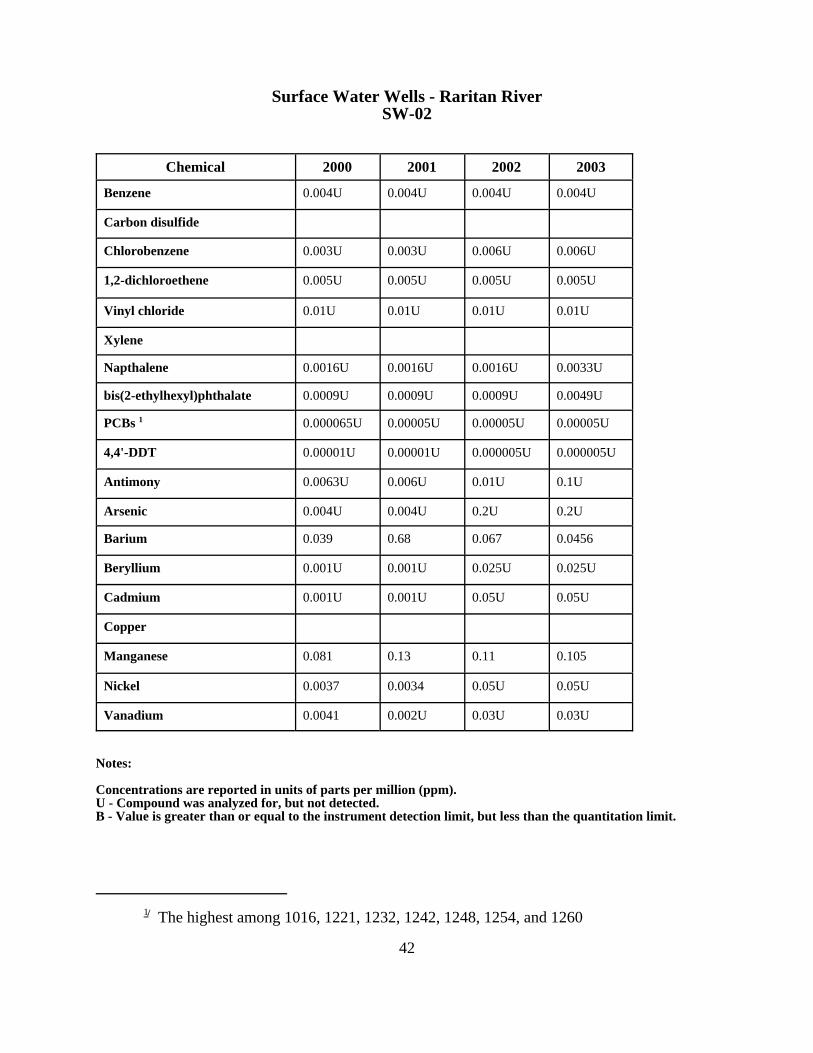
Concentrations are reported in units of parts per million (ppm).U - Compound was analyzed for, but not detected.B - Value is greater than or equal to the instrument detection limit, but less than the quantitation limit.
1/ The highest among 1016, 1221, 1232, 1242, 1248, 1254, and 1260
Concentrations are reported in units of parts per million (ppm).U - Compound was analyzed for, but not detected.B - Value is greater than or equal to the instrument detection limit, but less than the quantitation limit.D - Compound analyzed at a secondary dilution factor.
1/ The highest among 1016, 1221, 1232, 1242, 1248, 1254, and 1260
Concentrations are reported in units of parts per million (ppm).U - Compound was analyzed for, but not detected.B - Value is greater than or equal to the instrument detection limit, but less than the quantitation limit.
1/ The highest among 1016, 1221, 1232, 1242, 1248, 1254, and 1260
Concentrations are reported in units of parts per million (ppm).U - Compound was analyzed for, but not detected.B - Value is greater than or equal to the instrument detection limit, but less than the quantitation limit.
1/ The highest among 1016, 1221, 1232, 1242, 1248, 1254, and 1260
Concentrations are reported in units of parts per million (ppm).U - Compound was analyzed for, but not detected.B - Value is greater than or equal to the instrument detection limit, but less than the quantitation limit.
1/ The highest among 1016, 1221, 1232, 1242, 1248, 1254, and 1260
Concentrations are reported in units of parts per million (ppm).U - Compound was analyzed for, but not detected.B - Value is greater than or equal to the instrument detection limit, but less than the quantitation limit.
1/ The highest among 1016, 1221, 1232, 1242, 1248, 1254, and 1260
Concentrations are reported in units of parts per million (ppm).U - Compound was analyzed for, but not detected.B - Value is greater than or equal to the instrument detection limit, but less than the quantitation limit.J - Value is estimated.
1/ The highest among 1016, 1221, 1232, 1242, 1248, 1254, and 1260
Concentrations are reported in units of parts per million (ppm).U - Compound was analyzed for, but not detected.B - Value is greater than or equal to the instrument detection limit, but less than the quantitation limit.
1/ The highest among 1016, 1221, 1232, 1242, 1248, 1254, and 1260
Concentrations are reported in units of parts per million (ppm).U - Compound was analyzed for, but not detected.B - Value is greater than or equal to the instrument detection limit, but less than the quantitation limit.
1/ The highest among 1016, 1221, 1232, 1242, 1248, 1254, and 1260
Concentrations are reported in units of parts per million (ppm).U - Compound was analyzed for, but not detected.B - Value is greater than or equal to the instrument detection limit, but less than the quantitation limit.
1/ The highest among 1016, 1221, 1232, 1242, 1248, 1254, and 1260
Concentrations are reported in units of parts per million (ppm).U - Compound was analyzed for, but not detected.B - Value is greater than or equal to the instrument detection limit, but less than the quantitation limit.
1/ The highest among 1016, 1221, 1232, 1242, 1248, 1254, and 1260
Concentrations are reported in units of parts per million (ppm).U - Compound was analyzed for, but not detected.B - Value is greater than or equal to the instrument detection limit, but less than the quantitation limit.
1/ The highest among 1016, 1221, 1232, 1242, 1248, 1254, and 1260
Concentrations are reported in units of parts per million (ppm).U - Compound was analyzed for, but not detected.B - Value is greater than or equal to the instrument detection limit, but less than the quantitation limit.
1/ The highest among 1016, 1221, 1232, 1242, 1248, 1254, and 1260
Concentrations are reported in units of parts per million (ppm).U - Compound was analyzed for, but not detected.B - Value is greater than or equal to the instrument detection limit, but less than the quantitation limit.
1/ The highest among 1016, 1221, 1232, 1242, 1248, 1254, and 1260
Concentrations are reported in units of parts per million (ppm).U - Compound was analyzed for, but not detected.B - Value is greater than or equal to the instrument detection limit, but less than the quantitation limit.
1/ The highest among 1016, 1221, 1232, 1242, 1248, 1254, and 1260
Concentrations are reported in units of parts per million (ppm).U - Compound was analyzed for, but not detected.B - Value is greater than or equal to the instrument detection limit, but less than the quantitation limit.
1/ The highest among 1016, 1221, 1232, 1242, 1248, 1254, and 1260
Concentrations are reported in units of parts per million (ppm).U - Compound was analyzed for, but not detected.B - Value is greater than or equal to the instrument detection limit, but less than the quantitation limit.
1/ The highest among 1016, 1221, 1232, 1242, 1248, 1254, and 1260
Concentrations are reported in units of parts per million (ppm).U - Compound was analyzed for, but not detected.B - Value is greater than or equal to the instrument detection limit, but less than the quantitation limit.
1/ The highest among 1016, 1221, 1232, 1242, 1248, 1254, and 1260
Concentrations are reported in units of parts per million (ppm).U - Compound was analyzed for, but not detected.B - Value is greater than or equal to the instrument detection limit, but less than the quantitation limit.
1/ The highest among 1016, 1221, 1232, 1242, 1248, 1254, and 1260
Concentrations are reported in units of parts per million (ppm).U - Compound was analyzed for, but not detected.B - Value is greater than or equal to the instrument detection limit, but less than the quantitation limit.
45
ATTACHMENTS
46
List of Documents Reviewed
1. Five-Year Review Report for the Kin-Buc Landfill Superfund Site - February 19992. Record of Decision for the Kin-Buc Landfill Superfund Site - September 19883. Record of Decision for the Kin-Buc Landfill Superfund Site - September 19924. OU2 Remedial Investigation/Feasibility Study5. Operation and Maintenance Manual - August 19966. Monitoring Reports
- Fourth Quarter/Annual for 2003- Fourth Quarter/Annual for 2002- Fourth Quarter/Annual for 2001- Third Quarter, 2001- Fourth Quarter/Annual for 2000- Fourth Quarter/Annual for 1999- Third Quarter, 1999- Second Quarter, 1999- First Quarter, 1999
7. OU1 Wetlands Monitoring Reports, 1999 to 20028. OU2 Wetlands Monitoring Reports, 1999 to 20009. Biota Monitoring Reports, 1999 to 200310. Discharge Monitoring Reports - sample, 1999 to 2003