SECOND-ORDER DRAFT IPCC WGII AR5 Chapter 23 Do Not Cite, Quote, or Distribute 1 28 March 2013 Chapter 23. Europe 1 2 Coordinating Lead Authors 3 Sari Kovats (UK), Riccardo Valentini (Italy) 4 5 Lead Authors 6 Laurens M Bouwer (Netherlands), Elena Georgopoulou (Greece), Daniela Jacob (Germany), Eric Martin (France), 7 Mark Rounsevell (UK), Jean-Francois Soussana (France) 8 9 Contributing Authors 10 Martin Beniston (Switzerland), Maria Vincenza Chiriacò (Italy), Philippe Cury (France), Michael Davies (United 11 Kingdom), Paula Harrison (United Kingdom), Olaf Jonkeren (Italy), Mark Koetse (Netherlands), Markus Lindner 12 (Finland), Andreas Matzarakis (Germany), Reinhard Mechler (Germany), Annette Menzel (Germany), Marc 13 Metzger (UK), Luca Montanarella (Italy), Antonio Navarra (Italy), Juliane Peterson (Germany), Martin Price (UK), 14 Boris Revich (Russia), Piet Rietveld (Netherlands), Cristina Sabbioni (Italy), Yannis Sarafidis (Greece), Philipp 15 Schmidt-Thomé (Finland), Vegard Skirbekk (Austria), Donatella Spano (Italy), Jan E Vermaat (Netherlands), 16 Meriwether Wilson (UK), Thomasz Zylicz (Poland) 17 18 Review Editors 19 Lucka Kajfez Bogataj (Slovenia), Roman Corobov (Moldova), Ramón Vallejo (Spain) 20 21 22 Contents 23 24 Executive Summary 25 26 23.1. Introduction 27 23.1.1. Scope and Route Map of Chapter 28 23.1.2. Policy Frameworks 29 23.1.3. Conclusions from Previous IPCC Assessments 30 31 23.2. Current and Future Trends 32 23.2.1. Non-Climate Trends 33 23.2.2. Observed and Projected Climate Change 34 23.2.2.1. Observed Climate Change 35 23.2.2.2. Projected Climate Changes 36 23.2.2.3. Projected Changes in Extremes 37 23.2.3. Observed and Projected Trends in the River Flow and Drought 38 39 23.3. Implications of Climate Change for Production Systems and Physical Infrastructure 40 23.3.1. Settlements 41 23.3.1.1. Coastal Flooding 42 23.3.1.2. River and Pluvial Flooding 43 23.3.1.3. Landslides 44 23.3.2. Housing 45 23.3.3. Transport 46 23.3.4. Energy Production, Distribution and Use 47 23.3.5. Industry and Manufacturing 48 23.3.6. Tourism 49 23.3.7. Insurance and Banking 50 51 23.4. Implications of Climate Change for Agriculture, Fisheries, Forestry, and Bioenergy Production 52 23.4.1. Plant (Food) Production 53 23.4.2. Livestock Production 54
Transcript
SECOND-ORDER DRAFT IPCC WGII AR5 Chapter 23
Do Not Cite, Quote, or Distribute 1 28 March 2013
Chapter 23. Europe 1 2 Coordinating Lead Authors 3 Sari Kovats (UK), Riccardo Valentini (Italy) 4 5 Lead Authors 6 Laurens M Bouwer (Netherlands), Elena Georgopoulou (Greece), Daniela Jacob (Germany), Eric Martin (France), 7 Mark Rounsevell (UK), Jean-Francois Soussana (France) 8 9 Contributing Authors 10 Martin Beniston (Switzerland), Maria Vincenza Chiriacò (Italy), Philippe Cury (France), Michael Davies (United 11 Kingdom), Paula Harrison (United Kingdom), Olaf Jonkeren (Italy), Mark Koetse (Netherlands), Markus Lindner 12 (Finland), Andreas Matzarakis (Germany), Reinhard Mechler (Germany), Annette Menzel (Germany), Marc 13 Metzger (UK), Luca Montanarella (Italy), Antonio Navarra (Italy), Juliane Peterson (Germany), Martin Price (UK), 14 Boris Revich (Russia), Piet Rietveld (Netherlands), Cristina Sabbioni (Italy), Yannis Sarafidis (Greece), Philipp 15 Schmidt-Thomé (Finland), Vegard Skirbekk (Austria), Donatella Spano (Italy), Jan E Vermaat (Netherlands), 16 Meriwether Wilson (UK), Thomasz Zylicz (Poland) 17 18 Review Editors 19 Lucka Kajfez Bogataj (Slovenia), Roman Corobov (Moldova), Ramón Vallejo (Spain) 20 21 22 Contents 23 24 Executive Summary 25 26 23.1. Introduction 27
23.1.1. Scope and Route Map of Chapter 28 23.1.2. Policy Frameworks 29 23.1.3. Conclusions from Previous IPCC Assessments 30
23.2.3. Observed and Projected Trends in the River Flow and Drought 38 39 23.3. Implications of Climate Change for Production Systems and Physical Infrastructure 40
23.3.1. Settlements 41 23.3.1.1. Coastal Flooding 42 23.3.1.2. River and Pluvial Flooding 43 23.3.1.3. Landslides 44
23.3.2. Housing 45 23.3.3. Transport 46 23.3.4. Energy Production, Distribution and Use 47 23.3.5. Industry and Manufacturing 48 23.3.6. Tourism 49 23.3.7. Insurance and Banking 50
51 23.4. Implications of Climate Change for Agriculture, Fisheries, Forestry, and Bioenergy Production 52
23.4.1. Plant (Food) Production 53 23.4.2. Livestock Production 54
SECOND-ORDER DRAFT IPCC WGII AR5 Chapter 23
Do Not Cite, Quote, or Distribute 2 28 March 2013
23.4.3. Water Resources and Agriculture 1 23.4.4. Forestry 2 23.4.5. Bioenergy Production 3 23.4.6. Fisheries and Aquaculture 4
5 23.5. Implications of Climate Change for Health and Social Welfare 6
23.5.1. Human Population Health 7 23.5.2. Health Systems and Critical Infrastructure 8 23.5.3. Social Impacts 9 23.5.4. Cultural Heritage and Landscapes 10
11 23.6. Implications of Climate Change for Environmental Quality and Biological Conservation 12
23.6.1. Air Quality 13 23.6.2. Soil Quality 14 23.6.3. Water Quality 15 23.6.4. Terrestrial and Freshwater Ecosystems 16 23.6.5. Coastal and Marine Ecosystems 17
18 23.7. Cross-Sectoral Adaptation Decision-making and Risk Management 19
23.7.1. Coastal Zone Management 20 23.7.2. Integrated Water Resource Management 21 23.7.3. Disaster Risk Reduction and Risk Management 22 23.7.4. Land Use Planning 23 23.7.5. Rural Development 24 23.7.6. Economic Assessments of Adaptation 25
26 23.8. Co-Benefits and Unintended Consequences of Adaptation and Mitigation 27
23.8.1. Production and Infrastructure 28 23.8.2. Agriculture, Forestry, Bioenergy 29 23.8.3. Social and Health Impacts 30 23.8.4. Environmental Quality and Biological Conservation 31
32 23.9. Intra-Regional and Inter-Regional Issues 33
23.9.1. Implications of Climate Change for Distribution of Economic Activity within Europe 34 23.9.2. Climate Change Impacts Outside Europe and Inter-Regional Implications 35
36 23.10. Synthesis of Key Findings 37
23.10.1. Key Vulnerabilities 38 23.10.2 Effects of Observed Climate Change in Europe 39 23.10.3. Key Knowledge Gaps and Research Needs 40
41 Frequently Asked Questions 42
23.1: Will I still be able to live on the coast in Europe? 43 23.2: Will climate change introduce new infectious diseases into Europe? 44 23.3: Will Europe need to import more food because of climate change? 45
46 References 47 48 49 Executive Summary 50 51 Observed climate trends and future projections confirm the main conclusions of AR4 regarding current and future 52 climate change in Europe [23.2]: climate models project significant changes in temperature [high confidence] and 53 rainfall [high confidence] in Europe [23.2.1] with increases in temperature projected throughout Europe and 54
SECOND-ORDER DRAFT IPCC WGII AR5 Chapter 23
Do Not Cite, Quote, or Distribute 3 28 March 2013
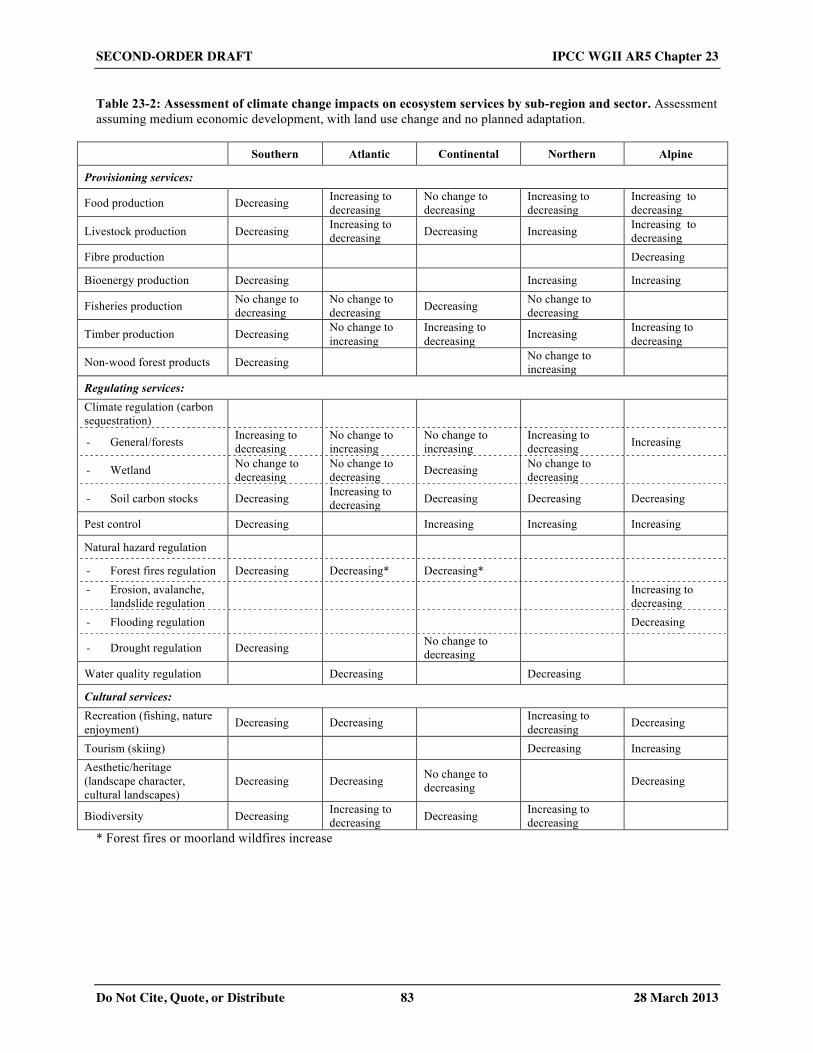
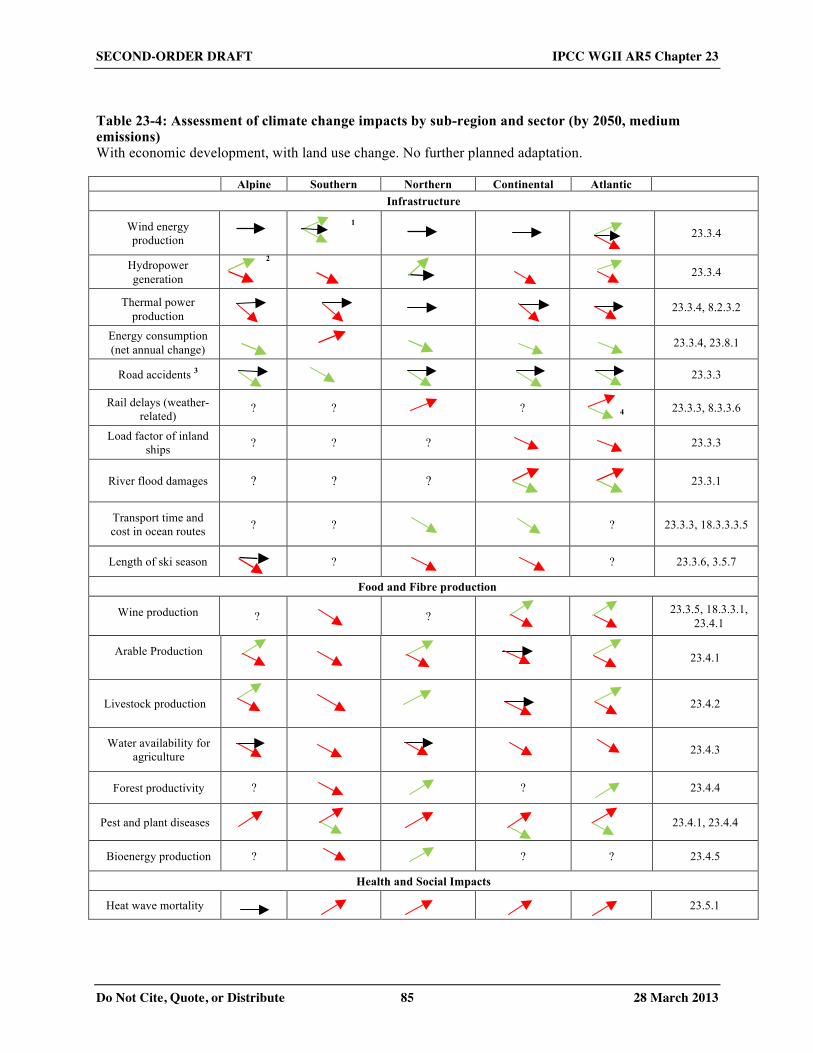
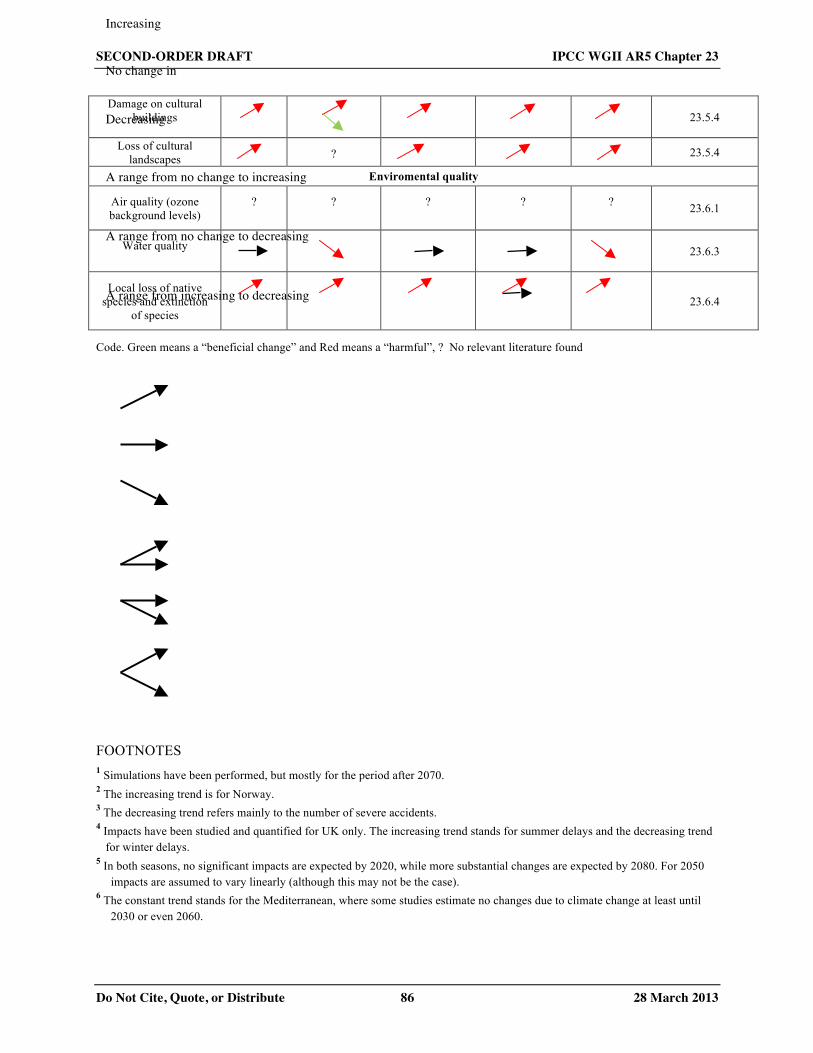
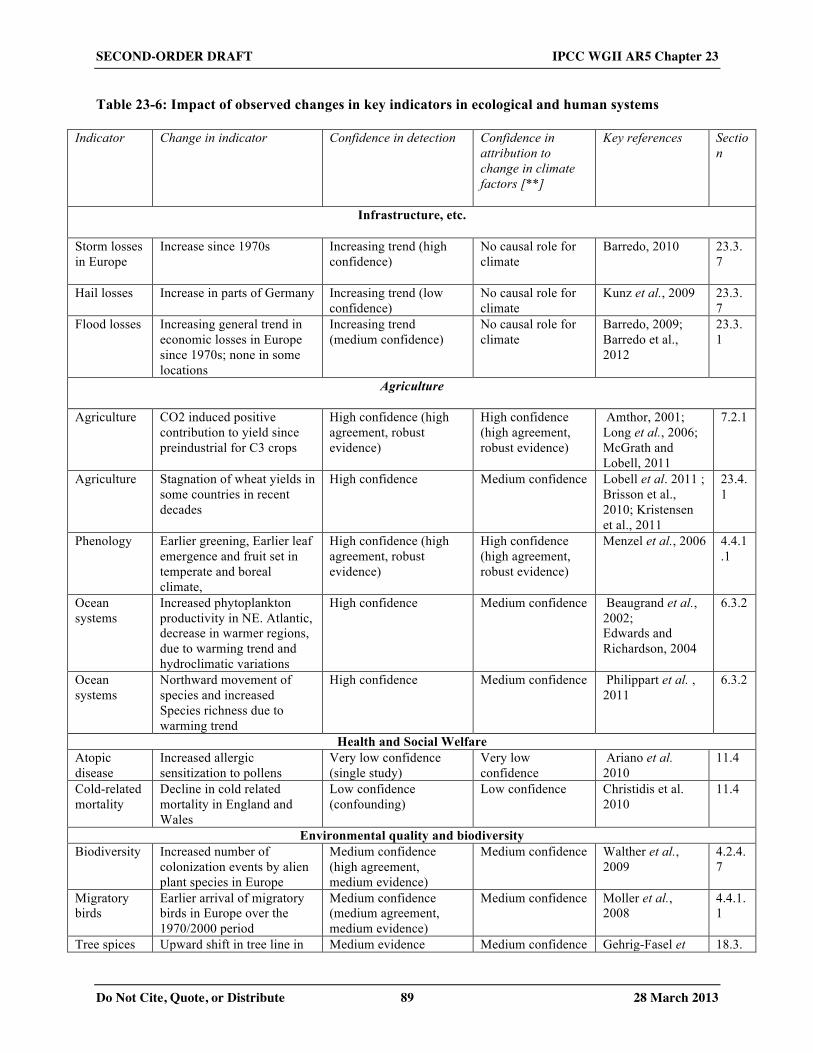
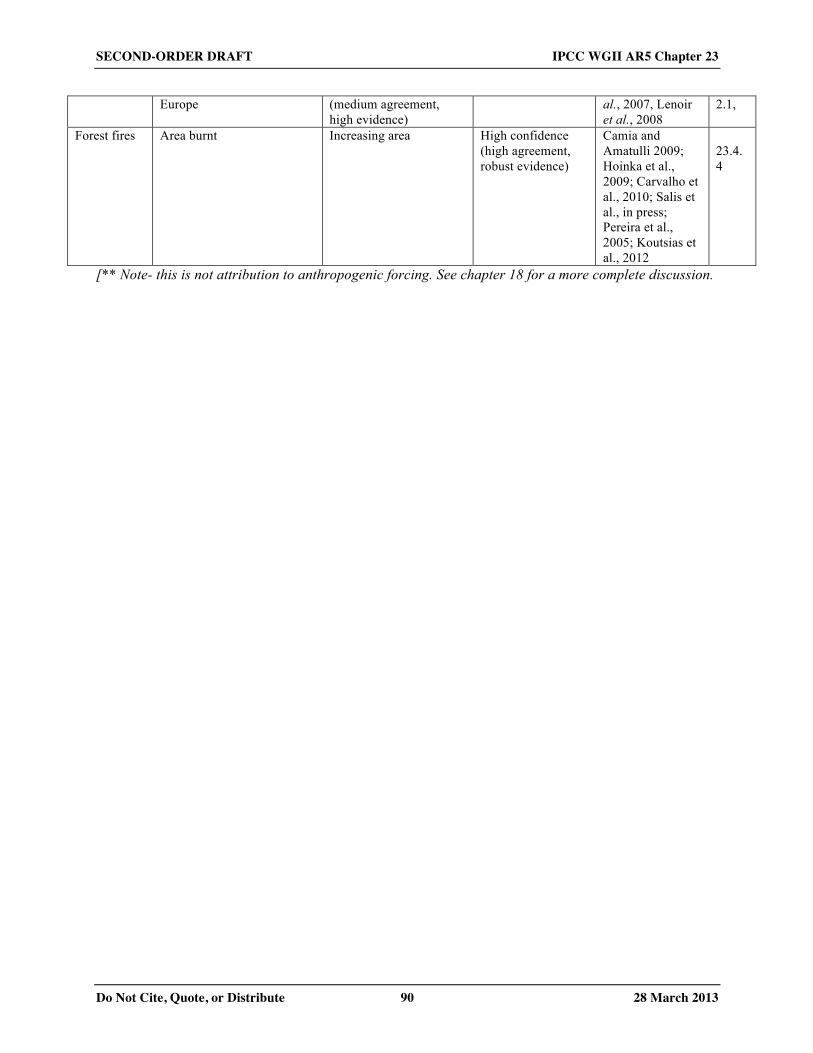
increasing precipitation in the North and decreasing precipitation in the South [23.2.2.2]. There will be a marked 1 increase in the frequency and intensity of heat waves [high confidence], meteorological droughts [medium 2 confidence] and heavy precipitation events [high confidence] with variations across Europe [23.2.2.3]; small or no 3 change in wind speed extremes [low confidence] except increases in winter peak wind speed over Northern Europe 4 [medium confidence] [23.2.2.3]. 5 6 Climate change in Europe has already affected multiple sectors: distribution and composition of animals and plant 7 species [high confidence] [Table 23.6, Table 23.4, 23.6.4]; crop yields in relation to European sub-regions 8 [medium/high confidence] [23.4.1]; health, particularly in Southern Europe [medium confidence] [23.5.1]; forests 9 due to increase of wildfires in Southern Europe [high confidence] and from storms [low confidence] [23.4.4] and 10 European cultural heritage[low confidence] [23.5.4] [Table 23.6]. The observed impacts of extreme weather events 11 indicates the current vulnerability of Europe across multiple sectors [Table 23.3]. Climate change will increase the 12 frequency and intensity of heat waves, particularly in Southern Europe [high confidence] [23.2.2] with adverse 13 implications for health, agriculture, energy production, transport, tourism, labour productivity, and built 14 environment [Table 23.4]. 15 16 Climate change in Europe will affect multiple sectors [Table 23-4]. All of the ecosystem services (Provisioning, 17 Regulating and Cultural services) will be degraded by climate change at least in one or more European sub-regions. 18 The most affected ecosystem services are: Cultural, Regulating and Provisioning services [Table 23.2]. 19 20 Climate change will affect economic activity in southern Europe more than other sub-regions [medium confidence] 21 [Table 23.4, 23.9.1], and increase future intra-regional disparity [low confidence] [23.9]. The Mediterranean (part of 22 Southern region) is particularly vulnerable to climate change [high confidence] as multiple sectors will be adversely 23 affected (tourism, agriculture, forestry, infrastructure, energy, population health) [high confidence] [23.9] [Box 23-24 3]. Compared to AR4, there is more evidence of risks in northern Europe in several sectors. Shifts in agriculture 25 production across sub-regions will occur [medium confidence]. Loss of ecosystem services is projected in Alpine 26 regions [high confidence] [23.10]. 27 28 Synthesis of evidence across sectors and subregions confirm that there are limits to adaptation from social, economic 29 and technological factors [23.5]. Adaptation is further impeded because climate change affects multiple sectors 30 [23.10]. The majority of assessments are based on climate projections driven by lower emissions than the current 31 trajectory. Limited evidence exists potential impacts in Europe under high rates of warming (>3-4 degrees per 32 century) [23.10], with the exception of some studies of crop yields. 33 34 Sectoral impacts 35 Direct economic river flood damages in Europe have increased over recent decades [high confidence] but this 36 increase is due to development in flood zones and not due to observed climate change [23.3.1.2, SREX 4.5]. Some 37 areas in Europe show changes in river flood occurrence related to observed changes in extreme river discharge 38 [medium confidence] [23.2.3]. Climate change is likely to further increase coastal and river flood risk in Europe and, 39 if unabated, will substantially increase flood damages (monetary losses and people affected) [23.3.1, 23.5.1]. 40 Adaptation can prevent most of the projected damages [high confidence – based on medium evidence, high 41 agreement] [23.3.1; 23.7.1; 23.8.3]. Climate change will increase the problems associated with overheating in 42 domestic housing [medium confidence] [section 23.3.2]. 43 44 No significant impacts are projected before 2050 in winter or summer tourism except for ski tourism in low altitude 45 and mid altitude sites and under limited adaptation [medium confidence] [23.3.6]. After 2050, tourism activity will 46 decrease in southern Europe [low confidence] and increase in northern/continental Europe [medium confidence]. 47 Artificial snowmaking will prolong the activity of some ski resorts [medium confidence] [23.3.6]. 48 49 Climate change will affect the impacts of hot and cold weather extremes on transport leading to economic damage 50 and/or adaptation costs, as well as some benefits (e.g. reduction of maintenance costs) during winter [medium 51 confidence] [23.3.3]. Climate change will reduce severe accidents in road transport [medium confidence] and 52 adversely affect inland water transport particularly the Rhine in summer after 2050 [medium confidence]. Damages 53
SECOND-ORDER DRAFT IPCC WGII AR5 Chapter 23
Do Not Cite, Quote, or Distribute 4 28 March 2013
to rail infrastructure from high temperatures will increase [medium confidence]. Adaptation through maintenance 1 and operational measures can reduce adverse impacts to some extent. 2 3 Climate change will decrease hydropower production from reductions in rainfall in all sub-regions except 4 Scandinavia [high confidence] [23.3.4]. Climate change will have no impact on wind energy production before 2050 5 [medium confidence] and only a small impact after 2050 [low confidence]. Climate change will inhibit thermal 6 power production during summer [medium confidence] [23.3.4]. Plant modifications and operational changes can 7 reduce adverse impacts. Climate warming will decrease space heating demand [high confidence] and increase 8 cooling demand [high confidence]; the income growth drives largest part of this increase during 2000-2050 period 9 (especially in eastern regions) [medium confidence] [23.3.4]. Energy efficient buildings and cooling systems as well 10 as demand-side management will reduce future energy demands [23.3.4]. 11 12 Heat-related deaths and injuries will increase, particularly in Southern Europe [medium confidence] [23.5.1]. 13 Climate change will change the distribution and seasonal pattern of some human infections, including those 14 transmitted by arthropods [medium confidence]. The introduction of new infectious diseases due to climate change 15 is unlikely [medium confidence] [23.5.1]. Climate change and sea level rise will damage European cultural heritage, 16 including buildings, local industries, landscapes, and iconic places such as Venice [medium confidence] and some 17 cultural landscapes will be lost forever [low/medium confidence] [23.5.4] [Table 23.5]. 18 19 Climate change will alter the productivity of bioenergy crops in Europe by shifting their distribution northward 20 [high confidence] [23.4.5]. Elevated atmospheric CO2 can improve drought tolerance of bioenergy crop species due 21 to improved plant water use, maintaining high yields in future climate scenarios [medium confidence] [23.4.5]. 22 23 Yields of some arable crop species like wheat have been negatively affected by observed warming in some 24 European countries since 1980s [medium confidence, limited evidence][23.4.1] Compared to AR4, new evidence 25 regarding future yields in Northern Europe, is less consistent regarding the magnitude and sign of change. Climate 26 change will increase yields in Northern Europe [medium confidence] but decrease cereal yields in Southern Europe 27 [high confidence] [23.4.1]. In Northern Europe, climate change will increase the seasonal activity of pests and plant 28 diseases [high confidence] [23.4.1]. Climate change will adversely affect dairy production in Southern Europe 29 because of heat stress in lactating cows [medium confidence] [23.4.2]. Climate warming has caused the spread of 30 blue tongue disease in ruminants in Europe [high confidence] [234.2] and northward expansion of tick vectors 31 [medium confidence] [23.4.2, 23.5.1]. 32 33 Climate change will change the geographic distribution of wine grape varieties [high confidence] and this will 34 reduce the economic value of wine products and the livelihoods of local wine communities in Southern and 35 Continental Europe [medium/low confidence] [23.4.1, 23.3.5, 23.5.4]. Some adaptation is possible through 36 technologies and good practice [Box 23-1]. 37 38 Climate change will increase irrigation needs [high confidence] but future irrigation will be constrained by reduced 39 runoff, demand from other sectors, and by economic costs [23.4.1, 23.4.3]. By 2050s, irrigation will not be sufficient 40 to prevent damage from heat waves to crops [medium confidence]. System costs will increase under all climate 41 scenarios [high confidence] [23.4.3]. Integrated management of water is needed to address future competing 42 demands between agriculture, conservation and human settlements [23.7.2]. 43 44 Observed warming has shifted sea fish species ranges to higher latitudes [high confidence] and reduced body size in 45 species [low confidence] [23.4.6]. Climate change will not decrease net fisheries economic turnover in some parts of 46 Europe (e.g. Bay of Biscay) [low confidence] due to introduction of new (high temperature tolerant) species. 47 Climate change will not entail relocation of fishing fleets [high confidence] [23.4.6]. Observed higher water 48 temperatures have adversely affected both wild and farmed freshwater salmon production [high confidence] 49 [23.4.6]. High temperatures will increase frequency of harmful cyanobacterial blooms [medium confidence] 50 [23.4.6]. 51 52 Climate warming has adversely affected trends in ground level tropospheric ozone [low confidence] [23.6.1.]. 53 Climate change will increase the frequency of tropospheric ozone events (exceedences) in the future [low 54
SECOND-ORDER DRAFT IPCC WGII AR5 Chapter 23
Do Not Cite, Quote, or Distribute 5 28 March 2013
confidence] even assuming future emissions reductions [23.6.1]. Climate change will decrease surface water quality 1 due to higher temperatures [medium confidence] [23.6.3]. There is little evidence regarding the effect of climate 2 change on soil erosion, salinisation or soil fertility [23.6.2]. 3 4 Observed climate warming has increased forest productivity in northern Europe [medium confidence] [23.4.4] and 5 fire incidence in southern Europe [high confidence] [23.4.4]. Climate change will increase damage from pests and 6 diseases in all sub-regions [high confidence] [23.4.4] and damage from wildfires in Southern Europe [high 7 confidence] and from storms [low confidence] [23.4.4]. Climate change will cause ecological and socio-economic 8 damages from shifts in forest tree species range, with a general trend of a south-west to north-east [medium 9 confidence], and in pest species distributions [low confidence] [23.4.4]. Short-term and long-term strategies in forest 10 management may be an adequate measure to enhance ecosystem resistance and resilience [medium confidence] 11 [23.4.4]. 12 13 Observed climate change is affecting a wide range of flora and fauna, including plant pests and diseases [medium 14 confidence] [23.4.1, 23.4.4] and the vectors of animal diseases [medium confidence] [23.4.3]. Climate change will 15 cause changes in habitats and species, with local extinction [high confidence] and continental scale shift in Europe 16 [medium/low confidence] [23.6.4]. The habitat of alpine plants will be significantly reduced [high confidence] 17 [23.6.4]. Phenological mismatch will constrain both terrestrial and marine ecosystem functioning under climate 18 change [high confidence] [23.6.4, 23.6.5], with a reduction in some ecosystem services [low confidence] [23.6.4]. 19 The introduction and expansion of invasive species, especially those with high migration rates, from outside Europe 20 will increase with climate change [medium confidence] [23.6.4]. Climate change will entail the loss or movement of 21 coastal wetlands [high confidence] [23.6.5]. Conservation policies and selection of protected areas have not 22 considered so far impact of climate changes. Biodiversity is affected in unprotected areas more than in protected 23 areas but Natura 2000 areas retain climate suitability for species no better and sometimes less effectively than 24 unprotected areas [low confidence] [23.6.4]. 25 26 Cross-sectoral adaptation 27 The capacity to adapt in Europe will be higher than for other world regions, but there are important differences in 28 impacts and the capacity to respond within the European sub-regions. In Europe, adaptation policy has been 29 developed at international (EU), national and local government level [23.7] but so far evidence relates to studies of 30 the prioritisation of options, and there is limited systematic information on current implementation (or effectiveness) 31 [Box 23-2]. Some adaptation planning has been integrated into coastal and water management, as well as disaster 32 risk management [23.7.1; 23.7.2; 23.7.3]. There is little evidence of adaptation planning in rural development or 33 land-use planning [23.7.4; 23.7.5]. Economic estimates for adaptation requirements in Europe are available and 34 increasingly from detailed bottom-up sector-specific studies for coastal defences, energy production, energy use, and 35 agriculture [23.7.6]. The costs of adapting dwellings or upgrading coast defence will increase under all scenarios 36 [high confidence] [23.3.2]. 37 38 There are opportunities for policies that improve adaptive capacity and also help meet mitigation targets [23.8]. 39 Some agricultural practices can potentially mitigate GHG emissions and at the same time adapt crops to increase 40 resilience to temperature and rainfall variability [23.8.2]. Climate policy in transport and energy sectors to reduce 41 emissions can improve population health [23.8.3] [high confidence]. However there are also potential for unintended 42 consequences of mitigation policies in the built environment (especially housing) and energy sectors [23.8.1]. 43 44 45 23.1. Introduction 46 47 This chapter reviews the scientific evidence published since AR4 on observed and projected impacts of 48 anthropogenic climate change in Europe and adaptation responses. The geographical scope of this chapter is the 49 same as in AR4 with the inclusion of Turkey. Thus, the European region includes all countries from Iceland in the 50 west to Russia (west of the Urals) and the Caspian Sea in the east, and from the northern shores of the 51 Mediterranean and Black Seas and the Caucasus in the south to the Arctic Ocean in the north. Impacts above the 52 Arctic Circle are addressed in the Polar Regions Chapter 28 and impacts in the Baltic and Mediterranean Seas are 53
SECOND-ORDER DRAFT IPCC WGII AR5 Chapter 23
Do Not Cite, Quote, or Distribute 6 28 March 2013
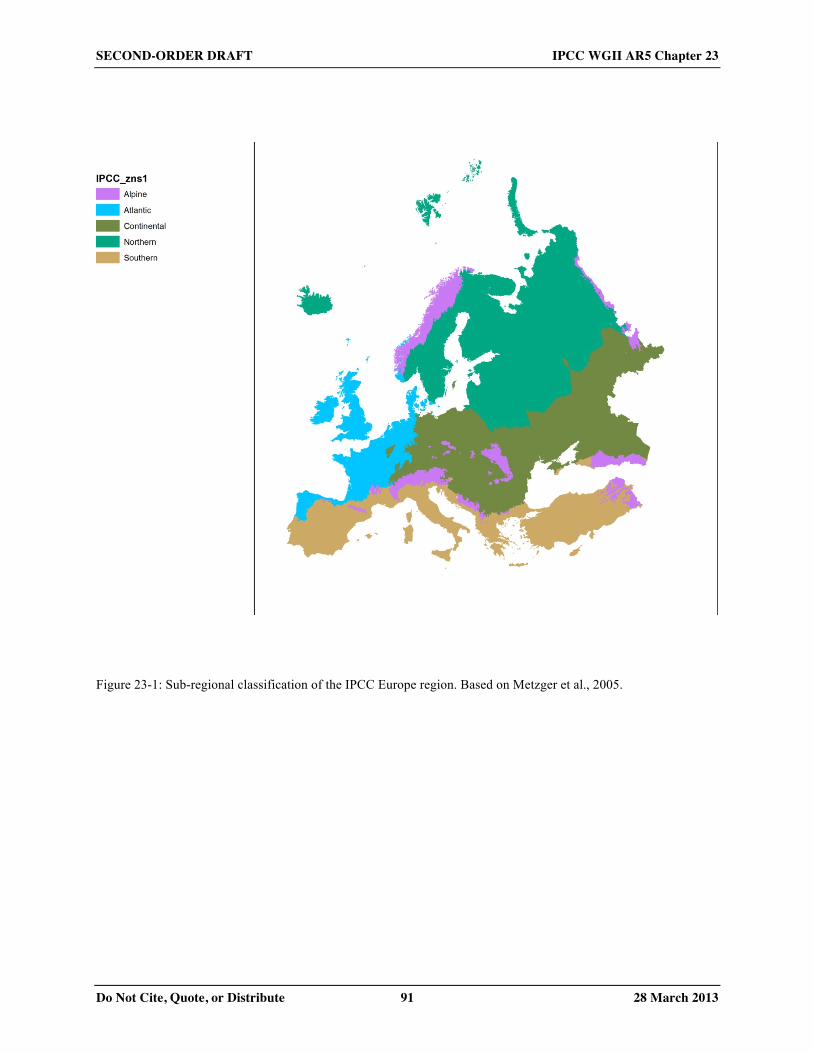
addressed in the Open Oceans Chapter 30. Impacts in Malta and other island states in Europe are discussed in the 1 Small Island Chapter 29. 2 3 The European region has been divided into 5 sub-regions (see Figure 23-1): Atlantic, Alpine, Southern Northern, 4 and Continental. The sub-regions are derived from climate zones developed by Metzger et al. (2005) and therefore 5 represent geographical and ecological zones rather than political boundaries. The scientific evidence has been 6 evaluated according to compare impacts across (rather than within) sub-regions, however, this is not always 7 possible, depending on the scientific information available. 8 9 [INSERT FIGURE 23-1 HERE 10 Figure 23-1: Sub-regional classification of the IPCC Europe region. Based on Metzger et al., 2005.] 11 12 13 23.1.1. Scope and Route Map of Chapter 14 15 The chapter is structured around key policy areas. Sections 23.3 to 23.6 summarise the latest scientific evidence on 16 climate sensitivity, observed impacts and attribution, projected impacts and adaptation options, with respect to four 17 main categories of impacts: 18
• production systems and physical infrastructure; 19 • agriculture, fisheries, forestry and bioenergy production; 20 • health and social welfare and; 21 • protection of environmental quality and biological conservation. 22
23 The benefit of assessing evidence in a regional chapter is that integrated impacts across sectors can be described, as 24 well as cross-sectoral decision making required to address many climate change issues. 25 26 The chapter also evaluates the scientific evidence in relation to the five sub-regions discussed above. The majority 27 of the research in the Europe region is for impacts in countries in the European Union due to targeted research 28 funding through the European Commission which means that countries in eastern Europe and Russia are less well 29 represented in this chapter. Further, regional assessments may be reported for the EU15, EU27 or EEA (32) group of 30 countries [see supplemental information for list of countries in each group]. 31 32 This chapter includes several sections that were not in AR4. Because many adaptation and mitigation policies are 33 now in place in Europe, the evidence for potential co-benefits and unintended consequences of such strategies is 34 reviewed (Section 23.8). The implications of climate change for the distribution of economic activity within 35 European region is discussed in Section 23.9. The final section synthesise the key findings with respect to: observed 36 impacts of climate change, key vulnerabilities and identifies research gaps. 37 38 39 23.1.2. Policy Frameworks 40 41 Since AR4, there have been significant changes in Europe in responses to climate change. More countries now have 42 adaptation and mitigation policies in place. An important force for climate policy development in the region is the 43 European Union (EU). EU Member States have mitigation targets, as well as the overall EU target, with both 44 sectoral and regional aspects to the commitments. 45 46 Adaptation policies and practices have been developed at the international, national and local levels although 47 research on implementation of such policies is limited. Due to the vast range of policies, strategies and measures it is 48 not possible to describe them extensively here. However, adaptation in related to cross-sectoral decision-making is 49 discussed in section 23.7 (see also Box 23-2 on national adaptation policies). The EU Adaptation Platform 50 catalogues adaptation actions reported by Member States. The EU adaptation strategy is due in March 2013. See 51 Chapter 15 for a more extensive discussion of institutions and governance in relation to adaptation planning and 52 implementation in Europe. 53 54
SECOND-ORDER DRAFT IPCC WGII AR5 Chapter 23
Do Not Cite, Quote, or Distribute 7 28 March 2013
1 23.1.3. Conclusions from Previous Assessments 2 3 AR4 documented a wide range of impacts of observed climate change in Europe (AR4 WG2 Chapter 12). The 4 SREX confirmed increases in warm days, warm nights and decreases in cold days and cold nights since 1950 (high 5 confidence, SREX-3.3.1). Extreme precipitation increased in part of the continent, mainly in winter over western-6 central Europe and European Russia (medium confidence, SREX-3.3.2). Dryness has increased mainly in Southern 7 Europe (medium confidence, SREX-3.3.2). Climate change was expected to magnify regional differences within 8 Europe for natural resources (in particular for agriculture and forestry) because water stress was projected to 9 increase over central and southern Europe (AR4-12.4.1, SREX-3.3.2, SREX-3.5.1). Many climate related hazard 10 were projected to increase in frequency and intensity, but with significant variations within the region (AR4-12.4). 11 12 The AR4 identified that climate changes would pose challenges to many economic sectors and was expected to alter 13 the distribution of economic activity within Europe (high confidence). Adaptation measures were evolving from 14 reactive disaster response to more proactive risk management. A prominent example was the implementation of heat 15 health warning systems following the 2003 heat wave event (AR4 WG2 12.6.1, SREX 9.2.1). National adaptation 16 plans were developed and specific plans were incorporated in European and national policies (AR4 WG2 12.2.3, 17 12.5) but these were not integrated comprehensive, or evaluated (AR4 WG2 12.8). 18 19 20 23.2. Current and Future Trends 21 22 23.2.1 Non- Climate Trends 23 24 Countries in the European region are diverse with respect to both demographic and economic trends. Population 25 health and welfare in all European countries has been improving, with reductions in adult and child mortality rates. 26 However, inequalities both within and between countries in Europe persist (Marmot et al., 2012). Population is 27 generally increasing in the EU27 countries, primarily due to net immigration although population growth is slow 28 (total and working age population) (Rees et al., 2012). Some countries, including the Russian Federation, have had 29 decreases in population since the 1990s. Migration pressure into Europe is increasing (Eurostat, 2011a) but within 30 the EU27 movement between countries is encouraged as part of economic policy. The ageing of the population is a 31 significant trend in Europe, as in all high income populations. This will have both economic and social implications, 32 and many regions are likely to experience a decline in labour force (Rees et al., 2012). 33 34 Since AR4, economic growth has slowed (or stalled) in several European countries. In some countries, this has been 35 associated with a reduction in social protection measures and increased unemployment (Eurostat, 2011b). The 36 longer term implications of the financial crisis in Europe are unclear, although it will probably lead to some 37 modification of the economic outlook and may affect future social protection policies (with implications for 38 adaptation). 39 40 Agriculture is the most dominant European land use and. Europe is one of the world’s largest and most productive 41 suppliers of food and fibre. Rapid changes to farming systems in the post-war decades allowed an unprecedented 42 increase in agricultural productivity, but also had a number of negative impacts on the ecological properties of 43 agricultural systems, such as carbon sequestration, nutrient cycling, soil structure and functioning, water 44 purification, and pollination. Most scenario studies suggest that agricultural land areas will continue to decrease in 45 the future as they have done over the past 50 years (see Busch (2006) for a discussion). Agriculture accounts for 22 46 % of total national freshwater abstraction in Europe and more than 80 % in some southern European countries 47 (EEA, 2009). Limited water availability is already a significant problem in many parts of Europe and the situation is 48 likely to deteriorate further in future decades. Economic restructuring in some eastern European countries has led to 49 a decrease in water abstraction for irrigation, suggesting the potential for future increases in irrigated agriculture and 50 water use efficiency (EEA, 2009). Water allocation between upstream and downstream countries is challenging in 51 regions exposed to prolonged droughts such as the Euphrates-Tigris river basin, where Turkey plans to more than 52 double water abstraction by 2023 (EEA, 2010a). 53 54
SECOND-ORDER DRAFT IPCC WGII AR5 Chapter 23
Do Not Cite, Quote, or Distribute 8 28 March 2013
The forested areas of Europe account for approximately 35% of the land area (Eurostat, 2009). The majority of 1 forests now grow faster than in the early 20th century due to advances in forest management practices, genetic 2 improvement and in central Europe, the cessation of site-degrading practices such as litter collection for fuel. It is 3 also very likely that increasing temperatures and CO2 concentrations, nitrogen deposition, and the reduction of air 4 pollution (SO2) have had a positive effect on forest growth. Land use scenarios suggest that forested areas will 5 expand in Europe in the future on land formerly used for agriculture (Rounsevell et al., 2006). 6 7 Soil degradation is already intense in parts of the Mediterranean and central-eastern Europe and, together with 8 prolonged drought periods and increased numbers of fires, is already contributing to an increased risk of 9 desertification. Projected risks for future desertification are the highest in the same areas (EEA-JRC-WHO, 2008). 10 11 Europe has relatively moderate urban sprawl levels. Urbanisation is projected to increase all over Europe (Reginster 12 and Rounsevell, 2006), but especially rapidly in Eastern Europe, with the magnitude of these increases depending on 13 population growth, GDP growth and land use planning policy. Although changes in urban land use will be relatively 14 small in area terms, urban development has major impacts locally on environmental quality. A recent past and likely 15 future trend in Europe is peri-urbanisation in which residents move out of cities to locations with a rural character, 16 but retain a functional link to cities by commuting for employment purposes (Reginster and Rounsevell, 2006) 17 (Rounsevell and Reay, 2009). Other important environmental trends include improvements in outdoor air quality 18 and declines in water quality (eutrophication) in some areas (ELME, 2007). 19 20 Several scenario studies have been completed for Europe covering socio-economic indicators (Mooij de and Tang, 21 2003), land use (Verburg et al., 2010; Letourneau et al., 2012)(Haines-Young et al., 2012), land use and biodiversity 22 (Spangenberg et al., 2011), crop production (Hermans et al., 2010), demographic change (Davoudi et al., 2010), 23 economics (Dammers, 2010) and European policy trends (Helming et al., 2011)(Lennert and Robert, 2010). Many 24 of these scenario studies also account for future climate change (see Rounsevell and Metzger (2010) for a review). 25 Long term projections (to the end of the century) will be described under the new Shared Socio-economic Pathway 26 scenarios (SSPs) (Kriegler et al., 2010). Detailed country and regional scale socio-economic scenarios have also 27 been produced for the Netherlands (WLO, 2006), the UK (UK National Ecosystem Assessment, 2011) and Scotland 28 (Harrison et al., 2012). Probabilistic representation of socio-economic futures have been developed for agriculture 29 and land use change at the global scale level including Europe (Baumanns et al., 2012; Hardacre et al., 2012), 30 although a lack of evidence remains about the use of probabilistic information (Bryson et al., 2010) or scenarios in 31 general for policy making. 32 33 34 23.2.2. Observed and Projected Climate Change 35 36 23.2.2.1. Observed Climate Change 37 38 The average temperature in Europe has continued to increase, but with regionally and seasonally differences in the 39 rate of warming. Since the 1980s, warming has been strongest over Scandinavia, especially in winter, whereas the 40 Iberian Peninsula warmed mostly in summer (Haylock et al., 2008). The decadal average temperature over land area 41 for the period 2002-2011 is 1.3°C+/- 0.11°C above the 1850-1899 average (EEA, 2012), based on HadCRUT3 42 {{1535 Brohan, P. 2006}}, MLOST {{1537 Smith, T.M. 2008}} and GISSTemp {{1536 Hansen, J. 2010}}. 43 Consistent with previous trends, the rate of warming has been greatest in high latitudes in Northern Europe (see also 44 Polar Regions chapter 28). Observed regional climate change is also described in Chapter 21. 45 46 High-temperature extremes (hot days, tropical nights, and heat waves (Vautard R et al, 2013) have become more 47 frequent, while low-temperature extremes (cold spells, frost days) have become less frequent in Europe (EEA, 48 2011). The recent cold winters in northern and western Europe reflect the high natural variability in the region 49 (Peterson et al., 2012), and do not contradict the general warming trend. In Eastern Europe, including the European 50 part of Russia, summer 2010 was exceptionally hot, with an amplitude and spatial extent that exceeded the previous 51 2003 heat wave (Barriopedro et al., 2011). These two heat waves revised the seasonal temperature records over 52 approximately half of Europe. 53 54
SECOND-ORDER DRAFT IPCC WGII AR5 Chapter 23
Do Not Cite, Quote, or Distribute 9 28 March 2013
Annual precipitation trends in the 20th century showed an increase in Northern Europe (10–40%) and a decrease in 1 some parts of Southern Europe (up to 20 %) (EEA, 2008)(Del Rio et al., 2011). At the continental scale, winter 2 snow cover extent has a high variability and a non significant negative trend over the period 1967-2007 (Henderson 3 and Leathers, 2010). For a more detailed assessment on regional observed changes in temperature and precipitation 4 extremes (see Table 3-2 of SREX, (Berg et al., 2013). Windspeeds have declined over Europe over the last decades 5 (Vautard et al., 2010) but there is a low confidence in this trend due to problematic anemometer data and climate 6 variability (SREX, section 3.3). 7 8 Europe is marked by increasing mean sea level with regional variations, except in the Baltic sea where the relative 9 sea level decreases due to vertical crustal motion (Haigh et al., 2010; Menendez and WoodWorth, 2010; Albrecht et 10 al., 2011; EEA, 2012). Extreme sea levels increased due to mean sea level rise (medium confidence, SREX, section 11 3.5, (Haigh et al., 2010; Menendez and WoodWorth, 2010). Few studies exist on waves (SREX, section 3.5, 12 (Charles et al., 2012) leading to a low confidence (based on poor evidence) of anthropogenic influence on the 13 observed trends. 14 15 16 23.2.2.2. Projected Climate Changes 17 18 There is now more knowledge about the range of possible future climates in Europe, particularly sub-regional 19 information from high resolution climate model output and downscaling (WGII Chapter 21). Within the recognized 20 limitations of climate projections (see WGI Annex 1 (Atlas) and WGII Chapter 21), new research on inter-model 21 comparisons have provided a more robust range of future climates with which to assess future impacts (WGI 22 Chapter 9). Since AR4, climate impact assessments are able to use a range of temperature and rainfall changes rather 23 a single average measure (ensemble mean). Europe is fortunate to have access to comprehensive and detailed sets of 24 climate projections for decision making (SREX, section 3.2.1, (Mitchell et al., 2004)(Fronzek et al., 2012; Jacob et 25 al., 2013). 26 27 Even under a climate warming limited to 2°C compared to pre-industrial times, the climate of Europe is simulated to 28 depart significantly in the next decades from today’s climate (Jacob and Podzun, 2010)(Van der Linden and 29 Mitchell). Climate models show significant agreement in warming (magnitude and rate) all over Europe, with 30 strongest warming in Southern Europe in summer, and in Northern Europe in winter (Kjellström et al., 31 2011)(Goodess et al., 2009)(Schmidli et al., 2007). 32 33 Precipitation signal is regionally and seasonally very different. Trends are less clear, but agreement in precipitation 34 increase in Northern Europe and decrease in Southern Europe, the zone in between has less clear sign of change 35 (medium confidence) (Kjellström et al., 2011). Changes in the annual cycle indicate a decrease in precipitation in the 36 summer months up to Southern Sweden, an increase in winter precipitation with more rain than snow and a decrease 37 of long term mean snow pack (although snow-rich winters will remain) (Räisänen and Eklund, 2011). There is lack 38 of information about past and future changes in hail occurrence. Changes in future circulation patterns are 39 inconsistent, except in Northern Europe (Beck et al., 2007)(Kjellström et al., 2011)(Pryor and Barthelmie, 40 2010)(Pryor and Schoof, 2010)(Rockel and Woth, 2007)(Ulbrich et al., 2009). Mean wind speed trends are rather 41 uncertain due to shortcomings in wind simulations in GCMs (SREX and (McInnes et al., 2011)). 42 43 Recent results highlight that regional coupled simulations over the Mediterranean region provide a better 44 characterization of impact parameters, such as snow cover and aridity index. These simulations have detected 45 changes in key impact indicators, such as snow or river discharge, which were not revealed by CMIP3 global 46 simulations (Dell'Aquila et al., 2012). 47 48 For the period 2081-2100 (compred to 1986-2005) the projected global sea level rise is in the range 0.29-0.55 for 49 RCP2.6, 0.36-0.63 for RCP4.5, 0.37-0.64 for RCP6.0 and 0.48-0.82 for RCP8.5 (medium confidence, WG1, section 50 13.7.2). However, at the regional scale, changes can differ from the mean changes (Slangen et al., 2012). There is a 51 low confidence on projected regional changes (WG1, 13.7). Some high-end (low probability/high impact) estimates 52 of extreme mean sea-level rise projections have been made for The Netherlands (Katsman et al., 2011), indicating 53
SECOND-ORDER DRAFT IPCC WGII AR5 Chapter 23
Do Not Cite, Quote, or Distribute 10 28 March 2013
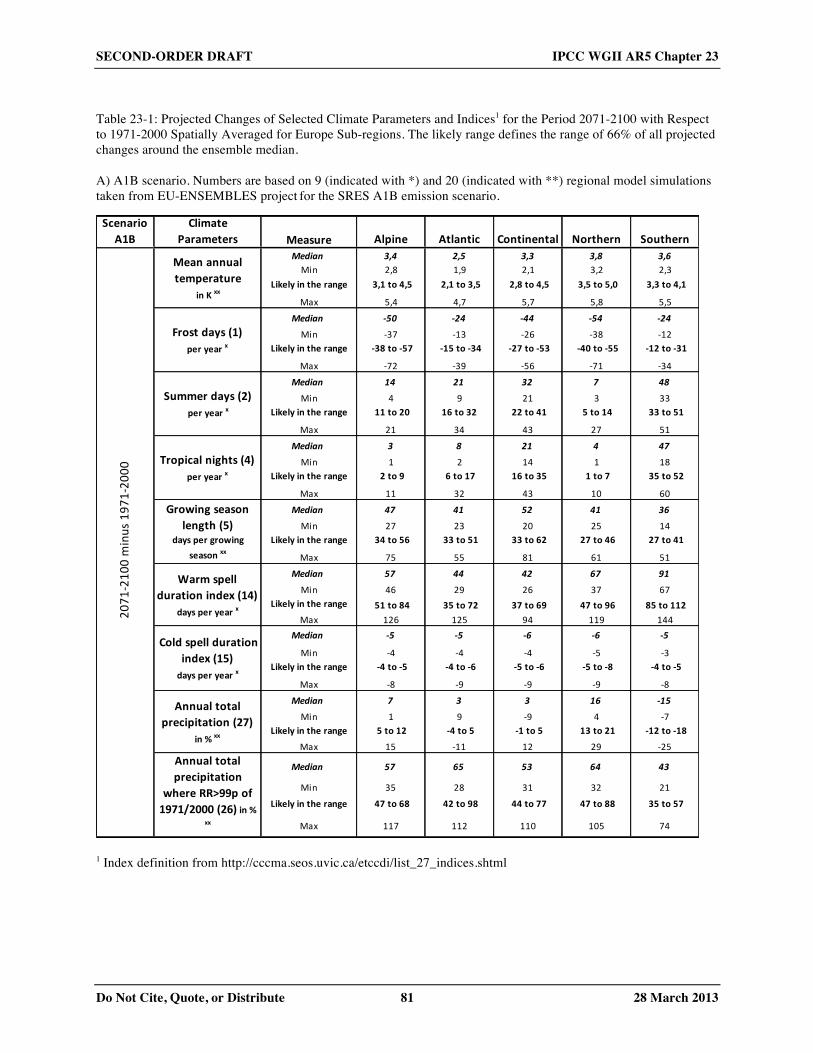
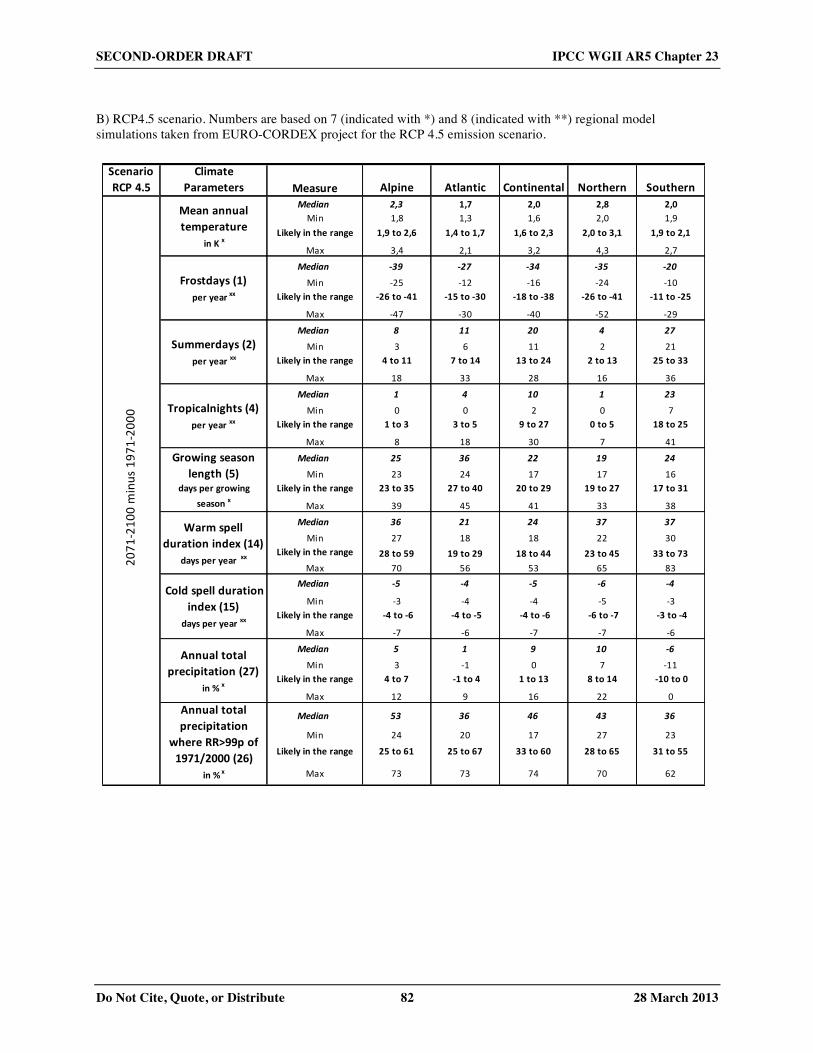
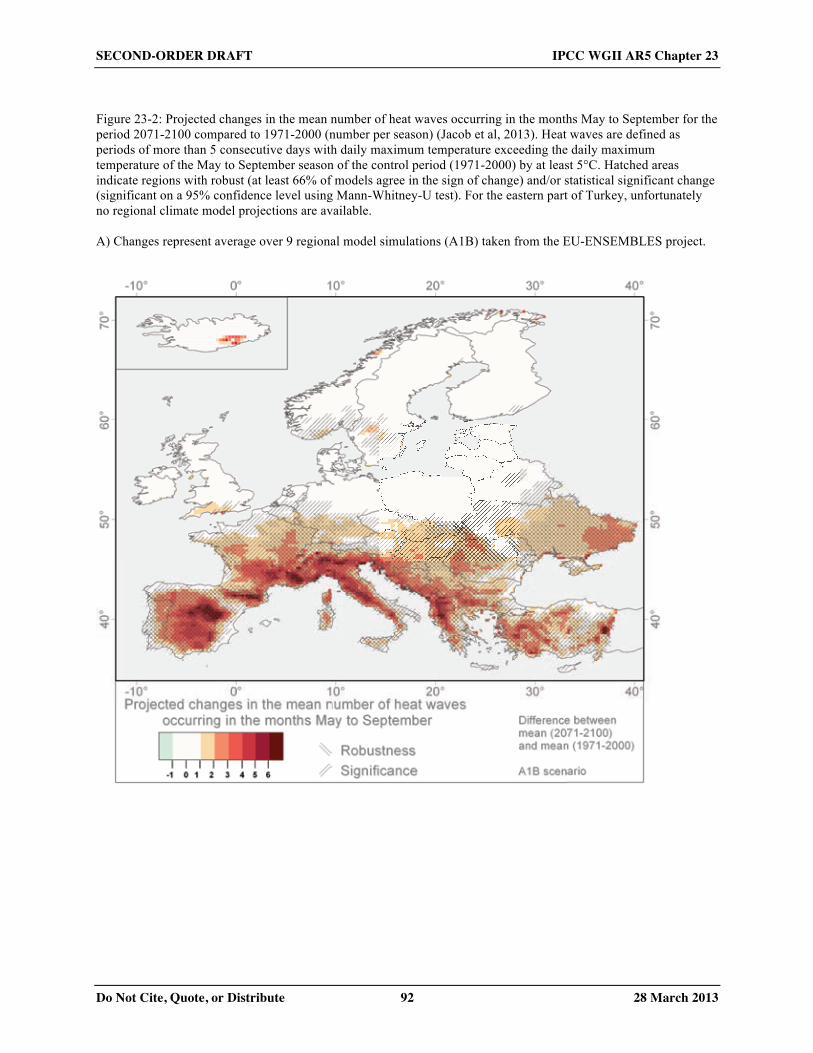
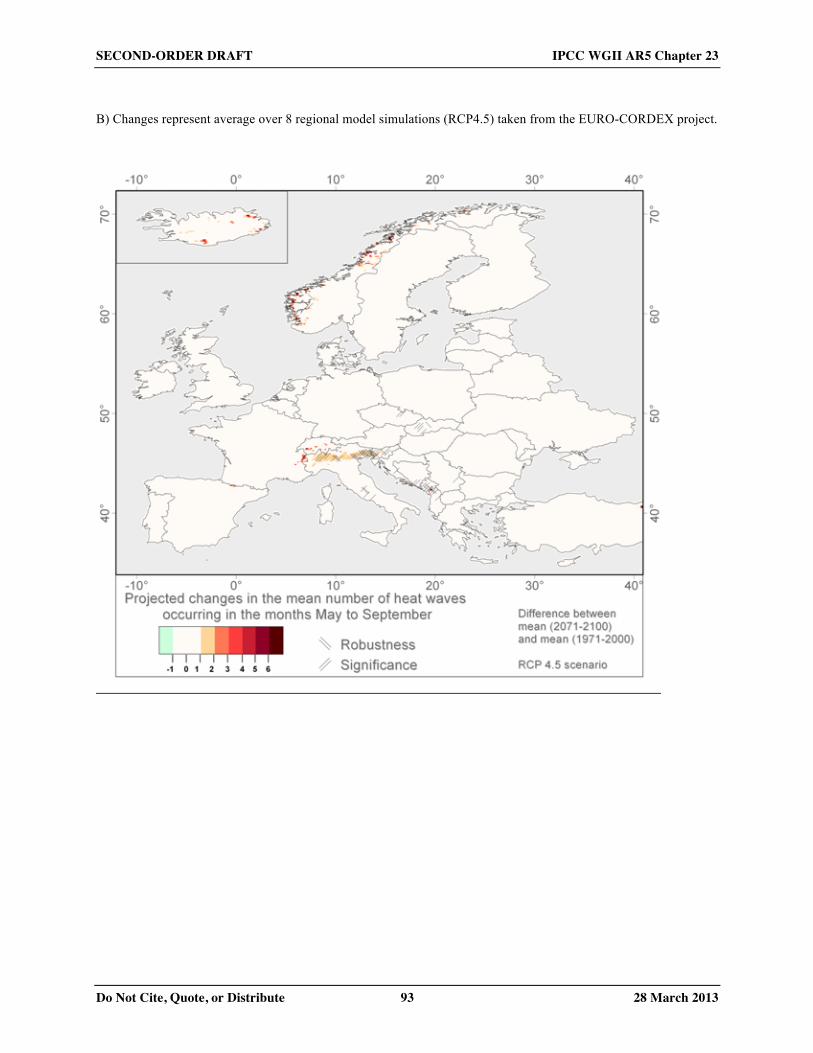
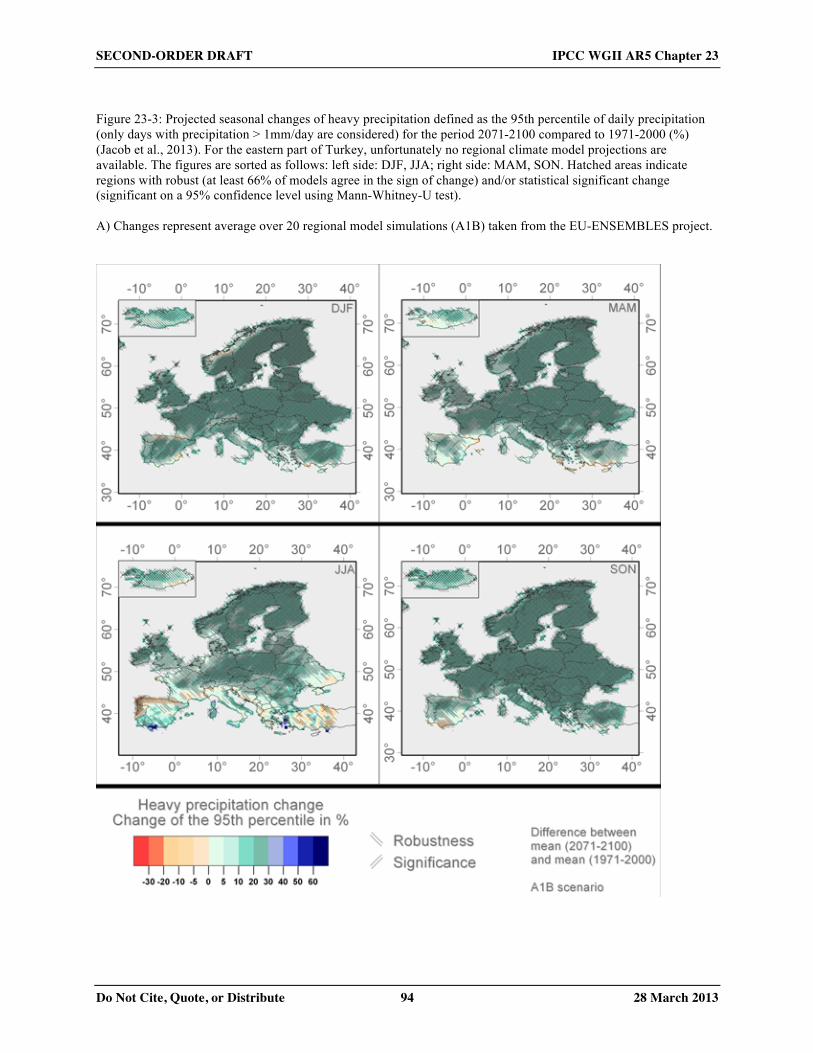
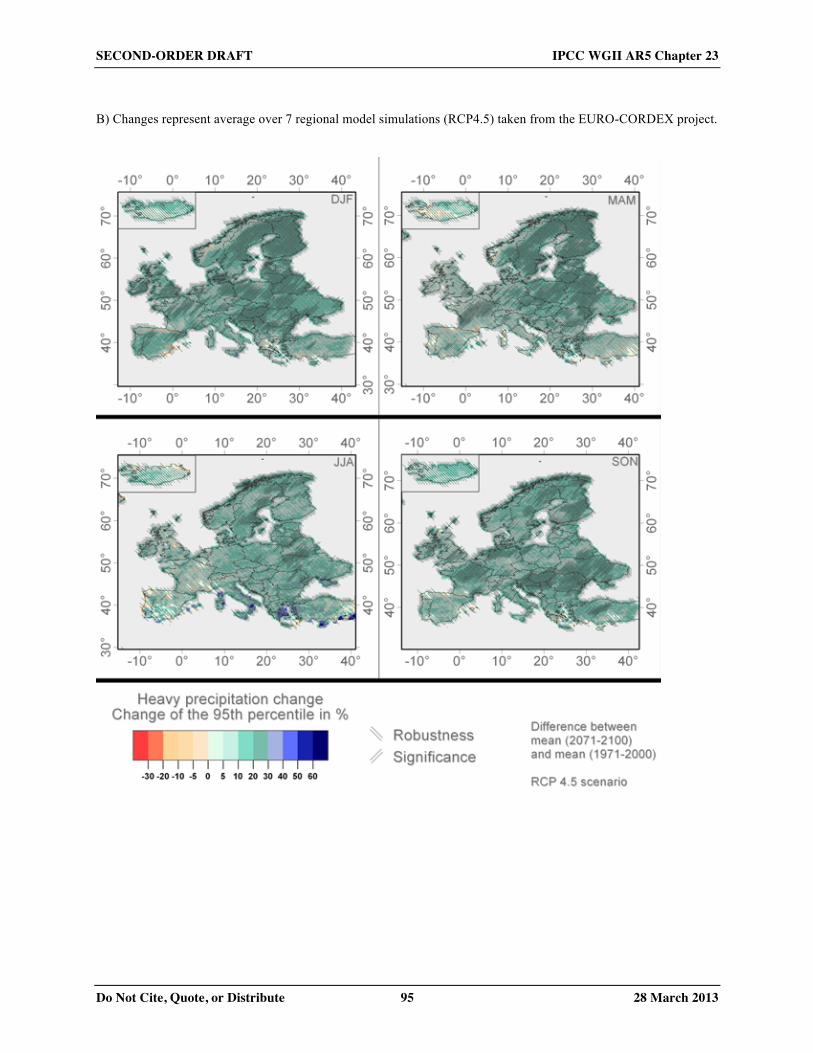
that the mean sea-level could rise globally between 0.55 and 1.15 m, and locally (the Netherlands) by 0.40 to 1.05 1 m. 2 3 4 23.2.2.3. Projected Changes in Climate Extremes 5 6 There will be a marked increase in many types of extremes in Europe, in particular, in heat waves, droughts and 7 heavy precipitation events (WGII Chapter 21, Lenderink and Van Meijgaard, 2008). Table 23-1 describes projected 8 changes of selected climate parameters and climate indices for the period 2071-2100 with respect to 1971-2000, 9 spatially averaged for the five Europe sub-regions. 10 11 [INSERT TABLE 23-1 HERE 12 Table 23-1: Projected Changes of Selected Climate Parameters and Indices1 for the Period 2071-2100 with Respect 13 to 1971-2000 Spatially Averaged for Europe Subregions. A) A1B scenario. Numbers are based on 9 (indicated 14 with*) and 20 (indicated with **) regional model simulations taken from EU-ENSEMBLES project for the SRES 15 A1B emission scenario. The likely range defines the range of 66% of all projected changes around the ensemble 16 median. B) RCP4.5 scenario. Numbers are based on 7 (indicated with *) and 8 (indicated with **) regional model 17 simulations taken from EURO-CORDEX project for the RCP 4.5 emission scenario. The likely range defines the 18 range of 66% of all projected changes around the ensemble median.] 19 20 A detailed assessment on extremes in the future climate is reported in WGII Chapter 21 and SREX. There is a 21 general high confidence concerning changes in temperature extremes (toward increased number of warm days, warm 22 nights and heat waves, SREX, Table 3-3). Figure 23-2 shows projected changes in the mean number of heat waves 23 in an extended summer season for the period 2071-2100 compared to 1971-2000 for SRES A1B and RCP4.5 with 24 large differences depending on the emission scenario. The increase in likelihood of some individual events due to 25 anthropogenic change has been quantified for the 2003 heat wave (Schär and Jendritzky, 2004), the warm winter of 26 2006/2007 and warm spring of 2007 (Beniston, 2009). 27 28 Changes in extreme precipitation depend on the region, with a high confidence of increased extreme precipitation in 29 Northern Europe (all seasons) and Central Europe (except summer). Future projections are inconsistent in Southern 30 Europe (all seasons) (SREX Table 3-3). Figure 23-3 shows projected seasonal changes of heavy precipitation events 31 for the period 2071-2100 compared to 1971-2000 for SRES A1B and RCP4.5. 32 33 [INSERT FIGURE 23-2 HERE 34 Figure 23-2: Projected changes in the mean number of heat waves occurring in the months May to September for the 35 period 2071-2100 compared to 1971-2000 (number per season) (Jacob et al, 2013). Heat waves are defined as 36 periods of more than 5 consecutive days with daily maximum temperature exceeding the daily maximum 37 temperature of the May to September season of the control period (1971-2000) by at least 5°C. Hatched areas 38 indicate regions with robust (at least 66% of models agree in the sign of change) and/or statistical significant change 39 (significant on a 95% confidence level using Mann-Whitney-U test). For the eastern part of Turkey, unfortunately 40 no regional climate model projections are available. A) Changes represent average over 9 regional model 41 simulations (A1B) taken from the EU-ENSEMBLES project. B) Changes represent average over 8 regional model 42 simulations (RCP4.5) taken from the EURO-CORDEX project.] 43 44 [INSERT FIGURE 23-3 HERE 45 Figure 23-3: Projected seasonal changes of heavy precipitation defined as the 95th percentile of daily precipitation 46 (only days with precipitation > 1mm/day are considered) for the period 2071-2100 compared to 1971-2000 (%) 47 (Jacob et al., 2013). For the eastern parortunately no regional climate model projections are available. The figures 48 are sorted as follows: left side (DJF, JJA) and right side (MAM, SON). Hatched areas indicate regions with robust 49 (at least 66% of models agree in the sign of change) and/or statistical significant change (significant on a 95% 50 confidence level using Mann-Whitney-U test). A) Changes represent average over 20 regional model simulations 51 (A1B) taken from the EU-ENSEMBLES project. B) Changes represent average over 7 regional model simulations 52 (RCP4.5) taken from the EURO-CORDEX project.] 53 54
SECOND-ORDER DRAFT IPCC WGII AR5 Chapter 23
Do Not Cite, Quote, or Distribute 11 28 March 2013
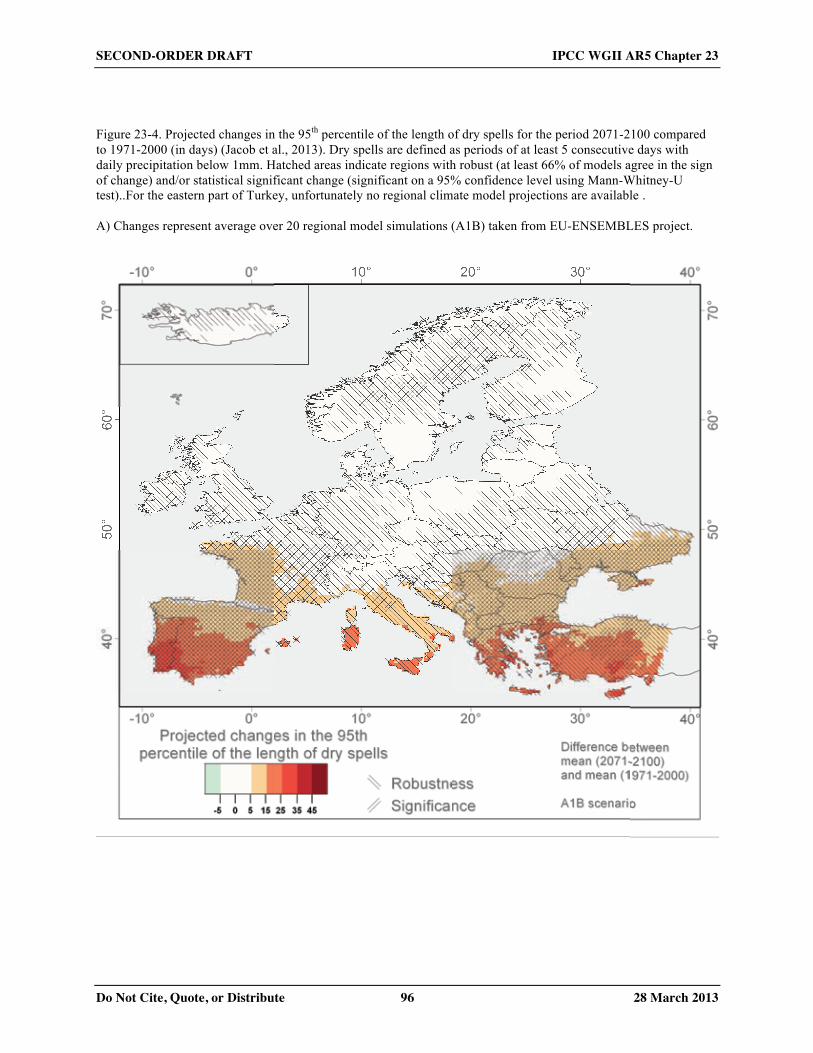
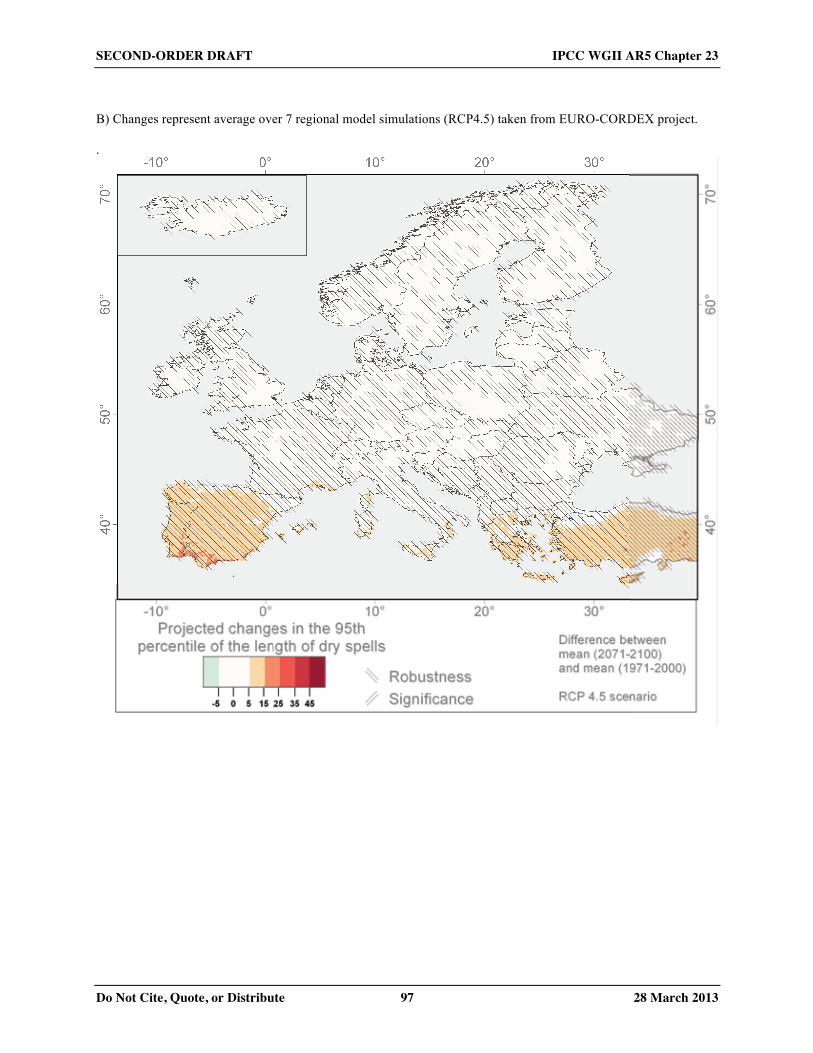
A number of studies based of GCMs and RCMs exhibit a small tendency toward increased extreme wind speed 1 (A1B scenario, 2081-2100 relative to 1981-2000) in Northern Europe in winter in relation to changes in storm tracks 2 (medium confidence, SREX, Figure 3-8 (Pinto et al., 2007a; Pinto et al., 2007b)(Rockel and Woth, 2007)(Donat et 3 al., 2010)(Pinto et al., 2010)(Rauthe et al., 2010)(Schwierz et al., 2010)(Donat et al., 2011)(McInnes et al., 4 2011)(Haugen and Iversen, 2008). Over northern Europe small increase in winter peak wind speed is projected 5 (WGII chapter 21, 21.4.1.1.3). In other parts of Europe, changes are inconsistent. 6 7 Extreme sea level events will increase (high confidence, WG1, 13.8, SREX 3.5.3), mainly dominated by the global 8 mean sea level increase. Storm surge are expected to vary along the European coasts. Significant increases are 9 projected in the eastern North Sea (increase of 6-8% of the 99th percentile of the storm surge residual, 2071-2100 10 compared to 1961-1990, based on the B2, A1B and A2 SRES scenarios (Debernard and Rÿed, 2008) and West of 11 British Isles and Ireland (Debernard and Rÿed, 2008)(Wang et al., 2008), except South of Ireland (Wang et al., 12 2008). There is medium agreement for the South of North Sea and Dutch coast were trends vary from increasing 13 (Debernard and Rÿed, 2008) to stable (Sterl et al., 2009). There is a low agreement on the trends in storm surge in 14 the Adriatic sea (Jordà et al., 2012; Lionello et al., 2012; Troccoli et al., 2012)(Planton et al., 2011). 15 16 17 23.2.3. Observed and Projected Trends in the Riverflow and Drought 18 19 Observed changes have occurred in river discharges in response to changing precipitation patterns and glacier mass 20 balances (AR5 WG2 Chapter 3). Streamflows have decreased in the south and east of Europe and increased in 21 northern Europe in small natural catchments (Stahl et al., 2010)(Wilson et al., 2010)(AR5 WG2 3.2.3). In general, 22 there are large uncertainties in establishing flood trends in Europe (Kundzewicz et al., 2013). In France, upward 23 trends in low flow indices were observed over 1948-1988 and downward trends over 1968-2008 (Giuntoli et al., 24 2013). Some studies show increases in extreme river discharge (peak flows) in parts of Germany (Petrow et al., 25 2009)(Petrow et al., 2007), the Meuse river basin (Tu et al., 2005), parts of Central Europe (Villarini et al., 2011), 26 Russia (Semenov, 2011), and Northwestern France (Renard et al., 2008); other studies show decreases in extreme 27 discharges, for example, in the Czech Republic (Yiou et al., 2006), or no change (Switzerland; (Schmocker-Fackel 28 and Naef, 2010); Germany; (Bormann et al., 2011). This pattern fits with analyses at the European level, because the 29 high variability of extreme discharges is driven by atmospheric circulation variations (Bouwer et al., 2008) 30 (Kundzewicz et al., 2010) [see also SREX report, AR5 WG2 Chapter 3]. One study suggests that river training 31 partly masks increasing flood flows in the Rhine basin (Vorogushyn et al., 2012). The attribution of the UK 2000 32 summer flood to anthropogenic forcing was proposed by (Pall et al., 2011) although later study has shown a weaker 33 effect (Kay et al., 2011). 34 35 Future climate change is projected to affect future hydrology of river basins [SREX report, AR5 WG2 Chapter 4]. 36 Europe wide analyses indicate increases in the occurrence of high river discharges (100-year return period) in 37 Continental Europe, but decreases in some parts of Northern and Southern Europe (Dankers and Feyen, 2008)(Rojas 38 et al., 2012). In contrast, studies of future changes in individual catchments indicate increases in the occurrence of 39 extreme discharges, to varying degrees, in Finland (Veijalainen et al., 2010), Denmark (Thodsen, 2007), Ireland 40 (Wang et al., 2006)(Steele-Dunne et al., 2008)(Bastola et al., 2011), the Rhine basin (Lenderink et al., 2007)(Te 41 Linde et al., 2010a)(Krahe et al., 2009; Hurkmans et al., 2010), the Meuse basin (Leander et al., 2008)(Ward et al., 42 2011), the Danube basin (Dankers et al., 2007), and French Mediterranean basins (Quintana-Segui et al., 2011). 43 Substantial declines in low flows could occur in the UK (Christierson et al., 2012), as well as in Turkey (Fujihara et 44 al., 2008). 45 46 Lack of observational data,and the complex definitions related to different perspectives (meteorological, 47 agricultural, hydrological, socioeconomic) of droughts make the analyses of observed changes in drought 48 characteristics difficult (SREX, Chapter 3, Box 3-3). Southern Europe has experienced trends towards more intense 49 and longer droughts, but they are still inconsistent (Sousa et al., 2011). Drought trends in all other subregions were 50 not statistically significant (SREX chapter 3, section 3.5.1). Regional and global climate simulations project (with 51 medium confidence) an increase in duration and intensity of droughts in central and southern Europe and the 52 Mediterranean region (Gao and Giorgi, 2008; Feyen and Dankers, 2009; Vidal and Wade, 2009)(Tsanis et al., 2011) 53 WG2 Chapter 21) using different definitions of droughts (see also SREX chapter 3, section 3.5.1). In a study by 54
SECOND-ORDER DRAFT IPCC WGII AR5 Chapter 23
Do Not Cite, Quote, or Distribute 12 28 March 2013
Wong et al. (Wong et al., 2011) it is shown that even in regions where summer precipitation is expected to increase, 1 soil moisture and hydrological droughts may become more severe due to increasing evapotranspitation. 2 3 Figure 23-4 illustrates projected changes the length of dry spells for the period 2071-2100 compared to 1971-2000 4 (in days) for SRES A1B and RCP4.5. For A1B emission scenariothe projected increase in dry spells is much larger 5 in Southern Europe. 6 7 [INSERT FIGURE 23-4 HERE 8 Figure 23-4: Projected changes in the 95th percentile of the length of dry spells for the period 2071-2100 compared 9 to 1971-2000 (in days) (Jacob et al., 2013). Dry spells are defined as periods of at least 5 consecutive days with 10 daily precipitation below 1mm. For the eastern part of Turkey, unfortunately no regional climate model projections 11 are available. Hatched areas indicate regions with robust (at least 66% of models agree in the sign of change) and/or 12 statistical significant change (significant on a 95% confidence level using Mann-Whitney-U test). A) Changes 13 represent average over 20 regional model simulations (A1B) taken from EU-ENSEMBLES project. B) Changes 14 represent average over 7 regional model simulations (RCP4.5) taken from EURO-CORDEX project.] 15 16 17 23.3. Implications of Climate Change for Production Systems and Physical Infrastructure 18 19 23.3.1. Settlements 20 21 New studies since AR4 confirm that European urban areas and related production systems, physical infrastructure 22 and human settlements, are at risk (combination of hazard probability, exposure and vulnerability) from changes in 23 weather extremes, such as flooding, mass movements, and wildfires (see section 23.4.4). Europe currently has a high 24 flood risk, due to the presence of highly urbanised areas in river basins and on coastlines. New studies since AR4 25 confirm that climate change is likely to increase flooding (coastal, river and pluvial) in Europe in some areas, even 26 with an upgrade of flood defences. Risk assessments have attempted to quantify more policy-relevant outcomes, 27 such as population at risk of flooding and economic damage costs and health and environmental outcomes. New risk 28 assessments have also included economic growth and population growth. 29 30 23.3.1.1. Coastal Flooding 31 32 Extreme sea level events and coastal flood risk are projected to increase in Europe [Section 23.2.2, SREX report, 33 AR5 WG2 Chapter 5] and remain a key challenge for several major European cities (Nicholls et al., 34 2008)(Hallegatte et al., 2008)(Hallegatte et al., 2011). Important energy infrastructure, including 158 major oil and 35 gas infrastructure and terminals, and 71 operating nuclear reactors are located at exposed coastal locations (Brown et 36 al., 2013). Climate change may increase the frequency of severe storm surges, particularly in north-western Europe 37 (see Section 23.2.2.3). Upgrading coastal defences would substantially reduce the impacts and damage costs (Hinkel 38 et al., 2010). Without adaptation, the number of people affected by coastal flooding in the 2080s is projected to 39 increase in the range of 775,000 to 5.5 million people per year in the EU27 under the SRES B2 and A2 scenarios 40 (Ciscar et al., 2011). The Atlantic, Northern and Southern European regions are projected to be most affected by 41 coastal floods. Direct costs from sea level rise in the EU27 without adaptation could reach 17 billion Euros per year 42 by 2100 (Hinkel et al., 2010), with wider costs being higher (Bosello et al., 2012). The highest damage costs are 43 estimated for the Netherlands, Germany, France, Belgium, Denmark, Spain and Italy (Hinkel et al., 2010). 44 45 Changes in future flood losses due to climate change have also been estimated for Copenhagen (Hallegatte et al., 46 2011), the UK coast (Mokrech et al., 2008)(Purvis et al., 2008)(Dawson et al., 2011), the North Sea coast 47 (Gaslikova et al., 2011), port cities including Amsterdam and Rotterdam (Hanson et al., 2011), and the Netherlands 48 (Aerts et al., 2008). The increasing cost of insurance and unwillingness of investors to place assets in affected areas 49 is a potential growth impediment to the economy in coastal regions and islands (Day et al., 2008). One study 50 estimated that a 1m sea-level rise in Turkey would potentially affect 3 million additional people and put 12 billion 51 USD capital value at risk, with adaptation costs at around 20 billion (10% of GNP) (Karaca and Nicholls). In 52 Poland, up to 240,000 people would be affected by increasing flood risk on the Baltic coast (Pruszak and Zawadzka, 53 2008). 54
SECOND-ORDER DRAFT IPCC WGII AR5 Chapter 23
Do Not Cite, Quote, or Distribute 13 28 March 2013
1 23.3.1.2. River and Pluvial Flooding 2 3 The observed increased trend in flood disasters and flood damages in Europe is well documented (see 18.4.2.1 for 4 detailed discussion), however, the main cause of the increase is increased exposure of persons and property in flood 5 risk areas (Barredo, 2009). Several new studies provide estimates of the impact of changing precipitation patterns on 6 future economic losses from river flooding, with uncertainties depending on modelling approaches and scenarios 7 (Bubeck et al., 2011). In particular, studies now also quantify the contribution of changes in population and 8 economic growth, generally indicating this contribution to be about equal or larger than climate change per se 9 (Feyen et al., 2009)(Maaskant et al., 2009)(Bouwer et al., 2010)(Te Linde et al., 2011)(Rojas et al., 2012). These 10 studies indicate that some regions may see increasing risks, but others may see decreases or little to no change 11 (Bubeck et al., 2011)(ABI, 2009)(Feyen et al., 2009)(Lugeri et al., 2010)(Mechler et al., 2010)(Feyen et al., 12 2012)(Lung et al., 2012). A European (EU15) analysis estimated that river flooding could affect 250,000-400,000 13 additional people by the 2080s, and lead to more than a doubling of annual average damages, with the main 14 increases projected in Central Northern Europe and the UK (Ciscar, 2009)(Ciscar et al., 2011). When economic 15 growth is included with projected flood frequency changes, river flood losses in Europe were projected to increase 16 17-fold under the A1B scenario (Rojas et al., 2012). 17 18 Few studies have estimated future damages from inundation in response to an increase in intense rainfall (Hoes, 19 2006). Processes that influence flash flood risks include increasing exposure from urban expansion, and forest fires 20 that lead to erosion and increased surface runoff (Lasda et al., 2010). Some studies have costed adaptation measures 21 but these only partly offset anticipated impacts from intense rainfall (Zhou et al., 2012). 22 23 24 23.3.1.3. Mass Movements 25 26 Very few studies are available on observed trends or future projections in the frequency of landslides (Crozier, 27 2010). Landslides are strongly connected to intense precipitations and the local conditions of slope stability. In the 28 European Alps, an apparent increase in the frequency of rock avalanches and large rock slides was documented over 29 the period 1900-2007 (Fischer et al., 2011) and also projected an increase in the frequency for landslides for the 30 future (Huggel et al., 2010), while (Jomelli et al., 2007) and Huggel et al. (Huggel et al., 2012) describe a complex 31 response to climate change. Some land use practices changes have led to increased landslide hazards, 32 counterbalancing favourable climate trends, as reported in Calabria (Polemio and Petrucci, 2010) and in the 33 Apenines (Wasowski et al., 2010). There is a medium confidence that landslides that are related to glacier retreat 34 and temperature will be affected by climate change. The evolution of precipitation driven phenomena such as 35 shallow landslides is rather uncertain because of the difficulty to estimate local precipitation trends with accuracy 36 and other factors such as land use. A study of the Mam Tor landslide in the UK indicated a possible increase in 37 stability towards 2100 in response to rainfall changes (Dixon and Brook, 2007). Climate warming may have 38 contributed to the observed decrease in the frequency of snow avalanches in the Alps (Eckert et al., 2010)(Teich et 39 al., 2012), although one study suggest that conditions for avalanches may become more favourable with warming in 40 the future (Castebrunet et al., 2012). 41 42 43 23.3.2. Housing 44 45 Housing infrastructure in Europe is vulnerable to extreme weather events. Despite a wide body of literature on the 46 thermal modelling of the existing housing stock, exactly why and how dwellings currently overheat is uncertain 47 (Crump et al., 2009) and there is very little observational data as to the actual extent of current overheating in 48 countries in Europe. Buildings that were originally designed for certain thermal conditions will need to function in a 49 drier and hotter climate in the future (WHO, 2008). The impact of rising temperatures on comfort (and hence energy 50 demand for cooling and heating) is well understood. Climate change in Europe seems set to result in increased use 51 of cooling energy and reduced use of heating energy. For example, a study of energy demand in Slovenia (Dolinar et 52 al., 2010) projected reductions of energy use for heating of up to 25% depending on the region but up to six times 53 more energy for cooling. More estimates of changes in summer and winter energy demand are described below in 54
SECOND-ORDER DRAFT IPCC WGII AR5 Chapter 23
Do Not Cite, Quote, or Distribute 14 28 March 2013
Energy Section, although the assumptions regarding future air conditioning uptake are often not clear. Further, the 1 potential trade-offs and synergies in future energy use for residential heating and space cooling conditioning in the 2 context of future emissions (mitigation) and adaptation is discussed in section 23.8.1 below. A range of adaptive 3 strategies are available to address impacts of climate change on buildings including effective thermal mass and solar 4 shading (Wilby, 2007). There is little evidence regarding the estimated costs of retrofitting European housing stock 5 (Parry et al., 2009). 6 7 Climate change may increase the frequency and intensity of drought-induced soil subsidence (Corti et al., 2009). 8 One study indicates that it is likely that the level of damage in France, for example, has more than doubled in the 9 period 1989-2002 compared to the period 1961–1990 (Corti et al., 2009). This is mostly a consequence of increased 10 temperature since the 1990s, suggesting a link to climate change. Some European regions were affected for the first 11 time by soil subsidence following the hot summer of 2003, possibly as a consequence of lack of adaptation. 12 13 With respect to the outdoor built environment, there is limited evidence regarding the potential for differential rates 14 of radiatively-forced climate change in urban compared to rural areas (McCarthy et al., 2010). An urban land 15 surface scheme coupled to a global model was used to quantify the impact of large-scale and local drivers of climate 16 change on the urban environment and indicated that these effects should not be treated independently when making 17 projections of urban climate change. Climate change was found to increase the number of ‘hot’ days by a similar 18 amount for both urban and rural situations but rural and urban increases differed significantly for the frequency of 19 ‘hot’ nights. Modelling of London's nocturnal heat island indicated an increase in magnitude of urban heat island 20 under project climate scenarios (Wilby, 2008). Modification of the external environment, via enhanced urban 21 greening for example, provides other opportunities for modification of risks and co-benefits for health and welfare. 22 23 24 23.3.3. Transport 25 26 Systematic and detailed knowledge on the effects of climate change on transport in Europe remains limited (Koetse 27 and Rietveld, 2009). 28 29 On road transport, in line with AR4, in case of increased precipitation, an increase in collisions but a decrease of 30 their severity is expected due to reduced speed (Brijs et al., 2008)(Kilpeläinen and Summala, 2007). However, lower 31 traffic speed will cause welfare losses due to additional time spent driving (Sabir et al., 2010). Future severe snow 32 and ice-related accidents will also decrease, but the effect of fewer frost days on total accidents is unclear 33 (Andersson and Chapman, 2011a)(Andersson and Chapman, 2011b). Severe accidents caused by extreme weather 34 are projected to decrease by 54-72% in 2020-2070 compared to 2007 (Nokkala et al., 2012). 35 36 For rail, consistent with AR4, increased buckling due to higher temperatures, as observed in 2003 in the UK, is 37 expected to increase the average annual cost for heat-related delays in some regions, while opposite effects are 38 expected for ice and snow-related delays (Dobney et al., 2010)(Lindgren et al., 2009). The impacts of extreme 39 precipitation, as well as the net overall regional effect of climate change remain unclear. Efficient adaptation 40 comprises proper maintenance of track and track bed. 41 42 Regarding inland waterways, the navigability of rivers will be affected. In Rhine, for temperature increases by 1-2 43 oC by 2050, high water levels in winter will occur more frequently and, from 2050, days with low water levels 44 during summer will also increase (Jonkeren et al., 2011)(Te Linde et al., 2011)(Te Linde, 2007)(Hurkmans et al., 45 2010). Future low water levels will imply restrictions on the load factor of inland ships, increasing transport prices, 46 as was the case in the Rhine and Moselle market in 2003 (Jonkeren, 2009)(Jonkeren et al., 2007). Potential 47 adaptation includes modal shift, increased number of navigational hours per day in periods with low water levels 48 and infrastructure modifications (e.g. canalization of river parts) (Jonkeren et al., 2011; Krekt et al., 2011). Using 49 smaller ships could be an attractive option if most barges were not considerably below the optimal size (Demirel, 50 2011). Regarding long range ocean transport, the economic attractiveness of the Northwest Passage and the 51 Northern Sea Route depends also on factors such as passage fees, bunker prices and cost of alternative sea routes 52 (Verny and Grigentin, 2009)(Liu and Kronbak, 2010)(Lasserre and Pelletier, 2011). 53 54
SECOND-ORDER DRAFT IPCC WGII AR5 Chapter 23
Do Not Cite, Quote, or Distribute 15 28 March 2013
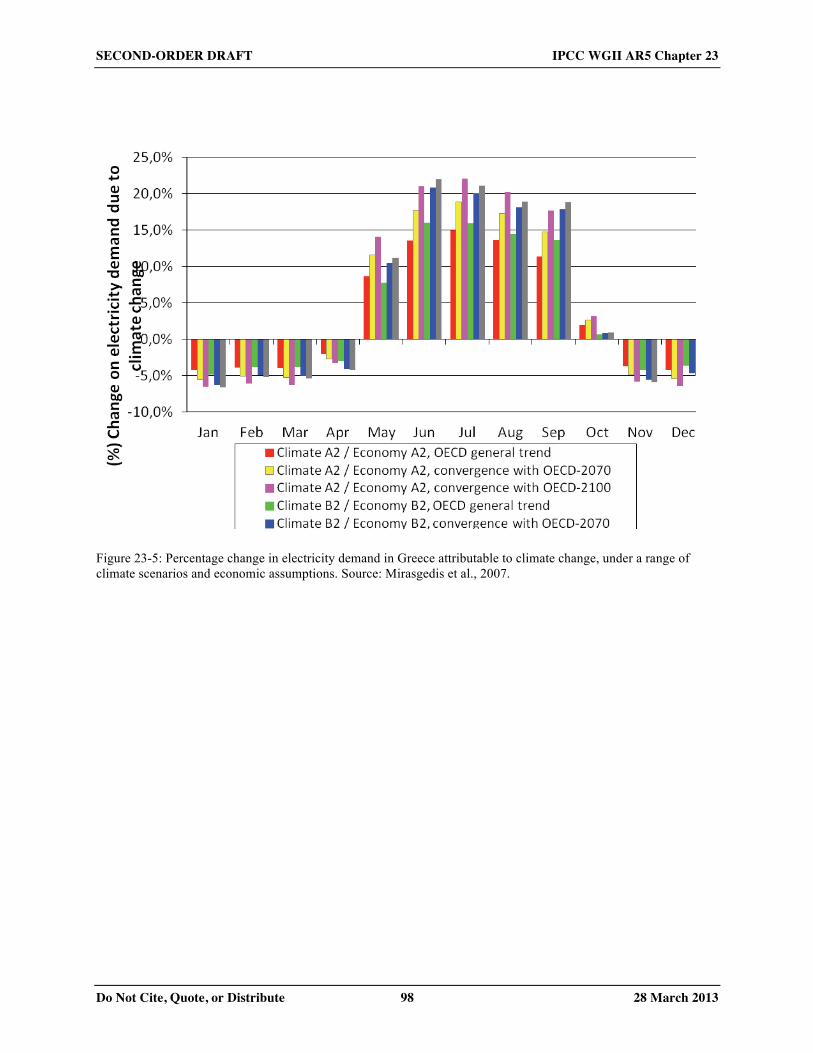
On air transport, estimates on climate change impacts are very few. Pejovic et al. (Pejovic et al., 2009) found that 1 for London’s Heathrow Airport, future temperature and wind changes would have a minor net annual change effect 2 (but much larger seasonal variations), while thunderstorms, snow and fog will increase weather-related delays. 3 4 5 23.3.4. Energy Production, Distribution, and Use 6 7 On wind energy, no significant changes are expected before 2050 in Northern, part of the Alpine and upper 8 Continental Europe (Pryor and Schoof, 2010)(Pryor and Barthelmie, 2010)(Seljom et al., 2011)(Barstad et al., 9 2012). After 2050, in line with AR4, sites in these regions may experience a small (<10-15%) increase in energy 10 density (W/m2) during winter and a decrease in summer (Harrison et al., 2008). For Southern and Atlantic Europe, 11 estimations are more uncertain and present spatial and seasonal variations (Rockel and Woth, 2007)(Bloom et al., 12 2008)(Najac et al., 2011)(Nolan et al., 2012; Pašičko et al., 2012). The impact of future increases in extreme wind 13 speeds in Northern and Continental Europe (see section 23.2.1) on the operation and maintenance of wind farms 14 remains unclear. 15 16 For hydropower, Scandinavia will face an increase of power generation up to 14% during 2071-2100 compared to 17 historic or present levels (Golombek et al., 2012)(Johannesson et al., 2012)(Haddeland et al., 2011); for 2021-2050, 18 increases up to 8.5% were estimated, while others predicted increases even by 15-20% (Seljom et al., 2011; 19 Hamududu and Killingtveit, 2012). In Continental and part of Alpine Europe, reductions by 6-46% were estimated, 20 depending on the emission scenario, location and time horizon (Schaefli et al., 2007)(Mauser and Bach, 2009)(Paiva 21 et al., 2011; Pašičko et al., 2012)(Stanzel and Nachtnebel, 2010). For Southern Europe, a decreased production by 5-22 15% in 2050 compared to 2005 has been estimated (Hamududu and Killingtveit, 2012). Improved water 23 management, including pump storage if appropriate, stands as the main adaptation option (Schaefli et al., 24 2007)(García-Ruiz et al., 2011). 25 26 Biofuel production is covered in section 23.4.6. No literature on climate change impacts on solar energy production 27 was found (since AR4). On thermal power, in line with AR4, van Vliet et al. (Van Vliet et al., 2012) estimated a 6-28 19% decrease of the summer average usable capacity of power plants by 2031–2060 compared to 1971-2000, while 29 lower figures have been also estimated (Linnerud et al., 2011)(Förster and Lilliestam, 2010). Closed-cooling circuits 30 are efficient for adaptation (Koch and Vögele, 2009) but are usually feasible only for new plants. In power 31 transmission, increasing lighting faults and decreasing snow-sleet-and blizzard faults for 2050-2080 were estimated 32 for UK (McColl et al., 2012). 33 34 By considering both heating and cooling, the total annual energy demand in Europe as a whole during 2000-2100 is 35 estimated to decrease following climate change (Isaac and van Vuuren, 2009). Seasonal changes will be prominent, 36 especially for electricity (see Figure 23-5), with summer peaks arising also in countries with moderate summer 37 temperatures (Hekkenberg et al., 2009). Heating degree days under a +3.7 oC scenario are expected to decrease by 38 11-20% between 2000 and 2050 due solely to climate change (Isaac and van Vuuren, 2009). For cooling, very large 39 percentage increases up to 2050 are estimated by the same authors for most of Europe as the current penetration of 40 cooling devices is low; then, increases by 74-118% in 2100 (depending on the region) from 2050 are expected under 41 the combined effect of climatic and non-climatic drivers. In the Mediterranean, cooling degree days by 2060 will 42 increase, while heating degree days will decrease but with substantial spatial variations (Giannakopoulos et al., 43 2009). Following climate change, a net annual increase of future electricity generation cost in most of the 44 Mediterranean and a decrease in the rest of Europe was estimated (Eskeland and Mideksa, 2010)(Mirasgedis et al., 45 2007)(Pilli-Sihlova et al., 2010; Zachariadis, 2010). Future building stock changes and retrofit rates are critical for 46 impact assessment and adaptation (Olonscheck et al., 2011). Passive-cooling alone may not to be enough, while 47 energy efficient buildings and cooling systems, and demand-side management are effective adaptation options 48 (Artmann et al., 2008; Jenkins et al., 2008; Day et al., 2009; Breesch and Janssens, 2010; Chow and Levermore, 49 2010). 50 51 [INSERT FIGURE 23-5 HERE 52 Figure 23-5: Percentage change in electricity demand in Greece attributable to climate change, under a range of 53 climate scenarios and economic assumptions. Source: Mirasgedis et al., 2007.] 54
SECOND-ORDER DRAFT IPCC WGII AR5 Chapter 23
Do Not Cite, Quote, or Distribute 16 28 March 2013
1 2 23.3.5. Industry and Manufacturing 3 4 Research on the potential effects of climate change on future consumption patterns (e.g. soft drinks, ice creams) is 5 very limited, and based on current sensitivity to seasonal temperature (Mirasgedis et al., 2013). Climate change may 6 also affect supply chains, utilities and transport infrastructure with implications for some industries (see also chapter 7 10). Higher temperatures may alter the products’ quality and safety by favouring the growth of food borne 8 pathogens or contaminants (Jacxsens et al., 2010; Popov Janevska et al., 2010) (see also section 24.5.1). The 9 production of some high value crops is likely to be affected by climate warming (see 23.4.1 and Box 23-1 on Wine). 10 11 23.3.6. Tourism 12 13 In line with AR4, in northern areas of Continental Europe, as well as Finland, southern Scandinavia and southern 14 England, climate for general tourist activities especially after 2070 is expected to improve significantly during 15 summer and less during autumn and spring under different emission scenarios (Amelung and Moreno, 2011); 16 (Amelung et al., 2007)(Nicholls and Amelung, 2008), although local weather may not be a major barrier for these 17 activities (Denstadli et al., 2011). For the Mediterranean, climate for light outdoor tourist activities is expected to 18 deteriorate in summer mainly after 2050 but improve during spring and autumn (Amelung and Moreno, 2009) (Hein 19 et al., 2009) (Perch-Nielsen et al., 2010)(Amelung et al., 2007)(Giannakopoulos et al., 2011). Though, other studies 20 concluded that before 2030 (or even 2060) this region as a whole will not become too hot for beach or urban tourism 21 (Moreno and Amelung, 2009)(Rutty and Scott, 2010). Observed visitation data and questionnaires indicate that 22 beach tourists are not deterred by moderately high temperatures but by rain (De Freitas et al., 2008)(Moreno, 23 2010)(Moreno and Amelung, 2009). Tourist arrivals depend also on the age of tourists and the climate at their 24 country of origin, economic and environmental conditions at destinations (e.g. water stress, increased further by 25 climate change and tourist development) (Hamilton and Tol, 2007)(Moreno and Amelung, 2009; Perch-Nielsen et 26 al., 2010)(Lyons et al., 2009; Eugenio-Martin and Campos-Soria, 2010)(Rico-Amoros et al., 2009). The future 27 capacity of accommodation and transport networks in destinations is also important. 28 29 Regarding ski tourism, in agreement with AR4, climate change will affect natural snow reliability and consequently 30 the ski season’s length, especially in cases without or limited artificial snowmaking (OECD, 2007)(Steiger, 31 2011)(Steiger, 2010b)(Moen and Fredman, 2007). Low-lying areas will be the most vulnerable (Uhlmann et al., 32 2009; Endler et al., 2010; Serquet and Rebetez, 2011; Steiger, 2011; Endler and Matzarakis, 2011a). The response of 33 tourists to marginal snow conditions remains largely unknown (Scott et al., 2012), while changes in weather 34 extremes may also be critical (Tervo, 2008). Up to mid-century, demographic changes may have a higher impact on 35 skiing tourism than climate change (Steiger, 2012). Artificial snowmaking has physical and economic limitations, 36 especially in small/ medium sized and low-altitude ski stations (Sauter et al., 2010)(Steiger, 2010a; Steiger, 37 2010b)(Steiger and Mayer, 2008), and increases water and energy consumption. Other options may include shift to 38 higher altitudes, operational changes, technical measures and year-round tourist activities, although it is still 39 uncertain whether they can fully compensate climate change adverse impacts. Mountainous areas may face 40 improved climatic conditions for summer tourism due to climate change (Endler et al., 2010; Perch-Nielsen et al., 41 2010; Serquet and Rebetez, 2011; Endler and Matzarakis, 2011b). 42 43 44 23.3.7. Insurance and Banking 45 46 The financial sector has a large base in Europe, and its global and regional activities are potentially affected by 47 climate change (see AR5 WG2 Section 10.7 for a more detailed discussion). The insurance and banking sector is 48 affected by problems with accurate pricing of insurance, shortage of capital after large loss events (weather 49 disasters), and by an increasing burden of losses that can affect markets and insurability, within but also outside the 50 European region (CEA, 2007; Botzen et al., 2010a; Botzen et al., 2010b). On the other hand, risk transfer 51 mechanisms including insurance are also an important means to cover and reduce losses from extreme weather 52 (Botzen and van den Bergh, 2008; CEA, 2009)(Herweijer et al., 2009). 53 54
SECOND-ORDER DRAFT IPCC WGII AR5 Chapter 23
Do Not Cite, Quote, or Distribute 17 28 March 2013
Banking is potentially affected through physical impacts from climate change on their assets and investments, as 1 well as regulation and/or through mitigation actions by changing demands regarding carbon emissions from 2 activities related to their investments and lending portfolios. Few banks have adopted climate strategies that also 3 address adaptation (Furrer et al., 2009)(Cogan, 2008). 4 5 Windstorm losses that are generally well covered in Europe by building and motor policies and create a large 6 exposure to the insurance sector. Studies indicate an overall increase storm hazard (see Section 23.2.2.3) and 7 possibly insured losses (see Chapter 17.7.3 for a full discussion), but the natural variations in storm frequency are 8 large. There is no evidence that the increase in historic European storm damages is due to anthropogenic climate 9 change. The increasing number and value of buildings and infrastructure is a major driver at present (Barredo, 10 2010). Flood losses in the UK in 2000, 2007 and 2009 have put the insurance market under further pressure, with 11 increasing need for the government to reduce risk (Ward et al., 2008)(Lamond et al., 2009). Other losses of concern 12 to the European insurance industry are building subsidence losses related to drought (Corti et al., 2009), insured hail 13 damage to buildings (Kunz et al., 2009) (Botzen et al., 2010b)(GIA, 2011). 14 15 The financial sector can adapt through adjustment of premiums, restricting or reduction of coverage, further risk 16 spreading, and importantly incentivising risk reduction (Clemo, 2008; Botzen et al., 2010a)(Crichton, 17 2007)(Crichton, 2006)(Wamsler and Lawson, 2011)(Surminski and Philp, 2010). Willingness-to-pay studies in 18 Scotland and the Netherlands show that public attitudes would support insurance of private property and public 19 infrastructure damages in the case of increasing flood risk (Botzen et al., 2009)(Glenk and Fisher, 2010). 20 Government intervention is needed in many European countries to provide compensation and back-stopping of 21 private insurance schemes in the event of major losses (Aakre and Rübbelke, 2010; Aakre et al., 2010). Hochrainer 22 et al. (Hochrainer et al., 2010; Hochrainer et al., 2010) analysed the performance of the EU Solidarity Fund system 23 that supports European governments in the event of large losses, and argue there is a need to shift its focus from 24 compensation to incentivising risk reduction. Alternative forms of private insurance mechanisms, such as long-term 25 (multi-year) contracts for European flood risks suffer from uncertainty related to future risks under climate change, 26 leading to additional risk to private insurance firms (Aerts and Botzen, 2011). 27 28 29 23.4. Implications of Climate Change for Agriculture, Fisheries, Forestry and Bioenergy Production 30 31 23.4.1. Plant (Food) Production 32 33 In AR4, Alcamo et al. (2007) reported that crop suitability is likely to change throughout Europe, and crop 34 productivity (all other factors remaining unchanged) is likely to increase in Northern Europe, and decrease in 35 Southern Europe, and the eastern part of Continental Europe. 36 37 The frequency and severity of climatic extremes affect agricultural systems (Tubiello et al., 2007)(Coumou and 38 Rahmstorf, 2012) Table 23-5). Climate-induced variability in wheat production has increased in recent decades in 39 France, Italy and Spain (Brisson et al., 2010)(Hawkins et al., 2013) and in some Hungarian regions (Ladanyi, 2008), 40 while in the northernmost agricultural areas of Europe, no consistent reduction in yield variability was recorded 41 despite warming (Peltonen-sainio et al., 2010). In 2003 and 2010, Western Europe and Western Russia, respectively, 42 experienced their hottest summers since 1500 (Luterbacher et al., 2004)(Barriopedro et al., 2011); grain-harvest 43 losses in affected regions reached 20 and 30%, respectively (Ciais et al., 2005; Aerts and Botzen, 2011; Aerts and 44 Botzen, 2011). The 2004/2005 hydrological year was characterised by an intense drought throughout the Iberian 45 Peninsula and cereals production fell on average by 40% (EEA, 2010b). In 2011, the hottest and driest spring on 46 record in France since 1880 reduced annual grassland production and annual grain harvest by 20 and 12%, 47 respectively (AGRESTE, 2011)(Coumou and Rahmstorf, 2012). In the Czech Republic, the grain yield sensitivity to 48 a 1◦C temperature increase during the growing season was -11% and -10% for winter wheat and spring barley, 49 respectively, over 1961-2007 (Trnka et al., 2012). 50 51 In many European countries cereal yields have declined in recent decades (Olesen et al., 2011) although the national 52 statistical yields are below the agro-climatic potential yield (Supit et al., 2010). Cereal yields have been negatively 53 affected by warming in some European countries since 1980, for example, in France by -5% for wheat and -4% for 54
SECOND-ORDER DRAFT IPCC WGII AR5 Chapter 23
Do Not Cite, Quote, or Distribute 18 28 March 2013
maize (Lobell et al., 2011). Restricted crop inputs and changes in crop rotations, as well as the increased frequency 1 of high temperatures and droughts during grain filling, have reduced wheat yield growth in France (Brisson et al., 2 2010; Kristensen et al., 2011). In contrast, in eastern Scotland, warming is estimated to have contributed to 23–26% 3 of observed increase potato yields since 1960 (Gregory and Marshall, 2012). In North-East Spain, an increased 4 water deficit in the reproductive stage since the 1960s has reduced grape yield by up to 30 kg/ha per millimetre 5 (Camps and Ramos, 2012). This is consistent with agro-climatic modelling showing a widespread decline over the 6 period 1976-2005 in the climatic potential of crop yields, especially in Italy, central and eastern Europe (Supit et al., 7 2010). 8 9 Insight into the potential effect of climate change on any particular species or crop system requires the combination 10 of a wide range of emission scenarios, global circulation models (GCM) and impact studies (Trnka et al., 11 2007)(Soussana et al., 2010). For a global temperature increase of 5° C, agroclimatic indices adjusted to reflect the 12 effects of atmospheric CO2 concentration on evapotranspiration and based on outputs from three GCMs, show 13 increased drought stress and shortening of the active growing season with an increasing number of extremely 14 unfavourable years in a number of European regions (Trnka et al., 2011). In the EU27, a 2.5 °C temperature increase 15 in the 2080s could lead to small changes in crop yields, whereas a 5.4 °C scenario could reduce yields by 10% 16 (Ciscar et al., 2011). A study combining three GCMs and two emission scenarios (B1 and A2) with a weather 17 generator and the crop modelling system GCMS applied to wheat, maize and sugar beet, and assuming neither 18 impacts by weeds, pests and diseases nor limitations by nutrients, indicates an initial benefit from the increasing CO2 19 concentration for rainfed crop yields in most European regions, contrasting by the end of the century with yields 20 declines in most regions (Supit et al., 2012). Under the A2 scenario, wheat yield is projected to increase at the end of 21 the century compared to the baseline period 1990–2008 (Supit et al., 2012). Another study, using the CropSyst 22 model and bias-corrected downscaled simulations for the A1B emission scenario, shows based on outputs from the 23 HadCM3 GCM, that disease (wheat leaf rust and corn grey leaf spot) limited yields of rainfed wheat and maize 24 would be reduced despite the increase in atmospheric CO2 by 5-20% in ca. half of the European cropping area in the 25 2030’s compared to a reference period centred on the year 2000, while the corresponding yield changes would be 26 non-significant or slightly positive based on the ECHAM GCM (Donatelli et al., 2012). 27 28 The regional distribution of climate change impacts on agricultural production is likely to vary widely (Iglesias et 29 al., 2012)(Donatelli et al., 2012), Figure 23-6). Southern Europe would experience the largest yield losses that 30 would reach about 25 % by 2080 under a 5.4 °C temperature increase (Ciscar et al., 2011). Conditional on increased 31 water shortage and extreme weather events (heat, drought) rainfed summer crop failure is very likely to rise sharply 32 (Bindi and Olesen, 2011)(Ferrara et al., 2010)(Ruiz-Ramos et al., 2011) in Southern Europe. The Central Europe 33 regions would experience moderate declines in crop yields (Ciscar et al., 2011), as a result of warmer and drier 34 conditions by 2050 (Trnka et al., 2010; Trnka et al., 2011). In Western Europe, for the 2050s, increased heat stress 35 around flowering is likely to increase significantly in wheat which may result in considerable yield losses (Semenov, 36 2009). 37 38 For Northern Europe, there is diverging evidence concerning future impacts. Positive yield changes combined with 39 the expansion of climatically suitable areas could lead to crop production increases for a large range of scenarios 40 (between 2.5 and 5.4°C warming) (Bindi and Olesen, 2011). However, at high latitudes, even accounting for the 41 positive effects of CO2 fertilization, impacts on cereal production could become negative with a high risk of marked 42 yield loss beyond 4°C global temperature increase (Rötter et al., 2011). Increased climatic variability would limit 43 winter crops expansion in the northernmost agricultural areas of Europe (Peltonen-sainio et al., 2010), but spring 44 crops from tropical origin like maize for silage could become cultivated in Finland by the end of this century 45 (Peltonen-Sainio et al., 2009). 46 47 [INSERT FIGURE 23-6 HERE 48 Figure 23-6: Percentage change in simulated water-limited yield for winter wheat in 2030 with respect to the 2000 49 baseline under the A1B scenario as modelled using ECHAM5 (left column) and HadCM3 (right). Upper maps to do 50 not take adaptation into account whereas the bottom maps show the result for the best adaptation strategy for cell 51 (Source: Donatelli et al. 2012).] 52 53
SECOND-ORDER DRAFT IPCC WGII AR5 Chapter 23
Do Not Cite, Quote, or Distribute 19 28 March 2013
Ozone is the most important air pollutant that affects agricultural production. For the European Union, compared to 1 a baseline without crop injuries from ozone, wheat and maize yield reduction from ozone were estimated at 7% in 2 2000 and would reach 6 and 10 % in 2030 for the B1 and A2 scenarios, respectively (Avnery et al., 2011a; Avnery 3 et al., 2011b). Crop sensitivity to ozone tends to decline with increasing atmospheric CO2 and in areas where 4 warming is accompanied by drying, such as southern and continental Europe. In contrast, the ozone sensitivity of 5 crops would remain high at higher latitudes the absence of declining air and soil moisture (Fuhrer, 2009). 6 7 Some economically damaging weeds, such as the shallow rooted Alopecurus myosuroides in UK, could become less 8 competitive with wheat owing to more frequent and severe drought stress events under climate change that favour 9 deeper rooted crop plants such as wheat (Stratonovitch, 2012). However, deep rooted weeds (Gilgen et al., 2010) 10 and weeds with contrasting physiology, such as C4 species, may become better adapted to future conditions and pose 11 a more serious threat (Bradley et al., 2010). 12 13 For crops remaining in their original geographical range, generally warmer conditions would exacerbate arthropod-14 borne diseases (many viruses and phytoplasmas) and those root and stem diseases that first infect hosts during the 15 autumn and winter, such as stem canker of oilseed rape and eyespot of wheat (West et al., 2012). Rising 16 temperatures during the vegetation period, enhances the appearance of a black rot fungus in fruit trees of 17 Northwestern Europe, but this does not hold for other fruit rot species (Weber, 2009) and some pathogens like cereal 18 stem rots (e.g. Puccinia striiformis) (Luck et al., 2011) and grapevine powdery mildew (Caffarra et al., 2012) could 19 be limited by increasing temperatures. By the 2050s, more severe Fusarium blight epidemics are projected in 20 southern England (Madgwick et al., 2011), while the European corn borer (Ostrinia nubilalis) would extend its 21 climate niche in Central Europe (Trnka et al., 2007). Increased damages from plant pathogens and insect pests are 22 projected by 2050 in Nordic countries which have hitherto been protected by cold winters and geographic isolation 23 (Hakala et al., 2011; Roos et al., 2011). Yield losses from phoma stem canker epidemics could increase to up to 50 24 per cent in South England and greatly decrease yield of untreated winter oilseed rape (Butterworth et al., 2010). 25 Increasing temperatures might have a detrimental impact on grapevine yield due to increased asynchrony between 26 larval development of the European grapevine moth and the larvae-resistant growth stages of grapevine (Caffarra et 27 al., 2012). Disease management will also be affected with regard to timing, preference and efficacy of chemical, 28 physical and biological measures of control and their utilization within integrated pest management strategies 29 (Kersebaum et al., 2008). 30 31 Farmers across Europe are currently adapting to climate change (Olesen et al., 2011). Simple, no-cost adaptation 32 options such as advancement of sowing and harvesting dates or the use of longer cycle varieties may be 33 implemented although such options may become less successful in a more variable climate (Moriondo et al., 2010; 34 Moriondo et al., 2011)(Howden et al., 2007). Such “autonomous” adaptation by farmers could result in a general 35 improvement of European wheat yields in the 2030s compared to the 2000s (Donatelli et al., 2012) (Figure 23-6). 36 However, earlier sowing is often prevented by lack of soil workability and frost-induced soil crumbling (Oort, 37 2012). Observations suggest that farmer sowing dates are advancing slower (e.g. by only 0.2 days per decade over 38 the last 50 years, (Siebert and Ewert, 2012) than crop phenology (Menzel et al., 2006)(Siebert and Ewert, 39 2012)(Oort, 2012) in Europe. Simulation studies which anticipate on earlier sowing may thus be overly optimistic. 40 41 Further adaptation options include: changes in crop species, fertilization, irrigation, drainage, land allocation and 42 farming system (Bindi and Olesen, 2011). In South Italy, for a global mean temperature change of 2°C (above pre-43 industrial levels), adaptation measures (irrigation and fertilization) would alleviate the negative effects of climate 44 change on crop (tomato and durum wheat) productivity (Ventrella et al., 2012). At the high range of the projected 45 temperature changes, only plant breeding aimed at increasing yield potential jointly with drought resistance and 46 adjusted agronomic practices, such as sowing and adequate nitrogen fertilizer management, may reduce risks of 47 yield shortfall (Olesen et al., 2011)(Rötter et al., 2011)(Ventrella et al., 2012). Climate change alters breeding 48 targets. The identification of the most CO2-responsive genotypes (Ainsworth et al., 2008) and of heat, drought- and 49 salinity-tolerant genotypes (Tester and Langridge, 2010)(Semenov and Shewry, 2011) as well as the preservation of 50 the option value provided by plant genetic diversity, is a pre-requisite to provide starting lines for breeding 51 programmes (Jump et al., 2009). However, crop breeding is challenged by temperature and rainfall variability, 52 since: i) breeding has not yet succeeded in altering crop plant development responses to short-term changes in 53
SECOND-ORDER DRAFT IPCC WGII AR5 Chapter 23
Do Not Cite, Quote, or Distribute 20 28 March 2013
temperature (Parent and Tardieu, 2012) and ii) distinct crop drought tolerance traits are required for mild and severe 1 water deficit scenarios (Tardieu, 2012). 2 3 Achieving increased adaptation action will necessitate integration of climate change-related issues with other risk 4 factors, such as market risk (Howden et al., 2007)(Knox et al., 2010). Adaptation to increased climatic variability 5 may imply an increased use of between and within species genetic diversity in farming systems (Smith and Olesen, 6 2010). The development of insurance products against weather-related yield variations by using precipitation 7 options (Musshoff et al., 2011) may be a tool to reduce risk aversion by farmers. Adaptive capacity to variable and 8 changing conditions is largely attributable to the characteristics of farm types (Reidsma et al., 2009) which may vary 9 given long-term farm structural change induced by climate change (Mandryk et al., 2012). The long term economic 10 viability of farming systems under future scenarios is better characterised by combining ecological and economic 11 optimisation models at the farm scale (Moriondo et al., 2010b). 12 13 14 23.4.2. Livestock Production 15 16 Livestock production is impacted by heat. High temperatures lead to a reduction in animal voluntary intake and put a 17 ceiling on dairy milk yield from feed intake (Tubiello et al., 2007). For intensive dairy systems in the Netherlands, 18 heat stress affected dairy production above a daily mean temperature of 18 degrees C (André et al., 2011). For 19 finishing pigs, a meta-analysis shows that growth performance decreases at an accelerating rate when daily 20 temperature increases above a threshold comprised between 21 and 30° (Renaudeau et al., 2011). With dairy cattle 21 in Italy, the mortality risk increased by 60% as a result of exposure during breeding to a combination of high air 22 temperature and air humidity (Crescio et al., 2010). For domesticated animals, climate change adaptation involves 23 changes in diets and farm buildings (Renaudeau et al., 2012) as well as genetic improvement programmes targeting 24 adaptive and performance traits in locally adapted genotypes (Hoffmann, 2010). 25 26 Atmospheric CO2 rise, warming and altered precipitation patterns may change the amount timing and quality of 27 forage production in Europe (Soussana and Luscher, 2007). Experimental manipulation shows the resilience of 28 semi-natural grassland vegetation to prolonged experimental heating and water manipulation (Grime et al., 2008). 29 Nevertheless, even under elevated CO2, annual grassland production in a French upland site was significantly 30 reduced by four years exposure to climatic conditions corresponding to the A2 emission scenario for the 2070s 31 (Cantarel et al., 2013). Repeated exposure of grasslands to summer droughts increased weed pressure by tap rooted 32 forbs such as Rumex (Gilgen et al., 2010). With grass based dairy systems, simulations under the A1B scenario with 33 an ensemble of downscaled GCMs show by the end of the century increases in potential dairy production in Ireland 34 and France, however with increasing risks of summer-autumn forage production failures at French sites (Fitzgerald 35 et al., 2010; Graux et al., 2012) . In continental Europe, grass based dairy systems could suffer from rising water 36 deficits and forage yield variability (Trnka et al., 2009). With sown forage grasses, Mediterranean populations were 37 more resilient than temperate populations to soil water deficit and to heat (Poirier et al., 2012) and could therefore 38 be used to breed better adapted plant material. 39 40 The spread of bluetongue virus (BTV) in sheep across Europe has been partly attributed to climate warming (Arzt et 41 al., 2010)(Guis et al., 2012) and was caused by increased seasonal activity of the Culicoides vector (Wilson and 42 Mellor, 2009). Climate change is unlikely to extend the distribution of vector Culicoides imicola but may increase 43 its abundance in Southern Europe (Acevedo et al., 2010). Ticks, the primary arthropod vectors of zoonotic diseases 44 in Europe, have likely changed distributions with climate warming (van Dijk et al., 2010)(Randolph and Rogers, 45 2010; Petney et al., 2012)(23.5), Climate warming may also increase the risk of fly strike incidence but this can be 46 managed through changes in husbandry practices (Wall and Ellse, 2011). For Europe, climate change is not project 47 to increase by the 2080s the overall risk of incursion of Crimean-Congo haemorrhagic fever virus in livestock 48 through infected ticks introduced by migratory bird species (Gale et al., 2012). The probability of introduction and 49 large-scale spread of Rift Valley Fever in Europe is also very low (Chevalier et al., 2010). Epidemiological 50 surveillance and increased coordinated regional monitoring and control programmes have the potential to reduce the 51 incidence of vector-borne animal diseases (Chevalier et al., 2010)(Wilson and Mellor, 2009). 52 53 54
SECOND-ORDER DRAFT IPCC WGII AR5 Chapter 23
Do Not Cite, Quote, or Distribute 21 28 March 2013
23.4.3. Water Resources and Agriculture 1 2 Future projected trends confirm (Falloon and Betts, 2010) the widening of water resource differences between 3 Northern and Southern European regions reported in AR4 (Alcamo et al., 2007). Under the A1B scenario multi-4 model simulations show for the 21st century that Nordic river basins have the highest probability of exceeding past 5 high flows during winter, while in Central and Southern European basins the probability of reduced low flows in 6 summer is highest (Weiss, 2011). Simulations using ensemble of GCMs and regional climate models under the A2 7 emission scenario, show significant reductions by the end of the century in groundwater recharge and/or water table 8 level for river basins located in Northern France (Ducharne et al., 2010), Belgium (Goderniaux et al., 2011), 9 Southern Italy (Senatore et al., 2011) and Spain (Guardiola-Albert and Jackson, 2011), while non-significant 10 impacts were found for aquifers in Switzerland and in England (Stoll et al., 2011)(Jackson et al., 2011). In Northern 11 Europe, negative impacts on water quality are expected due to the intensification of agriculture (Bindi and Olesen, 12 2010). In the Seine river basin, even with reduced N fertilizer application, groundwater nitrate concentrations would 13 increase during the 21st century (Ducharne et al., 2007). Changes in seasonal precipitation distribution, such as less 14 precipitation in summer and higher rainfall during winter, can enhance nitrate leaching due to lower nitrogen use 15 efficiency in dry periods with higher residual mineral nitrogen after harvest and increased percolation during winter 16 (Kersebaum et al., 2008). 17 18 Projections in most European regions, show deteriorating agroclimatic conditions and reduced suitability for rainfed 19 agricultural production (Daccache et al., 2012)(Trnka et al., 2011)(Daccache and Lamaddalena, 2010)(Henriques et 20 al., 2008). Water demand for crop irrigation is projected increase by 40 to 250% by 2100, depending on the crop, in 21 the Fluvià watershed (Catalonia, NE Spain) under the B1 and A2 scenarios (Savé et al., 2012). 22 23 Increased irrigation may, however, not be a viable option in a number of European regions because of the reduction 24 in total runoff and of declining groundwater resources, especially in the Mediterranean area (Olesen et al., 2011). 25 Supplementary irrigation in central and eastern England would be constrained by water availability, since in the 26 corresponding catchments water resources are already over-licensed and/or over-abstracted (Daccache et al., 2012). 27 In the French Beauce region, one of the hotspots for irrigation in Europe, water resources reliability is threatened by 28 climate change induced decline in groundwater recharge and to a lesser extent by the increase in potential demand 29 for irrigation (Ducharne et al., 2010). For a tributary of the Ebro river in Spain, drying is projected to occur mainly 30 during the summer with a reduction in the amount of water available for irrigation, due to projected seasonal 31 reductions in reservoir levels (Majone et al., 2012). The need for irrigation may also appear in regions without 32 irrigation infrastructure, as observed during the 2003 summer heat wave and drought in France (van et al., 2010). In 33 Southern Italy, climate change could increase the number of failures for current irrigation systems up to 54-60%. 34 System costs would increase by 20-27% when designed according to the future irrigation demand (Daccache and 35 Lamaddalena, 2010). Even though the adoption of irrigation leads to higher and less variable crop yields in the 36 future, economic benefits of this adoption decision are expected to be rather small. Thus, without changes in 37 institutional and market conditions, no adoption is expected in countries like Switzerland (Finger et al., 2011). 38 39 For Northern Europe, agricultural adaptation may be shaped by increased water supply and flood hazards. The need 40 for effective adaptation will be greatest in Southern and south-eastern regions of Europe which already suffer most 41 from water stress, as a result of increased production vulnerability, reduced water supply and increased demands for 42 irrigation (Trnka et al., 2009)(Falloon and Betts, 2010). High frequency of rainy conditions complicates soil 43 workability (Olesen et al., 2011). Earlier sowing dates may allow earlier irrigation and a reduction of the water 44 application (Gonzalez-Camacho et al., 2008). An increased soil organic matter content may facilitate better soil 45 water retention during drought and enhance infiltration capacities (Lee et al., 2008). Areas with poor water-holding 46 soils could be managed extensively for groundwater recharge harvesting, while better water-holding soils could be 47 used for high input crop production (Wessolek and Asseng, 2006). Improved water management in upstream food 48 production areas could mitigate adverse impacts downstream (Kløve et al., 2011). Alternative options such as the 49 use of low-energy systems, improving irrigation efficiency, switching to deficit irrigation and changing cropping 50 patterns to increase water use efficiency can be used as adaptation pathways (Daccache and Lamaddalena, 51 2010)(Schutze and Schmitz, 2010). 52 53
SECOND-ORDER DRAFT IPCC WGII AR5 Chapter 23
Do Not Cite, Quote, or Distribute 22 28 March 2013
Water use by agriculture affects aquatic ecosystems through stream flow reduction, alteration in stream flow 1 patterns, wetland degradation and declining water quality. Terrestrial ecosystems are affected through changes in 2 groundwater levels and alterations to runoff due to land use changes (Kløve et al., 2011). Under economically 3 focussed regional futures, water supply availability increases at the expense of the environment. Under 4 environmentally focussed futures, irrigation demand restrictions are imposed. In a global market-drive future 5 irrigation demand is price sensitive and has an impact on the type of crops under all climate scenarios (Henriques et 6 al., 2008). More bioenergy production may result in more water stress in some river basins and regions, in particular 7 in southern Europe and during dry summers (Dworak et al., 2009). 8 9 10 23.4.4. Forestry 11 12 Observed and future responses of forests to climate change include changes in growth rates, phenology, species 13 composition, increased fire and storm damage, and increased insect and pathogen damage. 14 15 Forest growth and phenology 16 Tree mortality and forest decline due to severe drought events were observed in forests populations in many 17 Mediterranean countries (Affolter et al., 2010)(Bigler et al., 2006; Raftoyannis et al., 2008) as Italy (Bertini et al., 18 2011)(Giuggiola et al., 2010), Cyprus (ECHOES Country report, 2009), Greece (Raftoyannis et al., 2008) and in the 19 pre-Alps in France (Rouault et al., 2006; Allen et al., 2010)(Nageleisen, 2008; Giuggiola et al., 2010) not only in 20 arid regions but also in wet forests not normally considered at risk of drought (Choat et al., 2012). Phenological 21 advancement in the leaf bud burst and flowering timing was recorded in deciduous species of Southern and Central 22 Finland (Linkosaloa et al., 2009) and crown defoliation was observed in southern European forests due to climate 23 change during 1987-2007 (Carnicer et al., 2011). Despite such negative trends, an increase in forest productivity 24 was observed since 1986 in Italian mountain beech due to the increase of average temperatures (Rodolfi et al., 25 2007). 26 27 Climate change will affect growth and regeneration of forest tree populations in Europe (Lavalle et al., 2009). 28 Future projections show that in Northern and Atlantic Europe the increasing atmospheric CO2 and warmer 29 temperatures are expected to result in positive effects on forest growth and wood production, at least in the short–30 medium term (Lindner et al., 2010). On the other hand, in Southern and conitnental Europe increasing drought and 31 disturbance risks will cause adverse effects and productivity is expected to decline (Lindner et al., 2010). The 32 CO2 fertilization in both Central Europe and Mediterranean will have positive effects on growth although these 33 results contrast with habitat reductions and decline of stand regeneration (Hlásny et al., 2011; Keenan et al., 2011; E 34 Silva et al., 2012). 35 36 Species composition 37 Shifts in forest tree species range due to climate change has been predicted by model-based projections for the 38 period 2070-2100, with a general trend of a south-west to north-east, under A1B scenario, and uphill shifts in 39 suitable habitats for forest categories (Feehan et al., 2009)(Casalegno et al., 2007) causing large ecological and 40 socio-economic impacts and becoming an important issue to be addressed for forest management (Giuggiola et al., 41 2010; Hemery et al., 2010; García-López J.M. and Alluéa, 2011). By 2100 climate change is expected to reduce the 42 economic value of European forest land by 14 to 50 % under A1B climate scenario, which equates to a potential 43 damage of several hundred billion Euros unless effective countermeasures are taken, owing to the decline of 44 economically valuable species (Hanewinkel et al., 2012). 45 46 Fire and storm damage 47 In Southern Europe, fire frequency and fire extent significantly increased due to climate change in recent decades 48 especially in the Mediterranean basin (Marques et al., 2011; Pausas and Fernández-Muñoz, 2012) including an 49 expansion of fire-prone areas (Fernandes et al., 2010; Koutsias et al., 2012) and a lengthening of the fire season 50 (Lavalle et al., 2009; Albert and Schmidt, 2010). Extreme weather events (drought, heat waves and strong winds) 51 increased the incidence of forest fires in Southern Europe (Camia and Amatulli, 2009; Hoinka et al., 2009; Carvalho 52 et al., 2011; Koutsias et al., 2012; Salis et al., 2013). The most severe events in France, Greece, Italy, Portugal, 53 Spain, and Turkey in 2009 were associated with strong winds that spread fires during a hot, dry period (see also 54
SECOND-ORDER DRAFT IPCC WGII AR5 Chapter 23
Do Not Cite, Quote, or Distribute 23 28 March 2013
(EEA, 2008). However, the observed fire trend is also attributable to changes in land use (Marlon et al., 2008; 1 Carmo et al., 2011), socio-economic development and fire-policy factors (Martinez-Casasnovas and Ramos, 2009; 2 Romero-Calcerrada et al., 2010; Koutsias et al., 2012; Pausas and Fernández-Muñoz, 2012; {{1545 Pezzatti 3 2011;}}. 4 5 Fire is expected to become more prevalent also in the future due to climate change causing negative effects on forest 6 ecosystems and significant emissions of greenhouse gases due to biomass burning (Pausas et al., 2008; Vilén and 7 Fernandes, 2011; Chiriacò et al., 2013), even if often difficult to precisely quantify (Chiriacò et al., 2013). The 8 future climate change impacts on forest fires in Mediterranean basin might depend on the balance between higher 9 flammability due to warmer and drier conditions, socio-economic drivers and landscape planning to reduce fuel 10 loads and fire hazard (Moreira et al., 2011). The fire risk is projected to increase in the Mediterranean region 11 (Lindner et al., 2010; Carvalho et al., 2011; Dury et al., 2011; Vilén and Fernandes, 2011) with increase in the 12 occurrence of high fire danger days (Moreno and Amelung, 2009; Arca et al., 2012) and in fire season length 13 (Pellizzaro et al., 2010). The annual burned area is projected to increase by a factor of 3 to 5 in the Mediterranean 14 area compared to the present under the A2 scenario by 2100 (Dury et al., 2011). In Northern Europe, fires are 15 projected to be less frequent due to increased humidity (Rosan and Hammarlund, 2007). 16 17 The most severe damage to forests in Central Europe occurs during winter storms caused by Northern Hemispheric 18 mid-latitude cyclones. Increasing growing stock, warm winter temperature and high precipitation, increasing 19 maximum gust wind speed have contributed to the recent increase in windstorm damage to forests (Usbeck et al., 20 2010). The future storm tracks may shift further north with the consequent possibility of increased risk of damage. 21 Boreal forests will get more vulnerable to autumn/early spring storm damage due to expected decrease in period of 22 frozen soil (Gardiner et al., 2010). Increased storm losses by 8-19% under A1B and B2 scenarios respectively is 23 projected in Western Germany for 2060-2100 compared to 1960-2000, with the highest impacts in the mountainous 24 regions (Pinto et al., 2010; Klaus et al., 2011). 25 26 [INSERT FIGURE 23-7 HERE 27 Figure 23-7: Projected fire risk in Europe for two time periods (2011–2040 and 2041–2070) based on high-28 resolution regional climate models from the ENSEMBLES project under the SRES A1B emission scenario.] 29 30 Insect and pathogen damage 31 Many opportunist fungi and insects benefit from climate change both directly, because of the survival of a greater 32 number of individuals, and indirectly, because of the changes induced in host phenology (Slippers and Wingfield, 33 2007). A development of diseases caused by thermophilous pathogens was observed in many European forests 34 (Marcais and Desprez-Loustau, 2007). In temperate zones of Continental Europe, fungi are even more problematic 35 damage agents than insects, with some species that benefit from milder winters and others that spread during 36 drought periods from south to north (Drenkhan et al., 2006; Hanso and Drenkhan, 2007). Projected increased late 37 summer warming events will favour a second generation of bark beetle in southern Scandinavia and a third 38 generation in lowland parts of central Europe (Jönsson et al., 2011). Spruce bark beetle will be able to initiate a 39 second generation in South Sweden during 50% of the years around the mid century and in 63-81% of the years at 40 the end of the century under A2, A1B and B2 scenarios (Jönsson et al., 2009). Bark beetle damages in Austrian 41 spruce forests are projected to double until 2100 assuming no adaptation measures (Seidl et al., 2009). 42 43 Forest management and land use 44 Projected shortening frost periods and thawing permafrost may strongly reduce the accessibility of forests in the 45 Boreal zone with implications for the timber supply (Keskitalo, 2008). Climate change together with socio-46 economic and technological drivers will influence future European land use leading to declines in the agricultural 47 area and increase in forested and urban areas that would potentially reduce GHG emissions and enhance carbon 48 sinks (Rounsevell and Reay, 2009). Possible response approaches to the impacts of climate change on forestry 49 include short-term and long-term strategies that focus on enhancing ecosystem resistance and resilience (Millar et 50 al., 2007). Fragmented small-scale forest ownership can constrain adaptive capacity (Lindner et al., 2010). Forest 51 management with thinning and shrub removal could decrease competition for water and increase carbon uptake. 52 (Giuggiola et al., 2010). Ongoing changes in species composition from conifers to broadleaves and increasing 53 harvest level might lower the vulnerability through reduction of share of old and vulnerable stands (Schelhaas et al., 54
SECOND-ORDER DRAFT IPCC WGII AR5 Chapter 23
Do Not Cite, Quote, or Distribute 24 28 March 2013
2010). Strategies to anticipate severe forest mortality in the future include preference of species better adapted to 1 relatively warm environmental conditions (Resco et al., 2007). The selection of tolerant or resistant families and 2 clones may also reduce the risk of damage by pests and diseases in pure stands (Jactel et al., 2009). 3 4 23.4.5. Bioenergy Production 5 6 Climate change is likely to change the distribution of key bioenergy crops. Dedicated crops for bioenergy in 7 temperate regions, including tree species grown as short rotation coppice (SRC) and intensive forestry, and C4 8 grasses such as Miscanthus and switchgrass, will respond to climate change by shifting their potential distribution 9 and altering their potential productivity and yields. The potential distribution of temperate oilseeds (e.g. oilseed rape, 10 sunflower), starch crops (e.g. potatoes), cereals (e.g. barley) and solid biofuel crops (e.g. sorghum, Miscanthus) is 11 predicted to increase in northern Europe by the 2080s, due to increasing temperatures, and decrease in southern 12 Europe due to increased drought. Mediterranean oil and solid biofuel crops, currently restricted to southern Europe, 13 are predicted to extend further north due to higher summer temperatures. Four global climate models, (HadCM3, 14 CSIRO2, PCM and CGCM2) predict that bioenergy crop production in Spain is especially vulnerable to climate 15 change, with many temperate crops predicted to decline dramatically by the 2080s. The choice of bioenergy crops in 16 southern Europe will be severely reduced in future unless measures are taken to adapt to climate change (Tuck et al., 17 2006). 18 19 The physiological responses of bioenergy crops C3Salicaceae trees and C4 grasses to rising atmospheric CO2 20 concentration would improve drought tolerance due to improved plant water use, consequently yields in temperate 21 environments may remain high in future climate scenarios (Oliver et al., 2009). A future increase in potential 22 biomass production due to elevated CO2 outweighs the increased production costs resulting in a northward extension 23 of the area where SRC is greenhouse gas neutral (i.e. it produces exactly the amount of biomass that is required to 24 have the avoided emissions compensate for the total emissions from crop management and bio-energy production). 25 However, the northward expansion of SRC would erode the European terrestrial carbon sink due to intensive 26 management and high turnover of SRC respect to conventional forest where usually harvesting is less than annual 27 growth (Liberloo et al., 2010). 28 29 30 23.4.6. Fisheries and Aquaculture 31 32 In AR4, Easterling et al. (2007) reported that the recruitment and production of marine fisheries in the North 33 Atlantic are likely to increase. Warming induces a shift of species ranges toward higher latitudes and seasonal shifts 34 in life cycle events (Daufresne et al., 2009) (see also 23.6.4). In European seas, warming causes a displacement to 35 the north and/or in depth of fish populations. These displacements of species distribution areas have a direct impact 36 on fisheries (Rosenzweig et al., 2008)(Tasker, 2008)(Cheung et al., 2009; Cheung et al., 2010). A widespread 37 reduction in body size in response to climate change in aquatic systems has been observed through long-term 38 surveys and experimental data showing a significant increase in the proportion of small-sized species and young age 39 classes and a decrease in size-at-age (Daufresne et al., 2009). In the northern North Sea, due to species 40 reorganisation (Beaugrand and Reid, 2012), a general decrease in the mean size of zooplankton over time has been 41 observed. Smaller zooplankton species may have general implications for energy transfer efficiency to higher 42 trophic levels, and for the sustainability of fisheries resources (Pitois and Fox, 2006)(Beaugrand and Kirby, 2010). 43 In British waters, the lesser sandeel (Ammodytes marinus), which is a key link in the food web, shows declining 44 recruitments since 2002 that are inversely correlated with temperature and is projected to further decline in the 45 future with a warming climate (Heath et al., 2012). In the Baltic Sea, marine-tolerant species will be disadvantaged 46 and their distributions will partially contract; conversely, habitats of freshwater species will likely expand, Although 47 some new species would be expected to immigrate because of an expected increase in sea temperature, only a few of 48 these species would be able to successfully colonize the Baltic because of its low salinity (Mackenzie et al., 2007). 49 50 Numerous studies confirm the amplification through fishing of the effects of climate change on population dynamics 51 and consequently on fisheries (Planque et al., 2010). Over the past decade, the cod stock has not been restored from 52 its previous collapse (Mieszkowska et al., 2009)(ICES, 2010). In the North Sea, the decline of cod during the 1980-53 2000 period results from the combined effects of overfishing and of an ecosystem regime shift due to climate change 54
SECOND-ORDER DRAFT IPCC WGII AR5 Chapter 23
Do Not Cite, Quote, or Distribute 25 28 March 2013
(Beaugrand and Kirby, 2010). Analyses of fish species richness over 1997-2008 of North Sea and Celtic Seas did 1 not detect the impact of fisheries (ter Hofstede et al., 2010), as the steep decline in boreal species (Henderson, 2007) 2 was compensated for by the arrival of southern (Lusitanian) species (Lenoir et al., 2011). An observed weakening of 3 the Iberian upwelling in the inner shelf has slowed down the introduction of nutrients, leading to changes in 4 phytoplankton communities that favour the proliferation of harmful algal blooms, thereby reducing the permitted 5 harvesting period for the mussel aquaculture industry. 6 7 The areal extent of some habitats that are suitable for aquaculture can be reduced by sea-level rise. In addition, 8 ocean acidification may disrupt the early developmental stages of shellfish (Callaway et al., 2012). Climate change 9 may also reinforce parasitic diseases and impose severe risks for aquatic animal health. As water temperatures 10 increase, a number of endemic diseases of both wild and farmed salmonid populations are likely to become more 11 prevalent and difficult to control and threat levels associated with exotic pathogens may rise (Marcos-Lopez et al., 12 2010). For oysters in France, toxic algae may be linked to both climate warming and direct anthropogenic stressors 13 (Buestel et al., 2009). With freshwater systems, summer heat waves boost the development of harmful 14 cyanobacterial blooms (Johnk et al., 2008). Therefore, current mitigation and water management strategies, which 15 are largely based on nutrient input and hydrologic controls, must also accommodate the environmental effects of 16 climate change (Paerl and Huisman, 2009)(Halpern et al., 2012). 17 18 In the Iberian-Atlantic fishing grounds, the biomass and profits from sardine fishery will further decrease with 19 greater intensity if the effects of global warming on the water temperature become more significant (Perez et al., 20 2010)(Garza-Gil et al., 2010). In the Bay of Biscay, a major part of the gross economic turnover associated with 21 catches of fish species would potentially not be affected by long-term changes in climate (Floc'h et al., 2008). In the 22 Portuguese coast, a commercial opportunity for fisheries could arise since most the new potential species were 23 marketable species and not many current species were lost under different climate scenarios (Vinagre et al., 2011). 24 Fishing fleets which presently target marine species (e.g. cod, herring, sprat, plaice, sole) in the Baltic may have to 25 relocate to more marine areas or switch to other species which tolerate decreasing salinities. A temporary marine 26 reserve policy in the Eastern Baltic could postpone the negative effects of climate change on fish stocks (Rockmann 27 et al., 2009). 28 29 Fishery management thresholds that trigger reductions in fishing quotas or fishery closures to conserve local 30 populations (e.g. cod, salmon) will have to be reassessed as the ecological basis on which existing thresholds have 31 been established changes, and new thresholds will have to be developed for immigrant species (Mackenzie et al., 32 2007)(Beaugrand and Reid, 2012). 33 34 Integrative assessment help examine policy options (Miller et al., 2010). Experimentation and innovation at local to 35 regional levels is critical for a transition to ecosystem-based management (Osterblom et al., 2010). Human social 36 fishing systems dealing with high variability upwelling systems with rapidly reproducing fish species may have 37 greater capacities to adjust to the additional stress of climate change than human social fishing systems focused on 38 longer-lived and generally less variable species (Perry et al., 2010; Perry et al., 2011). However, the political and 39 social implications of impacts on fisheries are hard to project. The climate-related northward movement of mackerel 40 to Icelandic waters may create economic problems for fisheries in EU and policy debates (Arnason, 2012). 41 42 43 23.5. Implications of Climate Change for Health and Social Welfare 44 45 23.5.1. Human Population Health 46 47 Climate change is likely to have a range of health effects in Europe. Further studies since AR4 have confirmed the 48 effects of heat on mortality and morbidity in European populations and particularly in older people and those with 49 chronic disease (Åström et al., 2011)(Kovats and Hajat, 2008). With respect to sub-regional vulnerability, 50 populations in southern Europe appear to be most sensitive to hot weather (Åström et al., 2013)(Baccini et al., 51 2011)(Corobov et al., 2011 (in press))(Iñiguez et al., 2010; Tobías et al., 2010), and also will experience the highest 52 heat exposures (Iñiguez et al., 2010; Tobías et al., 2010) (Figure 23-2). However, elderly populations in central 53 (Hertel et al., 2009) and northern Europe (Rocklöv and Forsberg, 2010)(Armstrong et al., 2011)(Varakina et al., 54
SECOND-ORDER DRAFT IPCC WGII AR5 Chapter 23
Do Not Cite, Quote, or Distribute 26 28 March 2013
2011) are also vulnerable to heat wave events. Adaptation measures to reduce heat health effects include heat wave 1 plans (EEA-JRC-WHO, 2008) which have been shown to reduce heat-related mortality in Italy (Schifano et al., 2 2012) and France. There is little information about how future changes in housing and infrastructure (e.g. retrofitting 3 houses, installing cool rooms in residential homes) would reduce the regional or local burden of heat-related 4 mortality. Most published risk assessments do not include consideration of adaptation (Huang et al., 2011). Further 5 work has been done to characterize heat stress as an occupational hazard (see chapter 11). 6 7 Climate change will increase the frequency and the intensity of major heat wave events (Figure 23-2), which are 8 associated with significant acute impacts on mortality and morbiditiy (Robine et al., 2008)(Solymosi et al., 2010). 9 Several studies have estimated the impact of climate scenarios on future heat-related mortality at the city level. A 10 comparison of additional mortality in 15 cities (Baccini et al., 2011) estimated highest attributable burdens in 11 Budapest and Athens (A2 emissions scenario), with least impacts in Dublin, Zurich and Ljubljana by 2030. For most 12 countries in Europe, the current burden of cold-related mortality is greater than the burden of heat mortality, 13 although few studies have quantified benefits of climate warming in terms of the reduction of cold related mortality 14 (Doyon et al., 2008). A Europe-wide assessment, estimated that increase in heat-related mortality would only exceed 15 the decrease in cold-related mortality at some point during the last third of the century assuming no adaptation, and 16 an increased variance in daily temperature distributions (Ballester et al., 2011). 17 18 Mortality and morbidity associated with flooding is becoming better understood although the surveillance of health 19 effects of disasters remains inadequate. Additional mortality due to flooding has been estimated in the Netherlands 20 due to sea level rise (Maaskant et al., 2009); and in the UK for river flooding (Hames and Vardoulakis, 2012) but 21 estimates of future mortality due to flooding are highly uncertain. There remains limited evidence regarding the long 22 term mental health impacts of flood events (Paranjothy et al., 2011)(Murray et al., 2011). 23 24 Evidence about future risks from climate change with respect to infectious diseases is still limited (Semenza et al., 25 2012)(Randolph and Rogers, 2010). There have been developments in mapping the current and potential future 26 distribution of important vectors in Europe. The Asian tiger mosquito Aedes albopictus, is an important vector of 27 dengue and other arboviruses, such as Chikungunya (Queyriaux et al., 2008). The vector is currently present in 28 many countries in southern and eastern Europe (ECDC, 2009). An assessment of the potential impact of climate 29 change indicated limited potential for eastward expansion (ECDC, 2009)(Fisher et al., 2011; Caminade et al., 2012). 30 A study in Italy projected the potential for northward shift of the vector’s distribution in that country (Roiz et al., 31 2011). For Ae. Aegypti (dengue vector that is not present in Europe), there are some areas that could potentially 32 become suitable under climate change by 2050, including the Mediterranean areas of Spain, France and Italy as well 33 as south-eastern Europe (ECDC, 2012). However, the risk of introduction of dengue remains very low because it 34 would depend upon the upon the introduction and expansion of the Ae. Aegypti together with the absence of 35 effective vector control measures (ECDC, 2012). 36 37 Visceral and cutaneous leishmaniasis are sandfly-borne diseases currently present in the Mediterranean region. A 38 comprehensive review described that climate change is unlikely to affect the distribution of these infections in the 39 near term (Ready, 2010). However, in the long term (15-20 years), there was potential for climate change to 40 facilitate the expansion of either vectors or current parasites northwards . The risk of introduction of exotic 41 Leishmania species was considered very low due to the low competence of current vectors (Fischer et al., 2010a). 42 The effect of climate warming on the risk of imported or locally-transmitted (autochthonous) malaria in Europe has 43 been assessed in Spain (Sainz-Elipe et al., 2010), France (Linard et al., 2009) and the UK (Lindsay et al., 2010). 44 Disease re-emergence would depend upon many factors including: the introduction of a large population of 45 infectious people or mosquitoes, high levels of people-vector contact, resulting from significant changes in land use, 46 as well as climate change. 47 48 Since AR4 there have been several studies and reviews that have investigated the impact of climate change on food 49 safety, at all stages from production to consumption (FAO, 2008; Jacxsens et al., 2010; Popov Janevska et al., 50 2010)(Miraglia et al., 2009). The transmission of salmonellosis (a food pathogen) is sensitive to temperature but this 51 sensivity has declined in recent years (Lake et al., 2009) and the overall incidence of salmonellosis is declining in 52 most European countries (ECDC, 2011). Climate change may also have affects on food consumption patterns (the 53 reduction in consumption of animal products would benefit methane emissions reduction). Weather affects pre and 54
SECOND-ORDER DRAFT IPCC WGII AR5 Chapter 23
Do Not Cite, Quote, or Distribute 27 28 March 2013
post harvest mycotoxin production but the implications of climate change are unclear. Cold regions may become 1 liable to temperate-zone problems concerning contamination ochratoxin A, patulin and Fusarium toxins (Paterson 2 and Lima, 2010). A control of the environment of storage facilities may avoid post-harvest problems but at 3 additional cost (Paterson and Lima, 2010). 4 5 Other potential consequences concern marine biotoxins in seafood following production of phycotoxins by harmful 6 algal blooms and the presence of pathogenic bacteria in foods following more frequent extreme weather conditions 7 (Miraglia et al., 2009). There is little evidence that climate change will affect human exposures to contaminants in 8 the soil or water (e.g. persistent organic pollutants). Risk modelling is often developed for single exposure agents 9 (e.g. a pesticide) with known routes of exposure. These are difficult to scale up to the population level. The multiple 10 mechanisms by climate may affect transmission or contamination routes also makes this very complex (Boxall et al., 11 2009). 12 13 Adaptation in the health sector has so far been largely limited to the development of heat health warning systems. A 14 survey of national infectious disease experts in Europe identified several institutional changes that needed to be 15 addressed to improve future responses to climate change risks: ongoing surveillance programs, collaboration with 16 veterinary sector and management of animal disease outbreaks, national monitoring and control of climate-sensitive 17 infectious diseases, health services during an infectious disease outbreak and diagnostic support during an epidemic 18 (Semenza et al., 2012). 19 20 21 23.5.2. Health Systems and Critical Infrastructure 22 23 Critical national infrastructure is defined as the assets (physical or electronic) that are vital to the continued delivery 24 and integrity of the essential services upon which a country relies, the loss or compromise of which would lead to 25 severe economic or social consequences or to loss of life. Extreme weather events, such as floods, heat waves and 26 wild fires are known to damage critical infrastructure. The UK floods in 2007 leds to significant damage to power 27 and water utilities, and damage to communications (including roads) responsible for 10% and 7% of the total costs, 28 respectively (Chatterton et al., 2010). Several countries have undertaken reviews of flood risks to hospitals, schools, 29 water treatment/pumping stations. In 2007, a forest fire in Greece caused the closure of a major road and access to 30 the international airport. Major storms in Sweden and Finland have led to loss of trees, with damage to the power 31 distribution network, leading to electricity blackouts lasting weeks, as well as the paralysis of services such as rail 32 transport and other public services that depend on grid electricity. 33 34 Health systems (hospitals, clinics) are also vulnerable to extreme events. The heat waves of 2003 and 2006 had 35 adverse effects on patients and staff in hospitals from overheating of buildings. Evidence from France and Italy 36 indicate that death rates in in-patients increased significantly during heat wave events (Ferron et al., 2006; Stafoggia 37 et al., 2008). Further, higher temperatures have had serious implications for the delivery of health cares, as well drug 38 storage and transport. 39 40 41 23.5.3. Social Impacts 42 43 There is little evidence regarding the implications of climate change for employment and/or livelihoods in Europe. 44 However, the evidence so far (as reviewed in this chapter) indicates that there are likely to be changes to some 45 industries (e.g. tourism, agriculture) that may lead to changes in employment opportunities by region and by sector 46 in the longer term, particularly after mid-century. 47 48 The current burden for weather disasters is high (see above). Flooding can have long lasting effects of the affected 49 populations (Schnitzler et al., 2007). Households are often displaced while their homes are repaired. A flood event 50 in the UK found that a significant proportion of persons were still displaced 12 months after the event (Whittle et al., 51 2010). Little research has been carried out on the impact of extreme weather events such as heat waves and flooding 52 on temporary or permanent displacement in Europe (EC, 2009a). Coastal erosion associated with sea level rise, 53 storm surges and coastal flooding will require coastal retreat in some of Europe’s low lying areas (Nicholls and 54
SECOND-ORDER DRAFT IPCC WGII AR5 Chapter 23
Do Not Cite, Quote, or Distribute 28 28 March 2013
Cazenave, 2010)(Philippart et al., 2011). Managed retreat is also an adaptation option in some coastal areas. 1 Concerns have been raised about equality of access to adaptation within coastal populations at risk from climate 2 change. For example, a study in the UK found that vulnerability to climate change in coastal communities is likely 3 to be increased by social deprivation (Zsamboky et al., 2011). 4 5 In the European region, the indigenous populations are present in Arctic regions are considered vulnerable to climate 6 change impacts on livelihoods and food sources (Arctic Climate Impact Assessment, 2005) [12.3.4, 28.2.4]. 7 Research has focussed on indigenous knowledge, impacts on traditional food sources and community 8 responses/adaptation (Mustonen and Mustonen, 2011a; Mustonen and Mustonen, 2011b). However, these 9 communities are also experiencing rapid social, economic and other non-climate-related environmental changes 10 (such as oil and gas exploration) [see 28.2.4]. A study of European reindeer husbandary found that socio-economic 11 factors were likely to be much more important than climate change for future sustainability (Rees et al., 2008) 12 [28.2.3.5]. 13 14 15 23.5.4. Cultural Heritage and Landscapes 16 17 Climate change will affect the built environment that is culturally valued (Storm et al., 2008) through extreme 18 events and chronic damage to materials (Brimblecombe et al., 2006; Brimblecombe and Grossi, 2010; 19 Brimblecombe, 2010a; Brimblecombe, 2010b; Grossi et al., 2011)(Sabbioni et al., 2010). Cultural heritage is a non 20 renewable resource and impacts from environmental changes are assessed over long timescales (Brimblecombe and 21 Grossi, 2008)(Grossi et al., 2008; Bonazza et al., 2009a; Bonazza et al., 2009b; Brimblecombe and Grossi, 2009; 22 Brimblecombe and Grossi, 2010). Climate change may also affect indoor environments where cultural heritage is 23 preserved (Lankester and Brimblecombe, 2010) as well as visitor behaviour at heritage sites (Grossi et al., 2010). 24 25 Surface recession on marble and compact limestone will change in response to climate change. In the 2080s, Central 26 Europe, Norway, the northern UK and Spain will experience surface recession ranging between 20 and 30 µm/y. 27 Conversely, a decrease in surface recession of about 1-4 µm/y is projected for Southern Europe, reducing risk 28 (Bonazza et al., 2009a). Marble monuments located in the Mediterranean will continue to experience high levels of 29 thermal stress (Bonazza et al., 2009b). However, frost damage will reduce across Europe because of warming, 30 except in Northern, and Alpine and permafrost areas (Iceland) (Grossi et al., 2007; Sabbioni et al., 2008). Damage 31 to porous materials due to salt crystallisation may increase all over Europe (Benavente et al., 2008; Grossi et al., 32 2011). In Northern and Eastern Europe, wood structures will need additional protection against rainwater and some 33 structures may need additional protection from high winds (Sabbioni et al., 2010). AR4 concluded that then current 34 flood defence schemes would not protect Venice from climate change. Venice now has a flood forecasting system, 35 as well as the MOSE system of flood barriers (Keskitalo, 2010) but recent evidence suggests that climate change 36 may lead to a decrease in the frequency of extreme storm surges (Troccoli et al., 2011 (in press)). 37 38 Europe has many unique rural landscapes, which reflect the cultural heritage that has evolved from centuries of 39 human intervention. Examples include, amongst others, the cork oak based Montado in Portugal, the Garrigue of 40 southern France, Alpine meadows, grouse moors in the UK; machair in Scotland, peatlands in Ireland, and 41 vineyards. Many, if not all, of these cultural landscapes are sensitive to climate change and even small changes in 42 the climate could have significant impacts on their capacity to function as they have done in the past (Gifford et al., 43 2011). Because of their cultural importance, many such landscapes are protected through rural development and 44 environmental policies. Alpine meadows, for example, are culturally important within Europe, but although there is 45 analysis of the economic (tourism, farming) and functional (water run-off, flooding, carbon sequestration) aspects of 46 these landscapes there is very little understanding of the consequences for the cultural aspects of these areas and the 47 societies who depend on them. Other European uplands, such as peat rich uplands in northern Europe have begun to 48 consider landscape management as a means of adapting to the effects of climate change (e.g. the moors for the 49 future partnership in the Peak District National Park, UK). For a discussion of the cultural implications of climate 50 change for vineyards see Box 23-1. 51 52 53
54
SECOND-ORDER DRAFT IPCC WGII AR5 Chapter 23
Do Not Cite, Quote, or Distribute 29 28 March 2013
_____ START BOX 23-1 HERE _____ 1 2 Box 23-1. Implications of Climate Change Impacts for European Wine and Vineyards 3 4 There is a significant body of research on the impacts of climate change on wine production and the cultural 5 landscapes embodied in vineyards (Metzger and Rounsevell, 2011) (White et al., 2009). Wine production in Europe 6 accounts for more than 60% of the global total (Goode, 2012) and makes an important contribution to cultural 7 identity. It is also an exemplar of how climate change can affect not only the biophysical response of plants and the 8 geographic distribution of wine grape varieties, but also consumer perceptions of wine that are associated with the 9 cultural diversity of regional production. Taken together these effects make the European wine sector highly 10 sensitive to climate change and one that is already taking climate adaptation seriously (Goode, 2012). 11 12 Apart from impacts on grapevine yield, higher temperatures are also expected to affect wine quality in some regions 13 and grape varieties by changing the ratio between sugar and acids (Bock et al., 2011)(Santos et al., 2011)(Duchêne 14 et al., 2010). In western and central Europe, projected future changes could benefit wine quality, but might also 15 demarcate new potential areas for viticulture (Malheiro et al., 2010). Adaptation measures are already occurring in 16 some vineyards (e.g. vine management, technological measures, production control and to a smaller extent 17 relocation) (Battaglini et al., 2009; Holland and Smit, 2010; Malheiro et al., 2010; Duarte Alonso and O’Neill, 2011; 18 Moriondo et al., 2011; Santos et al., 2011). 19 20 Whilst the distribution of grape suitability will change in response to climate change, relocation as an adaptation 21 option is constrained by the concept of ‘terroir’, which combines the influence of a location’s soils, climate and 22 topography with the knowledge and traditions of wine producers, into a unique expression of landscape culture 23 (Metzger and Rounsevell, 2011). Vineyards may be displaced geographically beyond their traditional boundaries, 24 and in principle, wine producers could adapt to this problem by growing grape varieties that are more suited to 25 warmer climates. Such technical solutions, however, do not account for the unique characteristics of wine 26 production cultures and consumer perceptions of wine quality that strongly affect the prices paid for the best wines 27 (Metzger and Rounsevell, 2011)(White et al., 2009). It would become very difficult, for example, to produce fine 28 wines from the cool-climate Pinot Noir grape within its traditional ‘terroir’ of Burgundy under many future climate 29 scenarios, but consumers may not be willing to pay current day prices for red wines produced from other grape 30 varieties (Metzger and Rounsevell, 2011). An additional barrier to adaptation is that wine is usually produced within 31 rigid, regionally-specific, regulatory frameworks that often prescribe, amongst other things, what grapes can be 32 grown where, e.g. the French AC or the Italian DOC and DOCG designations. Suggestions have been made to 33 replace these rigid concepts of regional identity with a geographically flexible ‘terroir’ that ties a historical or 34 constructed sense of culture to the wine maker and not to the region (White et al., 2009). 35 36 _____ END BOX 23-1 HERE _____ 37 38 39 23.6. Implications of Climate Change for the Protection of Environmental Quality and Biological 40
Conservation 41 42
Terrestrial and freshwater ecosystems provide a number of vital services for people and society, such as 43 biodiversity, food, fibre, water resources, carbon sequestration and recreation (Stoate et al., 2009). Intensively 44 managed ecosystems contribute mostly to vital provisioning services (e.g. agro-ecosystems provide food via crops 45 and livestock, and forests provide wood). The condition of the majority of services shows either a degraded or 46 mixed status across Europe with some exceptions, however, such as the recent enhancements in timber production 47 and climate regulation in forests (Harrison et al., 2010). Appropriate agricultural management practices are critical 48 to realizing the benefits of ecosystem services (Power, 2010). Table 23-2 summarises the potential implications of 49 climate change for ecosystem services in Europe. 50 51 [INSERT TABLE 23-2 HERE 52 Table 23-2: Impacts of climate change on ecosystem services.] 53 54
SECOND-ORDER DRAFT IPCC WGII AR5 Chapter 23
Do Not Cite, Quote, or Distribute 30 28 March 2013
1 23.6.1. Air Quality 2 3 Climate change will have complex and local effects on pollution chemistry, transport, emissions and deposition. 4 Outdoor air pollutants have adverse effects on human health, biodiversity, crop yields and cultural heritage. The 5 main outcomes of concern are both the average (background) levels and peak events for tropospheric ozone, 6 particulates, sulphur oxides (SOx) and nitrogen oxides (NOx). Future pollutant concentrations in Europe have been 7 assessed using atmospheric chemistry models, principally for ozone (Forkel and Knoche, 2006; Forkel and Knoche, 8 2007). Reviews have concluded that GCM/CTM studies find that climate change per se (assuming no change in 9 future emissions or other factors) is likely to increase summer tropospheric ozone levels (range 1–10 ppb) by 2050s 10 in polluted areas (that is, where concentrations of precursor nitrogen oxides are higher) (AQEP, 2007; Jacob and 11 Winner, 2009)[see also 21.4.1.3.2.]. The effect of future climate change alone on future concentrations of 12 particulates, nitrogen oxides and volatile organic compounds is much more uncertain. Climate warming also affects 13 natural emissions volatile organic compounds (VOCs) which are ozone precursors (Hartikainen et al., 2012). One 14 study has projected an increase in fire-related air pollution (O3 and PM10) in Southern Europe (Carvalho et al., 15 2011). 16 17 Overall, the model studies are inconsistent regarding future projections of background level and exceedences. 18 Recent evidence has shown adverse impacts on agriculture from even low concentrations of ozone, however, there is 19 more consistent evidence now regarding the threshold for health (mortality) impacts of ozone. Therefore, it is 20 unclear whether increases in background levels below health-related thresholds would be associated with an 21 increased burden of ill health. 22 23 Some studies have attributed an observed increase in European ozone levels to observed warming (Meleux et al., 24 2007), which appears to be driven by the increase in extreme heat events in 2003, 2006 and 2010 (Solberg et al., 25 2008). Peak ozone events were observed during the major heat waves in Europe in multiple countries. Fire events 26 have had an impact on local on air quality (Hodzic et al., 2007; Liu et al., 2009; Miranda et al., 2009). 27 28 29 23.6.2. Soil Quality 30 31 The current cost of erosion, organic matter decline, salinisation, landslides and contamination is estimated to be 32 EUR 38 billion annually for the EU25 (JRC-EEA, 2010), currently borne by society in the form of damage to 33 infrastructures due to sediment runoff and landslides, treatment of water contaminated through the soil, disposal of 34 sediments, depreciation of land around contaminated sites, increased food safety controls, and costs related to the 35 ecosystem functions of soil (JRC-EEA, 2010). 36 37 Projections show significant reductions in summer soil moisture in the Mediterranean region, and increases in the 38 north-eastern part of Europe (Calanca et al., 2006). Soil water content will decline, saturation conditions will be 39 increasingly rare and restricted to periods in winter and spring, and snow accumulation and melting will change, 40 especially in the mid-mountain areas (García-Ruiz et al., 2011). For the A2 emission scenario and a set of land use 41 scenarios in Tuscany, even with a decline in precipitation volume until 2070, in some month higher erosion rates 42 would occur due to higher rainfall erosivity (Marker et al., 2008). However, a case study on cropped systems in 43 Upper-Austria based on the A2 emission scenario (regional climate model HadRM3H) projects a small reduction in 44 average soil losses under climate change in all tillage systems, however with high uncertainty (Scholz et al., 2008). 45 For a case study hillslope in Northern Ireland, with the A2 scenario downscaled GCMs generally result in erosion 46 decreases, whereas large increases are projected when land use is changed from the current cover of grass to an 47 arable crop which requires annual tillage (Mullan et al., 2012). For scenario period 2071-2100, climate-change-48 induced changes in suspended sediment transport would increase for two Danish river catchments by 17 and 27% in 49 alluvial and non-alluvial rivers, respectively, for steady-state land use scenarios (Thodsen, 2007; Thodsen et al., 50 2008). 51 52 Under a business as usual land management scenario, taking into account the impacts of climate change on net 53 primary productivity, a comparison of three soil models forced by climate scenarios derived from the HadCM3 54
SECOND-ORDER DRAFT IPCC WGII AR5 Chapter 23
Do Not Cite, Quote, or Distribute 31 28 March 2013
climate model indicate a 10 % decline by 2070 in the organic carbon stocks of mineral soils for the croplands of 1 European Russia and the Ukraine. Part of this decline could be mitigated by an environmentally sustainable 2 management scenario (Smith, 2007). For EU25 plus Switzerland and Norway, projections under the A2 scenario for 3 1990 to 2080 of mineral soil organic carbon stocks in cropland and grassland soils show a small increase in soil 4 carbon on a per area basis under future climate (+1 to +8%) for cropland and (+3 to +6%) for grassland (Smith J. et 5 al., 2005.). Similar values of soil organic C stock increase were simulated by a pasture model under the A1B climate 6 scenario for two French grassland sites (Graux et al., 2012). In these studies, soil carbon decline was faster in 7 regions experiencing rapid warming combined with high soil moisture (e.g. Northern Europe), than in regions 8 exposed to increased drought incidence (e.g. Southern Europe).Climate change may affect the distribution and 9 degradation of organic pollutants, including persistent organic pollutants (Valle et al., 2007). 10 11 Adaptive land-use management has a large potential for climate change response strategies concerning soil 12 protection. In central Europe, compared to unsustainably high soil losses for conventional tillage, conservation 13 tillage systems reduced modelled soil erosion rates under future climate scenarios by between 49 and 87% (Scholz et 14 al., 2008). Preserving upland vegetation cover is a win-win management strategy that will reduce erosion and loss of 15 soil carbon, and protect a variety of services such as the continued delivery of a high quality water resource (House 16 et al., 2011)(McHugh, 2007). By absorbing up to twenty times its weight in water, increased soil organic matter can 17 contribute to reduce risks of flooding. Maintaining water retention capacity is thus important, e.g. through adaptation 18 measures (Post et al., 2008). Soil conservation methods like zero tillage and conversion of arable to grasslands 19 would maintain their protective effect on soil resources, independent of the climate scenario according to an up-20 scaling and modelling approach in SW-Germany that considered, however, in limited way climate-induced changes 21 in the frequency and intensity of heavy rainstorms (Klik and Eitzinger, 2010). 22 23 24 23.6.3. Water Quality 25 26 Climate change may affect water quality in several ways, with implications for food production and forestry (see 27 above 23.4.3), ecosystem functioning (Table 23-2), human and animal health, and compliance with European and 28 national quality targets including those of the Water Framework Directive. Overall, because of the high heat 29 capacity of water, shallow waters will witness a more rapid temperature increase and a parallel decrease in 30 saturating oxygen concentrations. Since AR4, there is further evidence of adverse effects caused by short-term 31 weather events: reductions in dissolved oxygen, algal blooms (Ulén and Weyhenmeyer, 2007)(Mooij et al., 2008) 32 during hot weather, and contamination of surface and coastal waters with sewage and/or chemicals (pesticides) after 33 rainfall (Boxall et al., 2009). A reduction in rainfall may lead to low flows which increase concentrations of 34 biological and chemical contaminants. Reduced drainage can also enhance sedimentation in drainage systems and 35 hence enhance particle-bound P-retention and reduce P-load to downstream higher order streams (Hellmann and 36 Vermaat, 2012). 37 38 Future impacts of climate change on water quality include increased nutrient fluxes (Delpla et al., 2011); impacts 39 from increased water temperature and discharge reduction in the Seine river (Ducharne, 2008) and increased nutrient 40 loads in Danish watersheds (Andersen et al., 2006); increased summer temperature and drought leading to more 41 favourable conditions for algal blooms and reduced dilution capacity of effluent in the Meuse river (van Vliet and 42 Zwolsman, 2008). Several studies have investigated potential adverse impacts on nutrient flushing episodes and 43 surface water quality in the UK (Whitehead et al., 2006; Whitehead et al., 2009)(Wilby et al., 2006; Howden et al., 44 2010; Macleod et al., 2012)(See also AR5 WG2 Chapter 4.3.2.5). A modelling study on projected future water 45 quality impacts for all EU27 countries indicated increased nutrient loadings in Northern Europe due to increased 46 surface runoff in Southern Europe due to increased evapotranspiration (Jeppesen et al., 2011). 47 48 49
50
SECOND-ORDER DRAFT IPCC WGII AR5 Chapter 23
Do Not Cite, Quote, or Distribute 32 28 March 2013
23.6.4. Terrestrial and Freshwater Ecosystems 1 2 Habitats 3 4 Current and future climate changes have negative effects of habitat loss on species density and diversity (Mantyka-5 pringle et al., 2012). Potential habitat shrinkage is occurring even when CO2 physiological effects and water 6 availability are taken into account (Rickebusch et al., 2008). 7 8 Projected habitat loss is greater for species at higher elevations where, up to 36–55% of alpine plant species, 31–9 51% of subalpine plant species and 19–46% of montane plant species will lose more than 80% of their suitable 10 habitat by 2070–2100 under B1and A1FI scenarios respectively (Engler et al., 2011). Habitats of 150 alpine plant 11 species on European Alps will suffer an average range size reduction of 44-50% and on average 40% of the range 12 still occupied at the end of the century will be climatically unsuitable creating an extinction debt (Dullinger et al., 13 2012). Suitable climatic conditions for Europe's breeding birds are projected to shift nearly 550 km northeast by the 14 end of the century (Huntley et al., 2007). In Great Britain mean altitude of the uplands is projected to increase for 15 both B1 and A1FI scenarios by 2071–2100 with important implications on habitats, with in the eastern and southern 16 regions low altitude areas (< 300 meters) being the most vulnerable (Clark et al., 2010a). 17 18 In respect to the baseline distribution (1961-1990), British blanket peat and sub-arctic palsa mires, will reduce 19 substantially suitable area by the period 2030-2049 under A1B and A2 emission scenarios (Fronzek et al., 2006; 20 Fronzek et al., 2010; Gallego-Sala et al., 2010; Clark et al., 2010b; Fronzek et al., 2011). Also changes in low flows 21 result in reduction of fen and bog areas becoming marginal or unsuitable due to dryness (Harrison et al., 2008). 22 Across most of central, eastern and southern Europe, reduced hydro periods (the length of time and portion of year 23 the wetland holds ponded water) and increased temperatures with parallel reduced oxygen in shallow waters and 24 wetlands will have profound impacts on aquatic habitats and habitat connectivity in river networks may become 25 increasingly fragmented (Elzinga et al., 2007; Della Bella et al., 2008; Blaustein et al., 2010; Gómez-Rodríguez et 26 al., 2010; Hartel et al., 2011; Morán-López et al., 2012; Morán-López et al., 2012). 27 28 Despite some local successes and increasing responses (including extent and biodiversity coverage of protected 29 areas, sustainable forest management, policy responses to invasive alien species, and biodiversity-related aid), the 30 rate of biodiversity loss does not appear to be slowing (Butchart et al., 2010). Protected areas play a key role for 31 conservation of biodiversity under climate change compared to unprotected areas, although by 2080, 58 ± 2.6% of 32 the species would lose suitable climate in protected areas. Natura 2000 areas will be not effective or more impacted 33 than unprotected areas, under A1FI, A2, B1, B2 scenarios (Araújo et al., 2011). Similar concerns about effectiveness 34 of protected areas are found for butterflies in Germany (Filz et al., 2012). It has been highlighted the importance of 35 taking into account the climate change projections on the selection of conservation areas (Araújo et al., 2011; Filz et 36 al., 2012; Virkkala et al., 2013). 37 38 39 Plant species 40 41 Observed changes in plant communities in European mountainous regions show a shift of species’ ranges to higher 42 altitudes due to climate warming (Pauli et al., 2012) resulting in species richness increase in boreal-temperate 43 mountain regions (+3.9 species on average) and decrease in Mediterranean mountain regions (–1.4 species) in 2001-44 2008 (Pauli et al., 2012). Decline of the more cold adapted species and increase of the more warm-adapted has been 45 observed, suggesting a progressive decline of cold mountain habitats and their biota (Gottfried et al., 2012). The 46 pollen season starts on average 10 days earlier than 50 years ago, an advance of 2.5 days per decade of spring and 47 summer (Feehan et al., 2009). 48 49 The most dramatic changes for plant species could occur in Northern Europe, where more than 35% of the species 50 composition in 2100 could be new, and in Southern Europe, where up to 25% of the species now present would 51 disappear (Alkemade et al., 2011). Large range contractions up to 72% in 2080 due to climate change is projected 52 for temperate tree species in European lowlands under A2 scenario (Casalegno et al., 2007). The increase in climatic 53 aridity may compromise the survival of several populations of Pinus sylvestris in the Mediterranean basin 54
SECOND-ORDER DRAFT IPCC WGII AR5 Chapter 23
Do Not Cite, Quote, or Distribute 33 28 March 2013
(Giuggiola et al., 2010) while for the dominant Mediterranean tree species, Holm oak, a substantial range expansion 1 is projected under A1B emissions scenario (Cheaib et al., 2012). The scattered distributions of tree species, 2 exacerbated in many cases by human activity, may make them more vulnerable to climate change because they 3 probably have less ability to reproduce or adapt to shifting climate space than more widespread species (del Barrio 4 et al., 2006; Hemery et al., 2010). By 2100, in southern Europe a great reduction in phylogenetic diversity of plant, 5 bird and mammal assemblages will occur, and gains are expected in regions of high latitude or altitude for 2020, 6 2050 and 2080. However, losses will not be offset by gains and a trend towards homogenization across the continent 7 will be observed (Thuiller et al., 2011). 8 9 10 Animal species 11 12 Breeding seasons are lengthening, allowing extra generations of temperature-sensitive insects such as butterflies, 13 dragonflies and pest species to be produced during the year (Feehan et al., 2009). Climate change is altering the 14 timing of spring migration of several bird species with species-specific response (Jonzén et al., 2006; Rubolini et al., 15 2007a; Rubolini et al., 2007b). Climate change, together with land-use change, is likely to cause impacts on the 16 abundance of birds of different breeding habitat, latitudinal distribution, and migratory behaviour, particularly on 17 distance migrants (Jonzén et al., 2006). Farmland birds and long-distance migrant species in Germany, Switzerland, 18 and Austria declined whereas wetland bird species with southerly ranges increased in abundance (Lemoine et al., 19 2007a; Lemoine et al., 2007b). A northward shift in bird community composition has been observed (Devictor et al., 20 2008) even if common species of European birds with the lowest thermal maxima showed the sharpest declines 21 between 1980 and 2005(Jiguet et al., 2010). Northern European species of butterflies appeared to be the most 22 vulnerable in Europe (Heikkinen et al., 2010). However, there is much species-to-species variation with 23 individualistic response to climate change leading to the formation of new future non-analogous communities with 24 species composition unlike any found today (Keith et al., 2009). 25 26 Projections for 120 native terrestrial non-volant European mammals suggest that up to 5-9% are at risk extinction 27 during the 21st century, while 32-46% or 70-78% may be severely threatened under A1 and B2 climatic scenarios 28 (Levinsky et al., 2007). Climate cooling would be more deleterious for the persistence of amphibian and reptile 29 species than warming, even if decreases in the availability of water will be also problematic (Araújo et al., 2006). 30 Changes in temperature and precipitation will result in both changes in migratory species and adaptation of 31 migratory activity (Schaefer et al., 2008). Furthermore phenotype adaptation may allow species to persist in situ, 32 conserving community composition (Schaefer et al., 2008). However, populations not showing a phenological 33 response to climate change fail to adjust to climate change and may decline (Molnar et al., 2008) or causing 34 ecological mismatches (Saino et al., 2011). Climate change can affect trophic interactions, as co-occurring species 35 do not necessarily react in a similar manner to global change (Schweiger et al., 2012). Novel emergent ecosystems 36 composed of new species assemblages arising from differential rates of range shifts of species can occur (Montoya 37 and Raffaelli, 2010). 38 39 40 Invasive species 41 42 Climate change can exacerbate the threat posed by invasive species to biodiversity, both by direct and indirect 43 effects such as changes to farm practices and introductions of exotic material and effects of other environment 44 changes such as elevated CO2 concentration and change in temperature and precipitation (West et al., 2012). The 45 western corn rootworm (maize pest in North America) has invaded Europe in recent years (Aragòn and Lobo, 2012). 46 The 22.2% of the total number of mammal species in Europe are alien species (Genovesi et al., 2012). Planktonic 47 species typically encountered in tropical areas were observed in natural shallow lakes in the southwest of France 48 during 2006 and 2007 possibly as a result of minimum temperatures increases registered over the last 30 years and 49 could have played a key role in algal survival through winter (Cellamare et al., 2010). The woody shrub Lantana 50 (Lantana camara L.) that is highly invasive in many countries of the world may become climatically suitable under 51 future climates in Europe (Taylor et al., 2012). Climate scenarios of milder conditions for Atlantic Europe could 52 lead to Giant rhubarb (Gunnera tinctoria (Molina) Mirbel.) and Brazilian giant rhubarb (Gunnera manicata L.) 53 becoming more widely invasive (Skeffington and Hall, 2011). However the threat posed by invasive species to 54
SECOND-ORDER DRAFT IPCC WGII AR5 Chapter 23
Do Not Cite, Quote, or Distribute 34 28 March 2013
biodiversity should be carefully considered as some studies demonstrate that fewer than 15% of species have more 1 than 10% of their invaded distribution outside their native climatic niche (Petitpierre et al., 2012). 2 3 4 23.6.5. Coastal and Marine Ecosystems 5 6 Climate change will affect Europe’s coastal and marine ecosystems, altering the biodiversity, functional dynamics 7 and ecosystem services of coastal wetlands, dunes, inter-tidal and subtidal habitats, offshore shelves, seamounts and 8 currents (Halpern et al., 2008) with changes in eutrophication, invasive species, species range shifts, changes in fish 9 stocks and habitat loss (Doney et al., 2011)(EEA, 2010e). The degree to which these changes will impact Europe’s 10 coasts and seas will vary temporally and spatially, requiring a range of adaptation strategies, targeting different 11 policy scales, audiences and instruments (Philippart et al., 2011)(Airoldi and Bec, 2007). 12 13 Europe’s northern seas are experiencing greater increases in sea surface temperatures (SSTs) than the southern seas, 14 with the Baltic, North and Black seas warming at 2-4 times the mean global rate (Philippart et al., 2011)(Belkin, 15 2009). In the Baltic, decreased sea ice will lead to more exposed coastal areas and storms, changing the coastal 16 geomorphology (BACC, 2008)(HELCOM, 2007). Warming SSTs will continue to influence biodiversity and drive 17 changes in depth and latitudinal range for intertidal and sub-tidal marine communities, particularly in the North and 18 Celtic seas (Hawkins et al., 2011)(Sorte et al., 2010)(Wethey et al., 2011). 19 20 Warming is affecting food chains and varying rates of phenologies (Durant et al., 2007), for example the 21 reorganization in the timing and location of phytoplankton and zooplankton affects prey availability for North Sea 22 cod (Beaugrand et al., 2010)(Beaugrand and Kirby, 2010). Temperature-driven changes have affected the 23 distribution of fisheries in all seas within the past 30 years, e.g., a decrease in the range of Atlantic cod in northern 24 seas, while an increase in the abundance of coastal species such as the anchovy in subtropical regions. The range of 25 the red mullet is increasing in extent from Norway to the northwest of Africa including the Mediterranean and Black 26 Sea. In the Bay of Biscay, responses to climate change in 20 species of flatfish from 1987 to 2006 show that 27 expanding species have a lower latitude range, than the declining species (Hermant et al., 2010). 28 29 Warmer waters are also linked to invasive species which displace native species, further altering trophic dynamics, 30 and productivity of coastal marine ecosystems, requiring a redefinition of invasive and native species (Molnar et al., 31 2008)(Rahel and Olden, 2008). Changes in the semi-enclosed seas will be indicative of future conditions in other 32 coastal-marine ecosystems (Lejeusne et al., 2009). In the Mediterranean, a relatively high proportion of endemic 33 species has been associated with the arrival of alien species at the rate of one introduction every 4 or 5 weeks in 34 recent years (Streftaris et al., 2005). While in the Mediterranean the endemic species distribution remained stable, 35 most non-native species have spread northward by an average of 300 km since the 1980s, resulting in an area of 36 spatial overlap with invasive species replacing natives by nearly 25% in 20 years (Beaugrand and Kirby, 2010). 37 38 Other future impacts of climate change in Europe’s coastal-marine ecosystems include changes in circulation and 39 nutrients in both open and semi-enclosed seas and coastal areas. Stratification of open seas will be primarily affected 40 by the timing and strength of wind, whereas coastal areas will be vulnerable to storm surges (Philippart et al., 2011). 41 Freshwater input from melting of land-based ice has increased since the 1960s with a 10-30% increase from riverine 42 input anticipated by 2100. Freshening of marine salinity is expected in upcoming decades throughout the North East 43 Atlantic, with the Arctic freshening during the 21st century due to river run off, ice melt, and increases in the rate of 44 the global water cycle. Drier summers along Biscay and Iberian coasts may lead to a decrease in nutrient input and 45 enrichment with less runoff. Eutrophication will continue as a major issue in the Baltic (HELCOM, 2009). Yet, 46 wetter winters and summers in the Arctic and North Sea may lead to higher nutrient input (OSPAR, 2010). 47 Eutrophication and deteriorating marine water quality will lead to fewer fish, more jelly fish and more frequent algal 48 blooms particularly in the semi-enclosed seas such as the Baltic (HELCOM, 2009). Before the end of 2100, surface 49 waters of the Baltic Sea could inhibit calcium forming species, more so than the Black and Mediterranean Seas 50 (CIESM, 2008). 51 52 Dune systems will be lost due to coastal erosion from combined storm surge and sea level rise in some places, 53 requiring restoration and economic measures (Day et al., 2008)(Ciscar et al., 2011)(Magnan et al., 2009). In the 54
SECOND-ORDER DRAFT IPCC WGII AR5 Chapter 23
Do Not Cite, Quote, or Distribute 35 28 March 2013
North Sea, the Iberian coast, and Bay of Biscay, a combination of coastal erosion, infrastructure and sea defences 1 may lead to narrower coastal zones (“coastal squeeze”) (EEA, 2010e)(Jackson and McIlvenny, 2011)(OSPAR, 2 2010). 3 4 5 23.7. Cross-Sectoral Adaptation Decision-making and Risk Management 6 7 Most scientific studies on impacts and adaptation in Europe consider single sectors or outcomes, and have been 8 discussed in previous sections of this chapter. For decision-making, more comprehensive and multi-sectoral 9 approaches are required. 10 11 Since AR4, considerable progress has been made to advance planning and implementation of adaptation measures as 12 well as the costing of adaptation (Section 23.7.6). Many European countries have now developed a series of national 13 studies and strategies to address adaptation (see Box 23-2). The European Union has started a process of adaptation 14 planning, focussing on information sharing (e.g. through the Climate Adaptation platform) as well as proposals for 15 legislation following up on the White Paper on Adaptation (Dreyfus and Patt, 2012) and the EU Adaptation Strategy 16 (to be published in March 2013). 17 18 _____ START BOX 23-2 HERE _____ 19 20 Box 23-2. National and Local Adaptation Strategies 21 22 Several studies have evaluated national or local adaptation strategies with respect to implementation (Biesbroek et 23 al., 2010). Many adaptation strategies were found to be agendas for further research, awareness raising and/or 24 coordination and communication for implementation (e.g. (Pfenniger et al., 2010)(Dumollard and Leseur, 2011). 25 Actual implementation often relates to natural hazard prevention, environmental protection, coastal zone and water 26 resources management. The implementation of planned adaptation at the national level was attributed to political 27 will and good financial and information capacity (Westerhoff et al., 2011)(Biesbroek et al., 2010)(Swart et al., 28 2009) found for seven national adaptation strategies that while there is a high political commitment to adaptation 29 planning and implementation, evaluation of the strategies and actual implementation is yet to be defined. One of the 30 earliest national adaptation strategies (Finland) has been evaluated, in order to compare identified adaptation 31 measures with those launched in different sectors. It has found that while good progress has been made on research 32 and identification of options, few measures have been implemented except in the water resources sector (Ministry of 33 Agriculture and Forestry, 2009). 34 35 At the local government level, adaptation plans are being developed in several cities, including London (GLA, 36 2010), Madrid, Manchester, Copenhagen, Helsinki, and Rotterdam. Adaptation in general is a low priority for many 37 European cities, and many plans do not have adaptation priority as the main focus (Carter, 2011). Many studies are 38 covering sectors sensitive to climate variability, as well as sectors that are currently under pressure from 39 socioeconomic development. A recent assessment found a lack cross-sector impact and adaptation linkages as an 40 important weakness in the city plans (Hunt and Watkiss, 2011). Flexibility in adaptation decision making needs to 41 be maintained (Hallegatte et al., 2008)(Biesbroek et al., 2010). 42 43 _____ END BOX 23-2 HERE _____ 44 45 46 23.7.1. Coastal Zone Management 47 48 Coastal zone management and coastal protection plans that integrate adaptation concerns are now implemented. 49 Underlying scientific studies increasingly assess effectiveness and costs of options (Hilpert et al., 2007)(Kabat et al., 50 2009)(Dawson et al., 2011) (see also section 23.7.6). Measures to mainstream adaptation into sectoral policies need 51 to provide early response measures for floods and coastal erosion, and ensure that climate change considerations are 52 incorporated into marine strategies with mechanisms for regular updating (OSPAR, 2010; UNEP, 2010). 53 54
SECOND-ORDER DRAFT IPCC WGII AR5 Chapter 23
Do Not Cite, Quote, or Distribute 36 28 March 2013
In the Dutch plan for coastal protection (Delta Committee, 2008), adaptation to climate change, increasing river 1 runoff and sea level rise plays a prominent role. It also includes synergies with nature conservation, increasing 2 storage for water supply (Kabat et al., 2009), and links to urban renovation. Its cost estimates are included in Section 3 23.7.6. While that plan mostly relies on large scale measures, new approaches such as small-scale containment of 4 flood risks through increasing compartimentalisation are also studied (Klijn et al., 2009). The UK government has 5 developed extensive adaptation plans (TE2100) to adjust and improve flood defences for the protection the Thames 6 Estuary and London from future storm surges and flooding (Environmental Agency, 2009). An elaborate analysis 7 has provided insight in the pathways for different adaptation options and decisions that depend on the eventual sea-8 level rise. 9 10 11 23.7.2. Integrated Water Resource Management 12 13 Water resources management has experienced a general shift from “hard” to “soft” measures which allow more 14 flexible responses to environmental change (Pahl-Wostl, 2007). Integrated water resource management explicitly 15 includes the consideration of environmental and social impacts (Wiering and Arts, 2006). Climate change has been 16 incorporated into water resources planning in England and Wales (Arnell, 2011)(Charlton and Arnell, 2011)(Wade 17 et al., 2012) and in the Netherlands (de Graaff et al., 2009). The robustness of adaptation strategies for water 18 management in Europe has been tested in England (Dessai and Hulme, 2007) and Denmark (Haasnoot et al., 2012; 19 Refsgaard et al., 2013). Other studies have emphasised the search for robust pathways, for instance in the 20 Netherlands (Kwadijk et al., 2010; Haasnoot et al., 2012). Public participation has also increased in decision 21 making, e.g. river basin management planning (Huntjens et al., 2010), flood defence plans (e.g. TE2100), and 22 drought contingency plans (Iglesias et al., 2007). Guidance has been developed on the inclusion of adaptation in 23 water management (UNECE, 2009) and river basin management plans (EC, 2009b). A study of policymakers, 24 including local basin managers, identified several important barriers to the implementation of adaptation strategies 25 in the water sector (Brouwer et al., 2013). 26 27 28 23.7.3. Disaster Risk Reduction and Risk Management 29 30 A series of approaches to disaster risk management are employed in Europe, in response to national and European 31 policy developments to assess and reduce natural hazard risks. New developments since the AR4 include assessment 32 and protection efforts in accordance with the EU Floods Directive (European Parliament and Council, 2007), the 33 mapping of flood risks, as well as other proposals to reduce impacts from natural hazards and improve civil 34 protection response. But most countries have so far focussed on hazard assessment and less on analysis of possible 35 impacts (de Moel et al., 2009). The effectiveness has been assessed of flood protection (Bouwer et al., 2010) and 36 also non-structural or household level measures to reduce losses from river flooding (Botzen et al., 2010a) (Dawson 37 et al., 2011). Some studies show that current plans may be insufficient to cope with increasing risks from climate 38 change, as shown for instance for the Rhine river basin (Te Linde et al., 2010a; Te Linde et al., 2010b). 39 40 Other options that are being explored are the reduction of consequences, responsive measures, as well as other 41 options for insuring and transferring losses (see SREX report; and Section 23.3.7). The Netherlands carried out a 42 large-scale analysis and simulation exercise to study the possible emergency and evacuation response for a worst-43 case flood event (ten Brinke et al., 2010). Increasing attention is also being paid in Europe to non-government 44 actions that can reduce possible impacts from extreme events. Terpstra and Gutteling (2008) found through a survey 45 that individual citizens are willing to assume some responsibility for managing flood risk, and they are willing to 46 contribute to preparations in order to reduce impacts. Survey evidence is available for Germany and the Netherlands 47 that, under certain conditions, individuals can be encouraged to adopt loss prevention measures (Thieken et al., 48 2006)(Botzen et al., 2009). Small businesses can reduce risks when informed about possibilities immediately after 49 an event (Wedawatta and Ingirige, 2012). 50 51 52
53
SECOND-ORDER DRAFT IPCC WGII AR5 Chapter 23
Do Not Cite, Quote, or Distribute 37 28 March 2013
23.7.4. Land Use Planning 1 2 Through effects on land use and the spatial configurations of cities, spatial planning policies can build resilience to 3 the impacts of climate change (Bulkeley, 2010). However, the integration of adaptation considerations into spatial 4 planning is limited to a general level of policy formulation that lacks concrete instruments and measures for 5 implementation in practice (Mickwitz et al., 2009)(Swart et al., 2009). There is evidence to suggest a systematic 6 failure of planning policy to account for climate and other environmental changes (Branquart et al., 2008) and a lack 7 of institutional frameworks in support of adaptation is a major barrier to the governance of adaptation through 8 spatial planning (ESPACE, 2007). In many countries, climate change adaptation is treated primarily as a water 9 management or flooding issue, which omits other important aspects of adaptation leading to partial solutions 10 (Mickwitz et al., 2009)(Wilson, 2006)(Van Nieuwaal et al., 2009). For example, in the UK, surveys of local 11 authorities found an overall increase in the area covered by buildings in areas at risk from flooding compared with 12 change across the locality as a whole (2001-2011) (ARUP, 2011). 13 14 City governance is also dominated by the issues of climate mitigation and energy consumption rather than assisting 15 cities in adapting to climate change through spatial planning (Bulkeley, 2010). Some cities, e.g. Rotterdam, have 16 started to create climate adaptation plans and this process tends to be driven by the strong political leadership of 17 mayors (Sanchez-Rodriguez, 2009). The Helsinki Metropolitan Area’s Climate Change Adaptation Strategy (HSY, 18 2010) is a regional approach focusing on the built urban environment in the cities of Helsinki, Espoo, Vantaa and 19 Kauniainen, and their surroundings with approximately 1.2 million inhabitants (ca. 20% of the Finnish population). 20 It includes approaches for dealing with increasing heat waves, more drought periods, milder winters, increasing 21 (winter) precipitation, heavy rainfall events, river floods, storm surges, drainage water floods and sea level rise. 22 23 Green infrastructure provides climate adaptation and mitigation benefits as well as offering a range of other benefits 24 to urban areas, including health improvements, better amenity value, inward investment, increasing property values 25 and the reduction of noise and air pollution. Thus green infrastructure is an attractive climate adaptation strategy 26 since it simultaneously contributes to the sustainable development of urban areas (Gill et al., 2007; James et al., 27 2009). Urban green space and green roofs can moderate temperature and decrease surface rainwater run-off (Gill et 28 al., 2007). Despite the benefits however of urban green space, conflict can occur between the use of land for green 29 space and building developments (Wilson, 2008). 30 31 European policies for biodiversity (e.g. the European Biodiversity Strategy (EC, 2011)) look to spatial planning to 32 help protect and safeguard internationally and nationally designated sites, networks and species, as well as locally 33 valued sites in urban and non-urban areas, and to create new opportunities for biodiversity through the development 34 process (Wilson, 2008). Conservation planning in response to climate change impacts on species will involve 35 several strategies that better manage isolated habitats, increase colonisation capacity of new climate zones and 36 optimise conservation networks to establish climate refugia (Vos et al., 2008). 37 38 39 23.7.5. Rural Development 40 41 Rural development is one of the key policy areas for Europe, yet there is little or no discussion about the role of 42 climate change in affecting future rural development. The EU White Paper on adapting to climate change (EC, 43 2009a) encourages Member States to embed climate change adaptation into the three strands of rural development 44 aimed at improving competitiveness, the environment, and the quality of life in rural areas. It appears however that 45 little progress has been made in achieving these objectives. 46 47 The EUs Leader programme was designed to help rural actors improve the long-term potential of their local areas by 48 encouraging the implementation of sustainable development strategies. A significant number of Leader projects 49 address climate change adaptation, but only as a secondary or in many cases a non-intentional by-product of the 50 primary rural development goals. The World Bank’s community adaptation project has seen a preponderance of 51 proposals from rural areas in Eastern Europe and Central Asia (Heltberg et al., 2012) suggesting that adaptation 52 based development needs in Eastern Europe are currently not being met by policy. 53 54
SECOND-ORDER DRAFT IPCC WGII AR5 Chapter 23
Do Not Cite, Quote, or Distribute 38 28 March 2013
1 23.7.6. Economic Assessments of Adaptation 2 3 Compared to studies assessed in AR4 (AR4 WG2, Chapter 17.2.3), costs estimates for Europe are increasingly 4 derived from bottom-up and sector-specific studies, aimed at costing response measures (Watkiss and Hunt, 2010), 5 in addition to the economy-wide assessments (Aaheim et al., 2012). The evidence base, however, is still fragmented 6 and incomplete. The coverage of adaptation costs and benefit estimates is dominated by structural (physical) 7 protection measures, where effectiveness and cost components can be more easily identified. For energy, 8 agriculture, infrastructure there is medium coverage of cost and benefit categories. For other sectors, such as health 9 and welfare, estimates are generally lacking. Table 23-3 summarises some of the more comprehensive cost estimates 10 for Europe for sectors at regional and national level. It is stressed that the costing studies use a range of methods and 11 metrics and relate to different time periods and sectors, which renders robust comparison difficult. As an example, 12 the large differences in the cost estimates between coastal and river protection in Europe and the Netherlands (Table 13 23-3) are due to the objectives for adaptation and the large differences in the level of acceptable risk: e.g. Rojas et 14 al. (2012) assess a 1 in 100 year level of protection for Europe, while the Netherlands has set standards up to 1 in 15 4,000 and 10,000 year level return periods. More detailed treatment of the economics of adaptation is provided in 16 AR5 WG2 Chapter 17. 17 18 [INSERT TABLE 23-3 HERE 19 Table 23-3: Adaptation cost estimates for European countries.] 20 21 22 23.8. Co-Benefits and Unintended Consequences of Adaptation and Mitigation 23 24 The impacts of and responses to climate change cannot be considered in isolation. Scientific evidence for decision 25 making is more useful if impacts are considered in the context of impacts on other sectors and in relation to 26 adaptation, mitigation and other important policies (Mokrech et al., 2012). The benefits of adaptation and mitigation 27 policies can be felt in the near term and in the local population, although benefits relating to greenhouse gas 28 emissions reduction may not be apparent until the longer term (Zylicz, 2010). The benefits of adaptation measures 29 are often assessed using conventional economic analyses, some of which include non-markets costs and benefits 30 (externalities)(Watkiss and Hunt, 2010). This section will describe policies, strategies and measures where there is 31 good evidence regarding mitigation/adaptation costs and benefits. Few studies have quantified directly the trade-32 offs/synergies for a given policy. 33 34 35 23.8.1. Production and Infrastructure 36 37 Mitigation policy (decarbonisation strategies) is likely to have important implications for dwellings across Europe. 38 The unintended consequences of mitigation in the housing sector include: changes to household energy prices and 39 adverse effects from decreased ventilation in dwellings (Davies and Oreszczyn, 2012). Energy efficiency 40 interventions may effect indoor summer temperatures, some acting to reduce temperatures and others acting to 41 increase temperatures (Mavrogianni et al., 2012) and on the concentration of indoor pollutants (Shrubsole et al., 42 2012). The effect of mitigation measures such as electrical equipment improvements is more complicated; a 43 simulation of a typical UK office indicated that the reduction of internal heat gains as a result of more energy 44 efficient PCs, low energy LCD display technology, improved power management and energy efficient lighting can 45 reduce the peak cooling requirement by up to 27% even under a 2030 warming climate, i.e. +1 oC compared to 2005 46 (Jenkins et al., 2008; Jenkins, 2009). However, as space heating requirements would also increase following these 47 interventions, the location, type and dominant energy use of the building will determine its overall energy gain or 48 loss to maintain comfort levels. 49 50 Adaptation measures such as the use of cooling devices will probably increase a building’s energy consumption if 51 no other mitigation measures are applied. There have been few studies on the future demand for energy-intensive 52 space cooling in Europe, although the majority of energy modelling studies assume increased uptake driven by 53
SECOND-ORDER DRAFT IPCC WGII AR5 Chapter 23
Do Not Cite, Quote, or Distribute 39 28 March 2013
climate and non-climate factors (see chapter 10). The potential for cooling dwellings without increased energy 1 consumption, and with health benefits is large (Wilkinson et al., 2009). 2 3 When looking at the broader context of urban infrastructures, despite existing efforts to include both adaptation, and 4 mitigation into sustainable development strategies at city level (e.g. Hague, Rotterdam, Hamburg, Madrid, London, 5 Manchester), priority on adaptation still remains low (Carter, 2011). There is potential to develop strategies that can 6 address both mitigation and adaptation solutions, as well as have health and environmental benefits (Milner et al., 7 2012). In energy supply, the adverse effect of climate change on water resources in some coastal regions in southern 8 Europe may further enhance the development of desalination plants as an adaptation measure, consequently 9 increasing energy consumption and thus greenhouse gases emissions. 10 11 In tourism, adaptation and mitigation may be antagonistic, as in the case of artificial snowmaking in European skiing 12 resorts which requires significant amounts of energy and water (OECD, 2007; Rixen et al., 2011) and the case of 13 desalination for potable water production which also requires energy. However, depending on the location and size 14 of the resort, implications are expected to differ and thus need to be investigated on a case-by-case basis. A similar 15 relationship between adaptation and mitigation may hold for tourist settlements in southern Europe, where expected 16 temperature increases during the summer may require increased cooling in order to maintain tourist comfort and 17 thus increase greenhouse gas emissions and operating costs. Furthermore, a change of tourist flows as a result of 18 tourists adapting to climate change may affect transport emissions, while mitigation in transport could also lead to a 19 change in transport prices and thus possibly affect tourist flows. 20 21 22 23.8.2. Agriculture, Forestry, and Bioenergy 23 24 Agriculture and forestry face two challenges under climate change, both to reduce emissions and to adapt to a 25 changing and more variable climate (Smith and Olesen, 2010)(Lavalle et al., 2009). The agriculture sector 26 contributes to about 10% of the total anthropogenic greenhouse gas (GHG) emissions in the European Union (EEA, 27 2010b). Estimates of European carbon dioxide, methane and nitrous oxide fluxes between 2000 and 2005 suggest 28 that methane emissions from livestock and nitrous oxide emissions from agriculture are fully compensated for by the 29 carbon dioxide sink provided by forests and by grassland soils (Schulze et al., 2010). However, projections suggest a 30 significant decline of the forest carbon sink until 2030 in the baseline scenario of about 25–40 compared to 2010 31 estimate. Including additional bioenergy targets of EU member states has an effect on the development of this sink, 32 which is not accounted in the EU emission reduction target (Bottcher et al., 2012). 33 34 Many agricultural practices can potentially mitigate GHG emissions, the most prominent of which are improved 35 cropland and grazing land management and restoration of degraded lands and cultivated organic soils (Smith and 36 Olesen, 2010). Reducing excesses of nitrogen fertilization and substitution of mineral N fertilizers by biological N 37 fixation, as well as improved nutrition of domestic ruminants to reduce methane from enteric fermentation and 38 improved manure management can play a significant role. Lower, but still significant mitigation potential is 39 provided by water and rice management and agro-forestry (Smith and Olesen, 2010). Preserving European soil and 40 forest carbon stocks through careful land use planning and agricultural and forestry management will be required to 41 avoid positive feedbacks on global warming (Schulze et al., 2010) especially during heat and drought extreme 42 events (Ciais et al., 2005). Synergies and trade-offs between mitigation and adaptation need to be incorporated into 43 economic analyses of the mitigation costs (Smith and Olesen, 2010). 44 45 In arable production systems, adapting by increasing the resilience to temperature and rainfall variability would have 46 positive impacts on mitigation by reducing soil erosion, as well as soil organic carbon and nitrogen losses. 47 Improving soil water holding capacity through adding crop residues and manure to arable soils or by adding 48 diversity to the crop rotations may contribute both to adaptation and to mitigation (Smith and Olesen, 2010). In 49 contrast, increased irrigation under climate change will increase energy use and may reduce water availability for 50 hydro-power (reduced mitigation potential) (Wreford et al., 2010). Nevertheless, irrigation may enhance soil carbon 51 sequestration in arable systems (Rosenzweig et al., 2008)(Rosenzweig and Tubiello, 2007). In livestock intensive 52 systems, warmer conditions in the coming decades might trigger the implementation of enhanced cooling and 53 ventilation systems (Rosenzweig and Tubiello, 2007), thereby increasing energy use and associated GHG emissions. 54
SECOND-ORDER DRAFT IPCC WGII AR5 Chapter 23
Do Not Cite, Quote, or Distribute 40 28 March 2013
In grass-based livestock systems, adaptation by adjusting the mean annual animal stocking density to the herbage 1 growth potential (Fitzgerald et al., 2010)(Graux et al., 2012) is likely to create a positive feedback on GHG 2 emissions per unit area (Soussana and Luscher, 2007; Soussana et al., 2010). 3 4 Mitigation measures may encourage the production of energy crops, or forestry, in areas that are vulnerable to 5 extreme events (e.g. fires, storms, droughts) or with high water demand, therefore increasing demands on adaptation 6 (Wreford et al., 2010). Conversely, the potential expansion of agriculture at high latitudes may release large 7 amounts of carbon and nitrogen from organic soils, thereby leading to increased demands on mitigation 8 (Rosenzweig and Tubiello, 2007). Available land for bioenergy crops is foremost to be found in Eastern Europe (De 9 Wit et al., 2011). The total available land in Europe (EU27 and Ukraine) for bioenergy crop production could 10 amount to 900 000 km2 by 2030. Agricultural residues of food and feed crops may provide an additional source for 11 biofuel production. Up to 246 Mt agricultural residues could be available for biofuel production (assuming up to 12 50% of crop residues can be used without risks for agricultural sustainability) which is comparable to feedstock 13 plantations of 15-20 million hectares (Fischer et al., 2010b). Bioenergy crops could occupy significant areas of rural 14 land within 20 years in the UK (Haughton et al., 2009). 15 16 17 23.8.3. Social and Health Impacts 18 19 Significant research has been undertaken since AR4 on the health co-benefits of mitigation policies (see WGIII 20 chapters on Housing, Transport and Energy, and WGII chapter 11). Several assessment have quantified benefits in 21 terms of lives saved by reducing particulate air pollution, and trying to coherent policy objectives for emissions 22 reductions in local and global pollution. Policies that improve health from changes in transport and energy can be 23 said to have a general benefit to population health and resilience (Haines et al., 2009a; Haines et al., 2009b). 24 25 Changes to housing and energy policies also have indirect implications for human health. Researches on the benefits 26 of various housing options (including retrofitting) have been intensively addressed in the context of low energy, 27 healthy and sustainable housing (see WGIII). 28 29 30 23.8.4. Environmental Quality and Biological Conservation 31 32 Marine protected areas (MPAs) provide place-based management of marine ecosystems through various degrees and 33 types of protective actions. MPA networks are generally accepted as an improvement over individual MPAs to 34 address multiple threats to the marine environment. While MPA networks are considered a potentially effective 35 management approach for conserving marine biodiversity, they should be established in conjunction with other 36 management strategies, such as fisheries regulations and reductions of nutrients and other forms of land-based 37 pollution. Information about interactions between climate change and more "traditional" stressors is limited. MPA 38 managers are faced with high levels of uncertainty about likely outcomes of management actions because climate 39 change impacts have strong interactions with existing stressors, such as land-based sources of pollution, overfishing 40 and destructive fishing practices, invasive species, and diseases. Management options include ameliorating existing 41 stressors, protecting potentially resilient areas, developing networks of MPAs, and integrating climate change into 42 MPA planning, management, and evaluation (Keller et al., 2009). Results in a Mediterranean coastal zone 43 demonstrate that the declaration of a marine reserve alone does not guarantee the sustainability of marine resources 44 and habitats but should be accompanied with an integrated coastal management plan (Lloret and Riera, 2008). 45 46 Figure 23-8 illustrates the consequences of the relationships between mitigation and adaptation options and 47 biodiversity (Paterson and Lima, 2010)(Paterson et al., 2009). There are very few management approaches that are 48 win-win-win in terms of mitigation, adaptation and biodiversity and some of these (e.g. forest pest control) have 49 limited implications in terms of adapting to climate change. Other adaptation options, such as desalinisation, sea 50 defences and flood control infrastructure have decidedly negative effects on both mitigation and biodiversity. 51 However, some approaches, such as forest conservation and urban green space (see earlier) have multiple benefits 52 and potentially significant effects. 53 54
SECOND-ORDER DRAFT IPCC WGII AR5 Chapter 23
Do Not Cite, Quote, or Distribute 41 28 March 2013
[INSERT FIGURE 23-8 HERE 1 Figure 23-8: Adaptation and mitigation options and their effects on biodiversity. Based on Paterson et al., 2009.] 2 3 There has been relatively little research about the impacts of future land use demand for bioenergy production, food 4 production and urbanisation on nature conservation. 5 6 7 23.9. Intra-Regional and Inter-Regional Issues 8 9 Climate change will have a range of impacts in different European sub-regions. The adaptive capacity of populations 10 is likely to vary significantly within Europe. Adaptive capacity indicators have been developed based on future 11 changes in socio-economic indicators and projections (Metzger et al., 2008; Lung et al., 2012)(Acosta-Michlik et 12 al., 2013; Greiving et al., ESPON). These studies concluded that the Nordic countries have higher adaptive capacity 13 than most of the Southern European countries, with countries around the Mediterranean having a lower capacity 14 than the countries around the Baltic Sea region. Eastern European countries have, in general, lower adaptive 15 capacity than Western or Northern European countries. 16 17 18 23.9.1. Implications of Climate Change for Distribution of Economic Activity within Europe 19 20 Table 23-4 summarises the future impacts by each sub-regions. A key finding is that all regions are vulnerable to 21 some impacts from climate change but that these impacts differ significantly in type between the sub-regions. 22 Impacts in neighbouring regions (inter-regional) may redistribute economic activities across the European 23 landscape. The sectors most likely to be affected by climate change, and therefore with implications for economic 24 activity and population movement (changes in employment opportunities) include: tourism, agriculture, and forestry. 25 26 [INSERT TABLE 23-4 HERE 27 Table 23-4: Assessment of future climate change impacts by sub-region and sector (by 2050, medium emissions).] 28 29 Economic assessments of impacts across sectors and across Europe indicate large variations across subregions 30 (Ciscar et al., 2011). Annual loss in household welfare in the EU27 resulting from the four market impacts 31 (agriculture, river floods, coastal areas, and tourism) would range between 0.2-1% by 2080s (Ciscar et al., 2011). 32 Northern Europe is the only region project to have net economic benefits in these sectors, driven mainly by the 33 positive effects on agriculture. Coastal systems, agriculture, and river flooding are the most important of the four 34 market impacts assessed. 35 36 Impacts of climate change losses on local economies are more serious in a large-scale scenario when neighbouring 37 provinces are also affected by drought and heat wave events. This is due to the supply-side induced price increase 38 leading to some passing on of disaster costs to consumers (Mechler et al., 2010). Growing temperatures across 39 Europe could affect the relative quality of life in different regions which in turn could change the intensity and 40 direction of internal migration flows (as one factor in individuals migration decision making strategy could be 41 temperature) (Kerr and Kerr, 2011). 42 43 Climate change may also affect policies regulating agriculture and fisheries across European sub-regions. The Less 44 Favoured Areas (LFA) scheme is a broad European policy mechanism for improving the viability of agriculture in 45 areas with natural handicaps. Land suitability for agricultural production is classified based on climate, soil, and 46 terrain criteria. By 2030, part of Northern Europe would leave areas with climate constraint zone basically because 47 of mean annual temperature increase, while part of central and South Europe would enter these areas as a result of 48 increased aridity (Donatelli et al., 2012). The European Union Common Fisheries Policy is also questioned by 49 changes in the distribution of fish stocks which could affect total allowable catches and their allocations to member 50 states (Arnason, 2012). 51 52 53
54
SECOND-ORDER DRAFT IPCC WGII AR5 Chapter 23
Do Not Cite, Quote, or Distribute 42 28 March 2013
23.9.2. Climate Change Impacts Outside Europe and Inter-Regional Implications 1 2 In an increasingly globalised world, impacts of climate change in other countries are likely to affect countries within 3 the Europe region. Further, the region is very closely linked to its near neighbours. Countries around the 4 Mediterranean share similar ecologies and therefore some vulnerability (see Box 23-3; see also Chapter 22). 5 6 _____ START BOX 23-3 HERE _____ 7 8 Box 23-3. Climate Change Impacts in the Mediterranean 9 10 The Mediterranean area (which encompasses two IPCC regions: Europe and Africa) is particularly vulnerable to 11 climate change. Mediterranean ecosystems have been strongly modified from millennia of human occupation and 12 use. At present, habitat loss and degradation, as well as extraction, pollution, eutrophication and the introduction of 13 alien species, and recently climate change, are the most important threats that affect the greatest number of 14 taxonomic groups occurring in the Mediterranean Sea (Costello et al., 2010; Coll et al., 2012). Areas with high 15 marine biodiversity in the Mediterranean Sea are mainly located along the central and north shores, with lower 16 values in the south-eastern regions (Coll et al., 2012). Areas of potential high cumulative threats are widespread in 17 both the western and eastern basins, with fewer areas located in the south-eastern region. The interaction between 18 areas of high biodiversity and threats for invertebrates, fishes and large animals in general (including large fishes, 19 marine mammals, marine turtles and seabirds) is concentrated in the coastal areas of Spain, Gulf of Lions, north-20 eastern Ligurian Sea, Adriatic Sea, Aegean Sea, south-eastern Turkey and regions surrounding the Nile Delta and 21 north-west African coasts. Socio-economic factors are likely to increase competition for water and land degradation 22 in the region (Hoff, 2012). Agricultural production will be exposed to increased heat waves and droughts with a 23 potential for negative impacts that will be exacerbated by the competition for water with other sectors (see 23.4.3). It 24 is uncertain if tourism flows will decline in the Mediterranean countries (see 23.3.6). Climate change is expected to 25 trigger a more severe fire regime and more difficult conditions for ecosystem restoration after fire (Anav et al., 26 2010)(Moriondo et al., 2006)(Duguy et al., 2012). 27 28 _____ END BOX 23-3 HERE _____ 29 30 The high volume of international travel increases Europe’s vulnerability to invasive species, including the vectors of 31 human and animal infectious diseases. The transport of animals and animal products has faciliated the spread of 32 animal diseases (Conraths and Mettenleiter, 2011). Important “exotic” vectors that have become established in 33 Europe include the vector Aedes albopictus (Becker, 2009) (see Section 23.5.1 above) and a novel vector of blue 34 tongue virus (see 23.4.3). 35 36 Another inter-regional implication concerns the changes in the location of commercial fish stocks shared with non-37 member states. Such changes may render existing international agreements regarding the sharing of yield from these 38 stocks obsolete giving rise to international disputes (Arnason, 2012). For instance, in the North Atlantic, the 39 mackerel stock has recently been extending beyond the EU jurisdiction into the Exclusive Economic Zones of 40 Iceland and the Faroe Islands (Astthorsson et al., 2012). 41 42 There are few robust studies of future climate-change related population movement either within or into the 43 European region. Although several studies have proposed a role of climate change to increase migration pressures in 44 low and middle income countries in the future, there is little robust information regarding the role of climate, 45 environmental resource depletion and weather disasters in future inter-continental population movements 46 (Kolmannskog and Myrstad, 2009; Kolmannskog, 2010). The effect of climate change on external migration flows 47 into Europe is highly uncertain (see chapter 12.4.1 for a more complete discussion). Modelling future migration 48 patterns is complex and so far no robust approaches have been developed. 49 50 51
52
SECOND-ORDER DRAFT IPCC WGII AR5 Chapter 23
Do Not Cite, Quote, or Distribute 43 28 March 2013
23.10. Synthesis of Key Findings 1 2 23.10.1. Key Vulnerabilities 3 4 Context to key vulnerabilities: 5
• Many key vulnerabilities are already well known since the AR4, but some new vulnerabilities are emerging 6 in AR5 7
• The policy/governance context in Europe is extremely important in determining key vulnerabilities (either 8 mitigating or exacerbating vulnerability) since Europe is a highly regulated region. 9
• Vulnerability will be strongly affected by changes in the non-climate drivers of change (e.g. economic, 10 social, governance, technological drivers), and for many sectors this will be more important than climate 11 change. 12
• Future vulnerability will also be strongly affected by cross-sectoral (indirect) interactions, e.g. flooding-13 ecosystems, agriculture-species, agriculture-cultural landscapes, and so on. 14
• Extreme events (heat waves and droughts) have had significant impacts on populations as well impacts on 15 multiple economic sectors, and resilience to future heat waves has only been addressed within some 16 sectors. 17
18 Already known vulnerabilities (AR4) confirmed in AR5: 19
• More heat-related deaths and health issues due to an increase in heat waves, particularly in Southern 20 Europe. 21
• Increases in pests and diseases, with implications for plant, animal and human health. 22 • Increase in energy demand in summer and reduction in winter. 23 • The key vulnerability for forests arises from species decline and increase in wild fires and pests and 24
diseases 25 • Alpine species in particular are vulnerable to climate change (due to a lack of migration potential) 26 • The ski tourism sector is highly vulnerable to reductions in snow cover arising from warming 27 • Decrease of the hydropower potential in southern regions and increase in northern regions 28 • Reduced production in some thermal power plants due to cooling water shortages 29 • Coastal zones (including both natural environments and settlements) are highly vulnerable to sea level rise 30 • Settlements across Europe are vulnerable to flooding. 31
32 Emerging vulnerabilities: 33
• Arable crop yields. There is new evidence to suggest that crop yields and production may be more 34 vulnerable as a result of increasing climate variability. This will limit the potential poleward expansion of 35 agricultural production. Limits to genetic progress to adapt are increasingly reported. 36
• Water will be less available and will be in increased demand and degraded state of water tables. There is 37 the potential for increased competition between the agricultural, domestic, power sector, industrial and 38 natural (animal and plant species) users of water. Future problems are likely to occur unless integrated 39 water management is widely adopted. 40
• Increased summer energy demand, especially in southern Europe, requires additional power generation 41 capacity, which will be under-utilised during the rest of the year, entailing higher supply costs. 42
• New evidence regarding implications during summer on inland waterways (decreased access) and long 43 range ocean transport (increased access). 44
• Housing will be affected, with increased overheating under no adaptation and damage from subsidence and 45 flooding. Passive cooling measures alone are unlikely to be sufficient to address adaptation in all regions 46 and types of buildings. Retrofitting current housing stock will be expensive. 47
• An emerging concern is the vulnerability of cultural heritage, including monuments/buildings and cultural 48 landscapes. Some cultural landscapes will disappear. Grape production is highly sensitive to climate, but 49 production (of grape varieties) is strongly culturally-dependent and adaptation is potentially limited by the 50 regulatory context. 51
• Terrestrial and freshwater species are vulnerable from climate-change shifts in habitats. There is new 52 evidence that species cannot populate new habitat due to habitat fragmentation (urbanization). Observed 53 migration rates are less than that assumed in modelling studies. There are legal barriers to introducing new 54
SECOND-ORDER DRAFT IPCC WGII AR5 Chapter 23
Do Not Cite, Quote, or Distribute 44 28 March 2013
species (e.g. forest species in France). New evidence that phenological mismatch will cause additional 1 adverse effects on some species. 2
• Good evidence that climate change will increase distribution and seasonal activity of pests and diseases. 3 Limited evidence that such effects already occurring. Increased threats to plant and animal health. Public 4 policies are in place to reduce pesticide use in agriculture use and antibiotics in livestock, and this will 5 increase vulnerability to the impact of climate change on agriculture and livestock production. 6
• Extreme events affect multiple sectors and have the potential to cause a systemic impact. Past events 7 indicate the vulnerability of transport, energy agriculture, water resources and health systems. Resilience to 8 very extreme events varies by sector, and by country. 9
• A positive (and emerging) effect that may reduce vulnerability is that many European governments (and 10 individual cities) have become aware of the need to adapt to climate change and so are developing and/or 11 implementing adaptation strategies and measures. 12
• Lack of institutional frameworks is a major barrier to adaptation governance. In particularly, the systematic 13 failure in land use planning policy to account for climate change. 14
15 [INSERT TABLE 23-5 HERE 16 Table 23-5: Multi-sectoral impacts of climate extremes during the last decade in Europe.] 17 18 19 23.10.2. Effects of Observed Climate Change in Europe 20 21 Table 23-6 summarises the evidence with respect to key indicators in Europe for the detection of a trend and the 22 attribution of that trend to observed changes in climate factors. The attribution of local warming to anthropogenic 23 climate change is less certain (see Chapter 18 for a full discussion). Further and better quality evidence since 2007 24 supports the conclusion of AR4 (Europe chapter, Alcamo et al., 2007) that climate change is affecting land, 25 freshwater and marine ecosystems in Europe. Climate warming has caused advancement in the life cycles of many 26 animal groups, including frogs spawning, birds nesting and the arrival of migrant birds and butterflies (see WGII 27 chapter 4 and review by Feehan et al. (2009). There is limited evidence that observed climate change is already 28 affecting agricultural, forest and fisheries productivity (see 23.4). 29 30 The frequency of river flood events, and annual flood and windstorm damages in Europe have increased over recent 31 decades, but this increase is mainly due to increased exposure and the contribution of observed climate change is 32 unclear (high confidence – based on robust evidence and high agreement)(SREX 4.5.3, (Barredo, 2010). The 33 observed increase in the frequency of hot days and hot nights (high confidence, WGI) is likely to have increased 34 heat-related health effects in Europe (medium confidence), and well as a decrease in cold related health effects 35 (medium confidence) (Christidis et al., 2010). Multiple impacts on health, welfare and economic sectors were 36 observed due to the major heat wave events of 2003 and 2010 in Europe (Table 23-5) (see Chapter 18 for discussion 37 on attribution of events). 38 39 [INSERT TABLE 23-6 HERE 40 Table 23-6: Observed changes in ecological and human systems.] 41 42 43 23.10.3. Key Knowledge Gaps and Research Needs 44 45 There is a clear mismatch between the volume of scientific work on climate change since the AR4 and the insights 46 and understanding required for policy needs. 47 48 Some specific research needs have been identified: 49
• More research on co-benefits and unintended consequences of adaptation options, and the effects of 50 adaptation in one sector on other sectors in Europe. For example, air conditioning. 51
• Improved economic tools and methods for costing and valuation of specific adaptation options including 52 the use of this information in decision making. 53
SECOND-ORDER DRAFT IPCC WGII AR5 Chapter 23
Do Not Cite, Quote, or Distribute 45 28 March 2013
• Synergies and trade-offs between mitigation and adaptation need to be further researched and incorporated 1 into economic analyses of the mitigation costs. 2
• Effects of climate change on infrastructure and the built environment, in the context of adaptation and 3 mitigation policies. 4
• Impacts from high end climate change (above 4°C), with a lack of impact studies in Europe. 5 • Resilience of cultural landscapes and communities, and how to manage adaptation, particularly low 6
technology (productively marginal) landscapes 7 • Climate change impact on ecosystem services (including valuation of ecosystem services) and how this 8
would contribute to the improvement of management of natural resources. 9 • Development /improvement of regional climate services (seasonal, decadal forecasts) 10 • Impact of climate change on rural development in order to inform policy in this area. 11 • Capacity of local and national government to respond to climate change. 12 • Information on governance (including local and national institutions) for adaptation in the built 13
environment, and infrastructure, including flood defences, over-heating, urban planning. 14 • More research on the assessment and quantification of climate for tourism, as well as on the response of 15
tourists to past and future marginal climatic conditions for tourism. 16 • More research on the impacts of climate change on transport, especially on the vulnerability of road and 17
rail infrastructure in different regions, and on the contribution of climatic and non-climatic parameters in 18 the vulnerability of air transport (e.g. changes in air traffic volumes, airport capacities, air traffic demand, 19 weather at the airports of origin, intermediate and final destination). 20
• [needs to be more specific] Better characterization of the determinants of changes in yield and food quality 21 and improvement of technologies for precision farming. 22
• Research on the resilience/vulnerability of populations to extreme events, including responses to flood and 23 heat wave risks. 24
• Development of better risk models for vector borne disease, including public health implications and for 25 animal diseases. 26
27 A major barrier to research is lack of access to data, which is also variable across regions and countries, specifically 28 socio-economic data, climate data, forestry, routine health data. Reasons include: government agencies require 29 commercialisation, inappropriate confidentiality. There is a need for long term monitoring of environmental and 30 social indicators and to ensure open and access to data (environment, crop, etc) for long term and sustainable 31 research programmes. Cross-regional cooperation could also ensure compatability and consistency of parameters 32 across the region. 33 34 35 Frequently Asked Questions 36 37 FAQ 23.1: Will I still be able to live on the coast in Europe? 38 It depends where you want to live (and when). Coastal areas are affected by storm surges that will increase in 39 frequency and extent due to sea level rise. Most of this increase in risk will occur after the middle of this century. 40 Models of the coast line suggest that populations in the north western region of Europe are most affected and many 41 countries will need to strengthen their coastal defences (including the Netherlands, Germany, France, Belgium, 42 Denmark, Spain and Italy). The decision to protect an area of coastline will depend on the value (market and non-43 market values) of the land, its infrastructure or economic productivity, and its conservation potential (valuing 44 species or ecosystems). Some countries have already raised their coastal defence standards. More innovative options 45 (than defence or abandonment) are also being explored such as to adapt dwellings and commercial buildings to 46 occasional flooding. Upgrading coastal defenses can significantly reduce (but not fully eliminate) adverse impacts of 47 sea level rise but coasts are also faced with erosion, excessive development, and other types of environmental 48 degradation not related to climate change. The combination of raised sea defences and coastal erosion may lead to 49 narrower coastal zones in the North Sea, the Iberian coast, and Bay of Biscay. 50 51 FAQ 23.2: Will climate change introduce new infectious diseases into Europe? 52 New (emerging) diseases appear all the time and current diseases change distribution or prevalence (increases and 53 decreases). The factors that determine whether a disease changes distribution include: importation from increased 54
SECOND-ORDER DRAFT IPCC WGII AR5 Chapter 23
Do Not Cite, Quote, or Distribute 46 28 March 2013
international travel of persons, vectors or hosts, changes in vector or host susceptibility, drug resistance, climate 1 change, and land use or other habitat changes that affect vectors or hosts. Tropical diseases is a term used to describe 2 diseases that are now only present in the tropics, but malaria was once endemic in Europe and its mosquito vectors 3 are still present. Malaria is not established in Europe despite imported cases because infected persons are quickly 4 detected and treated. Maintaining health surveillance is therefore extremely important. Finally, when an outbreak 5 has occurred (i.e. the introduction of a new disease) determining the causes is very difficult. It is likely that a 6 combination of factors will be important. A suitable climate is a necessary but not a sufficient factor for the 7 introduction of new infectious diseases. 8 9 FAQ 23.3: Will Europe need to import more food because of climate change? 10 Agriculture is the most dominant European land use, accounting for almost half of the total EU27 land area. Europe 11 is one of the world’s largest and most productive suppliers of food and fibre, but also imports large amounts of 12 agricultural commodities. A reduction in crop yields, particularly wheat in southern Europe, is expected under future 13 climate scenarios. A shift in cultivation areas of added-value crops, such as wine, may also occur. Loss of food 14 production may be compensated by increases in other European sub-regions, under normal climate variability and 15 long term changes. However, if ability of the European market to sustain climate shock events is impaired, the 16 region would require exceptional food importation. 17 18 19 References 20 21 Aaheim, A., H. Amundsen, T. Dokken, and T. Wei, 2012: Impacts and adaptation to climate change in European 22
economies. Global Environmental Change, 22(4), 959-968. 23 Aakre, S. and D.T.G. Rübbelke, 2010: Adaptation to climate change in the European Union: efficiency versus equity 24
considerations. Environmental Policy and Governance, 20(3), 159-179. 25 Aakre, S., I. Banaszak, R. Mechler, D. Rübbelke, A. Wreford, and H. Kalirai, 2010: Financial adaptation to disaster 26
risk in the European Union; Identifying roles for the public sector. Mitigation and Adaptation Strategies for 27 Global Change, 15(7), 721-736. 28
ABI, 2009: The Financial Risk of Climate Change. In: Research Paper No. 19. Association of British Insurers, 29 London. 30
Acevedo, P., F. Ruiz-Fons, R. Estrada, A.L. Márquez, M.A. Miranda, C. Gortázar, and J. Lucientes, 2010: A broad 31 assessment of factors in determining Culicoides imicola abundance: modelling the present and forecasting its 32 future in climate change scenarios. PloS One, 5(12), e14236. 33
Acosta-Michlik, L., M. Metzger, R. Klein, P. Reitsma, D. Schroeter, and M.D.A. Rounsevell, 2013, in review: A 34 Spatially Explicit Scenario-Driven Model of Adaptive Capacity to Global Change in Europe. . Global 35 Environmental Change, . 36
Aerts, J., T. Sprong, and B. Bannink, 2008: Aandacht voor Veiligheid. Leven met Water, Klimaat voor Ruimte, DG 37 Water, pp. 1-198. 38
Aerts, J.C.J.H. and W.J.W. Botzen, 2011: Climate change impacts on pricing long-term flood insurance: A 39 comprehensive study for the Netherlands. Global Environmental Change, 21(3), 1045-1060. 40
Affolter, P., U. Büntgen, J. Esper, A. Rigling, P. Weber, J. Luterbacher, and D. Frank, 2010: Inner Alpine conifer 41 response to 20th century drought swings. European Journal of Forest Research, 129, 289-298. 42
AGRESTE, 2011: Agreste Infos rapides-Grandes cultures et fourrages - n°6/7. Ministère de l'agriculture, de 43 l'alimentation, de la pêche, de la ruralité et de l'aménagement du territoire. 44
Ainsworth, E.A., C. Beier, C. Calfapietra, R. Ceulemans, M. Durand-Tardif, G.D. Farquhar, D.L. Godbold, G.R. 45 Hendrey, T. Hickler, J. Kaduk, D.F. Karnosky, B.A. Kimball, C. Koerner, M. Koornneef, T. Lafarge, A.D.B. 46 Leakey, K.F. Lewin, S.P. Long, R. Manderscheid, D.L. McNeil, T.A. Mies, F. Miglietta, J.A. Morgan, J. Nagy, 47 R.J. Norby, R.M. Norton, K.E. Percy, A. Rogers, J. Soussana, M. Stitt, H. Weigel, and J.W. White, 2008: Next 48 generation of elevated CO2 experiments with crops: a critical investment for feeding the future world. Plant 49 Cell and Environment, 31, 1317-1324. 50
Airoldi, L. and M.W. Bec, 2007: Loss, status and trends for coastal marine habitats of Europe. Oceanography and 51 Marine Biology Annual Review, 45, 345-405. 52
Albert, M. and M. Schmidt, 2010: Climate-sensitive modelling of site-productivity relationships for Norway spruce 53 (Picea abies (L.) Karst.) and common beech (Fagus sylvatica L.). Forest Ecology and Management, 259, 739-54 749. 55
SECOND-ORDER DRAFT IPCC WGII AR5 Chapter 23
Do Not Cite, Quote, or Distribute 47 28 March 2013
Albrecht, F., T. Wahl, J. Jensen, and R. Weisse, 2011: Determining sea level change in the German Bight. Ocean 1 Dynamics, 61(12), 2037-2050. 2
Alcamo, J., J.M. Moreno, B. Novaky, M. Bindi, R. Corobov, R.J.N. Devoy, C. Giannakopoulos, E. Martin, J.E. 3 Olesen, and A. Shvidenko, 2007: Climate Change 2007: Impacts, Adaptation and Vulnerability. In: 4 Contribution of Working Group II to the Fourth Assessment Report of the Intergovernmental Panel on Climate 5 Change. Cambridge University Press, Cambridge. 6
Alkemade, R., M. Bakkenes, and B. Eickhout, 2011: Towards a general relationship between climate change and 7 biodiversity: an example for plant species in Europe. Regional Environmental Change, 11, S143-S150. 8
Allen, C.D., A.K. Macalady, H. Chenchouni, D. Bachelet, N. McDowell, M. Vennetier, T. Kitzberger, A. Rigling, 9 D.D. Breshears, E.H.(.). Hogg, P. Gonzalez, R. Fensham, Z. Zhang, J. Castro, N. Demidova, J.-. Lim, G. Allard, 10 S.W. Running, A. Semerci, and N. Cobb, 2010: A global overview of drought and heat-induced tree mortality 11 reveals emerging climate change risks for forests. Forest Ecology and Management, 259(4), 660-684. 12
Amelung, B., S. Nicholls, and D. Viner, 2007: Implications of global climate change for tourism flows and 13 seasonality. Journal of Travel Research, 45, 285-296. 14
Amelung, B. and A. Moreno, 2009: Impacts of climate change in tourism in Europe. PESETA-Tourism study. JRC 15 Scientific and Technical Reports, Seville, Spain, pp. 5-55. 16
Amelung, B. and A. Moreno, 2011: Costing the impact of climate change on tourism in Europe: results of the 17 PESETA project. Climatic Change, in Press, , 1-18. 18
Anav, A., P.M. Ruti, V. Artale, and R. Valentini, 2010: Modelling the effects of land-cover changes on surface 19 climate in the Mediterranean region. Climate Research, 41, 91-104. 20
Andersen, H.E., B. Kronvang, S. Larsen, C.C. Hoffmann, T.S. Jensen, and E.K. Rasmussen, 2006: Climate-change 21 impacts on hydrology and nutrients in a Danish lowland river basin. Science of the Total Environment, 365(1-22 3), 223-237. 23
Andersson, A.K. and L. Chapman, 2011a: The impact of climate change in winter road maintenance and traffic 24 accidents in west Midlands, UK. Accident Analysis and Prevention, 43(1), 284-289. 25
Andersson, A.K. and L. Chapman, 2011b: The use of a temporal analogue to predict future traffic accidents and 26 winter road conditions in Sweden. Meteorological Applications, 18, 125-136. 27
André, G., B. Engel, P.B.M. Berentsen, T. Vellinga, and A.G.J.M. Oude Lansink, 2011: Quantifying the effect of 28 heat stress on daily milk yield and monitoring dynamic changes using an adaptive dynamic model. Journal of 29 Dairy Science, 94(9), 4502-4513. 30
AQEP, 2007: Air Quality and Climate Change: A UK Perspective. In: Third report of the Air Quality Expert Group. 31 DEFRA, UK. 32
Aragòn, P. and J.M. Lobo, 2012: Predicted effect of climate change on the invasibility and distribution of 33 theWestern corn root-worm. Agricultural and Forest Entomology, 14, 13-18. 34
Araújo, M.B., W. Thuiller, and R.G. Pearson, 2006: Climate warming and the decline of amphibians and reptiles in 35 Europe. Journal of Biogeography, 33, 1712-1728. 36
Araújo, M.B., D. Alagador, M. Cabeza, D. Nogués-Bravo, and W. Thuiller, 2011: Climate change threatens 37 European conservation areas. Ecology Letters, 14, 484-492. 38
Arca, B., G. Pellizzaro, P. Duce, M. Salis, V. Bacciu, D. Spano, A. Ager, and E. Scoccimarro, 2012: Potential 39 changes in fire probability and severity under climate change scenarios in Mediterranean areas. In: Modelling 40 Fire Behaviour and Risk. [Spano, D., V. Bacciu, M. Salis, and C. Sirca(eds.)]. Nuova Stampa Color, ISBN: 41 978-88-904409-7-7, pp. 92-98. 42
Armstrong, B.G., Z. Chalab, B. Fenn, S. Hajat, S. Kovats, A. Milojevic, and P. Wilkinson, 2011: Association of 45 mortality with high temperatures in a temperate climate: England and Wales. Journal of Epidemology and 46 Community Health, 65, 340-345. 47
Arnason, R., 2012: Global warming: New challenges for the common fisheries policy? Ocean & Coastal 48 Management, 70, 4-9. 49
Arnell, N., 2011: Incorporating climate change into water resources planning in England and Wales. Journal of the 50 American Water Resources Association, 47(3), 541-549. 51
Artmann, N., D. Gyalistras, H. Manz, and P. Heiselberg, 2008: Impact of climate warming on passive night cooling 52 potential. Building Research & Information, 36(2), 111-128. 53
ARUP, 2011: Adaptation Sub-Committee of the Committee on Climate Change. Analysis of How Land Use Planning 54 Decisions Affect Vulnerability to Climate Risks. Final Report. Ove Arup and Partners Ltd., London. 55
SECOND-ORDER DRAFT IPCC WGII AR5 Chapter 23
Do Not Cite, Quote, or Distribute 48 28 March 2013
Arzt, J., W.R. White, B.V. Thomsen, and C.C. Brown, 2010: Agricultural Diseases on the Move Early in the Third 1 Millennium. Veterinary Pathology, 47(1), 15-27. 2
Åström, D., B. Forsberg, and J. Rocklöv, 2011: Heat wave impact on morbidity and mortality in the elderly 3 population: a review of recent studies. Maturitas, 69(2), 99-105. 4
Åström, D., H. Orru, J. Rocklöv, G. Strandberg, K.L. Ebi, and B. Forsberg, 2013: Heat-related respiratory hospital 5 admissions in Europe in a changing climate: a health impact assesssment. BMJ Open, 3. 6
Astthorsson, O.S., H. Valdimarsson, A. Gudmundsdottir, and G.J. Óskarsson, 2012: Climate-related variations in the 7 occurrence and distribution of mackerel (Scomber scombrus) in Icelandic waters. ICES Journal of Marine 8 Science, 69. 9
Avnery, S., D.L. Mauzerall, J. Liu, and L.W. Horowitz, 2011a: 10 Global crop yield reductions due to surface ozone exposure: 1. Year 2000 crop production losses and economic 11 damage. Atmospheric Environment, 45, 2284-2296. 12
Avnery, S., D.L. Mauzerall, J. Liu, and L.W. Horowitz, 2011b: Global crop yield reductions due to surface ozone 13 exposure: 2. Year 2030 potential crop production losses and economic damage under two scenarios of O3 14 pollution. Atmospheric Environment, 45, 2297-2309. 15
BACC, 2008: Assessment of Climate Change for the Baltic Sea Basin. Springer, New York, pp. 474. 16 Baccini, M., T. Kosatsky, A. Analitis, H.R. Anderson, M. D'Ovidio, B. Menne, P. Michelozzi, and A. Biggeri, 2011: 17
Impact of heat on mortality in 15 European cities: attributable deaths under different weather scenarios. Journal 18 of Epidemiology and Community Health, 65(1), 64-70. 19
Ballester, J., J.-. Robine, F.R. Herrmann, and X. Rodo, 2011: Long-term projections and acclimatization scenarios of 20 temperature-related mortality in Europe. Nature Communications, 2(358). 21
Barredo, J.I., 2010: No upward trend in normalised windstorm losses in Europe: 1970-2008. Natural Hazards and 22 Earth System Sciences, 10(1), 97-104. 23
Barredo, J.I., 2009: Normalised flood losses in Europe: 1970-2006. Natural Hazards and Earth System Sciences, 24 9(1), 97-104. 25
Barriopedro, D., E.M. Fischer, J. Luterbacher, R.M. Trigo, and R. García-Herrera, 2011: The hot summer of 2010: 26 redrawing the temperature record map of Europe. Science, 332(6026), 220-224. 27
Barstad, I., A. Sorteberg, and M. Dos-Santos, 2012: Present and furture offshore wind power potential in Northern 28 Europe based on downscaled global climate runs with adjusted SST and sea ice cover. Renewable Energy, 44, 29 398-405. 30
Bastola, S., C. Murphy, and J. Sweeney, 2011: The sensitivity of fluvial flood risk in Irish catchments to the range of 31 IPCC AR4 climate change scenarios. Science of the Total Environment, 409(24), 5403-5415. 32
Battaglini, A., G. Barbeau, M. Bindi, and F.W. Badeck, 2009: European winegrowers’ perceptions of climate 33 change impact and options for adaptation. Regional Environmental Change, 9(2), 61-73. 34
Baumanns, K., M.D.A. Rounsevell, D. Murray-Rust, C. Hardacre, P.I. Palmer, A. Arneth, and X. Cui, 2012 (in 35 review): Applying Occam’s razor to global agricultural land use change. Global Environmental Change, . 36
Beaugrand, G. and R.R. Kirby, 2010: Climate, plankton and cod. Global Change Biology, 16(4), 1268-1280. 37 Beaugrand, G., M. Edwards, and L. Legendre, 2010: Marine biodiversity, ecosystem functioning, and carbon cycles. 38
Proceedings of the National Academy of Sciences of the United States of America, 107(22), 10120-10124. 39 Beaugrand, G. and P.C. Reid, 2012: Relationships between North Atlantic salmon, plankton, and hydroclimatic 40
change in the Northeast Atlantic. ICES Journal of Marine Science, 69(9), 1549-1562. 41 Beaugrand, G. and R.R. Kirby, 2010: Climate, plankton and cod. Global Change Biology, 16(4), 1268-1280. 42 Beck, C., J. Jacobeit, and P.D. Jones, 2007: Frequency and within-type variations of large-scale circulation types 43
and their effects on low-frequency climate variability in central Europe since 1780. International Journal of 44 Climatology, 27(4), 473-491. 45
Becker, N., 2009: The impact of globalization and climate change on the development of mosquitoes and mosquito-46 borne diseases in Central Europe [Die Rolle der Globalisierung und Klimaveränderung auf die Entwicklung von 47 Stechmücken und von ihnen übertragenen Krankheiten in Zentral-Europa]. Umweltwissenschaften Und 48 Schadstoff-Forschung, 21(2), 212-222. 49
Belkin, I.M., 2009: Rapid Warming of Large Marine Ecosystems. Progress in Oceanography, 81, 207-213. 50 Benavente, D., P. Brimblecombe, and C.M. Grossi, 2008: Salt weathering and climate change. In: New Trends in 51
Analytical, Environmental and Cultural Heritage Chemistry. [Colombini, M.P. and L. Tassi(eds.)]. Transworld 52 Research Network, Kerala, India, pp. 277-286. 53
Beniston, M., 2009: Trends in joint quantiles of temperature and precipitation in Europe since 1901 and projected 54 for 2100. Geophysical Research Letters, 36, 1-6. 55
SECOND-ORDER DRAFT IPCC WGII AR5 Chapter 23
Do Not Cite, Quote, or Distribute 49 28 March 2013
Berg, P., C. Moseley, and J.O. Haerter, 2013: Strong increase in convective precipitation in response to higher 1 temperatures. Nature Geoscience, (doi:10.1038/ngeo1731). 2
Bertini, G., T. Amoriello, G. Fabbio, and M. Piovosi, 2011: Forest growth and climate change: Evidences from the 3 ICP-forests intensive monitoring in Italy. IForest, 4, 262-267. 4
Biesbroek, G.R., R.J. Swart, T.R. Carter, C. Cowan, T. Henrichs, H. Mela, M.D. Morecroft, and D. Rey, 2010: 5 Europe adapts to climate change: Comparing National adaptation strategies. Global Environmental Change, 6 20(3), 440-450. 7
Bigler, C., O. Bräker, H. Bugmann, M. Dobbertin, and A. Rigling, 2006: Drought as an Inciting Mortality Factor in 8 Scots Pine Stands of the Valais, Switzerland. Ecosystems, 9(3), 330-343. 9
Bindi, M. and J.E. Olesen, 2011: The responses of agriculture in Europe to climate change. Regional Environmental 10 Change, 11(suppl. 1), 151-158. 11
Bindi, M. and J.E. Olesen, 2010: The responses of agriculture in Europe to climate change. Regional Environmental 12 Change, 11, 151-158. 13
Blaustein, A.R., S.C. Walls, B.A. Bancroft, J.J. Lawler, C.L. Searle, and S.S. Gervasi, 2010: Direct and indirect 14 effects of climate change on amphibian populations. Diversity, 2(2), 281-313. 15
Bloom, A., V. Kotroni, and K. Lagouvardos, 2008: Climate change impact of wind energy availability in the Eastern 16 Mediterranean using the regional climate model PRECIS. Natural Hazards and Earth System Sciences, 8(6), 17 1249-1257. 18
Bock, A., T. Sparks, N. Estrella, and A. Menzel, 2011: Changes in the phenology and composition of wine from 19 Franconia, Germany. Climate Research, 50, 69-81. 20
Bonazza, A., P. Messina, C. Sabbioni, C.M. Grossi, and P. Brimblecombe, 2009a: Mapping the impact of climate 21 change on surface recession of carbonate buildings in Europe. Science of the Total Environment, 407(6), 2039-22 2050. 23
Bonazza, A., C. Sabbioni, P. Messina, C. Guaraldi, and P. De Nuntiis, 2009b: Climate change impact: mapping 24 thermal stress on Carrara marble in Europe. Science of the Total Environment, 407(15), 4506-4512. 25
Bormann, H., N. Pinter, and S. Elfert, 2011: Hydrological signatures of flood trends on German rivers: Flood 26 frequencies, flood heights and specific stages. Journal of Hydrology, 404, 50-66. 27
Bosello, F., R.J. Nicholls, J. Richards, R. Roson, and R.S.J. Tol, 2012: Economic impacts of climate change in 28 Europe: Sea-level rise. Climatic Change, 112(1), 63-81. 29
Bottcher, H., P.J. Verkerk, M. Gusti, P. Havla�k, and G. Grassi, 2012: Projection of the future EU forest CO 2 sink 30 as affected by recent bioenergy policies using two advanced forest management models. GCB Bioenergy, 4(6), 31 773-783. 32
Botzen, W.J.W. and J.C.J.M. van den Bergh, 2008: Insurance against climate change and flooding in the 33 Netherlands: present, future, and comparison with other countries. Risk Analysis, 28, 413-426. 34
Botzen, W.J.W., J.C.J.H. Aerts, and J.C.J.M. van den Bergh, 2009: Willingness of homeowners to mitigate climate 35 risk through insurance. Ecological Economics, 68, 2265-2277. 36
Botzen, W.J.W., J.C.J.M. van den Bergh, and L.M. Bouwer, 2010a: Climate change and increased risk for the 37 insurance sector: a global perspective and an assessment for The Netherlands. Natural Hazards, 52, 577-598. 38
Botzen, W.J.W., L.M. Bouwer, and J.C.J.M. van den Bergh, 2010b: Climate change and hailstorm damage: 39 Empirical evidence and implications for agriculture and insurance. Resource and Energy Economics, 32(3), 40 341-362. 41
Bouwer, L.M., J.E. Vermaat, and J.C.J.H. Aerts, 2008: Regional sensitivities of mean and peak river discharge to 42 climate variability in Europe. Journal of Geophysical Research, 113, D19103. 43
Bouwer, L.M., P. Bubeck, and J.C.J.H. Aerts, 2010: Changes in future flood risk due to climate and development in 44 a Dutch polder area. Global Environmental Change, 20(3), 463-471. 45
Boxall, A., A. Hardy, S. Beulke, T. Boucard, L. Burgin, P.D. Falloon, P.M. Haygarth, T. Hutchinson, S. Kovats, G. 46 Leonardi, L.S. Levy, G. Nichols, S.A. Parsons, L. Potts, D. Stone, E. Topp, D.B. Turley, K. Walsh, E.M.H. 47 Wellington, and R.J. Williams, 2009: Impacts of climate change on indirect human exposure to pathogens and 48 chemicals from agriculture: Environmental Health Perspectives, 117(4), 508-514. 49
Bradley, B.A., D.M. Blumenthal, D.S. Wilcove, and L.H. Ziska, 2010: Predicting plant invasions in an era of global 50 change. Trends in Ecology & Evolution, 25(5), 310-8. 51
Branquart, E., K. Verheyen, and J. Latham, 2008: Selection criteria of protected forest areas in Europe: The theory 52 and the real world. Biological Conservation, 11(141), 2795-2806. 53
Breesch, H. and A. Janssens, 2010: Performance evaluation of passive cooling in office buildings based on 54 uncertainty and sensitivity analysis. Solar Energy, 84(8), 1453-1467. 55
SECOND-ORDER DRAFT IPCC WGII AR5 Chapter 23
Do Not Cite, Quote, or Distribute 50 28 March 2013
Brijs, T., D. Karlis, and G. Wets, 2008: Studying the effect of weather conditions on daily crash counts using a 1 discrete time-series model. Accident Analysis and Prevention, 40(3), 1180-1190. 2
Brimblecombe, P., M.C. Grossi, and I. Harris, 2006: Climate change critical to cultural heritage. In: Heritage 3 Weathering and Conservation. Taylor and Francis, London, UK, pp. 387-393. 4
Brimblecombe, P. and C.M. Grossi, 2008: Millennium-long recession of limestone facades in London. 5 Environmental Geology, 56(3-4), 463-471. 6
Brimblecombe, P. and C.M. Grossi, 2009: Millennium-long damage to building materials in London. Science of the 7 Total Environment, 407(4), 1354-1361. 8
Brimblecombe, P., 2010a: Climate Change and Cultural Heritage. In: Heritage Climatology . [Lefevre, R.-. and C. 9 Sabbioni(eds.)]. Edipuglia, Bari, Italy, pp. 49-56. 10
Brimblecombe, P., 2010b: Mapping heritage climatologies. In: Effect of Climate Change on Built Heritage . 11 [Bunnik, T., H. de Clercq, R. van Hees, H. Schellen, and L. Schueremans(eds.)]. WTA Publications, 12 Pfaffenhofen, Germany, pp. 18-30. 13
Brimblecombe, P. and C.M. Grossi, 2010: Potential damage to modern building materials from 21st century air 14 pollution. The Scientific World Journal, 10, 116-125. 15
Brisson, N., P. Gate, D. Gouache, G. Charmet, F. Oury, and F. Huard, 2010: Why are wheat yields stagnating in 16 Europe? A comprehensive data analysis for France. Field Crops Research, 119(1), 201-212. 17
Brohan, P., J.J. Kennedy, I. Harris, S.F.B. Tett, and P.D. Jones, 2006: Uncertainty estimates in regional and global 18 observed temperature changes: a newdataset from 1850. Journal of Geophysical Research, 111(D12106). 19
Brouwer, S., T. Rayner, and D. Huitema, 2013: Mainstreaming climate policy: The case of climate adaptation and 20 the implementation of EU water policy. Environment and Planning C . 21
Brown, S., S. Hanson, and R.J. Nicholls, 2013: null. In: Implications of sea-level rise and extreme events around 22 Europe: a review of coastal energy infrastructure. Submitted to Climatic Change. 23
Bubeck, P., H. De Moel, L.M. Bouwer, and J.C.J. H. Aerts, 2011: How reliable are projections of future flood 24 damage? Natural Hazards and Earth System Science, 11(12), 3293-3306. 25
Buestel, D., M. Ropert, J. Prou, and Goulletquer, 2009: History, status and future of oyster culture in France. 26 Journal of Shellfish Research, 28(4), 813-820. 27
Bulkeley, H., 2010: Cities and the Governing of Climate Change. Annual Review of Environment and Resources, 35, 28 229-253. 29
Busch, G., 2006: Future European agricultural landscapes - What can we learn from existing quantitative land use 30 scenario studies? Agriculture, Ecosystems and Environment, 114(1), 121-140. 31
Butchart, S.H.M., M. Walpole, B. Collen, A. Van Strien, J.P.W. Scharlemann, R.E.A. Almond, J.E.M. Baillie, B. 32 Bomhard, C. Brown, J. Bruno, K.E. Carpenter, G.M. Carr, J. Chanson, A.M. Chenery, J. Csirke, N.C. 33 Davidson, F. Dentener, M. Foster, A. Galli, J.N. Galloway, P. Genovesi, R.D. Gregory, M. Hockings, V. Kapos, 34 J.-. Lamarque, F. Leverington, J. Loh, M.A. McGeoch, L. McRae, A. Minasyan, M.H. Morcillo, T.E.E. 35 Oldfield, D. Pauly, S. Quader, C. Revenga, J.R. Sauer, B. Skolnik, D. Spear, D. Stanwell-Smith, S.N. Stuart, A. 36 Symes, M. Tierney, T.D. Tyrrell, J.-. Vié, and R. Watson, 2010: Global biodiversity: Indicators of recent 37 declines. Science, 328(5982), 1164-1168. 38
Butterworth, M.H., M.A. Semenov, A. Barnes, D. Moran, J.S. West, and B.D.L. Fitt, 2010: North-South divide: 39 contrasting impacts of climate change on crop yields in Scotland and England. Journal of the Royal Society 40 Interface, 7(42), 123-130. 41
Caffarra, A., M. Rinaldi, E. Eccela, V. Rossi, and I. Pertota, 2012: Modelling the impact of climate change on the 42 interaction between grapevine and its pests and pathogens: European grapevine moth and powdery mildew. 43 Agriculture, Ecosystems & Environment, 148, 89-101. 44
Calanca, P., A. Roesch, K. Jasper, and M. Wild, 2006: Global Warming and the Summertime Evapotranspiration 45 Regime of the Alpine Region. Climatic Change, 79(1-2), 65-78. 46
Callaway, R., A.P. Shinn, S.E. Grenfell, J.E. Bron, and G. Burnell, 2012: Review of climate change impacts on 47 marine aquaculture in the UK and Ireland. 421, 389-421. 48
Camia, A. and G. Amatulli, 2009: Weather factors and fire danger in the Mediterranean. . In: Earth observation of 49 wildland fires in Mediterranean ecosystems. . [Chuvieco, E. (ed.)]. Springer, Berlin, pp. 71-82. 50
Caminade, C., J.M. Medlock, S. leach, K.M. McIntyre, M. Baylis, and A.P. Morse, 2012: Climate suitability of the 51 Asian tiger mosquito Aedes Albopictus in Europe: recent trends and future scenarios. Journal of the Royal 52 Society Interface, . 53
Camps, J.O. and M.C. Ramos, 2012: Grape harvest and yield responses to inter-annual changes in temperature and 54 precipitation in an area of north-east Spain with a Mediterranean climate. International Journal of 55 Biometeorology, , 853-864. 56
SECOND-ORDER DRAFT IPCC WGII AR5 Chapter 23
Do Not Cite, Quote, or Distribute 51 28 March 2013
Cantarel, A.M., J.M.G. Bloor, and J. Soussana, 2013: Four years of simulated climate change reduces above-ground 1 productivity and alters functional diversity in a grassland ecosystem. Journal of Vegetation Science, 24, 113-2 126. 3
Carmo, M., F. Moreira, P. Casimiro, and P. Vaz, 2011: Land use and topography influences on wildfire occurrence 4 in northern Portugal. Landscape and Urban Planning, 100(1-2), 169-176. 5
Carnicer, J., M. Coll, M. Ninyerola, X. Pons, G. Sánchez, and J. Peñuelas, 2011: Widespread crown condition 6 decline, food web disruption, and amplified tree mortality with increased climate change-type drought. 7 Proceedings of the National Academy of Sciences, 108, 1474-1478. 8
Carter, J.G., 2011: Climate change adaptation in European cities. Current Opinion in Environmental Sustainability, 9 3(3), 193-198. 10
Carvalho, A., A. Monteiro, M. Flannigan, S. Solman, A.I. Miranda, and C. Borrego, 2011: Forest fires in a changing 11 climate and their impacts on air quality. Atmospheric Environment, 45(31), 5545-5553. 12
Casalegno, S., G. Amatulli, A. Bastrup-Birk, and T. Houston, 2007: Modelling Current and Future Distribution of 13 European Forest Categories. In: Proceedings of the 6th European Conference on Ecological Modelling: 14 Challenges for ecological modelling in a changing world: Global Changes, Sustainability and Ecosystem Based 15 Management . 16
Castebrunet, H., N. Eckert, and G. Giraud, 2012: Snow and weather climatic control on snow avalanche occurrence 17 fluctuations over 50 yr in the French Alps. Climate of the Past, 8(2), 855-875. 18
CEA, 2007: Reducing the social and economic impact of climate change and natural catastrophes: insurance 19 solutions and public-private partnerships. European Commission, Brussels, Belgium, pp. 1-48. 20
CEA, 2009: Tackling climate change: the vital contribution of insurers. European Commission, Brussels, Belgium, 21 pp. 1-64. 22
Cellamare, M., M. Leitao, M. Coste, A. Dutartre, and J. Haury, 2010: Tropical phytoplankton taxa in Aquitaine 23 lakes (France). Hydrobiologia, 639(1), 129-145. 24
Charles, E., D. Idier, J. Thiebot, G. Le Cozannet, R. Pedreros, F. Ardhuin, and S. Planton, 2012: Present wave 25 climate in the Bay of Biscay: Spatiotemporal variability and trends from 1958 to 2001. Journal of Climate, 25, 26 2020-2035. 27
Charlton, M.B. and N.W. Arnell, 2011: Adapting to climate change impacts on water resources in England - an 28 assessment of draft Water Resources Management Plans. Global Environmental Change, 21(1), 238-248. 29
Chatterton, J., C. Viavattene, J. Morris, E. Penning-Rowsell, and S. Tapsell, 2010: The costs of the summer 2007 30 floods in England. Project: SC070039/R1. Environment Agency, Bristol, . 31
Cheaib, A., V. Badeau, J. Boe, I. Chuine, C. Delire, E. Dufrêne, C. François, E.S. Gritti, M. Legay, C. Pagé, W. 32 Thuiller, N. Viovy, and P. Leadley, 2012: Climate change impacts on tree ranges: model intercomparison 33 facilitates understanding and quantification of uncertainty. Ecology Letters, 15(6), 533-544. 34
Cheung, W.W.L., V.W.Y. Lam, J.L. Sarmiento, K. Kearney, R. Watson, D. Zeller, and D. Pauly, 2010: Large-scale 35 redistribution of maximum fisheries catch potential in the global ocean under climate change. Global Change 36 Biology, 16(1), 24-35. 37
Cheung, W.W.L., V.W.Y. Lam, J.L. Sarmiento, K. Kearney, R. Watson, and D. Pauly, 2009: Projecting global 38 marine biodiversity impacts under climate change scenarios. Fish and Fisheries, 10(3), 235-251. 39
Chevalier, V., M. Pepin, L. Plee, and R. Lancelot, 2010: Rift Valley fever - a threat for Europe? Eurosurveillance, 40 15(10), 18-28. 41
Chiriacò, M.V., L. Perugini, D. Cimini, E. D’Amato, R. Valentini, G. Bovio, P. Corona, and A. Barbati, 2013: 42 Comparison of approaches for reporting forest fire-related biomass loss and greenhouse gas emissions in 43 Southern Europe. International Journal of Wildland Fire, accepted on 31st dec 2012(in press). 44
Choat, B., S. Jansen, T.J. Brodribb, H. Cochard, S. Delzon, R. Bhaskar, S.J. Bucci, T.S. Feild, S.M. Gleason, U.G. 45 Hacke, A.L. Jacobsen, F. Lens, H. Maherali, J. Martínez-Vilalta, S. Mayr, M. Mencuccini, P.J. Mitchell, A. 46 Nardini, J. Pittermann, R.B. Pratt, J.S. Sperry, M. Westoby, I.J. Wright, and A.E. Zanne, 2012: Global 47 convergence in the vulnerability of forests to drought. Nature, 491(7426), 752-755. 48
Chow, D.H. and G.J. Levermore, 2010: The effects of future climate change on heating and cooling demands in 49 office buildings in the UK. Building Services Engineering Research and Technology, 31(4), 307-323. 50
Christidis, N., G.C. Donaldson, and P.A. Stott, 2010: Causes for the recent changes in cold- and heat-related 51 mortality in England and Wales. Climatic Change, 102(3-4), 539-553. 52
Christierson, B.V., J.-. Vidal, and S.D. Wade, 2012: Using UKCP09 probabilistic climate information for UK water 53 resource planning. Journal of Hydrology, 424-425, 48-67. 54
Ciais, P., M. Reichstein, N. Viovy, A. Granier, J. Ogee, V. Allard, M. Aubinet, N. Buchmann, C. Bernhofer, A. 55 Carrara, F. Chevallier, N. De Noblet, A.D. Friend, P. Friedlingstein, T. Grunwald, B. Heinesch, P. Keronen, A. 56
SECOND-ORDER DRAFT IPCC WGII AR5 Chapter 23
Do Not Cite, Quote, or Distribute 52 28 March 2013
Knohl, G. Krinner, D. Loustau, G. Manca, G. Matteucci, F. Miglietta, J.M. Ourcival, D. Papale, K. Pilegaard, S. 1 Rambal, G. Seufert, J.F. Soussana, M.J. Sanz, E.D. Schulze, T. Vesala, and R. Valentini, 2005: Europe-wide 2 reduction in primary productivity caused by the heat and drought in 2003. Nature, 437(7058), 529-533. 3
CIESM, 2008: N° 36 in CIESM Workshop Monographs. In: Impacts of acidification on biological, chemical and 4 physical systems in the Mediterranean and Black Seas [F. Briand Ed.], Monaco., pp. 124. 5
Ciscar, J.C., A. Iglesias, L. Feyen, L. Szabó, D. Van Regemorter, B. Amelung, R. Nicholls, P. Watkiss, O.B. 6 Christensen, R. Dankers, L. Garrote, C.M. Goodess, A. Hunt, A. Moreno, J. Richards, and A. Soria, 2011: 7 Physical and economic consequences of climate change in Europe. 8 . Proceedings of the National Academy of Sciences of the United States of America, 108(7), 2678-2683. 9
Ciscar, J.C., 2009: Climate change impacts in Europe. . In: Final report of the PESETA research project. JRC 10 Scientific and Technical Reports, pp. 1-130. 11
Clark, J.M., H.G. Orr, J. Freer, J.I. House, P. Smith, and C. Freeman, 2010a: Assessment of projected changes in 12 upland environments using simple climatic indexes. Climate Research, 45, 87-104. 13
Clark, J.M., A. Gallego-Sala, T.E.H. Allott, S. Chapman, T. Farewell, C. Freeman, J.I. House, H.G. Orr, I.C. 14 Prentice, and P. Smith, 2010b: Assessing the vulnerability of blanket peat in Great Britain to climate change 15 using an ensemble of statistical bioclimatic envelope models. Climate Research, 45, 131-150. 16
Clemo, K., 2008: Preparing for climate change: Insurance and small business. Geneva Papers on Risk and 17 Insurance: Issues and Practice, 33(1), 110-116. 18
Cogan, D.G., 2008: Corporate Governance and Climate Change: The Banking Sector. In: Ceres Report. Ceres, 19 Boston, pp. 1-64. 20
Coll, M., C. Piroddi, C. Albouy, F. Ben Rais Lasram, W.W.L. Cheung, V. Christensen, V.S. Karpouzi, F. 21 Guilhaumon, D. Mouillot, M. Paleczny, M.L. Palomares, J. Steenbeek, P. Trujillo, R. Watson, and D. Pauly, 22 2012: The Mediterranean Sea under siege: Spatial overlap between marine biodiversity, cumulative threats and 23 marine reserves. Global Ecology and Biogeography, 21(4), 465-480. 24
Conraths, F.J. and T.C. Mettenleiter, 2011: Globalisation and change of climate: Growing risk for livestock 25 epidemics in Germany [Globalisierung und Klimawandel: Steigendes Risiko für Tierseuchen in Deutschland]. 26 Zuchtungskunde, 83(1), 21-26. 27
Corobov, R.S., N. Sheridan, and K. Ebi, 2011 (in press): Heat-related mortality in Moldova. International Journal of 28 Climatology, . 29
Corti, T., V. Muccione, P. Kollner-Heck, D. Bresch, and S.I. Seneviratne, 2009: Simulating past droughts and 30 associated building damages in France. Hydrology and Earth System Sciences, 13(9), 1739-1747. 31
Costello, M.J., M. Coll, R. Danovaro, P. Halpin, H. Ojaveer, and P. Miloslavich, 2010: A census of marine 32 biodiversity knowledge, resources, and future challenges. PLoS ONE, 5(8). 33
Coumou, D. and S. Rahmstorf, 2012: A decade of weather extremes. Nature Climate Change, . 34 Crescio, M.I., F. Forastiere, C. Maurella, F. Ingravalle, and G. Ru, 2010: Heat-related mortality in dairy cattle: A 35
case crossover study. Preventative Veterinary Medicine, 97, 191-197. 36 Crichton, D., 2006: Climate change and its effects on small business in the UK . AXA Insurance UK, UK, pp. 1-46. 37 Crichton, D., 2007: The Hull floods of June 2007. Some insurance industry implications. 38 Crozier, M., 2010: Deciphering the effect of climate change on landslide activity: A review. Geomorphology, 124(3-39
4), 260-267. 40 Crump, D., A. Dengel, and M. Swainson, 2009: Indoor air quality in highly energy efficient homes - a review. 41
Report NF18. NHBC Foundation, IHS BRE Press., Milton Keynes. 42 Daccache, A. and N. Lamaddalena, 2010: Climate change impacts on pressurised irrigation systems. Proceedings of 43
the Institution of Civil Engineers-Engineering Sustainability, 163(2), 97-105. 44 Daccache, A., C. Keay, R.J.A. Jones, E.K. Weatherhead, M.A. Stalham, and J.W. Knox, 2012: Climate change and 45
land suitability for potato production in England and Wales: Impacts and adaptation. Journal of Agricultural 46 Science, 150(2), 161-177. 47
Dammers, E., 2010: Making territorial scenarios for Europe. Futures, 42, 785-793. 48 Dankers, R., O.B. Christensen, L. Feyen, M. Kalas, and A. de Roo, 2007: Evaluation of very high-resolution climate 49
model data for simulating flood hazards in the Upper Danube Basin. Journal of Hydrology, 347(3-4), 319-331. 50 Dankers, R. and L. Feyen, 2008: Climate change impact on flood hazard in Europe: An assessment based on high-51
resolution climate simulations. Journal of Geophysical Research, 113, D19105. 52 Daufresne, M., K. Lengfellner, and U. Sommer, 2009: Global warming benefits the small in aquatic ecosystems. 53
Proceedings of the National Academy of Sciences of the United States of America, 106(31), 12788-93. 54 Davies, M. and T. Oreszczyn, 2012: The unintended consequences of decarbonising the built environment: A UK 55
case study . Energy and Buildings, 46, 80-85. 56
SECOND-ORDER DRAFT IPCC WGII AR5 Chapter 23
Do Not Cite, Quote, or Distribute 53 28 March 2013
Davoudi, S., M. Wishardt, and I. Strange, 2010: The ageing of Europe: Demographic scenarios of Europe’s futures . 1 Futures, 42, 794-803. 2
Dawson, R.J., T. Ball, J. Werritty, A. Werritty, J.W. Hall, and N. Roche, 2011: Assessing the effectiveness of non-3 structural flood management measures in the Thames Estuary under conditions of socio-economic and 4 environmental change. Global Environmental Change, 21, 628-646. 5
Day, A.R., P.G. Jones, and G.G. Maidment, 2009: Forecasting future cooling demand in London. Energy and 6 Buildings, 41(9), 942-948. 7
Day, J.W., R.R. Christian, D.M. Boesch, A. Yáñez-Arancibia, J. Morris, R.R. Twilley, L. Naylor, L. Schaffner, and 8 C. Stevenson, 2008: Consequences of climate change on the ecogeomorphology of coastal wetlands. Estuaries 9 and Coasts, 31(3), 477-491. 10
De Freitas, C.R., D. Scott, and G. McBoyle, 2008: A second generation climate index for tourism (CIT): 11 specification and verification. International Journal of Biometeorology, 52(5), 399-407. 12
de Graaff, M.-., C. Van Kessel, and J. Six, 2009: Rhizodeposition-induced decomposition increases N availability to 13 wild and cultivated wheat genotypes under elevated CO2. Soil Biology & Biochemistry, 41, 1094-1103. 14
de Moel, H., J. van Alphen, and J.C.J.H. Aerts, 2009: Flood maps in Europe – methods, availability and use. Natural 15 Hazards and Earth System Sciences, 9(2), 289-301. 16
De Wit, M., M. Londo, and A. Faaij, 2011: Productivity developments in European agriculture: Relations to and 17 opportunities for biomass production. Renewable and Sustainable Energy Reviews, 15(5), 2397-2412. 18
Debernard, J.B. and L.P. Rÿed, 2008: Future wind, wave and storm surge climate in the Northern Seas: a revisit. 19 Tellus A, 60(3), 427-438. 20
del Barrio, G., P.A. Harrison, P.M. Berry, N. Butt, M.E. Sanjuan, R.G. Pearson, and T. Dawson, 2006: Integrating 21 multiple modelling approaches to predict the potential impacts of climate change on species' distributions in 22 contrasting regions: Comparison and implications for policy. Environmental Science and Policy, 9(2), 129-147. 23
Del Rio, S., L. Herrero, R. Fraile, and A. Penas, 2011: Spatial distribution of recent rainfall trends in Spain (1961-24 2006). International Journal of Climatology, 31(5), 656-667. 25
Della Bella, V., M. Bazzanti, M.G. Dowgiallo, and M. Iberite, 2008: Macrophyte diversity and physico-chemical 26 characteristics of Tyrrhenian coast ponds in central Italy: Implications for conservation. Hydrobiologia, 597(1), 27 85-95. 28
Dell'Aquila, A., S. Calmanti, P.M. Ruti, M.V. Struglia, G. Pisacane, A. Carillo, and G. Sannino, 2012: Impacts of 29 seasonal cycle fluctuations over the Euro-Mediterranean area using a Regional. Climate Research, 52, 135-157. 30
Delpla, I., E. Baurès, A.-. Jung, and O. Thomas, 2011: Impacts of rainfall events on runoff water quality in an 31 agricultural environment in temperate areas. Science of the Total Environment, 409, 1683-1688. 32
Delta Committee, 2008: Final Report - Working with water. Secretariat Delta Committee. 33 Demirel, E. (ed.), 2011: Economic Models for Inland Navigation in the Context of Climate Change . Diss. Ph.D., 34
VU University, Amsterdam, the Netherlands, . 35 Denstadli, J.M., J.K.S. Jacobsen, and M. Lohmann, 2011: Tourist perceptions of summer weather in Scandinavia. 36
Annals of Tourism Research, 38(3), 920-940. 37 Dessai, S. and M. Hulme, 2007: Assessing the robustness of adaptation decisions to climate change uncertainties: A 38
case study on water resources management in the East of England. Global Environmental Change, 17(1), 59-72. 39 Devictor, V., R. Julliard, D. Couvet, and F. Jiguet, 2008: Birds are tracking climate warming, but not fast enough. 40
Proceedings of the Royal Society B: Biological Sciences, 275, 2743-2748. 41 Dixon, N. and E. Brook, 2007: Impact of predicted climate change on landslide reactivation: case study of Mam Tor. 42
UK Landslides, 4, 137-147. 43 Dobney, K., C.J. Baker, L. Chapman, and A.D. Quinn, 2010: The future cost to the United Kingdom's railway 44
network of heat-related delays and buckles caused by the predicted increase in high summer temperatures 45 owing to climate change. Proceedings of the Institution of Mechanical Engineers, Part FL Journal of Rail and 46 Rapid Transit, 224(1), 25-34. 47
Dolinar, M., B. Vidrih, L. Kajfež-Bogataj, and S. Medvec, 2010: Predicted changes in energy demands for heating 48 and cooling due to climate change. Physics and Chemistry of the Earth, 35(1-2), 100-106. 49
Donat, M.G., G.C. Leckebusch, J.G. Pinto, and U. Ulbrich, 2010: European storminess and associated circulation 50 weather types: future changes deduced from a multi-model ensemble of GCM simulations. Climate Research, 51 42(1), 27-43. 52
Donat, M.G., G.C. Leckebusch, S. Wild, and U. Ulbrich, 2011: Future changes in European winter storm losses and 53 extreme wind speeds inferred from GCM and RCM multi-model simulations. Natural Hazards and Earth 54 System Sciences, 11(5), 1351-1370. 55
SECOND-ORDER DRAFT IPCC WGII AR5 Chapter 23
Do Not Cite, Quote, or Distribute 54 28 March 2013
Donatelli, M., A.K. Srivastava, G. Duveiller, and S. Niemeyer, 2012: Estimating Impact Assessment and Adaptation 1 Strategies under Climate Change Scenarios for Crops at EU27 Scale. Iemss.Org, . 2
Doney, S.C., M. Ruckelshaus, J. Emmett Duffy, J.P. Barry, F. Chan, C.A. English, H.M. Galindo, J.M. Grebmeier, 3 A.B. Hollowed, N. Knowlton, J. Polovina, N.N. Rabalais, W.J. Sydeman, and L.D. Talley, 2011: Climate 4 Change impacts on marine ecosystems. Annual Review of Marine Science, 4, 11-37. 5
Doyon, B., D. Bélanger, and P. Gosselin, 2008: The potential impact of climate change on annual and seasonal 6 mortality for three cities in Québec, Canada. International Journal of Health Geographics, 7(23). 7
Drenkhan, R., T. Kurkela, and M. Hanso, 2006: The relationship between the needle age and the growth rate in 8 Scots pine (Pinus sylvestris): a retrospective analysis by needle trace method (NTM). European Journal of 9 Forest Research, 125, 397-405. 10
Dreyfus, M. and A. Patt, 2012: The European Commission White Paper on adaptation: Appraising its strategic 11 success as an instrument of soft law. Mitigation and Adaptation Strategies for Global Change, 17(8), 849-863. 12
Duarte Alonso, A. and M.A. O’Neill, 2011: Climate change from the perspective of Spanish wine growers : a three-13 region study. British Food Journal, 113(2), 205-221. 14
Ducharne, A., F. Habets, C. Pagé , E. Sauquet, P. Viennot , M. Déqué , S. Gascoin, A. Hachour, E. Martin, L. 15 Oudin, L. Terray, and D. Thiéry, 2010: 16 Climate change impacts on water resources and hydrological extremes in northern France.[Carrera, J.(. (ed.)]. 17 Proceedings of XVIII International Conference on Water Resources, CIMNE, Barcelona, . 18
Ducharne, A., C. Baubion, N. Beaudoin, M. Benoit, G. Billen, N. Brisson, J. Garnier, H. Kieken, S. Lebonvallet, E. 19 Ledoux, B. Mary, C. Mignolet, X. Poux, E. Sauboua, C. Schott, S. Thery, and P. Viennot, 2007: Long term 20 prospective of the Seine River system: Confronting climatic and direct anthropogenic changes. Science of the 21 Total Environment, 375(1-3), 292-311. 22
Ducharne, A., 2008: Importance of stream temperature to climate change impact on water quality. Hydrology & 23 Earth System Sciences, 12(3), 797-810. 24
Duchêne, E., F. Huard, V. Dumas, C. Schneider, and D. Merdinoglu, 2010: The challenge of adapting grapevine 25 varieties to climate change. 26 . Climate Research, 41(3), 193-204. 27
Duguy, B., S. Paula, J.G. Pausas, J.A. Alloza, T. Gimeno, and R.V. Vallejo, 2012 (in press): Effects of climate and 28 extreme events on wildfire regime and their ecological impacts 29 . In: Regional Assessment of Climate Change in the Mediterranean. A. Navarra, L.Tubiana (eds.), Springer, 30 Dordrecht, The Netherlands, . 31
Dullinger, S., A. Gattringer, W. Thuiller, D. Moser, N.E. Zimmermann, A. Guisan, W. Willner, C. Plutzar, M. 32 Leitner, T. Mang, M. Caccianiga, T. Dirnböck, S. Ertl, A. Fischer, J. Lenoir, J.-. Svenning, A. Psomas, D.R. 33 Schmatz, U. Silc, P. Vittoz, and K. Hülber, 2012: Extinction debt of high-mountain plants under twenty-first-34 century climate change. Nature Climate Change, 2(8), 619-622. 35
Dumollard, G. and A. Leseur, 2011: Drawing up a national adaptation policy: feedback on five European case 36 studies. . In: null. CDC Climat Research report, Paris. 37
Durant, J.M., D.O. Hjermann, G. Ottersen, and N.C. Stenseth, 2007: Climate and the match or mismatch between 38 predator requirements and resource availability. Climate Research, 33(3), 271-283. 39
Dury, M., A. Hambuckers, P. Warnant, A. Henrot, E. Favre, M. Ouberdous, and L. François, 2011: Responses of 40 European forest ecosystems to 21stcentury climate: assessing changes in interannual variability and fire 41 intensity. . IForest, 4, 82-99 (doi: 10.3832/ifor0572-004). 42
Dworak, T., B. Elbersen, K. van Diepen, I. Staritsky, D. van Kraalingen, I. Suppit, M. Berglund, T. Kaphengst, C. 43 Laaser, and M. Ribeiro, 2009: Assessment of inter-linkages between bioenergy development and water 44 availability. Ecologic. Vienna, Austria., Vienna, Austria, pp. 139-139. 45
E Silva, D., P. Rezende Mazzella, M. Legay, E. Corcket, and J.L. Dupouey, 2012: Does natural regeneration 46 determine the limit of European beech distribution under climatic stress? Forest Ecology and Management, 266, 47 263-272. 48
Easterling, W.E., P.K. Aggarwal, P. Batima, K.M. Brander, L. Erda, S.M. Howden, A. Kirilenko, J. Morton, J.-. 49 Soussana, J. Schmidhuber, and F.N. Tubiello, 2007: Food, fibre and forest products. In: Climate Change 2007: 50 Impacts, Adaptation and Vulnerability. Contribution of Working Group II to the Fourth Assessment Report of 51 the Intergovernmental Panel on Climate Change. [Parry, M.L., O.F. Canziani, J.P. . Palutikof, P.J. van der 52 Linden, and C. Hanson E.(eds.)]. Cambridge University Press, Cambridge, pp. 273-313. 53
EC, 2009a: White Paper: Adapting to climate change: Towards a European framework for action. 54 EC, 2009b: River basin management in a changing climate - a Guidance document. Guidance document No. 24, . 55
European Commission, Brussels, . 56
SECOND-ORDER DRAFT IPCC WGII AR5 Chapter 23
Do Not Cite, Quote, or Distribute 55 28 March 2013
EC, 2011: COMMUNICATION FROM THE COMMISSION TO THE EUROPEAN PARLIAMENT, THE COUNCIL, 1 THE ECONOMIC AND SOCIAL COMMITTEE AND THE COMMITTEE OF THE REGIONS. Our life 2 insurance, our natural capital: an EU biodiversity strategy to 2020. COM(2011) 244 final. European 3 Commission, Brussels. 4
ECDC, 2009: Technical report: Development of Aedes albopictus risk map. ECDC, Stockholm. 5 ECDC, 2011: Annual epidemiological report 2011 - Reporting on 2009 surveillance data and 2010 epidemic 6
intelligence data. ECDC, Stockholm, . 7 ECDC, 2012: The climatic suitability for dengue transmission in continental Europe. Technical Report. ECDC, 8
Stockholm . 9 ECHOES Country report, 2009: COST action FP0703 . Cacot, E.; Peyron,J.-L., pp. 41. 10 Eckert, N., E. Parent, R. Kies, and H. Baya, 2010: A spatio-temporal modelling framework for assessing the 11
fluctuations of avalanche occurrence resulting from climate change: Application to 60 years of data in the 12 Northern French Alps. Climatic Change, 101(3), 515-553. 13
EEA, 2008: Impacts of Europe's changing climate? 2008 indicator-based assessment. European Environment 14 Agency, Copenhagen, pp. 1-40. 15
EEA, 2009: Water resources across Europe — confronting water scarcity and drought. European Environment 16 Agency, Copenhagen, Report No 2/2009, 1-55. 17
EEA, 2010a: The European Environment: State and Outlook 2010. European Environment Agency, Copenhagen, 18 pp. 1-222. 19
EEA, 2010b: The European environment - State and outlook 2010 - Water resources: quantity and flows. EEA, 20 Copenhagen, pp. 1-32. 21
EEA, 2010b: Tracking progress towards Kyoto and 2020 targets in Europe . EEA, Copenhagen, pp. 4-112. 22 EEA, 2010e: 10 messages for 2010 Marine ecosystems. Marcus Zisenis (ECNC, ETC/BD) and Trine Christiansen 23
(EEA), Copenhagen, pp. 1-16. 24 EEA, 2011: Globalisation, Environment and you. In: Signals 2011. Office of the European Union, Copenhagen, 25
Denmark, pp. 1-72. 26 EEA, 2012: null. In: Climate change, impacts and vulnerability in Europe 2012, an indicator-based report pp. 302. 27 EEA-JRC-WHO, 2008: Impact of Europe's changing climate - 2008 indicator-based assessment. 28 ELME, 2007: European Lifestyles and Marine Ecosystems: Exploring challenges for managing Europe’s seas. O. 29
Langmead, A. McQuatters-Gollop and L.D. Mee (Eds.)., University of Plymouth Marine Institute, Plymouth, 30 UK., pp. 43pp. 31
Elzinga, J.A., S. van Nouhuys, D.-. van Leeuwen, and A. Biere, 2007: Distribution and colonisation ability of three 32 parasitoids and their herbivorous host in a fragmented landscape. Basic and Applied Ecology, 8(1), 75-88. 33
Endler, C., K. Oehler, and A. Matzarakis, 2010: Vertical gradient of climate change and climate tourism conditions 34 in the Black Forest. International Journal of Biometeorology, 54(1), 45-61. 35
Endler, C. and A. Matzarakis, 2011a: Analysis of high-resolution simulations for the black forest region from a point 36 of view of tourism climatology - a comparison between two regional climate models (REMO and CLM). 37 Theoretical and Applied Climatology, 103(3-4), 427-440. 38
Endler, C. and A. Matzarakis, 2011b: Climatic potential for tourism in the black forest, germany - winter season. 39 International Journal of Biometeorology, 55(3), 339-351. 40
Engler, R., C. Randin, W. Thuiller, S. Dullinger, N.E. Zimmermann, M.B. Araújo, P.B. Pearman, C.H. Albert, P. 41 Choler, X. de Lamo, T. Dirnböck, D. Gómez-García, J.-. Grytnes, E. Heegard, F. Høistad, G. Le Lay, D. 42 Nogues-Bravo, S. Normand, C. Piédalu, M. Puscas, M.-. Sebastià, A. Stanisci, J.-. Theurillat, M. Trivedi, P. 43 Vittoz, and A. Guisan, 2011: 21st century climate change threatens mountain flora unequally across Europe. 44 Global Change Biology, 17, 2330-2341. 45
Eskeland, G.S. and T.K. Mideksa, 2010: Electricity demand in a changing climate. Mitigation and Adaptation 48 Strategies for Global Change, 15(8), 877-897. 49
ESPACE, 2007: European Spatial Planning Adapting to Climate Events - Final Report., London. 50 Eugenio-Martin, J.L. and J.A. Campos-Soria, 2010: Climate in the region of origin and destination choice in 51
outbound tourism demand. Tourism Management, 31(6), 744-753. 52 European Parliament and Council, 2007: Directive of the European Parliament and of the Council of 23 October 53
2007 on the assessment and management of flood risks 2007/60/EC . 54 Eurostat, 2009: Forestry statistics. Luxembourg: Publications Office of the European Union Collection: 55
Pocketbooks, Theme: Agriculture and fisheries. 56
SECOND-ORDER DRAFT IPCC WGII AR5 Chapter 23
Do Not Cite, Quote, or Distribute 56 28 March 2013
Eurostat, 2011a: Migrants in Europe. A statistical portrait of the first and second generation. European Union, 1 Luxembourg, . 2
Eurostat, 2011b: Labour market statistics. European Union, Luxembourg, . 3 Falloon, P. and R. Betts, 2010: Climate impacts on European agriculture and water management in the context of 4
adaptation and mitigation-The importance of an integrated approach. Science of the Total Environment, 5 408(23), 5667-5687. 6
FAO, 2008: Climate change: implications for food safety. Food and Agriculture Organization, Rome, pp. 1-49. 7 Feehan, J., M. Harley, and J. Van Minnen, 2009: Climate change in Europe. 1. Impact on terrestrial ecosystems and 8
biodiversity. A review. Agronomy for Sustainable Development, 29(3), 409-421. 9 Fernandes, P.M., A. Luz, and C. Loureiro, 2010: Changes in wildfire severity from maritime pine woodland to 10
contiguous forest types in the mountains of northwestern Portugal. Forest Ecology and Management, 260(5), 11 883-892. 12
Ferrara, R.M., P. Trevisiol, M. Acutis, G. Rana, G.M. Richter, and N. Baggaley, 2010: Topographic impacts on 13 wheat yields under climate change: two contrasted case studies in Europe. Theoretical and Applied 14 Climatology, 99(1-2), 53-65. 15
Ferron, C., D. Trewick, P. Le Conte, E.R. Batard, and L. Girard, 2006: Heat stroke in hospital patients during the 16 summer 2003 heat wave: a nosocomial disease. Presse Medicale, 25(2), 196-199. 17
Feyen, L., R. Dankers, K. Bódis, P. Salamon, and J.I. Barredo, 2012: Fluvial flood risk in Europe in present and 18 future climates. Climatic Change, 112, 47-62. 19
Feyen, L., J.I. Barredo, and R. Dankers, 2009: Implications of global warming and urban land use change on 20 flooding in Europe . 21
Feyen, L. and R. Dankers, 2009: Impact of global warming on streamflow drought in Europe. Journal of 22 Geophysical Research D: Atmospheres, 114(17). 23
Filz, K.J., J.O. Engler, J. Stoffels, M. Weitzel, and T. Schmitt, 2012: Missing the target? A critical view on butterfly 24 conservation efforts on calcareous grasslands in south-western Germany. Biodiversity and Conservation, , 1-19. 25
Finger, R., W. Hediger, and S. Schmid, 2011: Irrigation as adaptation strategy to climate change-a biophysical and 26 economic appraisal for Swiss maize production. Climatic Change, 105(3-4), 509-528. 27
Fischer, D., S.M. Thomas, and C. Beierkuhnlein, 2010a: Temperature-derived potential for the establishment of 28 phlebotomine sandflies and visceral leishmaniasis in Germany. Geospatial Health, 5(1), 59-69. 29
Fischer, G., S. Prieler, H. van Velthuizen, G. Berndes, A. Faaij, M. Londo, and M. de Wit, 2010b: Biofuel 30 production potentials in Europe: Sustainable use of cultivated land and pastures, Part II: Land use scenarios. 31 Biomass and Bioenergy, 34(2), 173-187. 32
Fischer, L., R. Purves, C. Huggel, J. Noetzli, and W. Haeberli, 2011: On the influence of geological, topographic 40 33 and glaciological factors on slope instabilities: analyses of recent Alpine rock avalanches. Natural Hazards and 34 Earth System Science, . 35
Fisher, D., C. Thomas, F. Niemitz, and C. Reineking, 2011: Projection of Climate suitability for Aedes albopictus 36 Skuse (Culicidae) in Europe under climate change conditions. Global and Planetary Change, 78, 54-65. 37
Fitzgerald, D.W., T.R. Sterling, and D.W. Haas, 2010: Mycobacterium tuberculosis. In: Principle and Practice of 38 Infectious Diseases. Mandell, G.L., J.E. Bennett and R. Dolin (Eds.). 7th Edn., Churchill Livingstone, 39 Philadelphia, USA, pp. 3129-3263. 40
Floc'h, P.L., J.-. Poulard, O. Thébaud, F. Blanchard, J. Bihel, and F. Steinmetz, 2008: Analyzing the market position 41 of fish species subject to the impact of long-term changes: A case study of French fisheries in the Bay of 42 Biscay. Aquatic Living Resources, 21(3), 307-316. 43
Forkel, R. and R. Knoche, 2006: Regional climate change and its impact on photo-oxidant concentrations in 44 sourthern Germany: simulations with a coupled regional climate-chemistry model. Journal of Geophysical 45 Research Atmospheres, 111(D12). 46
Forkel, R. and R. Knoche, 2007: Nested regional climate-chemistry simulations for central Europe. Comptes Rendus 47 Geoscience, 339(11-12), 734-746. 48
Förster, H. and J. Lilliestam, 2010: Modeling thermoelectric power generation in view of climate change. Regional 49 Environmental Change, 10(4), 327-338. 50
Fronzek, S., M. Luoto, and T.R. Carter, 2006: Handbook of Environmental Chemistry, Volume 5: Water Pollution. 51 In: Potential effect of climate change on the distribution of palsa mires in subarctic Fennoscandia pp. 1-12. 52
Fronzek, S., T.R. Carter, J. Räisänen, L. Ruokolainen, and M. Luoto, 2010: Applying probabilistic projections of 53 climate change with impact models: A case study for sub-arctic palsa mires in Fennoscandia. Climatic Change, 54 99(3), 515-534. 55
SECOND-ORDER DRAFT IPCC WGII AR5 Chapter 23
Do Not Cite, Quote, or Distribute 57 28 March 2013
Fronzek, S., T.R. Carter, and M. Luoto, 2011: Evaluating sources of uncertainty in modelling the impact of 1 probabilistic climate change on sub-arctic palsa mires. Natural Hazards and Earth System Science, 11(11), 2 2981-2995. 3
Fronzek, S., T.R. Carter, and K. Jylhä, 2012: Representing two centuries of past and future climate for assessing 4 risks to biodiversity in Europe. Global Ecology and Biogeography, 21(1), 19-35. 5
Fuhrer, J., 2009: Ozone risk for crops and pastures in present and future climates. Naturwissenschaften, 96(2), 173-6 194. 7
Fujihara, Y., K. Tanaka, T. Watanabe, T. Nagano, and T. Kojiri, 2008: Assessing the impacts of climate change on 8 the water resources of the Seyhan River Basin in Turkey: Use of dynamically downscaled data for hydrologic 9 simulations. Journal of Hydrology, 353(1-2), 33-48. 10
Furrer, B., V. Hoffmann, and M. Swoboda, 2009: Banking & Climate Change: Opportunities and Risks. . SAM, 11 ETH, and ZHAW., pp. 1-51. 12
Gale, P., B. Stephenson, A. Brouwer, M. Martinez, A. de la Torre, J. Bosch, M. Foley-Fisher, P. Bonilauri, A. 13 Lindström, R.G. Ulrich, C.J. de Vos, M. Scremin, Z. Liu, L. Kelly, and M.J. Muñoz, 2012: Impact of climate 14 change on risk of incursion of Crimean-Congo haemorrhagic fever virus in livestock in Europe through 15 migratory birds. Journal of Applied Microbiology, 112(2), 246-257. 16
Gallego-Sala, A.V., J.M. Clark, J.I. House, H.G. Orr, I.C. Prentice, P. Smith, T. Farewell, and S.J. Chapman, 2010: 17 Bioclimatic envelope model of climate change impacts on blanket peatland distribution in Great Britain. 18 Climate Research, 45, 151-162. 19
Gao, X. and F. Giorgi, 2008: Increased aridity in the Mediterranean region under greenhouse gas forcing estimated 20 from high resolution simulations with a regional climate model. Global and Planetary Change, 62(3-4), 195-21 209. 22
García-López J.M. and C. Alluéa, 2011: Modelling phytoclimatic versatility as a large scale indicator of adaptive 23 capacity to climate change in forest ecosystems. Ecological Modelling, 222(8), 1436-1447. 24
García-Ruiz, J.M., J.I. López-Moreno, S.M. Vicente-Serrano, T. Lasanta-Martínez, and S. Baguería, 2011: 25 Mediterranean water resources in a global change scenario. Earth-Science Reviews, 105(3-4), 121-139. 26
Gardiner, B., K. Blennow, J. Carnus, P. Fleischer, F. Ingemarson, G. Landmann, M. Lindner, M. Marzano, B. 27 Nicoll, C. Orazio, J. Peyron, M. Reviron, M. Schelhaas, A. Schuck, M. Spielmann, and T. Usbeck, 2010: 28 Destructive Storms in European Forests: Past and Forthcoming Impacts. Final report to European Commission 29 - DG Environment European Forest Institute, Atlantic European Regional Office - EFIATLANTIC, Bordeaux, 30 pp. 138-138. 31
Garza-Gil, M., J. Torralba-Cano, and M. Varela-Lafuente, 2010: Evaluating the economic effects of climate change 32 on the European sardine fishery. Regional Environmental Change, 11(1), 87-95. 33
Gaslikova, L., A. Schwerzmann, C.C. Raible, and T.F. Stocker, 2011: Future storm surge impacts on insurable 34 losses for the North Sea region. Natural Hazards and Earth System Sciences, 11(4), 1205-1216. 35
Genovesi, P., L. Carnevali, A. Alonzi, and R. Scalera, 2012: Alien mammals in Europe: Updated numbers and 36 trends, and assessment of the effects on biodiversity. Integrative Zoology, 7(3), 247-253. 37
GIA, 2011: The Climate Change Challange: Answers and Demands of German Insurers. . German Insurance 38 Association, Berlin, . 39
Giannakopoulos, C., P. Le Sager, M. Bindi, M. Moriondo, E. Kostopoulou, and C.M. Goodess, 2009: Climatic 40 changes and associated impacts in the Mediterranean resulting from a 2 oC global warming. Global and 41 Planetary Change, 68(3), 209-224. 42
Giannakopoulos, C., E. Kostopoulou, K.V. Varotsos, K. Tziotziou, and A. Plitharas, 2011: An integrated assessment 43 of climate change impacts for greece in the near future. Regional Environmental Change, , 1-15. 44
Gifford, R., L. Steg, and J.P. Reser, 2011: Environmental Pyschology. In: The IAAP Handbook of Applied 45 Psychology. [Martin, P.R., M.C. Cheung, L. Kyrios, M. Littlefield, J.B. Knowles, M. Overmier et al.(eds.)]. 46 Wiley-Blackwell., Chichester, pp. 440-471. 47
Gilgen, A.K., C. Signarbieux, U. Feller, and N. Buchmann, 2010: Competitive advantage of Rumex obtusifolius L. 48 might increase in intensively managed temperate grasslands under drier climate. Agriculture Ecosystems & 49 Environment, 135(1-2), 15-23. 50
Gill, S., J. Handley, R. Ennos, and S. Pauleit, 2007: Adapting cities for climate change: the role of the green 51 infrastructure. Built Environment, 33(1), 115-133. 52
Giuggiola, A., T.M. Kuster, and S. Saha, 2010: Drought-induced mortality of Scots pines at the southern limits of its 53 distribution in Europe: causes and consequences. Journal of Biogeosciences and Forestry, 3, 95-97. 54
Giuntoli, I., B. Renard, J.-. Vidal, and A. Bard, 2013: Low flows in France and their relationship to large-scale 55 climate indices. Journal of Hydrology, . 56
SECOND-ORDER DRAFT IPCC WGII AR5 Chapter 23
Do Not Cite, Quote, or Distribute 58 28 March 2013
GLA, , 2010: The draft climate change adaptation strategy for London, public consultation draft. Greater London 1 Authority . 2
Glenk, K. and A. Fisher, 2010: Insurance, prevention or just wait and see? Public preferences for water management 3 strategies in the context of climate change. Ecological Economics, 69, 2279-2291. 4
Goderniaux, P., S. Brouyére, S. Blenkinsop, A. Burton, H.J. Fowler, P. Orban, and A. Dassargues, 2011: Modeling 5 climate change impacts on groundwater resources using transient stochastic climatic scenarios. Water 6 Resources Research, 47(12). 7
Golombek, R., S. Kittlesen, and I. Haddeland, 2012: Climate change;impacts on electricity markets in Western 8 Europe. Climatic Change, 113, 357-370. 9
Gómez-Rodríguez, C., J. Bustamante, and C. Díaz-Paniagua, 2010: Evidence of hydroperiod shortening in a 10 preserved system of temporary ponds. Remote Sensing, 2(6), 1439-1462. 11
Gonzalez-Camacho, J., J.C. Mailhol, and F. Ruget, 2008: Local impact of increasing Co2 in the atmosphere on 12 maize crop water productivity in the Drome valley, France. Irrigation and Drainage, 57(2), 229-243. 13
Goode, J., 2012: Viticulture: Fruity with a hint of drought. Nature, 492(7429), 351-353. 14 Goodess, C., D. Jacob, M. Déqué, J. Guttiérrez, R. Huth, E. Kendon, G. Leckebusch, P. Lorenz, and V. Pavan, 2009: 15
Downscaling methods, data and tools for input to impacts assessments. In: ENSEMBLES: Climate Change and 16 its Impacts: Summary of research and results from the ENSEMBLES project. van der Linden P. & (eds.), J. M. 17 (Eds.), Met Office Hadley Centre, FitzRoy Road, Exeter EX1 3PB, UK, pp. 59-78. 18
Gottfried, M., H. Pauli, A. Futschik, M. Akhalkatsi, P. Barancok, J.L. Benito Alonso, G. Coldea, J. Dick, B. 19 Erschbamer, M.R. Fernández Calzado, G. Kazakis, J. Krajci, P. Larsson, M. Mallaun, O. Michelsen, D. 20 Moiseev, P. Moiseev, U. Molau, A. Merzouki, L. Nagy, G. Nakhutsrishvili, B. Pedersen, G. Pelino, M. Puscas, 21 G. Rossi, A. Stanisci, J.-. Theurillat, M. Tomaselli, L. Villar, P. Vittoz, I. Vogiatzakis, and G. Grabherr, 2012: 22 Continent-wide response of mountain vegetation to climate change. Nature Climate Change, 2, 111-115. 23
Graux, A.-., R. Lardy, G. Bellocchi, and J.-. Soussana, 2012: Global warming potential of French grassland-based 24 dairy livestock systems under climate change. Regional Environmental Change, , 1-13. 25
Gregory, P.J. and B. Marshall, 2012: Attribution of climate change: a methodology to estimate the potential 26 contribution to increases in potato yield in Scotland since 1960. Global Change Biology, , 1372-1388. 27
Grime, J.P., J.D. Fridley, A.P. Askew, K. Thompson, J.G. Hodgson, and C.R. Bennett, 2008: Long-term resistance 28 to simulated climate change in an infertile grassland. Proceedings of the National Academy of Sciences of the 29 United States of America, 105(29), 10028-10032. 30
Grossi, C.M., P. Brimblecombe, and I. Harris, 2007: Predicting long term freeze-thaw risks on Europe built heritage 31 and archaeological sites in a changing climate. Science of the Total Environment, 377(2-3), 273-281. 32
Grossi, C.M., P. Brimblecombe, and H. Lloyd, 2010: The effects of weather on visits to historic properties. Views, 33 47, 69-71. 34
Grossi, C.M., P. Brimblecombe, B. Mendez, D. Benavente, I. Harris, and M. Deque, 2011: Climatology of salt 35 transitions and implications for stone weathering. Science of the Total Environment, 409(13), 2577-2585. 36
Grossi, M.C., A. Bonazza, P. Brimblecombe, I. Harris, and C. Sabbioni, 2008: Predicting 21st century recession of 37 architectural limestone in European cities. Environmental Geology, 56(3-4), 455-461. 38
Guardiola-Albert, C. and C.R. Jackson, 2011: Potential Impacts of Climate Change on Groundwater Supplies to the 39 Doñana Wetland, Spain. Wetlands, 31(5), 907-920. 40
Guis, H., C. Caminade, C. Calvete, A.P. Morse, A. Tran, and M. Baylis, 2012: Modelling the effects of past and 41 future climate on the risk of bluetongue emergence in Europe. J R Soc Interface., 9(67), 339-350. 42
Haasnoot, M., H. Middelkoop, A. Offermans, E. van Beek, and W.P.A. van Deursen, 2012: Exploring pathways for 43 sustainable water management in river deltas in a changing environment. Climatic Change, 115(3-4), 795-819. 44
Haddeland, I., P.C. Røhr, and H. Udnæs, 2011: Effects of climate changes on water resources in the Glomma river 45 basin - Norway, Technical Report No. 27, ‘WATCH’ IP project (contract number: 036946)., pp. 1-17. 46
Haigh, I., R. Nicholls, and N. Wells, 2010: Assessing changes in extreme sea levels: Application to the English 47 Channel, 1900-2006. Continental Shelf Research, 30(9), 1042-1055. 48
Haines, A., P. Wilkinson, C. Tonne, and I. Roberts, 2009a: Aligning climate change and public health policies. The 49 Lancet, 374(9707), 2035-2038. 50
Haines, A., A.J. McMichael, K.R. Smith, I. Roberts, J. Woodcock, A. Markandya, B.G. Armstrong, D. Campbell-51 Lendrum, A.D. Dangour, M. Davies, N. Bruce, C. Tonne, M. Barrett, and P. Wilkinson, 2009b: Public health 52 benefits of strategies to reduce greenhouse-gas emissions: overview and implications for policy makers. The 53 Lancet, 374(9707), 2104-2114. 54
Haines-Young, R., M. Potschin, and F. Kienast, 2012: Indicators of ecosystem service potential at European scales: 55 Mapping marginal changes and trade-offs. Ecological Indicators, 21, 39-53. 56
SECOND-ORDER DRAFT IPCC WGII AR5 Chapter 23
Do Not Cite, Quote, or Distribute 59 28 March 2013
Hakala, K., A.O. Hannukkala, E. Huusela-Veistola, M. Jalli, and P. Peltonen-Sainio, 2011: Pests and diseases in a 1 changing climate: a major challenge for Finnish crop production. Agricultural and Food Science, 20(1), 3-14. 2
Hallegatte, S., F. Henriet, and J. Corfee-Morlot, 2008: The Economics of Climate Change Impacts and Policy 3 Benefits at City Scale: A Conceptual Framework . OECD Environment Working Papers no. 4, OECD 4 Publishing., . 5
Hallegatte, S., N. Ranger, O. Mestre, P. Dumas, J. Corfee-Morlot, C. Herweijer, and R. Wood, 2011: Assessing 6 climate change impacts, sea level rise and storm surge risk in port cities: a case study on Copenhagen. Climatic 7 Change, 104, 113-137. 8
Halpern, B.S., S. Walbridge, K.A. Selkoe, C.V. Kappel, F. Micheli, C. D'Agrosa, J.F. Bruno, K.S. Casey, C. Ebert, 9 H.E. Fox, R. Fujita, D. Heinemann, H.S. Lenihan, E.M.P. Madin, M.T. Perry, E.R. Selig, M. Spalding, R. 10 Steneck, and R. Watson, 2008: A global map of human impact on marine ecosystems. Science, 319, 948-952. 11
Halpern, B.S., C. Longo, D. Hardy, K.L. McLeod, J.F. Samhouri, S.K. Katona, K. Kleisner, S.E. Lester, J. O'Leary, 12 M. Ranelletti, A.A. Rosenberg, C. Scarborough, E.R. Selig, B.D. Best, D.R. Brumbaugh, F.S. Chapin, L.B. 13 Crowder, K.L. Daly, S.C. Doney, C. Elfes, M.J. Fogarty, S.D. Gaines, K.I. Jacobsen, L.B. Karrer, H.M. Leslie, 14 E. Neeley, D. Pauly, S. Polasky, B. Ris, K. St Martin, G.S. Stone, U.R. Sumaila, and D. Zeller, 2012: An index 15 to assess the health and benefits of the global ocean. Nature, 488(7413), 615-20. 16
Hames, J. and S. Vardoulakis, 2012: Climate Change Risk Assessment for the Health Sector. In: Climate Change 17 Risk Assessment, DEFRA, London. 18
Hamilton, J.M. and R.S.J. Tol, 2007: The impact of climate change on tourism in Germany, the UK and Ireland: a 19 simulation study. Regional Environmental Change, 7(3), 161-172. 20
Hamududu, B. and A. Killingtveit, 2012: Assessing climate change impacts on global hydropower. Energies, 5, 305-21 322. 22
Hanewinkel, M., D.A. Cullmann, M.-. Schelhaas, Nabuurs G.-J., and N.E. Zimmermann, 2012: Climate change may 23 cause severe loss in the economic value of European forest land. . Nature Climate Change, (10), 1-15. 24
Hansen, J., R. Ruedy, and M. Sato, 2010: Global surface temperature change 25 . Review of Geophysics, 48(RG4004), 1-29. 26
Hanso, M. and R. Drenkhan, 2007: Retrospective analysis of Lophodermium seditiosum epidemics in Estonia. Acta 27 Silvatica & Lignaria Hungarica, Special Issue, 31-45. 28
Hanson, S., R. Nicholls, N. Ranger, S. Hallegatte, J. Corfee-Morlot, C. Herweijer, and J. Chateau, 2011: A global 29 ranking of port cities with high exposure to climate extremes. Climatic Change, 104(1), 89-111. 30
Hardacre, C.J., P.I. Palmer, K. Baumanns, M. Rounsevell, and D. Murray-Rust, 2012: Probabilistic estimation of 31 future emissions of isoprene and surface oxidant chemistry associated with land use change in response to 32 growing food needs. Atmospheric Chemistry and Physics, Discussion paper 12, 33359-33410 33 (doi:10.5194/acpd-12-33359-2012). 34
Harrison, G.P., L.C. Cradden, and J.P. Chick, 2008: Preliminary assessment of climate change impacts on the UK 35 onshore wind energy resource. Energy Sources, Part A: Recovery, Utilization, and Environmental Effects, 36 30(14), 1286-1299. 37
Harrison, P.A., I.P. Holman, G. Cojocaru, K. Kok, A. Kontogianni, M. Metzger, and M. Gramberger, 2012: 38 Combining qualitative and quantitative understanding for exploring cross-sectoral climate change impacts, 39 adaptation and vulnerability in Europe. Regional Environmental Change, . 40
Harrison, P.A., M. Vandewalle, M.T. Sykes, P.M. Berry, R. Bugter, F. de Bello, C.K. Feld, U. Grandin, R. 41 Harrington, J.R. Haslett, R.H.G. Jongman, G.W. Luck, da Silva P.M., M. Moora, J. Settele, J.P. Sousa, and M. 42 Zobel, 2010: Identifying and prioritising services in European terrestrial and freshwater ecosystems. 43 Biodiversity and Conservation, 19(10), 2791-2821. 44
Harrison, P.A., P.M. Berry, C. Henriques, and I.P. Holman, 2008: Impacts of socio-economic and climate change 45 scenarios on wetlands: Linking water resource and biodiversity meta-models. Climatic Change, 90(1-2), 113-46 139. 47
Hartel, T., R. Bǎncilǎ, and D. Cogǎlniceanu, 2011: Spatial and temporal variability of aquatic habitat use by 48 amphibians in a hydrologically modified landscape. Freshwater Biology, 56(11), 2288-2298. 49
Hartikainen, K., J. Riikonen, A.-. Nerg, M. Kivimäenpää, V. Ahonen, A. Tervahauta, S. Kärenlampi, M. Mäenpää, 50 M. Rousi, S. Kontunen-Soppela, E. Oksanen, and T. Holopainen, 2012: Impact of elevated temperature and 51 ozone on the emission of volatile organic compounds and gas exchange of silver birch (Betula pendula Roth). 52 Environmental and Experimental Botany, 84, 33-43. 53
Haugen, J.E. and T. Iversen, 2008: Response in extremes of daily precipitation and wind from a downscaled multi-54 model ensemble of anthropogenic global climate change scenarios. Tellus Series A – Dynamic Meteorology and 55 Oceanography, 60(3), 411-426. 56
SECOND-ORDER DRAFT IPCC WGII AR5 Chapter 23
Do Not Cite, Quote, or Distribute 60 28 March 2013
Haughton, A.J., A.J. Bond, A.A. Lovett, T. Dockerty, G. Sünnenberg, S.J. Clark, D.A. Bohan, R.B. Sage, M.D. 1 Mallott, V.E. Mallott, M.D. Cunningham, A.B. Riche, I.F. Shield, J.W. Finch, M.M. Turner, and A. Karp, 2009: 2 A novel, integrated approach to assessing social, economic and environmental implications of changing rural 3 land-use: A case study of perennial biomass crops. Journal of Applied Ecology, 46(2), 315-322. 4
Hawkins, E., J. Robson, R. Sutton, D. Smith, and N. Keenlyside, 2011: Evaluating the potential for statistical 5 decadal predictions of sea surface temperatures with a perfect model approach. Climate Dynamics, 37(11-12), 6 2495-2509. 7
Hawkins, E., T.E. Fricker, A.J. Challinor, C.A.T. Ferro, C.K. Ho, and T.M. Osborne, 2013: Increasing influence of 8 heat stress on French maize yields from the 1960s to the 2030s. Global Change Biology, 19(3), 937-947. 9
Haylock, M.R., N. Hofstra, A.M.G. Klein Tank, E.J. Klok, P.D. Jones, and M. New, 2008: A European daily high-10 resolution gridded data set of surface temperature and precipitation for 1950-2006. Journal of Geophysical 11 Research, 113, 1-12. 12
Heath, M.R., F.C. Neat, J.K. Pinnegar, D.G. Reid, D.W. Sims, and P.J. Wright, 2012: Review of climate change 13 impacts on marine fish and shellfish around the UK and Ireland. Aquatic Conservation: Marine and Freshwater 14 Ecosystems, 22(3), 337-367. 15
Heikkinen, R.K., M. Luoto, N. Leikola, J. Poyry, J. Settele, O. Kudrna, M. Marmion, S. Fronzek, and W. Thuiller, 16 2010: Assessing the vulnerability of European butterflies to climate change using multiple criteria. Biodiversity 17 and Conservation, 19(3), 695-723. 18
Hein, L., M.J. Metzger, and A. Moreno, 2009: Potential impacts of climate change on tourism; a case study for 19 Spain. Current Opinion in Environmental Sustainability, 1(2), 170-178. 20
Hekkenberg, M., R. Benders, H. Moll, and A. Schoot Uiterkamp, 2009: Indications for a changing electricity 21 demand pattern: the temperature dependence of electricity in the Netherlands. Energy Policy, 37, 1542-1551. 22
HELCOM, 2007: Climate Change in the Baltic Sea Area – HELCOM Thematic Assessment in 2007. Baltic Sea 23 Environment Proceedings. 111. 24
HELCOM, 2009: Eutrophication in the Baltic Sea – An integrated thematic assessment of the effects of nutrient 25 enrichment and eutrophication in the Baltic Sea region: Executive Summary. In: Baltic Sea Environment 26 Proceedings No. 115A. Helsinki Commission, Helsinki, pp. 1-19. 27
Hellmann, F. and J.E. Vermaat, 2012: Impact of climate change on water management in Dutch peat polders. 28 Ecological Modelling, 240, 74-83. 29
Helming, K., K. Diehl, T. Kuhlman, T. Jansson, P.H. Verburg, M. Bakker, M. Perez-Soba, L. Jones, P.J. Verkerk, P. 30 Tabbus, J. Breton Morris, Z. Drillet, J. Farrington, P. LeMouël, P. Zagame, T. Stuczynski, G. Siebielec, S. 31 Sieber, and H. Wiggering, 2011: Ex Ante Impact Assessment of Policies Affecting Land Use, Part B: 32 Application of the Analytical Framework. Ecology and Society, 16(1), 29. 33
Heltberg, R., H. Gitay, and R.G. Prabhu, 2012: Community Based Adaptation: Lessons from a Grant Competition. 34 Climate Policy, 12(2), 143-163. 35
Hemery, G.E., J.R. Clark, E. Aldinger, H. Claessens, M.E. Malvolti, E. O'Connor, Y. Raftoyannis, P.S. Savill, and 36 R. Brus, 2010: Growing scattered broadleaved tree species in Europe in a changing climate: a review of risks 37 and opportunities. Forestry, 83(1), 65-81. 38
Henderson, G.R. and D.J. Leathers, 2010: European snow cover extent variability and associations with atmospheric 39 forcings. International Journal of Climatology, 30(10), 1440-1451. 40
Henderson, P.A., 2007: Discrete and continuous change in the fish community of the Bristol Channel in response to 41 climate change. Journal of the Marine Biological Association of the UK, 87(02), 589-589. 42
Henriques, C., I.P. Holman, E. Audsley, and K. Pearn, 2008: An interactive multi-scale integrated assessment of 43 future regional water availability for agricultural irrigation in East Anglia and North West England. Climatic 44 Change, 90(1-2), 89-111. 45
Hermans, C.M.L., I.R. Geijzendorffera, F. Ewertb, M.J. Metzgera, P.H. Vereijkene, G.B. Woltjerf, and A. 46 Verhagene, 2010: Exploring the future of European crop production in a liberalised market, with specific 47 consideration of climate change and the regional competitiveness. Ecological Modelling, 221, 2177-2187. 48
Hermant, M., J. Lobry, S. Bonhommeau, J. Poulard, and O. Le Pape, 2010: Impact of warming on abundance and 49 occurrence of flatfish populations in the Bay of Biscay (France). Journal of Sea Research, 64(1-2), 45-53. 50
Hertel, S., A. Le Tertre, K. Jöckel, and B. Hoffmann, 2009: Quantification of the heat wave effect on cause-specific 51 mortality in Essen, Germany. European Journal of Epidemiology, 24(8), 407-414. 52
Herweijer, C., N. Ranger, and R.E.T. Ward, 2009: Adaptation to climate change: Threats and opportunities for the 53 insurance industry. Geneva Papers on Risk and Insurance: Issues and Practice, 34, 360-380. 54
SECOND-ORDER DRAFT IPCC WGII AR5 Chapter 23
Do Not Cite, Quote, or Distribute 61 28 March 2013
Hilpert, K., F. Mannke, and P. Schmidt-Thome, 2007: Towards Climate Change Adapatation Strategies in the Baltic 1 Sea Region . In: Developing Policies and Adaptation Strategies to Climate Change in the Baltic Sea Region. 2 Geological Survey of Finland, Espoo. 3
Hinkel, J., R. Nicholls, A. Vafeidis, R. Tol, and T. Avagianou, 2010: Assessing risk of and adaptation to sea-level 4 rise in the European Union: an application of DIVA. Mitigation and Adaptation Strategies for Global Change, 5 15(7), 703-719. 6
Hlásny, T., Z. Barcza, M. Fabrika, B. Balázs, G. Churkina, J. Pajtík, R. Sedmák, and M. Turčáni, 2011: Climate 7 change impacts on growth and carbon balance of forests in Central Europe 8 . Climate Research, 47(3), 219-236. 9
Hochrainer, S., J. Linnerooth-Bayer, and R. Mechler, 2010: The European Union Solidarity Fund. Mitigation and 10 Adaptation Strategies for Global Change, 15(7), 797-810. 11
Hodzic, A., S. Madronich, B. Bohn, S. Massie, L. Menut, and C. Wiedinmyer, 2007: Wildfire particulate matter in 12 Europe during summer 2003: meso-scale modeling of smoke emissions, transport and radiative effects. 13 Atmospheric Chemistry and Physics, 7, 4043-4064. 14
Hoes, O. (ed.), 2006: Aanpak wateroverlast in polders op basis van risicobeheer . Technische Universiteit Delft, 15 Delft, 1-188 pp. 16
Hoff, H., 2012 (in press): Vulnerability of ecosystem services in the Mediterranean region to climate changes in 17 combination with other pressures. In: Regional Assessment of Climate Change in the Mediterranean. A. 18 Navarra, L.Tubiana (eds.), Springer, Dordrecht, The Netherlands. 19
Hoffmann, I., 2010: Climate change and the characterization, breeding and conservation of animal genetic resources. 20 Animal Genetics, 41(suppl 1), 32-46. 21
Hoinka, K.P., A. Carvalho, and A.I. Miranda, 2009: Regional-scale weather patterns and wildland fires in central 22 Portugal. International Journal of Wildland Fire, 18(1), 36-49. 23
Holland, T. and B. Smit, 2010: Climate change and the wine industry: current research themes and new directions. 24 Journal of Wine Research, 21(2-3), 125-136. 25
House, J.I., H.G. Orr, J.M. Clark, A. Gallego-Sala, C. Freeman, I.C. Prentice, and P. Smith, 2011: Climate change 26 and the British Uplands: evidence for decision-making. Climate Research, 45, 3-12. 27
Howden, N.J.K., T.P. Burt, F. Worrall, M.J. Whelan, and M.Z. Bieroza, 2010: Nitrate concentrations and fluxes in 28 the River Thames over 140 years (1868 - 2008): are increases irreversible?. Hydrological Processes, 24, 2657-29 2662. 30
Howden, S.M., J.F. Soussana, F.N. Tubiello, N. Chhetri, M. Dunlop, and H. Meinke, 2007: Adapting agriculture to 31 climate change. Proceedings of the National Academy of Sciences of the United States of America, 104(50), 32 19691-6. 33
HSY, 2010: Helsinki Metropolitan Area Adaptation to Climate Change Strategy Helsinki Region Environmental 34 Services Authority, . 35
Huang, C., A.G. Barnett, X. Wang, P. Vaneckova, G. FitzGerald, and S. Tong, 2011: Projecting future heat related 36 mortality under climate change scenarios: a systematic review. Environmental Health Perspectives, 119(12), 37 1681-1990. 38
Huggel, C., N. Salzmann, S. Allen, J. Caplan-Auerbach, L. Fischer, W. Haeberli, C. Larsen, D. Schneider, and R. 39 Wessels, 2010: Recent and future warm extreme events and high-mountain slope stability. Philosophical 40 Transactions of the Royal Society A: Mathematical, Physical and Engineering Sciences, 368(1919), 2435-2459. 41
Huggel, C., J.J. Clague, and O. Korup, 2012: Is climate change responsible for changing landslide activity in high 42 mountains? Earth Surface Processes and Landforms, 37(1), 77-91. 43
Hunt, A. and P. Watkiss, 2011: Climate change impacts and adaptation in cities: A review of the literature. Climatic 44 Change, 104(1), 13-49. 45
Huntjens, P., C. Pahl-Wostl, and J. Grin, 2010: Climate change adaptation in European river basins. Regional 46 Environmental Change, 10, 263-284. 47
Huntley, B., R.E. Green, Y.C. Collingham, and S.G. Willis, 2007: A Climatic Atlas of European Breeding Birds. pp. 48 834-834pp. 49
Hurkmans, R., W. Terink, R. Uijlenhoet, P. Torfs, D. Jacob, and P.A. Troch, 2010: Changes in streamflow dynamics 50 in the Rhine basin under three high-resolution regional climate scenarios. Journal of Climate, 23(3), 679-699. 51
ICES, 2010: North Sea, Cod in Subarea IV. In: ICES advice 2010. 52 Iglesias, A., L. Garrote, F. Flores, and M. Moneo, 2007: Challenges to Manage the Risk of Water Scarcity and 53
Climate Change in the Mediterranean. Water Resources Management, 21(5), 775-788. 54
SECOND-ORDER DRAFT IPCC WGII AR5 Chapter 23
Do Not Cite, Quote, or Distribute 62 28 March 2013
Iglesias, A., L. Garrote, A. Diz, J. Schlickenrieder, M. Moneo, and S. Quiroga, 2012: Water and people: Assessing 1 policy priorities for climate change adaptation in the Mediterranean. In: Regional Assessment of Climate 2 Change in the Mediterranean. A. Navarra, L.Tubiana (eds.), Springer, Dordrecht, The Netherlands., . 3
Iñiguez, C., F. Ballester, J. Ferrandiz, S. Pérez-Hoyos, M. Sáez, and M. López, 2010: Relation between Temperature 4 and Mortality in Thirteen Spanish Cities. International Journal of Environmental Research and Public Health, 5 7(8), 3196-3210. 6
Isaac, M. and D.P. van Vuuren, 2009: Modelling global residential sector energy demand for heating and air 7 conditioning in the context of climate change. Energy Policy, 37(2), 507-521. 8
Jackson, A.C. and J. McIlvenny, 2011: Coastal squeeze on rocky shores in northern Scotland and some possible 9 ecological impacts. Journal of Experimental Marine Biology and Ecology, 400(1-2), 314-321. 10
Jackson, C.R., R. Meister, and C. Prudhomme, 2011: Modelling the effects of climate change and its uncertainty on 11 UK Chalk groundwater resources from an ensemble of global climate model projections. Journal of Hydrology, 12 399, 12-28. 13
Jacob, D. and R. Podzun, 2010: Global warming below 2 °C relative to pre-industrial level: how might climate look 14 like in Europe. Nova Acta Leopoldina, 384, 71-76. 15
Jacob, D., J. Petersen, B. Eggert, A. Alias, O. Bossing Christensen, L.M. Bouwer, A. Braun, A. Colette, M. Deque, 16 G. Georgievski, E. Georgopoulou, A. Gobiet, G. Nikulin, A. Haensler, N. Hempelmann, C. Jones, K. Keuler, S. 17 Kovats, N. Kröner, S. Kotlarski, A. Kriegsmann, E. Martin, E. van Meijgaard, C. Moseley, S. Pfeifer, S. 18 Preuschmann, K. Radtke, D. Rechid, M. Rounsevell, P. Samuelsson, S. Somot, J.-. Soussana, C. Teichmann, R. 19 Valentini, R. Vautard, and B. Weber, 2013: EURO-CORDEX: New high-resolution climate change projections 20 for European impact research. Regional Environmental Change, in review. 21
Jacob, D.J. and D.A. Winner, 2009: Effect of climate change on air quality. Atmospheric Environment, 43(1), 51-63. 22 Jactel, H., B.C. Nicoll, M. Branco, J. Gonzalez-Olabarria, W. Grodzki, B. Långström, F. Moreira, S. Netherer, C. 23
Orazio, D. Piou, H. Santos, M.J. Schelhaas, K. Tojic, and F. Vodde, 2009: The influences of forest stand 24 management on biotic and abiotic risks of damage. Annals of Forest Science, 66(7), 1-18. 25
Jacxsens, L., P.A. Luning, J.G.A.J. van der Vorst, F. Devlieghere, R. Leemans, and M. Uyttendaele, 2010: 26 Simulation modelling and risk assessment as tools to identify the impact of climate change on microbiological 27 food safety-The case study of fresh produce supply chain. Food Research International, 43(7), 1925-1935. 28
James, P., K. Tzoulas, M.D. Adams, A. Barber, J. Box, J. Breuste, T. Elmqvist, M. Frith, C. Gordon, K.L. Greening, 29 J. Handley, S. Haworth, A.E. Kazmierczak, M. Johnston, K. Korpela, M. Moretti, J. Niemelä, S. Pauleit, M.H. 30 Roe, J.P. Sadler, and C. Ward Thompson, 2009: Towards an integrated understanding of green space in the 31 European built environment. Urban Forestry and Urban Greening, 8(2), 65-75. 32
Jenkins, D., Y. Liu, and A.D. Peacock, 2008: Climatic and internal factors affecting future UK office heating and 33 cooling energy consumptions. Energy and Buildings, 40(5), 874-881. 34
Jenkins, D.P., 2009: The importance of office internal heat gains in reducing cooling loads in a changing climate. 35 International Journal of Low-Carbon Technologies, 4(3), 134-140. 36
Jeppesen, E., B. Kronvang, J.E. Olesen, J. Audet, M. Søndergaard, C.C. Hoffmann, H.E. Andersen, T.L. Lauridsen, 37 L. Liboriussen, S.E. Larsen, M. Beklioglu, M. Meerhoff, A. Özen, and K. Özkan, 2011: Climate change effects 38 on nitrogen loading from cultivated catchments in Europe: implications for nitrogen retention, ecological state 39 of lakes and adaptation. Hydrobiologia, 663, 1-21. 40
Jiguet, F., R.D. Gregory, V. Devictor, R.E. Green, P. Vorisek, A. Van Strien, and D. Couvet, 2010: Population 41 trends of European common birds are predicted by characteristics of their climatic niche. Global Change 42 Biology, 16(2), 497-505. 43
Johannesson, T., G. Aoalgeirsdottir, A. Ahlstrom, L. Andreassen, S. Beldring, H. Bjornsson, P. Crochet, B. 44 Einarsson, H. Elevhoy, S. Guomundsson, R. Hock, H. Machguth, K. Melvod, F. Palsson, V. Radic, O. 45 Sigurosson, and T. Thorsteinsson, 2012: Hydropower, snow and ice. In: Climate change and energy 46 systems.Impacts, risks and adaptation in the Nordic and Baltic countries. TemaNord2011:502. [Thorsteinsson, 47 T. and H. Bjornsson(eds.)]. Copenhagen, pp. 91-110. 48
Johnk, K.D., J. Huisman, J. Sharples, B. Sommeijer, P.M. Visser, and J.M. Stroom, 2008: Summer heatwaves 49 promote blooms of harmful cyanobacteria. Global Change Biology, 14(3), 495-512. 50
Jomelli, V., D. Brunstein, D. Grancher, and P. Pech, 2007: Is the response of hill slope debris flows to recent climate 51 change univocal? A case study in the Massif des Ecrins (French Alps). Climatic Change, 85, 119-137. 52
Jonkeren, O., P. Rietveld, and J. van Ommeren, 2007: Climate change and inland waterway transport; welfare 53 effects of low water levels on the river Rhine. Journal of Transport Economics and Policy, 41(3), 387-411. 54
SECOND-ORDER DRAFT IPCC WGII AR5 Chapter 23
Do Not Cite, Quote, or Distribute 63 28 March 2013
Jonkeren, O., B. Jourquin, and P. Rietveld, 2011: Modal-split effects of climate change: The effect of low water 1 levels on the competitive position of inland waterway transport in the River Rhine area. 2 . Transportation Research Part A: Policy & Practice, 45(10), 1007-1019. 3
Jonkeren, O.E. (ed.), 2009: Adaptation to Climate Change in Inland Waterway Transport. Diss. Ph.D., VU 4 University, Amsterdam, the Netherlands., . 5
Jönsson, A.M., S. Harding, P. Krokene, H. Lange, A. Lindelöw, B. Økland, H.P. Ravn, and L.M. Schroeder, 2011: 6 Modelling the potential impact of global warming on Ips typographus voltinism and reproductive diapause 7 . Climatic Change, 109(3-4), 695-718. 8
Jönsson, A.M., G. Appelberg, S. Harding, and L. Bärring, 2009: Spatio-temporal impact of climate change on the 9 activity and voltinism of the spruce bark beetle, Ips typographus. Global Change Biology, 15(2), 486-499. 10
Jonzén, N., A. Lindén, T. Ergon, E. Knudsen, J.O. Vik, D. Rubolini, D. Piacentini, C. Brinch, F. Spina, L. Karlsson, 11 M. Stervander, A. Andersson, J. Waldenström, A. Lehikoinen, E. Edvardsen, R. Solvang, and N.C. Stenseth, 12 2006: Rapid advance of spring arrival dates in long-distance migratory birds. Science, 312(5782), 1959-1961. 13
Jordà, G., D. Gomis, and M. Marcos, 2012: Comment on "Storm surge frequency reduction in Venice under climate 14 change" by Troccoli et al. Climatic Change, 113(3-4), 1081-1087. 15
JRC-EEA, 2010: The European Environment, State and Outlook 2010, Soil, JRC Reference Report. 16 Jump, A.S., R. Marchant, and J. Peñuelas, 2009: Environmental change and the option value of genetic diversity. 17
Trends in Plant Science, 14(1), 51-58. 18 Kabat, P., L.O. Fresco, M.J.F. Stive, C.P. Veerman, J.S.L.J. van Alphen, B.W.A.H. Parmet, W. Hazeleger, and C.A. 19
Katsman, 2009: Dutch coasts in transition. Nature Geosciences, 2, 450-452. 20 Karaca, M. and R.J. Nicholls, Potential Implications of Accelerated Sea-Level Rise for Turkey. Journal of Coastal 21
Research, 24(2), 288-298. 22 Katsman, C., A. Sterl, J. Beersma, H. van den Brink, J. Church, W. Hazeleger, R. Kopp, D. Kroon, J. Kwadijk, R. 23
Lammersen, J. Lowe, M. Oppenheimer, H. Plag, J. Ridley, H. von Storch, D. Vaughan, P. Vellinga, L. 24 Vermeersen, R. van de Wal, and R. Weisse, 2011: Exploring high-end scenarios for local sea level rise to 25 develop flood protection strategies for a low-lying delta: the Netherlands as an example. Climatic Change, 109, 26 617-645. 27
Kay, A.L., S.M. Crooks, P. Pall, and D.A. Stone, 2011: Attribution of Autumn/Winter 2000 flood risk in England to 28 anthropogenic climate change: A catchment-based study. Journal of Hydrology, 406(1–2), 97-112. 29
Keenan, T., J. Maria Serra, F. Lloret, M. Ninyerola, and S. Sabate, 2011: Predicting the future of forests in the 30 Mediterranean under climate change, with niche- and process-based models: CO 2 matters! Global Change 31 Biology, 17(1), 565-579. 32
Keith, S.A., A.C. Newton, R.J.H. Herbert, M.D. Morecroft, and C.E. Bealey, 2009: Non-analogous community 33 formation in response to climate change. Journal for Nature Conservation, 17(4), 228-235. 34
Keller, B.D., D.F. Gleason, E. McLeod, C.M. Woodley, S. Airame, B.D. Causey, A.M. Friedlander, R. Grober-35 Dunsmore, J.E. Johnson, S.L. Miller, and R.S. Steneck, 2009: Climate Change, Coral Reef Ecosystems, and 36 Management Options for Marine Protected Areas. Environmental Management, 44(6), 1069-1088. 37
Kerr, S.P. and W.R. Kerr, 2011: Finnish Economic Papers. In: Economic Impacts of Immigration: A Survey. Finnish 38 Economic Association, Helsinki, pp. 32. 39
Kersebaum, K.C., A.S. Nain, C. Nendel, M. Gandorfer, and M. Wegehenkel, 2008: Simulated effect of climate 40 change on wheat production and nitrogen management at different sites in Germany. Journal of 41 Agrometeorology, 10, 266-273. 42
Keskitalo, E.C.H., 2010: The Development of Adaptation Policy and Practice in Europe: Multi-level Governance of 43 Climate Change. Springer, Dordrecht., pp. 376. 44
Keskitalo, E., 2008: Vulnerability and adaptive capacity in forestry in northern Europe: a Swedish case study. 45 Climatic Change, 87(1), 219-234. 46
Kilpeläinen, M. and H. Summala, 2007: Effects of weather and weather forecasts on driver behaviour. 47 Transportation Research, 10(4), 288-299. 48
Kjellström, E., G. Nikulin, U. Hansson, G. Strandberg, and A. Ullerstig, 2011: 21st century changes in the European 49 climate: uncertainties derived from an ensemble of regional climate model simulations. Tellus, 63A(1), 24-40. 50
Klaus, M., A. Holsten, P. Hostert, and J.P. Kropp, 2011: Integrated methodology to assess windthrow impacts on 51 forest stands under climate change. Forest Ecology and Management, 261(11), 1799-1810. 52
Klijn, F., N. Asselman, and H. Van Der Most, 2009: 53 Compartmentalisation: flood consequence reduction by splitting up large polder areas. Journal of Flood Risk 54 Management, 3, 3-17. 55
SECOND-ORDER DRAFT IPCC WGII AR5 Chapter 23
Do Not Cite, Quote, or Distribute 64 28 March 2013
Klik, A. and J. Eitzinger, 2010: Impact of climate change on soil erosion and the efficiency of soil conservation 1 practices in Austria. Journal of Agricultural Science, 148, 529-541. 2
Kløve, B., P. Ala-aho, G. Bertrand, Z. Boukalova, A. Ertürk, N. Goldscheider, J. Ilmonen, N. Karakaya, H. 3 Kupfersberger, J. Kvœrner, A. Lundberg, M. Mileusnić, A. Moszczynska, T. Muotka, E. Preda, P. Rossi, D. 4 Siergieiev, J. Šimek, P. Wachniew, V. Angheluta, and A. Widerlund, 2011: Groundwater dependent 5 ecosystems. Part I: Hydroecological status and trends. Environmental Science and Policy, 14(7), 770-781. 6
Knox, J., J. Morris, and T. Hess, 2010: Identifying future risks to UK agricultural crop production: Putting climate 7 change in context. Outlook on Agriculture, 39(4), 245-248. 8
Koch, H. and S. Vögele, 2009: Dynamic modeling of water demand, water availability and adaptation strategies for 9 power plants to global change. Ecological Economics, 68(7), 2031-2039. 10
Koetse, M.J. and P. Rietveld, 2009: The impact of climate change and weather on transport: An overview of 11 empirical findings. Transportation Research, 14(3), 205-221. 12
Kolmannskog, V. and F. Myrstad, 2009: Environmental displacement in European asylum law. European Journal of 13 Migration and Law, 11(4), 313-326. 14
Kolmannskog, V., 2010: Climate change, human mobility, and protection: initial evidence from Africa 15 Refugee Survey Quarterly, 29(3), 103-119. 16
Koutsias, N., M. Arianoutsou, A.S. Kallimanis, G. Mallinis, J.M. Halley, and P. Dimopoulos, 2012: Where did the 17 fires burn in Peloponnisos, Greece the summer of 2007? Evidence for a synergy of fuel and weather. 18 Agricultural and Forest Meteorology, 156, 41-53. 19
Kovats, R.S. and S. Hajat, 2008: Heat Stress and Public Health: A Critical Review. Annual Review of Public Health, 20 29, 41-55. 21
Krahe, P., E. Nilson, M. Carambia, T. Maurer, L. Tomassini, K. Bülow, D. Jacob, and H. Moser, 2009: 22 Wirkungsabschätzung von Unsicherheiten der Klimamodellierung in Abflussprojektionen – Auswertung eines 23 Multimodell-Ensembles im Rheingebiet. . Hydrologie Und Wasserbewirtschaftung, Heft 5/2009.(S.), 316-331. 24
Krekt, A.H., T.J. van der Laan, R.A.E. van der Meer, B. Turpijn, O.E. Jonkeren, A. van der Toorn, E. Mosselman, J. 25 van Meijeren, and T. Groen, 2011: Climate change and inland waterway transport: impacts on the sector, the 26 Port of Rotterdam and potential solutions. Kennis voor Klimaat, Netherlands. 27
Kriegler, E., B.C. O'Neill, S. Hallegatte, T. Kram, R.H. Moss, R. Lempert, and T.J. Wilbanks, 2010: Socio-economic 28 scenario development for climate change analysis . CIRED Working Paper. 29
Kristensen, K., K. Schelde, and J.E. Olesen, 2011: Winter wheat yield response to climate variability in Denmark. 30 Journal of Agricultural Science, 149(1), 33-47. 31
Kundzewicz, Z., Y. Hirabayashi, and S. Kanae, 2010: River Floods in the Changing ClimateóObservations and 32 Projections. Water Resources Management, 24(11), 2633-2646. 33
Kundzewicz, Z.W., I. Pińskwar, and G.R. Brakenridge, 2013: Large floods in Europe, 1985-2009. Hydrological 34 Sciences Journal, 58(1), 1-7. 35
Kunz, M., J. Sander, and C. Kottmeier, 2009: Recent trends of thunderstorm and hailstorm frequency and their 36 relation to atmospheric characteristics in southwest Germany. International Journal of Climatology, 29, 2283-37 2297. 38
Kwadijk, J.C.J., M. Haasnoot, J.P.M. Mulder, M.M.C. Hoogvliet, A.B.M. Jeuken, R.A.A. van der Krogt, N.G.C. 39 van Oostrom, H.A. Schelfhout, E.H. van Velzen, H. van Waveren, and M.J.M. de Wit, 2010: Using adaptation 40 tipping points to prepare for climate change and sea level rise, a case study in the Netherlands. Wiley 41 Interdisciplinary Reviews, (doi: 10.1002/wcc.64). 42
Ladanyi, M., 2008: Risk methods and their applications in agriculture. Applied Ecology and Environmental 43 Research, 6(1), 147-164. 44
Lake, I.R., I.A. Gillespie, G. Bentham, G.L. Nichols, C. Lane, G.K. Adak, and E.J. Threlfall, 2009: A re-evaluation 45 of the impact of temperature and climate change on foodborne illness. Epidemiology and Infection, 137(11), 46 1538-1547. 47
Lamond, J.E., D.G. Proverbs, and F.N. Hammond, 2009: Accessibility of flood risk insurance in the UK: confusion, 48 competition and complacency. Journal of Risk Research, 12(6), 825-841. 49
Lankester, P. and P. Brimblecombe, 2010: Predicting future indoor climate at Knole. Views, 47, 71-73. 50 Lasda, O., A. Dikou, and E. Papapanagiotou, 2010: Flash Flooding in Attika, Greece: Climatic Change or 51
Urbanization? Ambio, 39, 608-611. 52 Lasserre, F. and S. Pelletier, 2011: Polar super seaways? Maritime transport in the Arctic: An analysis of 53
shipowners' intentions. Journal of Transport Geography, 19, 1465-1473. 54
SECOND-ORDER DRAFT IPCC WGII AR5 Chapter 23
Do Not Cite, Quote, or Distribute 65 28 March 2013
Lavalle, C., F. Micale, T.D. Houston, A. Camia, R. Hiederer, C. Lazar, C. Conte, G. Amatulli, and G. Genovese, 1 2009: Climate change in Europe. 3. Impact on agriculture and forestry. A review. Agronomy for Sustainable 2 Development, 29(3), 433-446. 3
Leander, R., T.A. Buishand, B.J.J.M. van den Hurk, and M.J.M. de Wit, 2008: Estimated changes in flood quantiles 4 of the river Meuse from resampling of regional climate model output. Journal of Hydrology, 351(3-4), 331-343. 5
Lee, H.C., R. Walker, S. Haneklaus, L. Philips, G. Rahmann, and E. Schnug, 2008: Organic farming in Europe: A 6 potential major contribution to food security in a scenario of climate change and fossil fuel depletion. 7 Landbauforschung Volkenrode, 58(3), 145-151. 8
Lejeusne, C., P. Chevaldonne, C. Pergent-Martini, and Boudouresque, C.F. and Pe ́rez, T., 2009: 9 Climate change effects on a miniature ocean: the highly diverse, highly impacted Mediterranean Sea. Trends in 10 Ecology and Evolution, 25(4). 11
Lemoine, N., H.-. Schaefer, and K. Böhning-Gaese, 2007a: Species richness of migratory birds is influenced by 12 global climate change. Global Ecology and Biogeography, 16(1), 55-65. 13
Lemoine, N., H.-. Bauer, M. Peintinger, and K. Böhning-Gaese, 2007b: Effects of climate and land-use change on 14 species abundance in a Central European bird community. Conservation Biology, 21(2), 495-503. 15
Lenderink, G., A. Buishand, and W. Van Deursen, 2007: Estimates of future discharges of the river Rhine using two 16 scenario methodologies: direct versus delta approach. Hydrology and Earth System Sciences, 11(3), 1145-1159. 17
Lenderink, G. and E. Van Meijgaard, 2008: Increase in hourly precipitation extremes beyond expectations from 18 temperature changes. Nature Geoscience, 1(8), 511-514. 19
Lennert, M. and J. Robert, 2010: The territorial futures of Europe: 'Trends', 'Competition' or 'Cohesion'. Futures, 20 42(8), 833-845. 21
Lenoir, S., G. Beaugrand, and É. Lecuyer, 2011: Modelled spatial distribution of marine fish and projected 22 modifications in the North Atlantic Ocean. Global Change Biology, 17(1), 115-129. 23
Letourneau, A., P.H. Verburg, and E. Stehfest, 2012: A land-use systems approach to represent land-use dynamics at 24 continental and global scales. Environmental Modelling and Software, 33, 61-79. 25
Levinsky, I., F. Skov, J.-. Svenning, and C. Rahbek, 2007: Potential impacts of climate change on the distributions 26 and diversity patterns of European mammals. Biodiversity and Conservation, 16(13), 3803-3816. 27
Liberloo, M., S. Luyssaert, V. Bellassen, S.N. Djomo, M. Lukac, C. Calfapietra, I.A. Janssens, M.R. Hoosbeek, N. 28 Viovy, G. Churkina, G. Scarascia-Mugnozza, and R. Ceulemans, 2010: Bio-energy retains its mitigation 29 potential under elevated CO2. Public Library on Science, 5(7). 30
Linard, C., N. Poncon, D. Fontenille, and E.F. Lambin, 2009: Risk of malaria reemergence in Southern France: 31 testing scenarios with a multiagent simulation model. Eohealth, 6(1), 135-147. 32
Lindgren, J., D.K. Johnsson, and A. Carlsson-Kanyama, 2009: Climate adaptation of railways: Lessons from 33 Sweden. European Journal of Transport and Infrastructure Research, 9(2), 164-181. 34
Lindner, M., M. Maroschek, S. Netherer, A. Kremer, A. Barbati, J. Garcia-Gonzalo, R. Seidl, S. Delzon, P. Corona, 35 M. Kolström, M.J. Lexer, and M. Marchetti, 2010: Climate change impacts, adaptive capacity, and vulnerability 36 of European forest ecosystems. Forest Ecology and Management, 259(4), 698-709. 37
Lindsay, S.W., D.G. Hole, R.A. Hutchinson, S.A. Richards, and S.G. Willis, 2010: Assessing the future threat from 38 vivax malaria in the United Kingdom using two markedly different modelling approaches. Malaria Journal, 39 9(1), 70-78. 40
Linkosaloa, T., R. Häkkinenb, J. Terhivuoc, H. Tuomenvirtad, and Haria P., 2009: The time series of flowering and 41 leaf bud burst of boreal trees (1846–2005) support the direct temperature observations of climatic warming. 42 Agricultural and Forest Meteorology, 149(3-4), 453-461. 43
Linnerud, K., T.H. Mideska, and G.S. Eskeland, 2011: The impact of climate change on nuclear power supply. The 44 Energy Journal, 32(1), 149-168. 45
Lionello, P., M.B. Galati, and E. Elvini, 2012: Extreme storm surge and wind wave climate scenario simulations at 46 the Venetian littoral. Physics and Chemistry of the Earth, 40-41, 86-92. 47
Liu, M. and J. Kronbak, 2010: The potential economic viability of using the Northern Sea Route (NSR) as an 48 alternative route between Asia and Europe. Journal of Transport Geography, 18, 434-444. 49
Liu, Y., R.A. Kahn, A. Chaloulakou, and P. Koutrakis, 2009: Analysis of the impact of the forest fires in August 50 2007 on air quality of Athens using multi-sensor aerosol remote sensing data, meteorology and surface 51 observations. Atmospheric Environment, 43, 3310-3318 (doi:10.1016/j.atmosenv.2009.04.010). 52
Lloret, J. and V. Riera, 2008: Evolution of a Mediterranean Coastal Zone: Human Impacts on the Marine 53 Environment of Cape Creus. Environmental Management, 42(6), 977-988. 54
Lobell, D.B., W. Schlenker, and J. Costa-Roberts, 2011: Climate Trends and Global Crop Production Since 1980. 55 Science, . 56
SECOND-ORDER DRAFT IPCC WGII AR5 Chapter 23
Do Not Cite, Quote, or Distribute 66 28 March 2013
Luck, J., M. Spackman, A. Freeman, P. Trebicki, W. Griffiths, K. Finlay, and S. Chakraborty, 2011: Climate change 1 and diseases of food crops. Plant Pathology, 60(1), 113-121. 2
Lugeri, N., Z. Kundzewicz, E. Genovese, S. Hochrainer, and M. Radziejewski, 2010: River flood risk and adaptation 3 in Europeóassessment of the present status. Mitigation and Adaptation Strategies for Global Change, 15(7), 4 621-639. 5
Lung, T., C. Lavalle, R. Hiederer, A. Dosio, and L.M. Bouwer, 2012: A multi-hazard regional level impact 6 assessment for Europe combining indicators of climatic and non-climatic change. Global Environmental 7 Change, . 8
Luterbacher, J., D. Dietrich, E. Xoplaki, M. Grosjean, and H. Wanner, 2004: European Seasonal and Annual 9 Temperature Variability, Trends, and Extremes Since 1500. Science, 303, 1499-1503. 10
Lyons, S., K. Mayor, and R. Tol, 2009: Holiday destinations:Understanding the travel choices of Irish tourists. 11 Tourism Management, 30(5), 683-692. 12
Maaskant, B., S.N. Jonkman, and L.M. Bouwer, 2009: Future risk of flooding: an analysis of changes in potential 13 loss of life in South Holland (The Netherlands). Environmental Science & Policy, 12(2), 157-169. 14
Mackenzie, B.R., H. Gislason, C. Mollmann, and F.W. Koster, 2007: Impact of 21st century climate change on the 15 Baltic Sea fish community and fisheries. Global Change Biology, 13(7), 1348-1367. 16
Macleod, C.J.A., P.D. Falloon, R. Evans, and P.M. Haygarth, 2012: The Effects of Climate Change on the 17 Mobilization of Diffuse Substances from Agricultural Systems. Advances in Agronomy, 115, 41-47. 18
Madgwick, J.W., J.S. West, R.P. White, M.A. Semenov, J.A. Townsend, J.A. Turner, and B.D.L. Fitt, 2011: Impacts 19 of climate change on wheat anthesis and fusarium ear blight in the UK. European Journal of Plant Pathology, 20 130(1), 117-131. 21
Magnan, A., B. Garnaud, R. Billé, F. Gemenne, and S. Hallegatte, 2009: The Future of the Mediterranean: From 22 Impacts of Climate Change to Adaptation Issues. Institut du développement durable et des relations 23 internationales (IDDRI), Paris. 24
Majone, B., C.I. Bovolo, A. Bellin, S. Blenkinsop, and H.J. Fowler, 2012: Modeling the impacts of future climate 25 change on water resources for the Gállego river basin (Spain). Water Resources Research, 48(1), W01512-26 W01512. 27
Malheiro, A.C., J.A. Santos, H. Fraga, and J.G. Pinto, 2010: Climate change scenarios applied to viticultural zoning 28 in Europe. Climate Research, 43, 163-177. 29
Mandryk, M., P. Reidsma, and M. Ittersum, 2012: Scenarios of long-term farm structural change for application in 30 climate change impact assessment. Landscape Ecology, , 509-527. 31
Mantyka-pringle, C.S., T.G. Martin, and J.R. Rhodes, 2012: Interactions between climate and habitat loss effects on 32 biodiversity: A systematic review and meta-analysis. Global Change Biology, 18(4), 1239-1252. 33
Marcais, B. and M. Desprez-Loustau, 2007: Has climatic warming had an effect on forest diseases? RenDez-Vous 34 Techniques, , 47-52. 35
Marcos-Lopez, M., P. Gale, B.C. Oidtmann, and E.J. Peeler, 2010: Assessing the Impact of Climate Change on 36 Disease Emergence in Freshwater Fish in the United Kingdom. Transboundary and Emerging Diseases, 57(5), 37 293-304. 38
Marker, M., L. Angeli, L. Bottai, R. Costantini, R. Ferrari, L. Innocenti, and G. Siciliano, 2008: Assessment of land 39 degradation susceptibility by scenario analysis: A case study in Southern Tuscany, Italy. Geomorphology, 93(1-40 2), 120-129. 41
Marlon, J.R., P.J. Bartlein, C. Carcaillet, D.G. Gavin, S.P. Harrison, P.E. Higuera, F. Joos, M.J. Power, and I.C. 42 Prentice, 2008: Climate and human influences on global biomass burning over the past two millennia. Nature 43 Geoscience, 1(10), 697-702. 44
Marmot, M., J. Allen, R. Bell, E. Bloomer, P. Goldblatt, and Consortium for the European Review of Social 45 Determinants of Health and the Health Divide., 2012: WHO European review of social determinants of health 46 and the health divide. Lancet, 380(9846), 1011-1029. 47
Marques, S., J.G. Borges, J. Garcia-Gonzalo, F. Moreira, J.M.B. Carreiras, M.M. Oliveira, A. Cantarinha, B. 48 Botequim, and J.M.C. Pereira, 2011: Characterization of wildfires in Portugal. European Journal of Forest 49 Research, 130(5), 775-784. 50
Martinez-Casasnovas, J. and M.C. Ramos, 2009: Soil alteration due to erosion, ploughing and levelling of vineyards 51 in north east Spain. Soil use and Management, 25(2), 183-192. 52
Mauser, W. and H. Bach, 2009: PROMET-Large scale distributed hydrological modelling to study the impact of 53 climate change on the water flows of mountain watersheds. Journal of Hydrology, 376(3-4), 362-377. 54
SECOND-ORDER DRAFT IPCC WGII AR5 Chapter 23
Do Not Cite, Quote, or Distribute 67 28 March 2013
Mavrogianni, A., P. Wilkinson, M. Davies, P. Biddulph, and E. Oikonomou, 2012: Building characteristics as 1 determinants of propensity to high indoor summer temperatures in London dwellings. Building and 2 Environment, 55, 117-130. 3
McCarthy, M., M. Best, and R. Betts, 2010: 4 Climate change in cities due to global warming and urban effects. Geophysical Research Letters, 37(L09705). 5
McColl, L., E. Palin, H. Thornton, D. Sexton, R. Betts, and K. Mylne, 2012: Assessing the potential impact of 6 climate change on the UK's electricity network. Climatic Change, . 7
McHugh, M., 2007: Short-term changes in upland soil erosion in England and Wales: 1999 to 2002. 8 Geomorphology, 86(1-2), 204-213. 9
McInnes, K.L., T.A. Erwin, and J.M. Bathols, 2011: Global Climate Model projected changes in 10 m wind speed 10 and direction due to anthropogenic climate change. 11 Atmospheric Science Letters, 12(4), 325-333. 12
Mechler, R., S. Hochrainer, A. Aaheim, H. Salen, and A. Wreford, 2010: Modelling economic impacts and 13 adaptation to extreme events: Insights from European case studies. Mitigation and Adaptation Strategies for 14 Global Change, 15(7), 737-762. 15
Meleux, F., F. Solmon, and F. Giorgi, 2007: Increase in summer European ozone amounts due to climate change. 16 Atmospheric Environment, 41(35), 7577-7587. 17
Menendez, M. and P.L. WoodWorth, 2010: Changes in extreme high water levels based on quasi global tide-gauge 18 data set. Journal of Geophysical Research, 115. 19
Menzel, A., T.H. Sparks, N. Estrella, E. Koch, A. Aasa, A. Ahas K., P. Bissolli, O. Braslavská, A. Briede, F.M. 20 Chmielewski, Z. Crepinsek, Y. Curnel, Å. Dahl, C. Defila, A. Donnelly, Y. Filella, K. Jatczak, F. Måge, A. 21 Mestre, Ø. Nordli, J. Peñuelas, P. Pirinen, V. Remišová, H. Scheifinger, M. Striz, A. Susnik, A. Van vliet, F.-. 22 Wielgolaski, S. Zach, and A. Zust, 2006: European phenological response to climate change matches the 23 warming pattern. Global Change Biology, 12(10), 1969-1976. 24
Metzger, M.J. and M.D.A. Rounsevell, 2011: A need for planned adaptation to climate change in the wine industry. 25 Environmental Research Letters, 6(3), art. no. 031001. 26
Metzger, M.J., D. Schroter, R. Leemans, and W. Cramer, 2008: A spatially explicit and quantitative vulnerability 27 assessment of ecosystem service change in Europe. Regional Environmental Change, 8(3), 91-107. 28
Metzger, M.J., R.G.H. Bunce, R.H.G. Jongman, C.A. Mücher, and J.W. Watkins, 2005: A climatic stratification of 29 the environment of Europe. Global Ecology and Biogeography, 14(6), 549-563. 30
Mickwitz, P., S. Beck, A. Jensenm, A.B. Pedersen, C. Görg, M. Melanen, N. Ferrand, C. Kuhlicke, W. Kuindersma, 31 M. Máñez, H. Reinert, and S. Bommel, 2009: Climate policy integration as a necessity for an efficient climate 32 policy. IOP Conf. Series: Earth and Environmental Science, 6(58). 33
Mieszkowska, N., M.J. Genner, S.J. Hawkins, and D.W. Sims, 2009: Chapter 3. Effects of climate change and 34 commercial fishing on Atlantic cod Gadus morhua. Advances in Marine Biology, 56, 213-73. 35
Millar, C.I., N.L. Stephenson, and S.L. Stephens, 2007: Climate change and forests of the future: Managing in the 36 face of uncertainty. Ecological Applications, 17(8), 2145-2151. 37
Miller, K., A. Charles, M. Barange, K. Brander, V.F. Gallucci, M.A. Gasalla, A. Khan, G. Munro, R. Murtugudde, 38 R.E. Ommer, and R.I. Perry, 2010: Climate change, uncertainty, and resilient fisheries: Institutional responses 39 through integrative science. Progress in Oceanography, 87(1-4), 338-346. 40
Milner, J., M. Davies, and P. Wilkinson, 2012: Urban energy, carbon management (low carbon cities) and co-41 benefits for human health. Current Opinion in Environmental Sustainability, 4(4), 338-404. 42
Ministry of Agriculture and Forestry, 2009: Evaluation of the Implementation of Finland’s National Strategy for 43 Adaptation to Climate Change 2009. In: null. Ministry of Agriculture and Forestry, Helsinki. 44
Miraglia, M., H.J.P. Marvin, G.A. Kleter, P. Battilani, C. Brera, E. Coni, F. Cubadda, L. Croci, B. De Santis, S. 45 Dekkers, L. Filippi, R.W.A. Hutjes, M.Y. Noordam, M. Pisante, G. Piva, A. Prandini, L. Toti, van den Born 46 G.J., and A. Vespermann, 2009: Climate change and food safety: An emerging issue with special focus on 47 Europe. Food and Chemical Toxicology, 47(5), 1009-1021. 48
Miranda, A.I., E. Marchi, M. Ferretti, and M.M. Millan, 2009: Forest´ fires and air quality issues in Southern 49 Europe. In: Developments in Environmental Science. [Bytnerowicz, A., M. Arbaugh, A. Riebau, and C. 50 Andersen(eds.)]. pp. 209-231. 51
Mirasgedis, S., Y. Sarafidis, E. Georgopoulou, V. Kotroni, K. Lagouvardos, and D.P. Lalas, 2007: Modelling 52 framework for estimating impacts of climate change on electricity demand at regional level: Case of Greece. 53 Energy Conversion and Management, 48(5), 1737-1750. 54
SECOND-ORDER DRAFT IPCC WGII AR5 Chapter 23
Do Not Cite, Quote, or Distribute 68 28 March 2013
Mirasgedis, S., E. Georgopoulou, Y. Sarafidis, K. Papagiannaki, and D.P. Lalas, 2013: The impact of climate 1 change on the demand pattern of bottled water and non-alcoholic beverages. Business Strategy and the 2 Environment, in press. 3
Mitchell, T.D., T.R. Carter, P.D. Jones, M. Hulme, and M. New, 2004: A comprehensive set of high-resolution grids 4 of monthly climate for Europe and the globe: the observed record (1901-2000) and 16 scenarios (2001-2100). . 5 Tyndall Centre for Climate Change Research, University of East Anglia, Norwich, UK, Tyndall Centre 6 Working Paper 55 ed., pp. 30 pp. 7
Moen, J. and P. Fredman, 2007: Effects of climate change on alpine skiing in sweden. Journal of Sustainable 8 Tourism, 15(4), 418-437. 9
Mokrech, M., R.J. Nicholls, and R.J. Dawson, 2012: Scenarios of future built environment for coastal risk 10 assessment of climate change using a GIS-based multicriteria analysis. Environment and Planning B: Planning 11 and Design, 39(1), 120-136. 12
Mokrech, M., R. Nicholls, J. Richards, C. Henriques, I. Holman, and S. Shackley, 2008: Regional impact assessment 13 of flooding under future climate and socio-economic scenarios for East Anglia and North West England. 14 Climatic Change, 90(1), 31-55. 15
Molnar, J.L., R.L. Gamboa, C. Revenga, and M.D. Spalding, 2008: Assessing the global threat of invasive species to 16 marine biodiversity. Frontiers in Ecology and the Environment, 6(9), 485-492. 17
Montoya, J.M. and D. Raffaelli, 2010: Climate change, biotic interactions and ecosystem services. Philosophical 18 Transactions of the Royal Society of London.Series B, Biological Sciences, 365(1549), 2013-8. 19
Mooij de, R. and P. Tang, 2003: Four Futures of Europe . Centraal Planbureau, pp. 1-220. 20 Mooij, W.M., L. Domis, and S. Hulsmann, 2008: The impact of climate warming on water temperature, timing of 21
hatching and young-of-the-year growth of fish in shallow lakes in the Netherlands. Journal of Sea Research, 22 60(1-2), 32-43. 23
Morán-López, R., J.L. Pérez-Bote, E. da Silva, and A.B.P. Casildo, 2012: Hierarchical large-scale to local-scale 24 influence of abiotic factors in summer-fragmented Mediterranean rivers: Structuring effects on fish 25 distributions, assemblage composition and species richness. Hydrobiologia, 696(1), 137-158. 26
Moreira, F., O. Viedma, M. Arianoutsou, T. Curt, N. Koutsias, E. Rigolot, A. Barbati, P. Corona, P. Vaz, G. 27 Xanthopoulos, F. Mouillot, and E. Bilgili, 2011: Landscape - wildfire interactions in southern Europe: 28 Implications for landscape management. Journal of Environmental Management, 92(10), 2389-2402. 29
Moreno, A. and B. Amelung, 2009: Climate change and tourist comfort on Europe’s Beaches in summer: a 30 reassessment. Coastal Management, 37(6), 550-568. 31
Moreno, A., 2010: Mediterranean tourism and climate (change): a survey-based study. Tourism and Hospitality 32 Planning & Development, 7(3), 253-265. 33
Moriondo, M., P. Good, R. Durao, M. Bindi, C. Giannakopoulos, and J. Corte-Real, 2006: Potential impact of 34 climate change on fire risk in the Mediterranean area. 35 . Climate Research, 31, 85-95. 36
Moriondo, M., M. Bindi, C. Fagarazzi, R. Ferrise, and G. Trombi, 2011: Framework for high-resolution climate 37 change impact assessment on grapevines at a regional scale. 38 . Regional Environmental Change, 11(3), 553-567. 39
Moriondo, M., M. Bindi, Z.W. Kundzewicz, M. Szwed, A. Chorynski, P. Matczak, M. Radziejewski, D. McEvoy, 40 and A. Wreford, 2010: Impact and adaptation opportunities for European agriculture in response to climatic 41 change and variability. Mitigation and Adaptation Strategies for Global Change, 15(7), 657-679. 42
Moriondo, M., C. Pacini, G. Trombi, C. Vazzana, and M. Bindi, 2010b: Sustainability of dairy farming system in 43 Tuscany in a changing climate. European Journal of Agronomy, 32(1), 80-90. 44
Mullan, D., D. Favis-mortlock, and R. Fealy, 2012: Agricultural and Forest Meteorology Addressing key limitations 45 associated with modelling soil erosion under the impacts of future climate change. Agricultural and Forest 46 Meteorology, 156, 18-30. 47
Murray, V., H. Caldin, R. Amlot, C. Stanke, S. Lock, H. Rowlatt, and R. Williams, 2011: Health Protection Agency. 48 In: The effects of flooding on mental health. 49
Musshoff, O., M. Odening, and W. Xu, 2011: Management of climate risks in agriculture - will weather derivatives 50 permeate? Applied Economics, 43(9), 1067-1077. 51
Mustonen, T. and K. Mustonen, 2011a: Eastern Sámi Atlas. Snowchange Cooperative, Finland, pp. 334. 52 Mustonen, T. and K. Mustonen, 2011b: Drowning Reindeers, Drowning Homes - Indigenous Saami and 53
Do Not Cite, Quote, or Distribute 69 28 March 2013
Najac, J., C. Lac, and L. Terray, 2011: Impact of climate change on surface winds in France using a statistical-1 dynamical downscaling method with mesoscale modelling. International Journal of Climatology, 31(3), 415-2 430. 3
Nicholls, R., P. Wong, V. Burkett, C. Woodroffe, and J. Hay, 2008: Climate change and coastal vulnerability 4 assessment: scenarios for integrated assessment. Sustainability Science, 3(1), 89-102. 5
Nicholls, R.J. and A. Cazenave, 2010: Sea Level Rise and its Impact on Coastal Zones. Science, 329, 1517-1520. 6 Nicholls, S. and B. Amelung, 2008: Climate Change and Tourism in Northwestern Europe: Impacts and Adaptation. 7
Tourism Analysis, 13(1), 21-31. 8 Nokkala, M., P. Leviakangas, and K. Oiva (eds.), 2012: The costs of extreme weather for the European transport 9
system. EWENT project D4. Vtt Technology, 36. VTT Technical Research Centre of Finland, Espoo, pp. 92. 10 Nolan, P., P. Lynch, R. Mcgrath, T. Semmler, and S. Wang, 2012: Simulating climate change and its effect on the 11
the wind energy resource of Ireland. Wind Energy, 15, 593-608. 12 OECD, 2007: Climate Change in the European Alps: Adapting Winter Tourism and Natural Hazards Management. 13
OECD, Paris, France, pp. 1-136. 14 Olesen, J.E., M. Trnka, K.C. Kersebaum, A.O. Skjelvåg, B. Seguin, P. Peltonen-Sainio, F. Rossi, J. Kozyra, and F. 15
Micale, 2011: Impacts and adaptation of European crop production systems to climate change. European 16 Journal of Agronomy, 34(2), 96-112. 17
Oliver, R.J., J.W. Finch, and G. Taylor, 2009: Second generation bioenergy crops and climate change: a review of 18 the effects of elevated atmospheric CO2and drought on water use and the implications for yield. GCB 19 Bioenergy, 1(2), 97-114. 20
Olonscheck, M., A. Holsten, and J. Kropp, 2011: Heating and cooling demand and related emissions of the German 21 residential building stock under climate change. Energy Policy, 39, 4795-4806. 22
Oort, P., 2012: Why farmers' sowing dates hardly change when temperature rises. European Journal of …, 40, 102-23 111. 24
OSPAR, 2010: Chapter 12: Regional Summaries. In: Quality Status Report. pp. 150-161. 25 Osterblom, H., A. Gardmark, L. Bergstrom, B. Muller-Karulis, C. Folke, M. Lindegren, M. Casini, P. Olsson, R. 26
Diekmann, T. Blenckner, C. Humborg, and C. Mollmann, 2010: Making the ecosystem approach operational-27 Can regime shifts in ecological- and governance systems facilitate the transition? Marine Policy, 34(6), 1290-28 1299. 29
Paerl, H.W. and J. Huisman, 2009: Climate change: a catalyst for global expansion of harmful cyanobacterial 30 blooms. Environmental Microbiology Reports, 1(1), 27-37. 31
Pahl-Wostl, C., 2007: Transitions towards adaptive management of water facing climate and global change. Water 32 Resources Management, 21(1), 49-62. 33
Paiva, R., W. Collinschonn, E. Schettini, J. Vidal, F. Hendricks, and A. Lopez, 2011: The Case studies. In: 34 Modelling the impact of climate change on water reosurces. [Fung, F., A. Lopez, and M.(.). New(eds.)]. John 35 Wiley-Blackwell, Chichester, UK, pp. 203. 36
Pall, P., T. Aina, D.A. Stone, P.A. Stott, T. Nozawa, A.G.J. Hilberts, D. Lohmann, and M.R. Allen, 2011: 37 Anthropogenic greenhouse gas contribution to flood risk in England and Wales in autumn 2000. Nature, 38 470(7334), 382-385. 39
Paranjothy, S., J. Gallacher, R. Amlôt, G.J. Rubin, L. Page, T. Baxter, J. Wight, D. Kirrage, R. McNaught, and S.R. 40 Palmer, 2011: Psychosocial impact of the summer 2007 flood in England. BMC Public Health; 11(145). BMC 41 Public Health, 11(145). 42
Parent, B. and F. Tardieu, 2012: Temperature responses of developmental processes have not been affected by 43 breeding in different ecological areas for 17 crop species. New Phytologist, 194(3), 760-774. 44
Parry, M., N. Arnell, P. Berry, D. Dodman, S. Fankhauser, C. Hope, S. Kovats, R. Nicholls, D. Satterthwaite, and T. 45 Wheeler, 2009: Assessing the Costs of Adaptation to Climate Change: A Review of the UNFCCC and Other 46 Recent Estimates. International Institute for Environment and Development and Grantham Institute for Climate 47 Change, London, . 48
Pašičko, R., Č. Branković, and Z. Simic, 2012: Assessment of climate change impacts in energy generation from 49 renewable sources in Croatia. Renewable Energy, 46, 224-231. 50
Paterson, A.H., J.E. Bowers, R. Bruggmann, I. Dubchak, J. Grimwood, H. Gundlach, G. Haberer, U. Hellsten, T. 51 Mitros, A. Poliakov, J. Schmutz, M. Spannagl, H. Tang, X. Wang, T. Wicker, A.K. Bharti, J. Chapman, F.A. 52 Feltus, U. Gowik, I.V. Grigoriev, E. Lyons, C.A. Maher, M. Martis, A. Narechania, R.P. Otillar, B.W. Penning, 53 A.A. Salamov, Y. Wang, L. Zhang, N.C. Carpita, M. Freeling, A.R. Gingle, C.T. Hash, B. Keller, P. Klein, S. 54 Kresovich, M.C. McCann, R. Ming, D.G. Peterson, Mehboob-Ur-Rahman, D. Ware, P. Westhoff, K.F.X. 55
SECOND-ORDER DRAFT IPCC WGII AR5 Chapter 23
Do Not Cite, Quote, or Distribute 70 28 March 2013
Mayer, J. Messing, and D.S. Rokhsar, 2009: The Sorghum bicolor genome and the diversification of grasses. 1 Nature, 457(7229), 551-556. 2
Paterson, R.R.M. and N. Lima, 2010: How will climate change affect mycotoxins in food? Food Research 3 International, 43(7), 1902-1914. 4
Pauli, H., M. Gottfried, S. Dullinger, O. Abdaladze, M. Akhalkatsi, J.L. Benito Alonso, G. Coldea, J. Dick, B. 5 Erschbamer, R. Fernández Calzado, D. Ghosn, J.I. Holten, R. Kanka, G. Kazakis, J. Kollár, P. Larsson, P. 6 Moiseev, D. Moiseev, U. Molau, J. Molero Mesa, L. Nagy, G. Pelino, M. Puşcaş, G. Rossi, A. Stanisci, A.O. 7 Syverhuset, J.-. Theurillat, M. Tomaselli, P. Unterluggauer, L. Villar, P. Vittoz, and G. Grabherr, 2012: Recent 8 Plant Diversity Changes on Europe’s Mountain Summits 9 . Science, 336, 353-355. 10
Pausas, J.G., J. Llovet, A. Rodrigo, and R. Vallejo, 2008: Are wildfires a disaster in the Mediterranean basin? A 11 review. International Journal of Wildland Fire, 17(6), 713-723. 12
Pausas, J.G. and S. Fernández-Muñoz, 2012: Fire regime changes in the Western Mediterranean Basin: From fuel-13 limited to drought-driven fire regime. Climatic Change, 110(1-2), 215-226. 14
Pejovic, T., V.A. Williams, R.B. Noland, and R. Toumi, 2009: Factors affecting the frequency and severity of 15 airport weather delays and the implications of Climate Change for future delays. Transportation Research 16 Record, 2139, 97-106. 17
Pellizzaro, G., A. Ventura, B. Arca, A. Arca, P. Duce, V. Bacciu, and D. Spano, 2010: Estimating effects of future 18 climate on duration of fire danger season in Sardinia. 19 . In: VI International Forest Fire Research Conference. [Viegas, D.X. (ed.)]. electronic edition, Coimbra, 20 Portugal, . 21
Peltonen-Sainio, P., L. Jauhiainen, and I.P. Laurila, 2009: Cereal yield trends in northern European conditions: 22 Changes in yield potential and its realisation. Field Crops Research, 110(1), 85-90. 23
Peltonen-sainio, P., L. Jauhiainen, and K. Hakala, 2010: Crop responses to temperature and precipitation according 24 to long-term multi-location trials at high-latitude conditions. The Journal of Agricultural Science, 149(01), 49-25 62. 26
Perch-Nielsen, S.L., B. Amelung, and R. Knutti, 2010: Future climate resources for tourism in Europe based on the 27 daily Tourism Climatic Index. Climatic Change, 103(3-4), 363-381. 28
Perez, F.F., X.A. Padin, Y. Pazos, M. Gilcoto, M. Cabanas, P.C. Pardo, M.D. Doval, and L. Farina-Busto, 2010: 29 Plankton response to weakening of the Iberian coastal upwelling. Global Change Biology, 16(4), 1258-1267. 30
Perry, I.A., R. Ommer, K. Cochrane, and P. Cury, 2011: World Fisheries. Wiley-Blackwell, Oxford, UK, pp. 148-31 148. 32
Perry, R.I., R.E. Ommer, M. Barange, and F. Werner, 2010: The challenge of adapting marine social-ecological 33 systems to the additional stress of climate change. Current Opinion in Environmental Sustainability, 2(5-6), 34 356-363. 35
Peterson, T., P. Scott, and S. Herring, 2012: Explaining extreme events of 2011 from a climate perspective. Bulletin 36 of the American Meteorological Society, 93, 1041-1067. 37
Petitpierre, B., C. Kueffer, O. Broennimann, C. Randin, C. Daehler, and A. Guisan, 2012: Climatic niche shifts are 38 rare among terrestrial plant invaders. Science, 335(6074), 1344-1348. 39
Petney, T.N., J. Skuballa, S. Muders, M. Pfäffle, C. Zetlmeisl, and R. Oehme, 2012: The Changing Distribution 40 Patterns of Ticks (Ixodida) in Europe in Relation to Emerging Tick-Borne Diseases. Parasitology Research 41 Monographs, 3, 151-166. 42
Petrow, T., B. Merz, K.E. Lindenschmidt, and A.H. Thieken, 2007: Aspects of seasonality and flood generating 43 circulation patterns in a mountainous catchment in south-eastern Germany. Hydrology and Earth System 44 Sciences, 11, 1455-1468. 45
Petrow, T., J. Zimmer, and B. Merz, 2009: Changes in the flood hazard in Germany through changing frequency and 46 persistence of circulation patterns. Natural Hazards and Earth System Sciences, 9(4), 1409-1423. 47
Pezzatti, G.B., T. Zumbrunnen, M. Bürgi, P. Ambrosetti, and M. Conedera, Fire regime shifts as a consequence of 48 fire policy and socio-economic development: An analysis based on the change point approach. Forest Policy 49 and Economics, (0). 50
Pfenniger, S., S. Hanger, and M.a.a. Dreyfus, 2010: Report on perceived policy needs and decision contexts”, 51 Mediation Deliverable 1.1 (Final Draft). Subject to Approval by the European Commission, . 52
Philippart, C.J.M., R. Anadon, R. Danovaro, J.W. Dipper, K.F. Drinkwater, S.J. Hawkins, T. Oguz, G. O’Sullivan, 53 and P.C. Reid, 2011: Impacts of climate change on European marine ecosystems: Observations, expectations 54 and indicators. Journal of Experimental Marine Biology and Ecology, 400, 52-69. 55
SECOND-ORDER DRAFT IPCC WGII AR5 Chapter 23
Do Not Cite, Quote, or Distribute 71 28 March 2013
Pilli-Sihlova, K., P. Aatola, M. Ollikainen, and H. Tuomenvirta, 2010: Climate Change and electricity consumption-1 Witnessing increasing or decreasing use and costs? Energy Policy, 38(5), 2409-2419. 2
Pinto, J.G., U. Ulbrich, G.C. Leckebusch, T. Spangehl, M. Reyers, and S. Zacharias, 2007a: Changes in storm track 3 and cyclone activity in three SRES ensemble experiments with the ECHAM5/MPI-OM1 GCM. Climate 4 Dynamics, 29(2-3), 195-210. 5
Pinto, J.G., C.P. Neuhaus, G.C. Leckebusch, M. Reyers, and M. Kerschgens, 2010: Estimation of wind storm 6 impacts over Western Germany under future climate conditions using a statistical-dynamical downscaling 7 approach. Tellus, 62(2), 188-201. 8
Pinto, J.G., E.L. Fröhlich, G.C. Leckebusch, and U. Ulbrich, 2007b: Changing European storm loss potentials under 9 modified climate conditions according to ensemble simulations of the ECHAM5/MPI-OM1 GCM. Natural 10 Hazards and Earth System Sciences, 7(1), 165-175. 11
Pitois, S.G. and C.J. Fox, 2006: Long-term changes in zooplankton biomass concentration and mean size over the 12 Northwest European shelf inferred from Continuous Plankton Recorder data. ICES Journal of Marine Science, 13 63(5), 785-798. 14
Planque, B., J. Fromentin, P. Cury, K.F. Drinkwater, S. Jennings, R.I. Perry, and S. Kifani, 2010: How does fishing 15 alter marine populations and ecosystems sensitivity to climate? Journal of Marine Systems, 79(3-4), 403-417. 16
Planton, S., P. Lionello, V. Artale, R. Aznar, A. Carillo, J. Colin, L. Congedi, C. Dubois, A. Elizalde Arellano, S. 17 Gualdi, E. Hertig, G. Jordà Sanchez, L. Li, J. Jucundus, C. Piani, P. Ruti, E. Sanchez-Gomez, G. Sannino, F. 18 Sevault, and S. Somot, 2011: The climate of the Mediterranean region in future climate projections (chapter 8). 19 In: Mediterranean Climate Variability. [Lionello, P. (ed.)]. Elsevier B.V., . 20
Poirier, M., J.L. Durand, and F. Volaire, 2012: Persistence and production of perennial grasses under water deficits 21 and extreme temperatures: importance of intraspecific vs. interspecific variability. Global Change Biology, , 22 3632-3646. 23
Polemio, M. and O. Petrucci, 2010: Occurrence of landslide events and the role of climate in the twentieth century in 24 Calabria, southern Italy. Quarterly Journal of Engineering Geology and Hydrogeology, 43, 403-415. 25
Popov Janevska, D., R. Gospavic, E. Pacholewicz, and V. Popov, 2010: Application of HACCP-QMRA approach 26 for managing the impact of climate change on food quality and safety. Food Research International, 43(7), 27 1915-1924. 28
Post, J., T. Conradt, F. Suckow, V. Krysanova, F. Wechsung, and F.F. Hattermann, 2008: Integrated assessment of 29 cropland soil carbon sensitivity to recent and future climate in the Elbe River basin. Hydrological Sciences 30 Journal, 53(5), 1043-1058. 31
Power, A.G., 2010: Ecosystem services and agriculture: tradeoffs and synergies. Philosophical Transactions of the 32 Royal Society B: Biological Sciences, 365(1554), 2959-2971. 33
Pruszak, Z. and E. Zawadzka, 2008: Potential Implications of Sea-Level Rise for Poland. Journal of Coastal 34 Research, 24, 410-422. 35
Pryor, S.C. and R.J. Barthelmie, 2010: Climate change impacts on wind energy: a review. Renewable and 36 Sustainable Energy Reviews, 14(1), 430-437. 37
Pryor, S.C. and J.T. Schoof, 2010: Importance of the SRES in projections of climate change impacts on near-surface 38 wind regimes. Meteorologische Zeitschrift, 19(3), 267-274. 39
Purvis, M.J., P.D. Bates, and C.M. Hayes, 2008: A probabilistic methodology to estimate future coastal flood risk 40 due to sea level rise. Coastal Engineering, 55(12), 1062-1073. 41
Queyriaux, B., A. Armengaud, C. Jeannin, C. Coutourier, and F. Peloux-Petiot, 2008: Chikungunya in Europe. 42 Lancet, 371, 723-724. 43
Quintana-Segui, P., F. Habets, and E. Martin, 2011: Comparison of past and future Mediterranean high and low 44 extremes of precipitation and river flow projected using different statistical downscaling methods. Natural 45 Hazards and Earth System Sciences, 11(5), 1411-1432. 46
Raftoyannis, Y., I. Spanos, and K. Radoglou, 2008: he decline of Greek fir (Abies cephalonica Loudon): 47 Relationships with root condition. Plant Biosystems, 142(-), 386-390. 48
Rahel, F.J. and J.D. Olden, 2008: Assessing the effects of climate change on aquatic invasive species. Conservation 49 Biology, 22(13), 521-533. 50
Räisänen, J. and J. Eklund, 2011: 21st Century changes in snow climate in Northern Europe: a high-resolution view 51 from ENSEMBLES regional climate models. Climate Dynamics, . 52
Randolph, S.E. and D.J. Rogers, 2010: The arrival, establishment and spread of exotic diseases: patterns and 53 predictions. Nature Reviews, 8, 361-371. 54
Rauthe, M., M. Kunz, and C. Kottmeier, 2010: Changes in wind gust extremes over Central Europe derived from a 55 small ensemble of high resolution regional climate models. Meteorologische Zeitschrift, 19(3), 299-312. 56
SECOND-ORDER DRAFT IPCC WGII AR5 Chapter 23
Do Not Cite, Quote, or Distribute 72 28 March 2013
Ready, P.D., 2010: Leishmaniasis emergence in Europe. Eurosurveillance, 15(10), 19505. 1 Rees, P., N. van der Gaag, J. de Beer, and F. Heins, 2012: European Regional Populations: Current Trends, Future 2
Pathways, and Policy Options. European Journal of Population, 28(4), 385-416. 3 Rees, W.G., F.M. Stammler, F.S. Danks, and P. Vitebsky, 2008: Vulnerability of european reindeer husbandry to 4
global change. Climatic Change, 871-2, 199-217. 5 Refsgaard, J.C., K. Arnbjerg-Nielsen, M. Drews, K. Halsnæs, E. Jeppesen, H. Madsen, A. Markandya, J.E. Olesen, 6
J.R. Porter, and J.H. Christensen, 2013: The role of uncertainty in climate change adaptation strategies. A 7 Danish water management example. Mitigation and Adaptation Strategies for Global Change, 18, 337-359. 8
Reginster, I. and M. Rounsevell, 2006: Scenarios of future urban land use in Europe. Environment and Planning B: 9 Planning & Design, 33, 619-636. 10
Reidsma, P., F. Ewert, A.O. Lansink, and R. Leemans, 2009: Vulnerability and adaptation of European farmers: a 11 multi-level analysis of yield and income responses to climate variability. Regional Environmental Change, 9(1), 12 25-40. 13
Renard, B., M. Lang, P. Bois, A. Dupeyrat, O. Mestre, H. Niel, E. Sauquet, C. Prudhomme, S. Parey, E. Paquet, L. 14 Neppel, and J. Gailhard, 2008: Regional methods for trend detection: Assessing field significance and regional 15 consistency. Water Resources Research, 44(8), W08419. 16
Renaudeau, D., J.L. Gourdine, and N.R. St-Pierre, 2011: A meta-analysis of the effect of high ambient temperature 17 on growing–finishing pigs. Journal of Animal Science, 89(2220), 2230. 18
Renaudeau, D., A. Collin, S. Yahav, V. De Basilio, J.L. Gourdine, and R.J. Collier, 2012: Adaptation to hot climate 19 and strategies to alleviate heat stress in livestock production. Animal, 6(5), 707-728. 20
Resco, d.D., C. Fischer, and C. Colinas, 2007: Climate Change Effects on Mediterranean Forests and Preventive 21 Measures. New Forests, 33(1), 29-40. 22
Rickebusch, S., W. Thuiller, T. Hickler, M.B. Araújo, M.T. Sykes, O. Schweiger, and B. Lafourcade, 2008: 23 Incorporating the effects of changes in vegetation functioning and CO 2 on water availability in plant habitat 24 models. Biology Letters, 4(5), 556-559. 25
Rico-Amoros, A.-., J. Olcina-Cantosa, and D. Sauri, 2009: Tourist land use patterns and water demand: Evidence 26 from the Western Mediterranean 27 . Land use Policy, 26, 493-501. 28
Rixen, C., M. Teich, C. Lardelli, D. Gallati, M. Pohl, M. Pütz, and P. Bebi, 2011: Winter tourism and climate 29 change in the Alps: An assessment of resource consumption, snow reliability, and future snowmaking potential. 30 Mountain Research and Development, 31(3), 229-236. 31
Robine, J.-., S.L.K. Cheung, S. Le Roy, H. Van Oyen, C. Griffiths, J.-. Michel, and F.R. Herrmann, 2008: Death toll 32 exceeded 70,000 in Europe during the summer of 2003. Comptes Rendus - Biologies, 331(2), 171-178. 33
Rockel, B. and K. Woth, 2007: Extremes of near-surface wind speed over Europe and their future changes as 34 estimated from an ensemble of RCM simulations. Climatic Change, 81(Suppl 1), 267-280. 35
Rocklöv, J. and B. Forsberg, 2010: The Effect of High Ambient Temperature on the Elderly Population in Three 36 Regions of Sweden. International Journal of Environmental Research and Public Health, 7(6), 2607-2619. 37
Rockmann, C., R.S.J. Tol, U.A. Schneider, and St John M.A., 2009: Rebuilding the Eastern Baltic Cod Stock under 38 Environmental Change (Part Ii): Taking into Account the Costs of a Marine Protected Area. Natural Resource 39 Modeling, 22(1), 1-25. 40
Rodolfi, A., M. Chiesi, G. Tagliaferri, P. Cherubini, and F. Maselli, 2007: Assessment of forest GPP variations in 41 central Italy. Canadian Journal of Forest Research, 37(10), 0-0. 42
Roiz, D., M. Neteler, C. Castellani, D. Arnoldi, and A. Rizzoli, 2011: Climatic factors driving invasion of the tiger 43 mosquito (Aedes albopictus) into new areas of Trentino, northern Italy. PLoS One, 6(4). 44
Rojas, R., L. Feyen, A. Bianchi, and A. Dosio, 2012: Assessment of future flood hazard in Europe using a large 45 ensemble of bias-corrected regional climate simulations. Journal of Geophysical Research D: Atmospheres, 46 117(17). 47
Romero-Calcerrada, R., F. Barrio-Parra, J.D.A. Millington, and C.J. Novillo, 2010: Spatial modelling of 48 socioeconomic data to understand patterns of human-caused wildfire ignition risk in the SW of Madrid (central 49 Spain). Ecological Modelling, 221(1), 34-45. 50
Roos, J., R. Hopkins, A. Kvarnheden, and C. Dixelius, 2011: The impact of global warming on plant diseases and 51 insect vectors in Sweden. European Journal of Plant Pathology, 129(1), 9-19. 52
Rosan, P. and D. Hammarlund, 2007: Effects of climate, fire and vegetation development on Holocene changes in 53 total organic carbon concentration in three boreal forest lakes in northern Sweden. Biogeosciences, 4(6), 975-54 984. 55
SECOND-ORDER DRAFT IPCC WGII AR5 Chapter 23
Do Not Cite, Quote, or Distribute 73 28 March 2013
Rosenzweig, C., D. Karoly, M. Vicarelli, P. Neofotis, Q. Wu, G. Casassa, A. Menzel, T.L. Root, N. Estrella, B. 1 Seguin, P. Tryjanowski, C. Liu, S. Rawlins, and A. Imeson, 2008: Attributing physical and biological impacts 2 to anthropogenic climate change. Nature, 453, 353-357. 3
Rosenzweig, C. and F.N. Tubiello, 2007: Adaptation and mitigation strategies in agriculture: An analysis of 4 potential synergies. Mitigation and Adaptation Strategies for Global Change, 12(5), 855-873. 5
Rötter, R.P., T. Palosuo, N.K. Pirttioja, M. Dubrovski, T. Salo, S. Fronzek, R. Aikasalo, M. Trnka, A. Ristolainen, 6 and T. Carter, 2011: What would happen to barley production in Finland if global warming exceeded 4 °C? A 7 model-based assessment. European Journal of Agronomy, 35, 205-214. 8
Rouault, G., J.-. Candau, F. Lieutier, L.-. Nageleisen, J.-. Martin, and N. Warzée, 2006: Effects of drought and heat 9 on forest insect populations in relation to the 2003 drought in Western Europe. Annals of Forest Science, 63(6), 10 613-624. 11
Rounsevell, M.D.A., I. Reginster, M.B. Araújo, T.R. Carter, N. Dendoncker, F. Ewert, J.I. House, S. Kankaanpää, 12 R. Leemans, M.J. Metzger, C. Schmit, P. Smith, and G. Tuck, 2006: A coherent set of future land use change 13 scenarios for Europe. Agriculture, Ecosystems and Environment, 114(1), 57-68. 14
Rounsevell, M.D.A. and D.S. Reay, 2009: Land use and climate change in the UK. Land use Policy, 26(S), 160-169. 15 Rounsevell, M.D.A. and M.J. Metzger, 2010: Developing qualitative scenario storylines for environmental change 16
assessment. Wiley Interdisciplinary Reviews: Climate Change, 1(4), 606-619. 17 Rubolini, D., R. Ambrosini, M. Caffi, P. Brichetti, S. Armiraglio, and N. Saino, 2007a: Long-term trends in first 18
arrival and first egg laying dates of some migrant and resident bird species in northern Italy. International 19 Journal of Biometeorology, 51(6), 553-563. 20
Rubolini, D., A.P. Møller, K. Rainio, and E. Lehikoinen, 2007b: Intraspecific consistency and geographic variability 21 in temporal trends of spring migration phenology among european bird species. Climate Research, 35(1-2), 22 135-146. 23
Ruiz-Ramos, D.V., E.A. Hernandez-Delgado, and N.V. Schizas, 2011: Population status of the long-spined urchin 24 diadema antillarum in Puerto Rico 20 years after a mass mortality event. Bulletin of Marine Science, 87(1), 113-25 127. 26
Rutty, M. and D. Scott, 2010: Will the Mediterranean become “too hot” for tourism? A reassessment. Tourism 27 Planning & Development, 7(3), 267-281. 28
Sabbioni, C., A. Bonazza, and P. Messina, 2008: Global climate change and archaeological heritage: prevision, 29 impact and mapping. In: ARCHAIA. Case Studies on Research Planning, Characterisation, Conservation and 30 Management of Archaeological Sites . [Marchetti, N. and I. Thuesen(eds.)]. Archaeopress, Oxford, pp. 295-300. 31
Sabbioni, C., P. Brimblecombe, and M. Cassar, 2010: Atlas of Climate Change Impact on European Cultural 32 Heritage. Anthem Press, London, pp. 160. 33
Sabir, M., J. Ommeren, M. Koetse, and P. Rietveld, 2010: Adverse Weather and Commuting Speed. Networks and 34 Spatial Economics, , 1-12. 35
Saino, N., R. Ambrosini, D. Rubolini, J. Von Hardenberg, A. Provenzale, K. Hüppop, O. Hüppop, A. Lehikoinen, E. 36 Lehikoinen, K. Rainio, M. Romano, and L. Sokolov, 2011: Climate warming, ecological mismatch at arrival 37 and population decline in migratory birds. Proceedings of the Royal Society B: Biological Sciences, 278(1707), 38 835-842. 39
Sainz-Elipe, S., J.M. Latorre, R. Escosa, M. Masià, M.V. Fuentes, S. Mas-Coma, and M.D. Bargues, 2010: Malaria 40 resurgence risk in Southern Europe: climate assessment in an historically endemic area of rice fields at the 41 Mediterranean shore of Spain. Malaria Journal, 9(1), 221-237. 42
Salis, M., A. Ager, B. Arca, M. Finney, V. Bacciu, P. Duce, and D. Spano, 2013: Assessing exposure of human and 43 ecological values to wildfire in Sardinia, Italy. . International Journal of Wildland Fire, in press 44 (doi:10.1071/WF11060). 45
Sanchez-Rodriguez, R., 2009: Learning to adapt to climate change in urban areas. A review of recent contributions. 46 Current Opinion in Environmental Sustainability, 1(2), 201-206. 47
Santos, J.A., A.C. Malheiro, M.K. Karremann, and J.G. Pinto, 2011: Statistical modelling of grapevine yield in the 48 Port Wine region under present and future climate conditions. International Journal of Biometeorology, 55(2), 49 119-131. 50
Sauter, T., C. Weitzenkamp, and C. Schneider, 2010: Spatio-temporal prediction of snow cover in the Black Forest 51 mountain range using remote sensing and a recurrent neural network. International Journal of Climatology, 52 30(15), 2330-2341. 53
Savé, R., F. de Herralde, X. Aranda, E. Pla, D. Pascual, I. Funes, and C. Biel, 2012: Potential changes in irrigation 54 requirements and phenology of maize, apple trees and alfalfa under global change conditions in Fluvià 55
SECOND-ORDER DRAFT IPCC WGII AR5 Chapter 23
Do Not Cite, Quote, or Distribute 74 28 March 2013
watershed during XXIst century: Results from a modeling approximation to watershed-level water balance. 1 Agricultural Water Management, 114, 78-87. 2
Schaefer, H.-., W. Jetz, and K. Böhning-Gaese, 2008: Impact of climate change on migratory birds: community 3 reassembly versus adaptation of species. Global Ecology and Biogeography, 17, 38-49. 4
Schaefli, B., B. Hingray, and A. Musy, 2007: Climate change and hydropower production in the Swiss Alps: 5 quantification of potential impacts and related modeling uncertainties. Hydrology & Earth System Sciences, 6 11(3), 1191-1205. 7
Schär, C. and G. Jendritzky, 2004: Climate change: hot news from summer 2003. Nature, 432, 559-560. 8 Schelhaas, M.J., G. Hengeveld, M. Moriondo, G.J. Reinds, Z.W. Kundzewicz, H. ter Maat, and M. Bindi, 2010: 9
Assessing risk and adaptation options to fires and windstorms in European forestry. Mitigation and Adaptation 10 Strategies for Global Change, 15(7), 681-701. 11
Schifano, P., M. Leone, M. De Sario, F. de'Donato, A.M. Bargagli, D. D'Ippoliti, C. Marino, and P. Michelozzi, 12 2012: Changes in the effects of heat on mortality among the elderly from 1998-2010: results from a multicentre 13 time series study in Italy. Environmental Health, 118(58). 14
Schmidli, J., C.M. Goodess, C. Frei, M.R. Haylock, Y. Hundecha, J. Ribalaygua, and T. Schmith, 2007: Statistical 15 and dynamical downscaling of precipitation: an evaluation and comparison of scenarios for the European Alps. 16 Journal of Geophysical Research, 112. 17
Schmocker-Fackel, P. and F. Naef, 2010: Changes in flood frequencies in Switzerland since 1500. Hydrology and 18 Earth System Sciences, 14(8), 1581-1594. 19
Schnitzler, J., J. Benzler, D. Altmann, I. Mucke, and G. Krause, 2007: Survey on the population's needs and the 20 public health response during floods in Germany 2002. Journal of Public Health Management and Practice, 21 13(5), 461-464. 22
Scholz, G., J.N. Quinton, and P. Strauss, 2008: Soil erosion from sugar beet in Central Europe in response to climate 23 change induced seasonal precipitation variations. Catena, 72(1), 91-105. 24
Schulze, E.D., S. Luyssaert, P. Ciais, A. Freibauer, I.A. Janssens, J.F. Soussana, P. Smith, J. Grace, I. Levin, B. 25 Thiruchittampalam, M. Heimann, A.J. Dolman, R. Valentini, P. Bousquet, P. Peylin, W. Peters, C. Rödenbeck, 26 G. Etiope, N. Vuichard, M. Wattenbach, G.J. Nabuurs, Z. Poussi, J. Nieschulze, and J.H. Gash, 2010: 27 Importance of methane and nitrous oxide for Europe's terrestrial greenhouse-gas balance. Nature Geoscience, 28 2(12), 842-850. 29
Schutze, N. and G.H. Schmitz, 2010: OCCASION: New Planning Tool for Optimal Climate Change Adaption 30 Strategies in Irrigation. Journal of Irrigation and Drainage Engineering-Asce, 136(12), 836-846. 31
Schweiger, O., R.K. Heikkinen, A. Harpke, T. Hickler, S. Klotz, O. Kudrna, I. Kühn, J. Pöyry, and J. Settele, 2012: 32 Increasing range mismatching of interacting species under global change is related to their ecological 33 characteristics. Global Ecology and Biogeography, 21(1), 88-99. 34
Schwierz, C., P. Köllner-Heck, E.Z. Mutter, D.N. Bresch, P.-. Vidale, M. Wild, and C. Schär, 2010: Modelling 35 European winter wind storm losses in current and future climate. Climatic Change, 101, 485-514. 36
Seidl, R., M.-. Schelhaas, M. Lindner, and M.J. Lexer, 2009: Modelling bark beetle disturbances in a large scale 37 forest scenario model to assess climate change impacts and evaluate adaptive management strategies. Regional 38 Environmental Change, 9(2), 101-119. 39
Seljom, P., E. Rosenberg, A. Fidge, J. Haugen, M. Meir, J. Rekstad, and T. Jarlset, 2011: Modelling the effects of 40 climate change on the energy system-A case study of Norway. Energy Policy, 39, 7310-7321. 41
Semenov, M.A., 2009: Impacts of climate change on wheat in England and Wales. Journal of the Royal Society 42 Interface, 6(33), 343-350. 43
Semenov, M.A. and P.R. Shewry, 2011: Modelling predicts that heat stress, not drought, will increase vulnerability 44 of wheat in Europe. Scientific Reports, 1, 66-66. 45
Semenov, V.A., 2011: Climate-related changes in hazardous and adverse hydrological events in the Russian rivers. 46 Russian Meteorology and Hydrology, 36(2), 124-129. 47
Semenza, J., J. Suk, V. Estevez, K.L. Ebi, and E. Lindgren, 2012: Mapping Climate Change Vulnerabilities to 48 Infectious Diseases in Europe. Environmental Health Perspectives, 120, 385-392. 49
Senatore, A., G. Mendicino, G. Smiatek, and H. Kunstmann, 2011: Regional climate change projections and 50 hydrological impact analysis for a Mediterranean basin in Southern Italy. Journal of Hydrology, 399(1-2), 70-51 92. 52
Serquet, G. and M. Rebetez, 2011: Relationship between tourism demand in the Swiss Alps and hot summer air 53 temperatures associated with climate change. Climatic Change, . 54
SECOND-ORDER DRAFT IPCC WGII AR5 Chapter 23
Do Not Cite, Quote, or Distribute 75 28 March 2013
Shrubsole, C., I. Ridley, P. Biddulph, J. Milner, S. Vardoulakis, M. Ucci, P. Wilkinson, Z. Chalabi , and M. Davies, 1 2012: Indoor PM2.5 exposure in London’s domestic stock: modelling current and future exposures following 2 energy efficient refurbishment. Atmospheric Environment, 62, 336-343. 3
Siebert, S. and F. Ewert, 2012: Spatio-temporal patterns of phenological development in Germany in relation to 4 temperature and day length. Agricultural and Forest Meteorology, 152, 44-57. 5
Skeffington, M.S. and K. Hall, 2011: The ecology, distribution and invasiveness of Gunnera L. species in 6 Connemara, Western Ireland. Biology and Environment, 111(3). 7
Slangen, A., C. Katsman, R. van de Wal, L. Vermeersen, and R. Riva, 2012: Towards regional projections of 8 twenty-first century sea-level change based on IPCC SRES scenarios. Climate Dynamics, 38, 1191-1209. 9
Slippers, B. and M. Wingfield, 2007: Botryosphaeriaceae as endophytes and latent pathogens of woody plants: 10 diversity, ecology and impact. Fungal Biology Reviews, 21(2-3), 90-106. 11
Smith J., Smith P., M. Wattenbach, Zaehle, S., Hiederer, R., Jones, R. J. A., L. Montanarella, M.D.A. Rounsevell, I. 12 Reginster, and F. Ewert, 2005.: Projected changes in mineral soil carbon of European croplands and grasslands, 13 1990-2080. Global Change Biology, 11(12), 2141-2152. 14
Smith, P., and J.E. Olesen, 2010: Synergies between mitigation of, and adaptation to, climate change in agriculture. 15 Journal of Agricultural Science, 148, 543-552. 16
Smith, P.J., 2007: Climate Change, Mass Migration and the Military Response. Orbis, 51(4), 617-663. 17 Smith, T.M., R.W. Reynolds, T.C. Peterson, and J. Lawrimore, 2008: Improvements to NOAA's Historical Merged 18
Land-Ocean Surface Temperature analysis (1880-2006). Journal of Climate, 21, 2283-2293. 19 Solberg, S., Ø. Hov, A. Søvde, I.S.A. Isaksen, P. Coddeville, H. De Backer, C. Forster, Y. Orsolini, and K. Uhse, 20
2008: European surface ozone in the extreme summer 2003. Journal of Geophysical Research, 113. 21 Solymosi, N., C. Torma, A. Kern, A. Maróti-Agóts, Z. Barcza, L. Könyves, O. Berke, and J. Reiczigel, 2010: 22
Changing climate in Hungary and trends in the annual number of heat stress days. International Journal of 23 Biometeorology, 54(4), 423-431. 24
Sorte, C.J.B., S.L. Williams, and R.A. Zerebecki, 2010: Ocean warming increases threat of invasive species in a 25 marine fouling community. Ecology, 91, 2198-2204. 26
Sousa, P.M., R.M. Trigo, P. Aizpurua, R. Nieto, L. Gimeno, and R. Garcia-Herrera, 2011: Trends and extremes of 27 drought indices throughout the 20th century in the Mediterranean. Natural Hazards and Earth System Science, 28 11(1), 33-51. 29
Soussana, J.F. and A. Luscher, 2007: Temperate grasslands and global atmospheric change: a review. Grass and 30 Forage Science, 62(2), 127-134. 31
Soussana, J.F., A.I. Graux, and F.N. Tubiello, 2010: Improving the use of modelling for projections of climate 32 change impacts on crops and pastures. Journal of Experimental Botany, 61(8), 2217-2228. 33
Spangenberg, L., F. Battke, M. Grana, K. Nieselt, and H. Naya, 2011: Identifying associations between amino acid 34 changes and meta information in alignments. Bioinformatics, 27(20), 2782-2789. 35
Stafoggia, M., F. Forastiere, D. Agostini, N. Caranci, F. de'Donato, M. Demaria, P. Michelozzi, R. Miglio, M. 36 Rognoni, A. Russo, and C.A. Perucci, 2008: Factors affecting in-hospital heat-related mortality: a multi-city 37 case-crossover analysis 38 . Journal of Epidemiology and Community Health, 62(3), 209-215. 39
Stahl, K., H. Hisdal, J. Hannaford, L.M. Tallaksen, H.A.J. van Lanen, E. Sauquet, S. Demuth, M. Fendekova, and J. 40 Jódar, 2010: Streamflow trends in Europe: evidence from a dataset of near-natural catchments. Hydrology & 41 Earth System Sciences, 14, 2367-2382. 42
Stanzel, P. and H.P. Nachtnebel, 2010: Mögliche Auswirkungen des Klimawandels auf den Wasserhaushalt und die 43 Wasserkraftnutzung in Österreich. Österreichische Wasser-Und Abfallwirtschaft, 62(9-10), 180-187. 44
Steele-Dunne, S., P. Lynch, R. McGrath, T. Semmler, S. Wang, J. Hanafin, and P. Nolan, 2008: The impacts of 45 climate change on hydrology in Ireland. Journal of Hydrology, 356(1-2), 28-45. 46
Steiger, R. and M. Mayer, 2008: Snowmaking and climate change: Future options for snow production in tyrolean 47 ski resorts. Mountain Research and Development, 28(3-4), 292-298. 48
Steiger, R., 2010a: The impact of climate change on ski season length and snowmaking requirements in Tyrol, 49 Austria. Climate Research, 43, 251-262. 50
Steiger, R., 2010b: The impact of climate change on ski touristic demand using an analogue approach. In: Strategies, 51 Policies and Measures for the Tourism Industry . [Weiermair, K., H. Pechlaner, A. Strobl, and M. Elmi(eds.)]. 52 Innsbruck University Press, Innsbruck, . 53
Steiger, R., 2011: The impact of snow scarcity on ski tourism. An analysis of the record warm season 2006/07 in 54 Tyrol (Austria). Tourism Review, 66(3), 4-13. 55
SECOND-ORDER DRAFT IPCC WGII AR5 Chapter 23
Do Not Cite, Quote, or Distribute 76 28 March 2013
Steiger, R., 2012: Scenarios for skiing tourism in Austria: integrating demographics with an analysis of climate 1 change. Journal of Sustainable Tourism, 20(6), 867-882. 2
Sterl, A., H. van den Brink, H. de Vries, R. Haarsma, and E. van Meijgaard, 2009: An ensemble study of extreme 3 storm surge related water levels in the North Sea in a changing climate. Ocean Science, 5, 369-378 4 (doi:10.5194/os-5-369-2009). 5
Stoate, C., A. Báldi, P. Beja, N.D. Boatman, I. Herzon, A. van Doorn, de Snoo G.R., L. Rakosy, and C. Ramwell, 6 2009: Ecological impacts of early 21st century agricultural change in Europe--a review. Journal of 7 Environmental Management, 91(1), 22-46. 8
Stoll, S., H.J. Hendricks Franssen, M. Butts, and W. Kinzelbach, 2011: Analysis of the impact of climate change on 9 groundwater related hydrological fluxes: a multi-model approach including different downscaling methods. 10 Hydrology & Earth System Sciences, 15, 21-38. 11
Storm, J., A.W. Cattaneo, and F. Trincardi, 2008: Coastal dynamics under conditions of rapid sea-level rise: Late 12 Pleistocene to Early Holocene evolution of barrier-lagoon systems on the Northern Adriatic shelf (Italy). 13 Quaternary Science Reviews, 27(11-12), 1107-1123. 14
Stratonovitch, P., 2012: A process �based approach to modelling impacts of climate change on the damage niche 15 of an agricultural weed. Global Change …, , 2071-2080. 16
Streftaris, N., A. Zenetos, and E. Papathanassiou, 2005: Globalisation in marine ecosystems: the story of non-17 indigenous marine species across European seas. Oceanogr Mar Biol-an Annual Review, 43, 419-453. 18
Supit, I., C.A. van Diepen, A.J.W. de Wit, P. Kabat, B. Baruth, and F. Ludwig, 2010: Recent changes in the climatic 19 yield potential of various crops in Europe. Agricultural Systems, 103, 683-694. 20
Supit, I., C.a. van Diepen, a.J.W. de Wit, J. Wolf, P. Kabat, B. Baruth, and F. Ludwig, 2012: Assessing climate 21 change effects on European crop yields using the Crop Growth Monitoring System and a weather generator. 22 Agricultural and Forest Meteorology, 164, 96-111. 23
Surminski, S. and A. Philp, 2010: Briefing: Guidance on insurance issues for new developments. Proceedings of the 24 Institution of Civil Engineers: Engineering Sustainability, 163(1), 3-6. 25
Swart, R., L. Bernstein, M. Ha-Duong, and A. Petersen, 2009: Agreeing to disagree: uncertainty management in 26 assessing climate change, impacts and responses by the IPCC. Climatic Change, 92(1), 29. 27
Tardieu, F., 2012: Any trait or trait-related allele can confer drought tolerance: Just design the right drought 28 scenario. Journal of Experimental Botany, 63(1), 25-31. 29
Tasker, M.L., 2008: The effect of climate change on the distribution and abundance of marine species in the OSPAR 30 Maritime Area., pp. 49-49. 31
Taylor, S., L. Kumar, N. Reid, and D.J. Kriticos, 2012: Climate Change and the Potential Distribution of an Invasive 32 Shrub, Lantana camara L. 33 . PLoS ONE, 7(4), e35565. 34
Te Linde, A.H., 2007: Effects of climate change on discharge behaviour of the river Rhine.[Heinongen, M. (ed.)]. 35 Proceedings of Proceedings of the Third International Conference on Climate and Water. 3 - 6 September 2007, 36 Helsinki, Finland. 37
Te Linde, A.H., J.C.J.H. Aerts, A.M.R. Bakker, and J.C.J. Kwadijk, 2010a: Simulating low-probability peak 38 discharges for the Rhine basin using resampled climate modeling data. Water Resources Research, 39 46(W03512), 1-19. 40
Te Linde, A.H., J.C.J.H. Aerts, and J.C.J. Kwadijk, 2010b: Effectiveness of flood management measures on peak 41 discharges in the Rhine basin under climate change. Journal of Flood Risk Management, 3(4), 248-269. 42
Te Linde, A.H., P. Bubeck, J.E.C. Dekkers, H. De Moel, and J.C.J.H. Aerts, 2011: Future flood risk estimates along 43 the river Rhine. Natural Hazards and Earth System Sciences, 11(2), 459-473. 44
Teich, M., C. Marty, C. Gollut, A. Grêt-Regamey, and P. Bebi, 2012: Snow and weather conditions associated with 45 avalanche releases in forests: Rare situations with decreasing trends during the last 41years. Cold Regions 46 Science and Technology, 83-84, 77-88. 47
ten Brinke, W.B.M., B. Kolen, A. Dollee, H. van Waveren, and K. Wouters, 2010: Contingency Planning for Large-48 Scale Floods in the Netherlands. Journal of Contingencies and Crisis Management, 18(1), 55-69. 49
ter Hofstede, R., J. Hiddink, and A. Rijnsdorp, 2010: Regional warming changes fish species richness in the eastern 50 North Atlantic Ocean. Marine Ecology Progress Series, 414, 1-9. 51
Terpstra, T. and J.M. Gutteling, 2008: Households' Perceived Responsibilities in Flood Risk Management in The 52 Netherlands. International Journal of Water Resources Development, 24(4), 555-565. 53
Tervo, K., 2008: The operational and regional vulnerability of winter tourism to climate variability and change: The 54 case of the finnish nature-based tourism entrepreneurs. Scandinavian Journal of Hospitality and Tourism, 8(4), 55 317-332. 56
SECOND-ORDER DRAFT IPCC WGII AR5 Chapter 23
Do Not Cite, Quote, or Distribute 77 28 March 2013
Tester, M. and P. Langridge, 2010: Breeding technologies to increase crop production in a changing world. Science 1 (New York, N.Y.), 327(5967), 818-22. 2
Thieken, A.H., T. Petrow, H. Kreibich, and B. Merz, 2006: Insurability and mitigation of flood losses in private 3 households in Germany. Risk Analysis, 26(2), 383-395. 4
Thodsen, H., B. Hasholt, and J.H. Kjarsgaard, 2008: The influence of climate change on suspended sediment 5 transport in Danish rivers. Hydrological Processes, 22(6), 764-774. 6
Thodsen, H., 2007: The influence of climate change on stream flow in Danish rivers. Journal of Hydrology, 333(2-7 4), 226-238. 8
Thuiller, W., S. Lavergne, C. Roquet, I. Boulangeat, B. Lafourcade, and M.B. Araujo, 2011: Consequences of 9 climate change on the tree of life in Europe. Nature, 470, 531-534. 10
Tobías, A., P. García de Olalla, C. Linares, M.J. Bleda, J.A. Caylà, and J. Díaz, 2010: Short-term effects of extreme 11 hot summer temperatures on total daily mortality in Barcelona, Spain. International Journal of Biometeorology, 12 54(2), 115-117. 13
Trnka, M., E. Kocmánková, J. Baleka, J. Eitzinger, F. Ruget, H. Formayer, P. Hlavinka, M. Schaumberger, V. 14 Horáková, M. . Možný, and Z. Žaluda, 2010: Simple snow cover model for agrometeorological applications. 15 Agricultural and Forest Meteorology, 150, 1115-1127. 16
Trnka, M., J.E. Olesen, K.C. Kersebaum, A.O. Skjelvåg, J. Eitzinger, B. Seguin, P. Peltonen-Sainio, R. Rötter, A. 17 Iglesias, S. Orlandini, M. Dubrovský, P. Hlavinka, J. Balek, H. Eckersten, E. Cloppet, P. Calanca, A. Gobin, V. 18 Vučetić, P. Nejedlik, S. Kumar, B. Lalic, A. Mestre, F. Rossi, J. Kozyra, V. Alexandrov, D. Semerádová, and Z. 19 Žalud, 2011: Agroclimatic conditions in Europe under climate change. Global Change Biology, 17(7), 2298-20 2318. 21
Trnka, M., F. Muska, D. Semeradova, M. Dubrovsky, E. Kocmankova, and Z. Zalud, 2007: European Corn Borer 22 life stage model: Regional estimates of pest development and spatial distribution under present and future 23 climate. Ecological Modelling, 207(2-4), 61-84. 24
Trnka, M., J. Eitzinger, P. Hlavinka, M. Dubrovska, D. Semeradova¡, P. Åtapanek, S. Thaler, Z. Åsalud, M. Molna, 25 and H. Formayer, 2009: Climate-driven changes of production regions in Central Europe. Plant and Soil, 26 2009(521), 257-266. 27
Trnka, M., R. Bra¡zdil, J. Olesen, J. Eitzinger, P. ZahradnÃÄ�ek, E. Kocmánková, P. Dobrovolný, P. 28 Å tÄ›pánek, M. Možný, L. BartoÅ¡ová, P. Hlavinka, D. Semerádová, H. Valášek, M. HavlÃ-29 Ä�ek, V. Horáková, M. Fischer, and Z. Žalud, 2012: Could the changes in regional crop yields be a 30 pointer of climatic change? Agricultural and Forest Meteorology, 166-167, 62-71. 31
Troccoli, A., F. Zambon, K. Hodges, and M. Marani, 2011 (in press): Storm surge frequency reduction in Venice 32 under climate change. Climatic Change, . 33
Troccoli, A., F. Zambon, K.I. Hodges, and M. Marani, 2012: Reply to comment on "Storm surge frequency 34 reduction in Venice under climate change" by G. Jordà, D. Gomis & M. Marcos. Climatic Change, 113(3-4), 35 1089-1095. 36
Tsanis, I.K., A.G. Koutroulis, I.N. Daliakopoulos, and D. Jacob, 2011: Severe climate-induced water shortage and 37 extremes in Crete. Climatic Change, 106(4), 667-677. 38
Tu, M., M.J. Hall, P.J.M. de Laat, and M.J.M. de Wit, 2005: Extreme floods in the Meuse river over the past 39 century: aggravated by land-use changes? Physics and Chemistry of the Earth, Parts A/B/C, 30(4-5), 267-276. 40
Tubiello, F.N., J.F. Soussana, and S.M. Howden, 2007: Crop and pasture response to climate change. Proceedings of 41 the National Academy of Sciences of the United States of America, 104(50), 19686-19690. 42
Tuck, G., M.J. Glendining, P. Smith, J.I. House, and M. Wattenbach, 2006: The potential distribution of bioenergy 43 crops in Europe under present and future climate. Biomass and Bioenergy, 30(3), 183-197. 44
Uhlmann, B., S. Goyette, and M. Beniston, 2009: Sensitivity analysis of snow patterns in Swiss ski resorts to shifts 45 in temperature, precipitation and humidity under conditions of climate change. International Journal of 46 Climatology, 29(8), 1048-1055. 47
UK National Ecosystem Assessment, 2011: The UK National Ecosystem Assessment: Technical Report. In: UK 48 National Ecosystem Assessment: Technical Report. UNEP-WCMC, Cambridge, . 49
Ulbrich, U., G.C. Leckebusch, and J.G. Pinto, 2009: Extra-tropical cyclones in the present and future climate: a 50 review. Theoretical and Applied Climatology, 96(1-2), 117-131. 51
Ulén, B.M. and G.A. Weyhenmeyer, 2007: Adapting regional eutrophication targets for surface waters--influence of 52 the EU Water Framework Directive, national policy and climate change. Environmental Science & Policy, 53 10(7-8), 734-742. 54
UNEP, 2010: Global Synthesis - A report from the Regional Seas Conventions and Action Plans for the Marine 55 Biodiversity Assessment and Outlook Series . 56
SECOND-ORDER DRAFT IPCC WGII AR5 Chapter 23
Do Not Cite, Quote, or Distribute 78 28 March 2013
Usbeck, T., t. Wohlgemuth, m. Dobbertin, c. Pfister, A. Burgi, and M. Rebetez, 2010: Increasing storm damage to 1 forests in Switzerland from 1858 to 2007. 2 . Agricultural and Forest Meteorology, 150, 47–55. 3
Valle, M.D., E. Codato, and A. Marcomini, 2007: Climate change influence on POPs distribution and fate: A case 4 study. Chemosphere, 67(7), 1287-1295. 5
Van der Linden, P. and J.F.B. Mitchell, Climate Change and its Impacts: Summary of research and results from the 6 ENSEMBLES project. In: Met Office Hadley Centre, Exeter, UK., pp. 160 pp. 7
van Dijk, J., N.D. Sargison, F. Kenyon, and P.J. Skuce, 2010: Climate change and infectious disease: 8 helminthological challenges to farmed ruminants in temperate regions. Animal, 4(3), 377-392. 9
Van Nieuwaal, K., P. Driessen, T. Spit, and C. Termeer, 2009: A State of the Art of Governance Literature on 10 Adaptation to Climate Change: Towards a Research Agenda. In: Report number 003/2009. Knowledge for 11 Climate (KfC), Utrecht, the Netherlands. 12
van Vliet, M.T.H. and J.J.G. Zwolsman, 2008: Impact of summer droughts on the water quality of the Meuse river. 13 Journal of Hydrology, 353(1-2), 1-17. 14
Van Vliet, M.T.H., J.R. Yearsley, F. Ludwig, S. Vögele, D.P. Lettenmaier, and P. Kabat, 2012: Vulnerability of US 15 and European electricity supply to climate change. Nature Climate Change, 2(9), 676-681. 16
van, d.V., G. Wriedt, and F. Bouraoui, 2010: Estimating irrigation use and effects on maize yield during the 2003 17 heatwave in France. Agriculture Ecosystems & Environment, 135(1-2), 90-97. 18
Varakina, Z.L., D.A. Shaposhnikov, B.A. Revich, A.M. Vyazmin, E.D. Yurasova, J. Nurse, and B. Menne, 2011: 19 The impact of air temperature on daily mortality in Archangelsk city in Northwest Russia: a time-series 20 analysis. European Journal of Public Health . 21
Vautard R et al, 2013: The simulation of European heat waves from an ensemble of 1 regional climate models 22 within the EURO-CORDEX project. Climate Dynamics, in review. 23
Vautard, R., J. Cattiaux, P. Yiou, J.-. Thepaut, and P. Ciais, 2010: Northern Hemisphere atmospheric stilling partly 24 attributed to an increase in surface roughness. Nature Geoscience, 3(11), 756-761. 25
Veijalainen, N., E. Lotsari, P. Alho, B. Vehviläinen, and J. Käyhkö, 2010: National scale assessment of climate 26 change impacts on flooding in Finland. Journal of Hydrology, 391(3-4), 333-350. 27
Ventrella, D., M. Charfeddine, and M. Bindi, 2012: Agronomic adaptation strategies under climate change for 28 winter durum wheat and tomato in southern Italy : irrigation and nitrogen fertilization. , 407-419. 29
Verburg, P.H., D.B. van Berkel, A.M. van Doorn, M. van Eupen, and H.A.R.M. van den Heiligenberg, 2010: 30 Trajectories of land use change in Europe: A model-based exploration of rural futures. Landscape Ecology, 31 25(2), 217-232. 32
Verny, J. and C. Grigentin, 2009: Container shipping on the Northern Sea Route. International Journal of 33 Production Economics, 122(1), 107-117. 34
Vidal, J.-. and S. Wade, 2009: A multimodel assessment of future climatological droughts in the United Kingdom. 35 International Journal of Climatology, 29(14), 2056-2071. 36
Vilén, T. and P.M. Fernandes, 2011: Forest Fires in Mediterranean Countries: CO2 Emissions and Mitigation 37 Possibilities Through Prescribed Burning. Environmental Management, 48, 558-567. 38
Villarini, G., J.A. Smith, F. Serinaldi, and A.A. Ntelekos, 2011: Analyses of seasonal and annual maximum daily 39 discharge records for Central Europe. Journal of Hydrology, 399(3-4), 299-312. 40
Vinagre, C., F.D. Santos, H. Cabral, and M.J. Costa, 2011: Impact of climate warming upon the fish assemblages of 41 the Portuguese coast under different scenarios. Regional Environmental Change, 11(4), 779-789. 42
Virkkala, R., R.K. Heikkinen, S. Fronzek, H. Kujala, and N. Leikola, 2013: Does the protected area network 43 preserve bird species of conservation concern in a rapidly changing climate? Biodiversity and Conservation, 44 22(2), 459-482. 45
Vorogushyn, S., K.-. Lindenschmidt, H. Kreibich, H. Apel, and B. Merz, 2012: Analysis of a detention basin impact 46 on dike failure probabilities and flood risk for a channel-dike-floodplain system along the river Elbe, Germany. 47 Journal of Hydrology, 436-437, 120-131. 48
Vos, C.C., P. Berry, P. Opdam, H. Baveco, B. Nijhof, J. OíHanley, C. Bell, and H. Kuipers, 2008: Adapting 49 landscapes to climate change: examples of climate-proof ecosystem networks and priority adaptation zones. 50 Journal of Applied Ecology, 45(6), 1722-1731. 51
Wade, S.D., J. Rance, and N. Reynard, 2012: The UK Climate Change Risk Assessment 2012: Assessing the 52 Impacts on Water Resources to Inform Policy Makers. Water Resources Management, , 1-25. 53
Wall, R. and L.S. Ellse, 2011: Climate change and livestock parasites: Integrated management of sheep blowfly 54 strike in a warmer environment. Global Change Biology, 17(5), 1770-1777. 55
SECOND-ORDER DRAFT IPCC WGII AR5 Chapter 23
Do Not Cite, Quote, or Distribute 79 28 March 2013
Wamsler, C. and N. Lawson, 2011: The Role of Formal and Informal Insurance Mechanisms for Reducing Urban 1 Disaster Risk: A South-North Comparison. Housing Studies, 26(2), 197-223. 2
Wang, S., R. Mcgrath, T. Semmler, and P. Nolan, 2006: The impact of the climate change on discharge of Suir 3 River Catchment (Ireland) under different climate scenarios. Natural Hazards and Earth System Science, 6(3), 4 387-395. 5
Wang, S., R. McGrath, J. Hanafin, P. Lynch, T. Semmler, and P. Nolan, 2008: The impact of climate change on 6 storm surges over Irish waters. Ocean Modelling, 25(1-2), 83-94. 7
Ward, D.M., F.M. Cohan , D. Bhaya , J.F. Heidelberg , M. Kuhl , and A. Grossman, 2008: Genomics, environmental 8 genomics and the issue of microbial species. Heredity, 100, 207-219. 9
Ward, P., H. Renssen, J. Aerts, and P. Verburg, 2011: Sensitivity of discharge and flood frequency to twenty-first 10 century and late Holocene changes in climate and land use (River Meuse, northwest Europe). Climatic Change, 11 106(2), 179-202. 12
Wasowski, J., C. Lamanna, and D. Casarano, 2010: Influence of land-use change and precipitation patterns on 13 landslide activity in the Daunia Apennines, Italy. Quarterly Journal of Engineering Geology and Hydrogeology, 14 43(4), 387-401. 15
Watkiss, P. and A. Hunt, 2010: Review of Adaptation Costs and Benefit estimates in Europe. Report Prepared for 16 the European Environment Agency . 17
Weber, R.W.S., 2009: An evaluation of possible effects of climate change on pathogenic fungi in apple production 18 using fruit rots as examples. Erwerbs-Obstbau, 51(3), 115-120. 19
Wedawatta, G.S.D. and M.J.B. Ingirige, 2012: Resilience and adaptation of small and medium-sized enterprises to 20 flood risk. Disaster Prevention and Management, in press. 21
Weiss, M., 2011: Future water availability in selected European catchments: a probabilistic assessment of seasonal 22 flows under the IPCC A1B emission scenario using response surfaces. Natural Hazards Earth System Sciences, 23 11, 2163-2171. 24
Wessolek, G. and S. Asseng, 2006: Trade-off between wheat yield and drainage under current and climate change 25 conditions in northeast Germany. European Journal of Agronomy, 24(4), 333-342. 26
West, J.S., J.A. Townsend, M. Stevens, and B.D.L. Fitt, 2012: Comparative biology of different plant pathogens to 27 estimate effects of climate change on crop diseases in Europe. European Journal of Plant Pathology, 133, 315-28 331. 29
Westerhoff, L., E.H. Keskitalo, and S. Juhola, 2011: Capacities across scales: Local to national adaptation policy in 30 four European countries. Climate Policy, 11(4), 1071-1085. 31
Wethey, D.S., S.A. Woodin, T.J. Hilbish, S.J. Jones, F.P. Lima, and P.M. Brannock , 2011: Response of intertidal 32 populations to climate: effects of extreme events verses long term change. Journal of Experimental Marine 33 Biology and Ecology, (400), 132-144. 34
White, M.A., P. Whalen, and G.V. Jones, 2009: Land and wine. Nature Geoscience, 2, 82-84. 35 Whitehead, P.G., R.L. Wilby, D. Butterfield, and A.J. Wade, 2006: Impacts of climate change on in-stream nitrogen 36
in a lowland chalk stream: An appraisal of adaptation strategies. Science of the Total Environment, 365(1-3), 37 260-273. 38
Whitehead, P.G., R.L. Wilby, R.W. Battarbee, M. Kernan, and A.J. Wade, 2009: A review of the potential impacts 39 of climate change on surface water quality. Hydrological Sciences Journal, 54(1), 101-123. 40
Whittle, R., W. Medd, H. Deeming, E. Kashefi, M. Mort, C. Twigger Ross, G. Walker, and N. Watson, 2010: After 41 the Rain - learning the lessons from flood recovery in Hull. Final project report for 'Flood, Vulnerability and 42 Urban Resilience: a real-time study of local recovery following the floods of June 2007 in Hull'. 43
WHO, 2008: Protecting health in Europe form cliamte change. World Health Organization, WHO/Europe. 44 Wiering, M.A. and B.J.M. Arts, 2006: Discursive shifts in Dutch river management: 'deep' institutional change or 45
adaptation strategy? In: Living Rivers: Trends and Challenges in Science and Management . [Leuven, 46 R.S.E.W., A.M.J. Ragas, A.J.M. Smits, and G. Velde(eds.)]. Springer Netherlands, pp. 327-338; 338. 47
Wilby, R.L., 2007: A Review of Climate Change Impacts on the Built Environment. Built Environment, 33(1), 31-48 45. 49
Wilby, R.L., 2008: Constructing climate change scenarios of urban heat island intensity and air quality. Environment 50 and Planning B: Planning and Design, 35(5), 902-919. 51
Wilby, R.L., P.G. Whitehead, A.J. Wade, D. Butterfield, R.J. Davis, and G. Watts, 2006: Integrated modelling of 52 climate change impacts on water resources and quality in a lowland catchment: River Kennet, UK. Journal of 53 Hydrology, 330(1-2), 204-220. 54
SECOND-ORDER DRAFT IPCC WGII AR5 Chapter 23
Do Not Cite, Quote, or Distribute 80 28 March 2013
Wilkinson, P., K.R. Smith, M. Davies, H. Adair, B.G. Armstrong, M. Barrett, N. Bruce, A. Haines, I. Hamilton, T. 1 Oreszczyn, I. Ridley, C. Tonne, and Z. Chalabi, 2009: Public health benefits of strategies to reduce greenhouse-2 gas emissions: household energy. The Lancet, 374(9705), 1917-1929. 3
Wilson, E., 2006: Adapting to climate change at the local level: the spatial planning response. Local Environment, 4 11(6), 609-625. 5
Wilson, G., 2008: Our knowledge ourselves: Engineers (re)thinking technology in development. Journal of 6 International Development, 20(6), 739-750. 7
Wilson, A.J. and P.S. Mellor, 2009: Bluetongue in Europe: past, present and future. Philosophical Transactions of 8 the Royal Society B-Biological Sciences, 364(1530), 2669-2681. 9
Wilson, D., H. Hisdal, and D. Lawrence, 2010: Has streamflow changed in the Nordic countries? – Recent trends 10 and comparisons to hydrological projections. Journal of Hydrology, 394(3–4), 334-346. 11
WLO, 2006: Welvaart en Leefomgeving: een scenariostudie voor Nederland in 2040 [in Dutch]. Central Planning 12 Bureau, Netherlands Environmental Assessment Agency and Spatial Planning Burea, Den Haag. 13
Wong, W.K., B. Stein, E. Torill, H. Ingjerd, and H. Hege, 2011: Climate change effects on spatiotemporal patterns 14 of hydroclimatological summer droughts in Norway. J.Hydrometeorol., 12, 1205-1220. 15
Wreford, A., D. Moran, and N. Adger , 2010: Climate change and agriculture. Impacts, adaptation and mitigation. 16 OECD, Paris, pp. 135. 17
Yiou, P., P. Ribereau, P. Naveau, M. Nogaj, and R. Brazdil, 2006: Statistical analysis of floods in Bohemia (Czech 18 Republic) since 1825. Hydrological Sciences Journal, 51(5), 930-945. 19
Zachariadis, T., 2010: Forecast of electricity consumption in Cyprus up to the year 2030: The potential impact of 20 climate change. Energy Policy, 38(2), 744-750. 21
Zhou, Q., P.S. Mikkelsen, K. Halsnæs, and K. Arnbjerg-Nielsen, 2012: Framework for economic pluvial flood risk 22 assessment considering climate change effects and adaptation benefits. Journal of Hydrology, 414-415, 539-23 549. 24
Zsamboky, M., A. Fernandez-Bilbao, D. Smith, J. Knight, and J. Allan, 2011: Impacts of climate change on 25 disadvantaged UK coastal communities. Joseph Rowntree Foundation, York. 26
Zylicz, T., 2010: Goals and Principles of Environmental Policy. International Review of Environmental and 27 Resource Economics, 3(4), 299-334. 28
29
SECOND-ORDER DRAFT IPCC WGII AR5 Chapter 23
Do Not Cite, Quote, or Distribute 81 28 March 2013
Min -‐4 -‐4 -‐4 -‐5 -‐3Likely in the range -‐4 to -‐5 -‐4 to -‐6 -‐5 to -‐6 -‐5 to -‐8 -‐4 to -‐5
Max -‐8 -‐9 -‐9 -‐9 -‐8
Median 7 3 3 16 -‐15
Min 1 9 -‐9 4 -‐7Likely in the range 5 to 12 -‐4 to 5 -‐1 to 5 13 to 21 -‐12 to -‐18
Max 15 -‐11 12 29 -‐25
Median 57 65 53 64 43
Min 35 28 31 32 21
Likely in the range 47 to 68 42 to 98 44 to 77 47 to 88 35 to 57
Max 117 112 110 105 74
2071
-‐210
0 minus 197
1-‐20
00
Growing season length (5)
days per growing season xx
Warm spell duration index (14)
days per year x
Cold spell duration index (15) days per year x
Annual total precipitation (27)
in % xx
Annual total precipitation
where RR>99p of 1971/2000 (26) in %
xx
Mean annual temperature
in K xx
Frost days (1) per year x
Summer days (2) per year x
Tropical nights (4) per year x
Table 23-1: Projected Changes of Selected Climate Parameters and Indices1 for the Period 2071-2100 with Respect to 1971-2000 Spatially Averaged for Europe Sub-regions. The likely range defines the range of 66% of all projected changes around the ensemble median. A) A1B scenario. Numbers are based on 9 (indicated with *) and 20 (indicated with **) regional model simulations taken from EU-ENSEMBLES project for the SRES A1B emission scenario.
1 Index definition from http://cccma.seos.uvic.ca/etccdi/list_27_indices.shtml
SECOND-ORDER DRAFT IPCC WGII AR5 Chapter 23
Do Not Cite, Quote, or Distribute 82 28 March 2013
B) RCP4.5 scenario. Numbers are based on 7 (indicated with *) and 8 (indicated with **) regional model simulations taken from EURO-CORDEX project for the RCP 4.5 emission scenario.
Likely in the range 1,9 to 2,6 1,4 to 1,7 1,6 to 2,3 2,0 to 3,1 1,9 to 2,1
Max 3,4 2,1 3,2 4,3 2,7
Median -‐39 -‐27 -‐34 -‐35 -‐20
Min -‐25 -‐12 -‐16 -‐24 -‐10Likely in the range -‐26 to -‐41 -‐15 to -‐30 -‐18 to -‐38 -‐26 to -‐41 -‐11 to -‐25
Max -‐47 -‐30 -‐40 -‐52 -‐29
Median 8 11 20 4 27
Min 3 6 11 2 21Likely in the range 4 to 11 7 to 14 13 to 24 2 to 13 25 to 33
Max 18 33 28 16 36
Median 1 4 10 1 23
Min 0 0 2 0 7Likely in the range 1 to 3 3 to 5 9 to 27 0 to 5 18 to 25
Max 8 18 30 7 41
Median 25 36 22 19 24
Min 23 24 17 17 16Likely in the range 23 to 35 27 to 40 20 to 29 19 to 27 17 to 31
Max 39 45 41 33 38
Median 36 21 24 37 37
Min 27 18 18 22 30Likely in the range 28 to 59 19 to 29 18 to 44 23 to 45 33 to 73
Max 70 56 53 65 83Median -‐5 -‐4 -‐5 -‐6 -‐4
Min -‐3 -‐4 -‐4 -‐5 -‐3Likely in the range -‐4 to -‐6 -‐4 to -‐5 -‐4 to -‐6 -‐6 to -‐7 -‐3 to -‐4
Max -‐7 -‐6 -‐7 -‐7 -‐6
Median 5 1 9 10 -‐6
Min 3 -‐1 0 7 -‐11Likely in the range 4 to 7 -‐1 to 4 1 to 13 8 to 14 -‐10 to 0
Max 12 9 16 22 0
Median 53 36 46 43 36
Min 24 20 17 27 23
Likely in the range 25 to 61 25 to 67 33 to 60 28 to 65 31 to 55
Max 73 73 74 70 62
2071
-‐210
0 minus 197
1-‐20
00
Growing season length (5)
days per growing season x
Warm spell duration index (14)
days per year xx
Cold spell duration index (15)
days per year xx
Annual total precipitation (27)
in % x
Annual total precipitation
where RR>99p of 1971/2000 (26)
in % x
Mean annual temperature
in K x
Frostdays (1) per year xx
Summerdays (2) per year xx
Tropicalnights (4) per year xx
SECOND-ORDER DRAFT IPCC WGII AR5 Chapter 23
Do Not Cite, Quote, or Distribute 83 28 March 2013
Table 23-2: Assessment of climate change impacts on ecosystem services by sub-region and sector. Assessment assuming medium economic development, with land use change and no planned adaptation.
Southern Atlantic Continental Northern Alpine
Provisioning services:
Food production Decreasing Increasing to decreasing
No change to decreasing
Increasing to decreasing
Increasing to decreasing
Livestock production Decreasing Increasing to decreasing Decreasing Increasing Increasing to
decreasing Fibre production Decreasing
Bioenergy production Decreasing Increasing Increasing
Fisheries production No change to decreasing
No change to decreasing Decreasing No change to
decreasing
Timber production Decreasing No change to increasing
Increasing to decreasing Increasing Increasing to
decreasing
Non-wood forest products Decreasing No change to increasing
- Drought regulation Decreasing No change to decreasing
Water quality regulation Decreasing Decreasing
Cultural services: Recreation (fishing, nature enjoyment) Decreasing Decreasing Increasing to
decreasing Decreasing
Tourism (skiing) Decreasing Increasing Aesthetic/heritage (landscape character, cultural landscapes)
Decreasing Decreasing No change to decreasing Decreasing
Biodiversity Decreasing Increasing to decreasing Decreasing Increasing to
decreasing
* Forest fires or moorland wildfires increase
SECOND-ORDER DRAFT IPCC WGII AR5 Chapter 23
Do Not Cite, Quote, or Distribute 84 28 March 2013
Table 23-3: Selected published adaptation cost estimates for European countries. Population Cost estimate Time period Sectors/Outcomes Reference Europe €2.5–5 billion/a By 2080s Coastal protection Brown et al.,
submitted b Europe €1.7 billion/a
€3.4 billion/a €7.9 billion/a
By 2020s By 2050s By 2080s
Protection from river flood risk
Rojas et al., submitted
Netherlands €1.2–1.6 billion/a €0.9–1.5 billion/a
up to 2050 2050–2100
Protection from coastal and river flooding
Delta Committee, 2008
Sweden total of up to €10 billion
over period 2010-2100
Multi sector Swedish Commission on Climate and Vulnerability, 2007
Greece 170-770 million € 2071-2100 Higher electricity generation cost resulting from higher summer energy demand for cooling
Mirasgedis et al., 2007
Cyprus 239 million € 2010-2030 Higher electricity generation cost resulting from higher summer energy demand for cooling
Zachariadis, 2010
Spain 8.8-30.6 million €/a 2008-2050 Higher costs to electricity users and costs paid in the carbon market (emissions trading)
Pilli-Sihvola et al., 2010
Europe (Rhine river)
194-263 million € Future climatic conditions similar to those of 2003
Higher transport prices for goods as a result of load restrictions on inland ships (due to low river water levels in summer)
Jonkeren, 2009
SECOND-ORDER DRAFT IPCC WGII AR5 Chapter 23
Do Not Cite, Quote, or Distribute 85 28 March 2013
Table 23-4: Assessment of climate change impacts by sub-region and sector (by 2050, medium emissions) With economic development, with land use change. No further planned adaptation.
Transport time and cost in ocean routes ? ? ? 23.3.3, 18.3.3.3.5
Length of ski season ? ? 23.3.6, 3.5.7
Food and Fibre production
Wine production ?
? 23.3.5, 18.3.3.1,
23.4.1
Arable Production 23.4.1
Livestock production
23.4.2
Water availability for agriculture
23.4.3
Forest productivity ? ? 23.4.4
Pest and plant diseases
23.4.1, 23.4.4
Bioenergy production ? ? ? 23.4.5
Health and Social Impacts
Heat wave mortality
23.5.1
SECOND-ORDER DRAFT IPCC WGII AR5 Chapter 23
Do Not Cite, Quote, or Distribute 86 28 March 2013
Damage on cultural buildings
23.5.4
Loss of cultural landscapes
?
23.5.4
Enviromental quality
Air quality (ozone background levels)
? ? ? ? ? 23.6.1
Water quality
23.6.3
Local loss of native species and extinction
of species
23.6.4
Code. Green means a “beneficial change” and Red means a “harmful”, ? No relevant literature found
FOOTNOTES 1 Simulations have been performed, but mostly for the period after 2070. 2 The increasing trend is for Norway. 3 The decreasing trend refers mainly to the number of severe accidents. 4 Impacts have been studied and quantified for UK only. The increasing trend stands for summer delays and the decreasing trend
for winter delays. 5 In both seasons, no significant impacts are expected by 2020, while more substantial changes are expected by 2080. For 2050
impacts are assumed to vary linearly (although this may not be the case). 6 The constant trend stands for the Mediterranean, where some studies estimate no changes due to climate change at least until
2030 or even 2060.
Increasing
No change in
Decreasing
A range from no change to increasing
A range from no change to decreasing
A range from increasing to decreasing
SECOND-ORDER DRAFT IPCC WGII AR5 Chapter 23
Do Not Cite, Quote, or Distribute 87 28 March 2013
Table 23-5: Multi-sectoral impacts of climate extremes during the last decade in Europe. Year Region Meteorological
Event/ Breaking Record*
Production Systems and Physical Infrastructure, settlements
Agriculture, Fisheries, Forestry, Bioenergy
Health and Social Welfare
Environmental Quality and Biological Conservation
2003 Europe Hottest summer in at least 500 years (Luterbacher et al., 2004)
Damage to road and rail transport systems. Reduced/ interrupted operation of nuclear power plants (mostly in France). High transport prices in Rhine due to low water levels.
Grain harvest losses of 20% (Aerts and Botzen, 2011)
Approx 35,000 deaths in August in Central and Western Europe (Robine et al. 2008)
Water quality. High outdoor pollution levels. (EEA 2012)
2004/ 2005
Iberian Peninsula
Hydrological drought
Grain harvest losses of 40% (EEA, 2010b)
2007/ 2008
England and Wales, Southern Europe
May–July wettest since records began in 1766. Hottest summer on record in Greece since 1891 (Founda & Giannakopoulos 2009)
Disruption, economic loss and social distress turned the summer 2007 floods into a national catastrophe. Broad-scale estimated total losses were £4 billion (Chatterton et al. 2010),
Social distress.
2010 Western Russia
Hottest summer since 150 (Barriopedro et al., 2011)
Fire damage to forests. Crop yields
Heat mortality in Moscow region (Revich and Shaposhnikov, 2010)
High outdoor pollution levels. (Revich and Shaposhnikov, 2010.
2011 France
Hottest and driest spring on record in France since 1880
Reduction on snow cover for skiing
Decline in crop yields. (AGRESTE, 2011)
* based on Coumou and Rahmstorf, 2012.
SECOND-ORDER DRAFT IPCC WGII AR5 Chapter 23
Do Not Cite, Quote, or Distribute 88 28 March 2013
Table 23-6: Limits to Adaptation Measures in Europe. Area/Location System Adaptation
measures Limits to adaptation measure(s) References
Low altitude/ small-size ski resorts
Ski tourism Artificial snowmaking
Climatic, technological and environmental constraints Economic viability Social acceptability of charging for previously free skiing. Social acceptability of alternatives for winter sport/leisure.
(Landauer et al., 2012) (Steiger, 2010a; Steiger, 2010b) (Steiger and Mayer, 2008)(Unbehaun et al., 2008)
Thermal power plants/ cooling through river intake and discharge
Once-through cooling systems
Closed- circuit cooling
High investment cost for retrofitting existing plants
(van Vliet et al., 2012)(Koch and Vögele, 2009)(Hoffman et al., 2013)
Rivers used for freight transport
Inland transport
Reduced load factor of
inland ships
Increased transport prices (Rhine and Moselle market)
(Jonkeren, 2009) (Jonkeren et al., 2007)
Use of smaller ships
Existing barges below optimal size (Rhine)
(Demirel, 2011)
Agriculture, Northern and Continental Europe.
Arable crops Sowing date as agricultural
adaptation
Other constraints (e.g. frost) limit farmer behaviour
(Oort, 2012).
Agriculture, Northern and Continental Europe.
Arable crops Irrigation Groundwater availability, competition with other users.
(Olesen et al., 2011)
Agriculture, Viticulture
High value crops
Change distribution
Legislation on cultivar and geographical region
Box 23-1
Conservation Cultural landscapes
Alpine meadow/
Extend habitat No technological adaptation option. (Engler et al., 2011) (Dullinger et al., 2012)
Conservation of species richness
Movement of species
Extend habitat Landscape barriers and absence of climate projections in selection of conservation areas.
(Butchart et al., 2010) (Araújo et al., 2011; Filz et al., 2012; Virkkala et al., 2013).
Forests Movement of species and Productivity
reduction
Introduce new species
Not socially acceptable, Legal barriers to non-native species
(Giuggiola et al., 2010; Hemery et al., 2010; García-López J.M. and Alluéa, 2011) (Casalegno et al., 2007)
Forests Fire incidence
landscape planning and fuel reduction
Higher flammability due to warmer and drier conditions
(Moreira et al., 2011).
SECOND-ORDER DRAFT IPCC WGII AR5 Chapter 23
Do Not Cite, Quote, or Distribute 89 28 March 2013
Table 23-6: Impact of observed changes in key indicators in ecological and human systems
Indicator Change in indicator Confidence in detection Confidence in attribution to change in climate factors [**]
Key references Section
Infrastructure, etc.
Storm losses in Europe
Increase since 1970s Increasing trend (high confidence)
No causal role for climate
Barredo, 2010 23.3.7
Hail losses Increase in parts of Germany Increasing trend (low confidence)
No causal role for climate
Kunz et al., 2009 23.3.7
Flood losses Increasing general trend in economic losses in Europe since 1970s; none in some locations
Increasing trend (medium confidence)
No causal role for climate
Barredo, 2009; Barredo et al., 2012
23.3.1
Agriculture
Agriculture CO2 induced positive contribution to yield since preindustrial for C3 crops
High confidence (high agreement, robust evidence)
High confidence (high agreement, robust evidence)
Amthor, 2001; Long et al., 2006; McGrath and Lobell, 2011
7.2.1
Agriculture Stagnation of wheat yields in some countries in recent decades
High confidence Medium confidence Lobell et al. 2011 ; Brisson et al., 2010; Kristensen et al., 2011
23.4.1
Phenology Earlier greening, Earlier leaf emergence and fruit set in temperate and boreal climate,
High confidence (high agreement, robust evidence)
High confidence (high agreement, robust evidence)
Menzel et al., 2006 4.4.1.1
Ocean systems
Increased phytoplankton productivity in NE. Atlantic, decrease in warmer regions, due to warming trend and hydroclimatic variations
High confidence Medium confidence Beaugrand et al., 2002; Edwards and Richardson, 2004
6.3.2
Ocean systems
Northward movement of species and increased Species richness due to warming trend
High confidence Medium confidence Philippart et al. , 2011
6.3.2
Health and Social Welfare Atopic disease
Increased allergic sensitization to pollens
Very low confidence (single study)
Very low confidence
Ariano et al. 2010
11.4
Cold-related mortality
Decline in cold related mortality in England and Wales
Low confidence (confounding)
Low confidence Christidis et al. 2010
11.4
Environmental quality and biodiversity Biodiversity Increased number of
colonization events by alien plant species in Europe
Medium confidence (high agreement, medium evidence)
Medium confidence Walther et al., 2009
4.2.4.7
Migratory birds
Earlier arrival of migratory birds in Europe over the 1970/2000 period
Medium confidence (medium agreement, medium evidence)
Medium confidence Moller et al., 2008
4.4.1.1
Tree spices Upward shift in tree line in Medium evidence Medium confidence Gehrig-Fasel et 18.3.
SECOND-ORDER DRAFT IPCC WGII AR5 Chapter 23
Do Not Cite, Quote, or Distribute 90 28 March 2013
Europe (medium agreement, high evidence)
al., 2007, Lenoir et al., 2008
2.1,
Forest fires Area burnt Increasing area High confidence (high agreement, robust evidence)
Camia and Amatulli 2009; Hoinka et al., 2009; Carvalho et al., 2010; Salis et al., in press; Pereira et al., 2005; Koutsias et al., 2012
23.4.4
[** Note- this is not attribution to anthropogenic forcing. See chapter 18 for a more complete discussion.
SECOND-ORDER DRAFT IPCC WGII AR5 Chapter 23
Do Not Cite, Quote, or Distribute 91 28 March 2013
Figure 23-1: Sub-regional classification of the IPCC Europe region. Based on Metzger et al., 2005.
SECOND-ORDER DRAFT IPCC WGII AR5 Chapter 23
Do Not Cite, Quote, or Distribute 92 28 March 2013
Figure 23-2: Projected changes in the mean number of heat waves occurring in the months May to September for the period 2071-2100 compared to 1971-2000 (number per season) (Jacob et al, 2013). Heat waves are defined as periods of more than 5 consecutive days with daily maximum temperature exceeding the daily maximum temperature of the May to September season of the control period (1971-2000) by at least 5°C. Hatched areas indicate regions with robust (at least 66% of models agree in the sign of change) and/or statistical significant change (significant on a 95% confidence level using Mann-Whitney-U test). For the eastern part of Turkey, unfortunately no regional climate model projections are available. A) Changes represent average over 9 regional model simulations (A1B) taken from the EU-ENSEMBLES project.
SECOND-ORDER DRAFT IPCC WGII AR5 Chapter 23
Do Not Cite, Quote, or Distribute 93 28 March 2013
B) Changes represent average over 8 regional model simulations (RCP4.5) taken from the EURO-CORDEX project.
SECOND-ORDER DRAFT IPCC WGII AR5 Chapter 23
Do Not Cite, Quote, or Distribute 94 28 March 2013
Figure 23-3: Projected seasonal changes of heavy precipitation defined as the 95th percentile of daily precipitation (only days with precipitation > 1mm/day are considered) for the period 2071-2100 compared to 1971-2000 (%) (Jacob et al., 2013). For the eastern part of Turkey, unfortunately no regional climate model projections are available. The figures are sorted as follows: left side: DJF, JJA; right side: MAM, SON. Hatched areas indicate regions with robust (at least 66% of models agree in the sign of change) and/or statistical significant change (significant on a 95% confidence level using Mann-Whitney-U test). A) Changes represent average over 20 regional model simulations (A1B) taken from the EU-ENSEMBLES project.
SECOND-ORDER DRAFT IPCC WGII AR5 Chapter 23
Do Not Cite, Quote, or Distribute 95 28 March 2013
B) Changes represent average over 7 regional model simulations (RCP4.5) taken from the EURO-CORDEX project.
SECOND-ORDER DRAFT IPCC WGII AR5 Chapter 23
Do Not Cite, Quote, or Distribute 96 28 March 2013
Figure 23-4. Projected changes in the 95th percentile of the length of dry spells for the period 2071-2100 compared to 1971-2000 (in days) (Jacob et al., 2013). Dry spells are defined as periods of at least 5 consecutive days with daily precipitation below 1mm. Hatched areas indicate regions with robust (at least 66% of models agree in the sign of change) and/or statistical significant change (significant on a 95% confidence level using Mann-Whitney-U test)..For the eastern part of Turkey, unfortunately no regional climate model projections are available . A) Changes represent average over 20 regional model simulations (A1B) taken from EU-ENSEMBLES project.
SECOND-ORDER DRAFT IPCC WGII AR5 Chapter 23
Do Not Cite, Quote, or Distribute 97 28 March 2013
B) Changes represent average over 7 regional model simulations (RCP4.5) taken from EURO-CORDEX project. .
SECOND-ORDER DRAFT IPCC WGII AR5 Chapter 23
Do Not Cite, Quote, or Distribute 98 28 March 2013
Figure 23-5: Percentage change in electricity demand in Greece attributable to climate change, under a range of climate scenarios and economic assumptions. Source: Mirasgedis et al., 2007.
SECOND-ORDER DRAFT IPCC WGII AR5 Chapter 23
Do Not Cite, Quote, or Distribute 99 28 March 2013
Figure 23-6: Percentage change in simulated water-limited yield for winter wheat in 2030 with respect to the 2000 baseline under the A1B scenario as modelled using ECHAM5 (left column) and HadCM3 (right). Yield estimates in top maps do not take adaptation into account. Bottom row estimate assume a „best adaptation strategy“ for cell (Source: Donatelli et al. 2012)
.
SECOND-ORDER DRAFT IPCC WGII AR5 Chapter 23
Do Not Cite, Quote, or Distribute 100 28 March 2013
Figure 23-7: Projected fire risk in Europe for two time periods (2011–2040 and 2041–2070) based on high-resolution regional climate models from the ENSEMBLES project under the SRES A1B emission scenario. (Source: Lung et al., 2012)
SECOND-ORDER DRAFT IPCC WGII AR5 Chapter 23
Do Not Cite, Quote, or Distribute 101 28 March 2013
Figure 23-8: Adaptation and mitigation options and their effects on biodiversity. Based on Paterson et al., 2009.