SECOND PERIODIC ANNUAL JI MONITORING REPORT Utilization of coke gas with electricity generation by two 6 MWe CHP at “ZaporozhCox Plant” Page 1 SECOND PERIODIC ANNUAL JI MONITORING REPORT CONTENTS A. General project activity and monitoring information B. Key monitoring activities C. Quality assurance and quality control measures D. Calculation of GHG emission reductions
Transcript
SECOND PERIODIC ANNUAL JI MONITORING REPORT
Utilization of coke gas with electricity generation by two 6 MWe CHP
at “ZaporozhCox Plant”
Page 1
SECOND PERIODIC ANNUAL JI MONITORING REPORT
CONTENTS
A. General project activity and monitoring information
B. Key monitoring activities
C. Quality assurance and quality control measures
D. Calculation of GHG emission reductions
SECOND PERIODIC ANNUAL JI MONITORING REPORT
Utilization of coke gas with electricity generation by two 6 MWe CHP
at “ZaporozhCox Plant”
Page 2
SECTION A. General Project activity information
A.1 Title of the project activity:
Utilization of coke gas with electricity generation by two 6 MWe CHP at ““ZaporozhCox” Plant”
Sectoral scope: 1. Energy industries (renewable / non-renewable sources)
Date: 13 May 2011
Version: 2.0
A.2. JI registration number:
UA2000026
A.3. Short description of the project activity:
The concept of the project is generation of electricity onsite to partially cover own needs; as well as to use COG in a more efficient way. For this purpose, energy of steam which, in the absence of the project, was desuperheated in PRDS (pressure-reducing and desuperheating stations) which were used for correction of parameters of steam. The project foresees using of this superheated steam in the two 6 MWe turbines instead of PRDS. Therefore, additional electricity will be generated and consumed onsite.
A.4. Monitoring period:
Monitoring period starting date: 01.01.2010 at 00:00;
Monitoring period closing date 31.03.2011at 24:00
A.5. Methodology applied to the project activity (incl. version number):
For the monitoring of emission reductions, project developer proposes using a JI specific approach in
accordance with the JI Guidance on Criteria for Baseline Setting and Monitoring, Version 02. No
approved CDM methodologies are applied.
A.5.1. Baseline methodology:
The main principles of the JI specific approach can be described by the following:
1. Setting of the baseline should be based on real data (project scenario), obtained during the
years before and after the project realization.
2. Estimated values of the key parameters under the project activity should be based on the
project owner’s forecasts.
3. The proposed project should concern electricity generation only as a part of combined heat
and power production cycle.
SECOND PERIODIC ANNUAL JI MONITORING REPORT
Utilization of coke gas with electricity generation by two 6 MWe CHP
at “ZaporozhCox Plant”
Page 3
4. The proposed project should have no influence on the COG production level. Therefore,
amount of COG for the project scenario and for the baseline scenario can be assumed to be
the same for each year.
5. In general, proposed project should have no influence on technological heat/steam demand
level. Both turbines under the project can be considered as substitutions of the PRDS units
that were used for the steam parameters correction. However, some differences can be
considered in heat generation level due to principle of operation of the condensing turbine, as
appropriate.
6. All significant leakages should be taken into consideration.
7. The project implementation can result in an increase in electricity consumption due to the
installation of the new equipment or modernization of the existing one. However, this
electricity can be considered as carbon neutral because it is generated from the waste heat.
A.5.2. Monitoring methodology:
The reduction of GHG emissions due to additional electricity should be generated with the same
level of heat production with respect to the baseline scenario. Therefore, the amount of emission
reductions can be calculated based on the monitoring data for the electricity generated by the
project.
The baseline emissions will be calculated based on the following inputs:
All electricity generated by the project from the COG is carbon neutral;
Electricity generated by the project from the COG and consumed by ZCP’s auxiliaries
applies an Emission Factor (EF) of:
- 1,067 tCO2/MWh for electricity production in 2010 year according to the
Order of the National Environmental Investment Agency of Ukraine № 43
from 28.03.2011;
- 1,063 tCO2/MWh for electricity production in 2011 year according to the
Order of the National Environmental Investment Agency of Ukraine № 75
from 12.05.2011;
The proposed CHP does not require any additional COG cleaning before fuelling the boiler, so
there is no consumption of electricity for cleaning of COG. Additional electricity will be
consumed by new equipment installed within the limits of the proposed CHP during operation
(generator). This electricity is carbon neutral, because CHP will be fuelled by COG, which is
flared and burnt in the existing boiler houses at the moment. However, auxiliary electricity
consumption would not occur in the absence of the proposed project, so it needs to be substituted
from the amount of electricity generated by new CHP.
In accordance with the PDD the only leakage that can take place is the additional consumption of
fuel at site of the external consumers, to cover the lack of COG which had been delivered, and
now is used for condensing turbine.
SECOND PERIODIC ANNUAL JI MONITORING REPORT
Utilization of coke gas with electricity generation by two 6 MWe CHP
at “ZaporozhCox Plant”
Page 4
Taking into account the information given above, the monitoring plan should include the
following positions:
Amount of electricity, generated by new turbines under the project activity
Amount of electricity consumed by project equipment
Amount of COG, which would not be supplied to external consumers due to the project
activity. This value can be calculated by the difference between steam input and steam
output amounts of condensing turbine, in accordance with the project conditions.
Amount of other fossil fuel have been combusted during the monitoring period, if any.
This parameter was not included into the tables D.1.2.1 and D.1.3.1 as well as there is no
reflection of this parameter in any formulas of the MP, because everything depends on
fossil fuel type. For every monitoring period AIE have to find out if any fossil fuel have
been combusted in mixture with COG. In this case relevant emissions have to be
calculated using IPCC default factors and relevant NCV.
A.6. Status of implementation including time table for major project parts:
As it was planned, the first turbine was installed on the 14th of February 2008. Installation of the second
turbine was postponed from the planned date (March 2010) due to lack of financing. Now all assembling
works are finished and turbine was put into operation in June 2010.
Activity Commissioning date in
accordance with PDD
Actual commissioning
date
Commissioning of the first turbine 2008 March 2008
Commissioning of the second turbine March 2010 June 2010
A.7. Intended deviations or revisions to the determined PDD:
As it was mentioned above, implementation of the second turbine was postponed from the planned date
(March 2010) due to lack of financing. Now all assembling works are finished and turbine was
completely put into operation in June 2010.
A.8. Intended deviations or revisions to the determined monitoring plan:
According to the PDD electricity generated by the project from the COG and consumed by ZCP’s
auxiliaries apply an Emission Factor (EF) of 0.896 tCO2/MWh as a project reducing electricity
consumption from the grid. The emission factor for the Ukrainian electricity grid, developed by Global
Carbon B.V., determined by TUV SUD and final determined by the JISC, will be used for the baseline
emissions calculation. At the time of determination, it was the most accurate Emission Factor for
electricity production in Ukraine.
In 2011, the National Environmental Investment Agency of Ukraine has set a new Emission Factors for
electricity production as 1,067 tCO2/MWh for 2010 and 1,063 tCO2/MWh for 2011. New emission
factors based on recent studies of fuel consumption for electricity production in Ukraine. Therefore, in
this monitoring report uses updated Emission Factors.
SECOND PERIODIC ANNUAL JI MONITORING REPORT
Utilization of coke gas with electricity generation by two 6 MWe CHP
at “ZaporozhCox Plant”
Page 5
A.9. Changes since last verification:
Since the last inspection has been established the condensing turbine No 2. According to the approved
monitoring plan, leakages are a result of this unit. For more information see Section B.
A.10. Person(s) responsible for the preparation and submission of the monitoring report:
OJSC “ZaporozhCox”
Dmitriy Morozov, Head of investment department
Global Carbon B.V.
Natallia Belskaya, JI Consultant
A.11. Person(s) responsible for the checking and approval of the monitoring report:
OJSC “ZaporozhCox”
Musa Magomedov, General Director
Global Carbon B.V.
Denis Rzhanov, Team Leader JI Consultants
SECOND PERIODIC ANNUAL JI MONITORING REPORT
Utilization of coke gas with electricity generation by two 6 MWe CHP
at “ZaporozhCox Plant”
Page 6
SECTION B. Key monitoring activities according to the monitoring plan for the monitoring period stated in A.4.
For the monitoring period stated in A.4. the following parameters have to be collected and registered:
1. Electricity generated by the new turbines No 1 and No 2.
This parameter is metered with a specialized meters “Alpha А1140” (for more information please see Table В.1.2). The meter is situated next to
current transformers. Readings are registered automatically and the results are going to the control panel. After that these results are loaded to the
database. Moreover, once per shift the electrician writes the meter readings into the log book. These data are forwarded to the head of energy
department to be recalculated (summarized). A summary for each calendar month is sent to the Chief Electrician. The annual reports are based on
these monthly reports.
2. Electricity consumed by the project equipment.
For metering of this parameter separate meters “Energiya-9” and “Alpha А1140” are used (for more information please see Table В.1.2). These
meters can work in parallel or sequentially, depending on situation. The devices are located on several current inputs, next to current transformers.
Readings are registering automatically and results are transmitted to the control panel. After that they are sent to the database. Moreover, once per
shift the electrician writes down the meter readings into the log book. These data are going to the head of energy department to be recalculated
(summarized). Summary for the month is sent to the Chief Electrician. Monthly and annual reports are based on these data.
3. Amount of COG, which would not be supplied to external consumers due to the project activity.
This value can be calculated, subject to project conditions. There is a difference between steam input and steam output amounts of condensing turbine
No 2 calculated using the thermal equivalent of steam. Special device in the Automatic system for technological process control (ASTPC) will
measure temperature, pressure and flow of steam. ASTPC is used for registering, transforming into heat equivalent and storing the data
simultaneously. The operator prints the daily technical reports and sends them to the superintendent of the boiler-turbine shop. At the same time,
these data are fed to chief power engineering specialist, which are summed up and form the monthly and annual reports.
Also, in accordance with determined monitoring plan, it have to be checked if other fossil fuel source was used simultaneously with COG during monitoring
period.
SECOND PERIODIC ANNUAL JI MONITORING REPORT
Utilization of coke gas with electricity generation by two 6 MWe CHP
at “ZaporozhCox Plant”
Page 7
B.1. Monitoring equipment types
1. Electricity meters “Alpha А1140” and “Alpha А1800”
2. Electricity meters “Energiya-9” ver. STK3
3. Temperature sensors “THK-1-1”
4. Pressure sensors “Metran 100”
5. Flow of steam sensors “Metran 100”
SECOND PERIODIC ANNUAL JI MONITORING REPORT
Utilization of coke gas with electricity generation by two 6 MWe CHP
at “ZaporozhCox Plant”
Page 8
B.1.2. Table providing information on the equipment used (incl. manufacturer, type, serial number, date of installation, date of last calibration,
information to specific uncertainty, need for changes and replacements):
Met
er
ID n
um
ber
Para
met
er n
am
e
Un
its
Met
er n
am
e
Ser
ial
nu
mb
er
Acc
ura
cy i
nd
ex
Date
of
inst
all
ati
on
Th
e la
st c
hec
k
date
Th
e n
ext
chec
k
date
Note
s
1
Electricity generated by
the new turbine No 1
kWh Alpha А1140 05002014 1 2008 14.04.2008 14.04.2014 10.11.08 this meter was
The calibration interval for all types of electricity meters used at the plant is set by Ukrainian state committee for technical regulation and customer policy and
cannot exceed 6 years.
For the meters:
QA/QC procedures The body responsible to calibration and certification
Maximum calibration interval for the Alpha А1140 meter is equal to 16 years State company „Zaporozhstandartmetrologiya”
Maximum calibration interval for the Alpha А1800meter is equal to 12 years State company „Zaporozhstandartmetrologiya”
Maximum calibration interval for the Energiya-9 meter is equal to 6 years State company „Zaporozhstandartmetrologiya”
Maximum calibration interval for the ТHК-1-1 sensor is equal to 1 year State company „Zaporozhstandartmetrologiya”
Maximum calibration interval for the Metran 100 sensor is equal to 1 year State company „Zaporozhstandartmetrologiya”
Maximum calibration interval for the Metran 100 sensor is equal to 1 year State company „Zaporozhstandartmetrologiya”
SECOND PERIODIC ANNUAL JI MONITORING REPORT
Utilization of coke gas with electricity generation by two 6 MWe CHP
at “ZaporozhCox Plant”
Page 10
B.1.4. Involvement of Third Parties:
Checking and calibration of meters is usually performed by state company „Zaporozhstandartmetrologiya” or other company which possess
necessary qualification, knowledge and equipment, if this is agreed with state company „Zaporozhstandartmetrologiya”.
B.2. Data collection (accumulated data for the whole monitoring period):
Operational and management structure in accordance with Section D.3. in PDD:
Global Carbon
Data in acordance with the Monitoring
Plan
Chief of the Heat and Power
Department:
Vladimir Sharagin
Data from the log books are sent to the Chief of
the Heat and Power Department daily. Summarized and
recalculated data loaded into the electronic data
base.
Electricians make reading from the meters
daily and write it into the log books.
Name of the persons responsible for the
metering:
Dmitriy Yakovlev; Khitsay Marina;
Vladimir Alekseenko; Tatiana Litvinenko
Values of electricity
generation and consumption
Process engineers make reading from the
meters daily and write it into the log books.
Name of the persons responsible for the
metering:
E. Shinkarenko; V. Rabeshko;
S. Pejshitz; V. Marinevich
Heat equivalent readings at the
turbine #2
SECOND PERIODIC ANNUAL JI MONITORING REPORT
Utilization of coke gas with electricity generation by two 6 MWe CHP
at “ZaporozhCox Plant”
Page 11
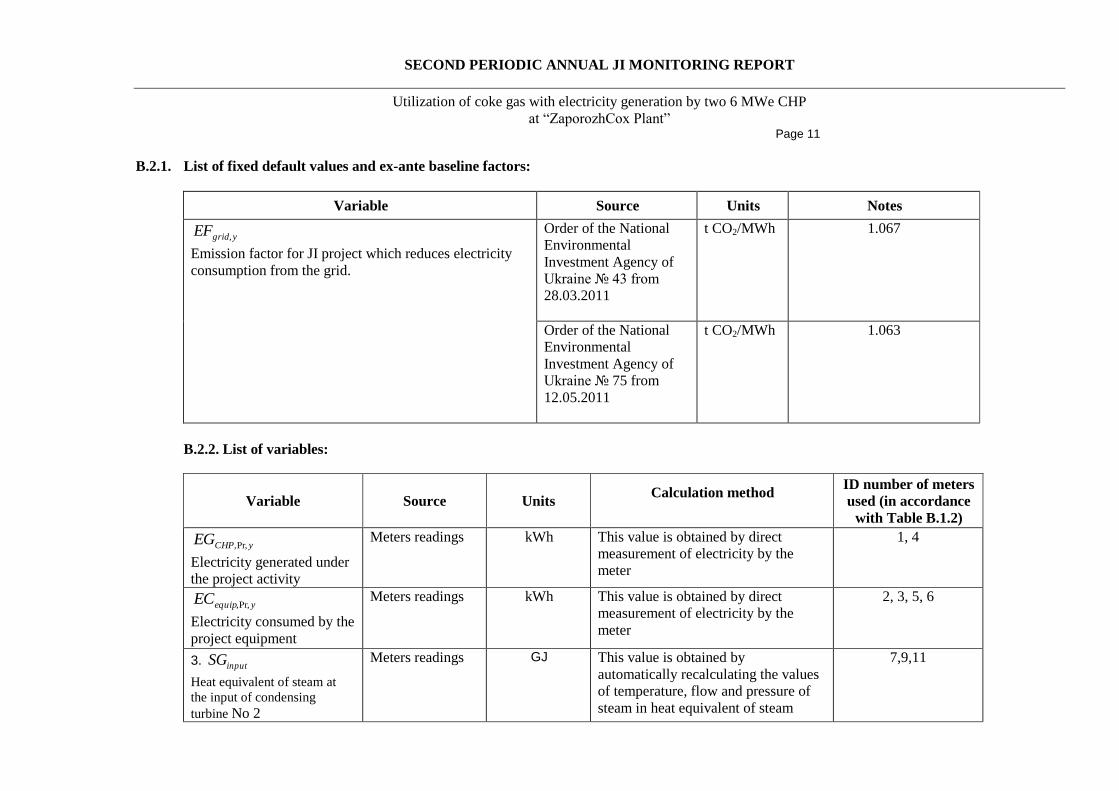
B.2.1. List of fixed default values and ex-ante baseline factors:
Variable Source Units Notes
ygridEF , Emission factor for JI project which reduces electricity
consumption from the grid.
Order of the National
Environmental
Investment Agency of
Ukraine № 43 from
28.03.2011
t CO2/MWh 1.067
Order of the National
Environmental
Investment Agency of
Ukraine № 75 from
12.05.2011
t CO2/MWh 1.063
B.2.2. List of variables:
Variable Source Units Calculation method
ID number of meters
used (in accordance
with Table B.1.2)
yCHPEG Pr,, Electricity generated under
the project activity
Meters readings kWh This value is obtained by direct
measurement of electricity by the
meter
1, 4
yequipEC Pr,, Electricity consumed by the
project equipment
Meters readings kWh This value is obtained by direct
measurement of electricity by the
meter
2, 3, 5, 6
3. inputSG
Heat equivalent of steam at
the input of condensing
turbine No 2
Meters readings GJ This value is obtained by
automatically recalculating the values
of temperature, flow and pressure of
steam in heat equivalent of steam
7,9,11
SECOND PERIODIC ANNUAL JI MONITORING REPORT
Utilization of coke gas with electricity generation by two 6 MWe CHP
at “ZaporozhCox Plant”
Page 12
through Automatic system for
technological process control
(ASTPC)
4. outputSG
Heat equivalent of steam at
the output of condensing
turbine No 2
M
e
t
e
r
s
r
e
a
d
i
n
g
s
GJ This value is obtained by
automatically recalculating the values
of temperature, flow and pressure of
steam in heat equivalent of steam
through Automatic system for
technological process control
(ASTPC)
8,10,12
B.2.3. Data concerning GHG emissions by sources of the project activity:
Not applicable.
B.2.4.Data concerning GHG emissions by sources of the baseline:
Variable Description Units Values
01.01.2010 -31.12.2010 01.01.2011 -31.03.2011
yCHPEG Pr,, Electricity generated under the project activity MWh 69240159 19859389
yequipEC Pr,, Electricity consumed by the project equipment MWh 2437000 866000
SECOND PERIODIC ANNUAL JI MONITORING REPORT
Utilization of coke gas with electricity generation by two 6 MWe CHP
at “ZaporozhCox Plant”
Page 13
inputSG
Heat equivalent of steam at the input of condensing turbine
No 2 GJ
325884 96238
outputSG
Heat equivalent of steam at the output of condensing
turbine No 2 GJ
26 0
B.2.5.Data concerning leakage:
In accordance with the PDD the only leakage that can take place is the additional consumption of fuel at site of the external consumers, to cover the
lack of COG which had been delivered, and now is used for condensing turbine. Formulas which describe these leakages are given in PDD, please see
formulas B.1.6 – B.1.11.
Due to the principles of work of condensing turbine, there is a difference between steam input and steam output amounts. This difference describes
the lack of fuel due to the leakages and can be calculated the following way:
outputinputyifuel SGSGLack ,, where (D.1.3)
yifuelLack ,, - difference between heat equivalents of steam input and steam output amounts, in the monitoring period y, GJ.;
inputSG - heat equivalent of steam before the condensing turbine, GJ;
outputSG - heat equivalent of steam after the condensing turbine, GJ;
Leakages due to extra natural gas combustion at site of external consumers can be calculated using following formula (in accordance with formula
B.1.4):
1000
,,
,
NGyifuel
yCHP
EFLackLE
, where
(D.1.4)
NGEF - emission factor for natural gas. In accordance with IPCC 20061, this value is equal to 56.1 kg СО2 eq/GJ.
1000 – conversion factor needed to convert kg СО2 eq in tСО2 eq.
Utilization of coke gas with electricity generation by two 6 MWe CHP
at “ZaporozhCox Plant”
Page 14
B.2.6.Data concerning environmental impacts:
Proposed project foresees the increase of COG combustion efficiency and, therefore, will improve the environmental conditions in the region.
Proposed project does not create additional sources of emissions but can be considered to be a reason of some additional negative effects, such as
noise and vibration. These effects can negatively influence working conditions of the staff. Certification of jobs held once every 5 years according to
the procedure for attestation of working places on working conditions. As a result of these measurements the working condition cards for relevant
workplaces are issued. Last certification was at 2008 year. To investigate this influence the district sanitation and epidemiological service (SES)
makes the measurement periodically. If some parameters exceed the nominal permitted level, it is required to use means of individual protection by
staff.
The following working condition cards were issued for turbine shop:
- Card No 30-11 “Head of turbine shop”;
- Card No 30-08 “Turbine operator”;
- Card No 30-09 “Turbine operator/man-on-foot”
B.3.Data processing and archiving (incl. software used):
In normal regime the instant data concerning generation/consumption of electricity is displayed on the LCD display of electricity meters in cyclical order (in
succession, one by one) with holding time equal to 6-8 sec.
Measurement data are registered by PCS (process control system). Electricity generation level measures by the PCS (feeder 114 «generator 1» and feeder 12
«generator 1» in the database of «Alpha CENTER2» software. Also log book is used to register these values manually as well as values concerning electricity
consumption by project equipment.
During the process of collecting the data from the meter “Alpha CENTER” software makes the following calculations:
2 Complex “Alpha CENTER” for measurement and calculations designed to measure electricity and power, as well as automatic collection, processing and
storing collected information. The complex includes communication server, communication modules, installation DB core, modules of controlling system,
client’s software (screen forms, diagrams, reports). For more information see http://www.alphacenter.ru .
Utilization of coke gas with electricity generation by two 6 MWe CHP
at “ZaporozhCox Plant”
Page 15
• Converting the interval values read from the meters (telemetric pulses) into the named (physical) units of electricity (kWh);
• Calculation of interval rate of electricity (in kWh).
All data achieved by “Alpha CENTER” software are collected and archived in the data base. There exists an IT department to proceed general maintenance of
the IT equipment used on the plant. Monthly all data go through the archiving and backup procedures. This activity takes place with help of special
organization “TRAFIC” which has a relevant contract with “ZaporozhCox”. “TRAFIC” company is also responsible for adjusting and correcting of the
“Alpha CENTER” software on demand of ZaporoxhCox.
Accounting of electricity consumption for own needs is metered by four meters (Energiya-9 and Alfa1140) installed on the feeders No1, No9, No15, No16 .
In normal regime these meters work in parallel, and their readings have to be summarized to get a total value.
In the frame of QMS (Quality Management System) ISO 9001 implemented at “ZaporozhCox”, the report “Report of the processes performance” is
developed on monthly base. Among the parameter of this report is “Provision electricity generated onsite”. Therefore, data for the electricity production by
the turbine are subject to internal auditing under ISO 9001.
Department of Chief Power Engineer provides all data needed to the working group by filling in the form 8.2.ZK01 “Measurement of the QMS processes”.
Monthly reports are composed on the base of this form are transferred to the First Deputy General Director for revision. This procedure named “Analysis
from the managing party”. If some parameters are considered as not satisfactory, the correction is prescribed under the procedure 8.5.2.ZK01 “Correction and
preventative actions”. Annual reports which are based on the monthly reports have to be saved for at least 3 years.
B.4. Special event log:
No special events have taken place during the current monitoring period.
Only the following fact requires attention. On 10 November 2008 the electricity meter relevant to electricity generation measurement was replaced. The meter
”Energiya-9”, serial number 37017 was replaced with a modern meter Alpha А1140, serial number 05002014. Before the replacement, readings were
registered only in the log books. Due to this there is no possibility for artificial increase of electricity generation level. During the replacement works the
turbine continued operation and generated electricity. This amount of electricity was not included in the ER calculation; that is conservative.
SECOND PERIODIC ANNUAL JI MONITORING REPORT
Utilization of coke gas with electricity generation by two 6 MWe CHP
at “ZaporozhCox Plant”
Page 16
SECTION C. Quality assurance and quality control measures
C.1. Documented procedures and management plan:
C.1.1. Roles and responsibilities:
In the framework of this project electricians and process engineers are responsible for the data
registration from the relevant meters.
Name of the persons responsible for the metering during current monitoring period:
Dmitriy Yakovlev – electrician;
Khitsay Marina – electrician;
Vladimir Alekseenko – electrician;
Tatiana Litvinenko – electrician.
Electricians are responsible for the data registration from the electricity meters.
E. Shinkarenko - process engineers;
V. Rabeshko - process engineers;
S. Pejshitz - process engineers;
V. Marinevich - process engineers.
Process engineers are responsible for the data registration from the ASTPC.
Duty of Chief of the Heat and Power Department in the framework of this project lies in data
processing and preparation of reports which are the main source for Monitoring Reports.
Name of the persons responsible for preparation of reports:
Vladimir Sharagin – Chief of the Heat and Power Department.
C.1.2. Trainings:
Existing staff got used for working in the turbine workshop after the relevant education provided in case
of lack of qualification. Education was provided by equipment producers and specialized organizations.
C.2. Involvement of Third Parties:
Energoavtomatizatsiya ltd. was involved to provide trainings.
SECOND PERIODIC ANNUAL JI MONITORING REPORT
Utilization of coke gas with electricity generation by two 6 MWe CHP
at “ZaporozhCox Plant”
Page 17
C.3. Internal audits and control measures:
Data relevant to the emission reduction calculation are registered daily in the log books. During the
operation, there are minor variations in the electricity generation level that can be observed. Therefore,
any measurement error can be easily identified, in case of values that significantly differ from the
common (in case of equal conditions) are received.
Independently data is submitted and processed in the manufacturing department and the the heat and
power department. These units submit the results to the department of planning. In case of differences
data is checked and found out the cause.
C.4. Troubleshooting procedures:
In case of failure of any equipment which leads to impossibility to generate electricity, the turbine will be
stopped until the malfunction is fixed. The turbines’ work is under control of modern automatic systems.
Any variation in electricity generation level will be registered by relevant meters.
If the main metering device fails, and there is no reserve metering device available, the monitoring
report will use indirect data and evidence, but only if their applicability (data and evidence) is
justifiably proven. Likely, a conservative approach will be used.
SECOND PERIODIC ANNUAL JI MONITORING REPORT
Utilization of coke gas with electricity generation by two 6 MWe CHP
at “ZaporozhCox Plant”
Page 18
SECTION D. Calculation of GHG emission reductions
D.1. Tables of formulas used:
Formula
number
from PDD
Formula Formula description
(D.1.1) ygridynety EFEGBE ,Pr,,
Baseline emissions calculation
(D.1.2) yequipyCHPynet ECEGEG Pr,,Pr,,Pr,,
Calculation of the net amount of electricity in the year y, generated
by turbines under the project activity
(D.1.3) outputinputyifuel SGSGLack ,, Calculation of difference between steam input and steam output
amounts
(D.1.4)
1000
,,
,
NGyifuel
yCHP
EFLackLE
Calculation of leakages due to extra natural gas combustion at site
of external consumers
(D.1.5) yCHPyy LEBEER ,
Calculation of emission reductions
D.2. Description and justification of the uncertainties of measurements:
Accuracy index of all meters used allows making measurements with sufficient level of uncertainty.
D.3. GHG emissions reduction (in accordance with Section B.2 of this document):
D.3.1. Project emissions:
In accordance with PDD there are no project emissions,
01.01.2010 -31.12.2010 01.01.2011 -31.03.2011
Project emissions, t CO2 0 0
SECOND PERIODIC ANNUAL JI MONITORING REPORT
Utilization of coke gas with electricity generation by two 6 MWe CHP
at “ZaporozhCox Plant”
Page 19
D.3.2. Baseline emissions:
Baseline Emissions can be calculated by the following formulas:
ygridynety EFEGBE ,Pr,, (Equation 1)
yBE - Baseline emissions in the year y due to grid electricity consumption, t CO2 eq.;
ynetEG Pr,, - Net amount of electricity in the year y, generated by turbines under the project activity (without electricity consumed by the project
equipment), MWh.
ygridEF , - Emission factor for the electricity consumption from the grid in the monitoring period y.
yequipyCHPynet ECEGEG Pr,,Pr,,Pr,, (Equation 2)
yCHPEG Pr,, - Amount of electricity in the year y, generated by turbines under the project activity, MWh;
yequipEC Pr,, - Amount of electricity consumed by equipment in the monitoring period y, installed under the project activity, MWh.
01.01.2010 -31.12.2010 01.01.2011 -31.03.2011
Baseline emissions, t CO2 71 012 20 266
SECOND PERIODIC ANNUAL JI MONITORING REPORT
Utilization of coke gas with electricity generation by two 6 MWe CHP
at “ZaporozhCox Plant”
Page 20
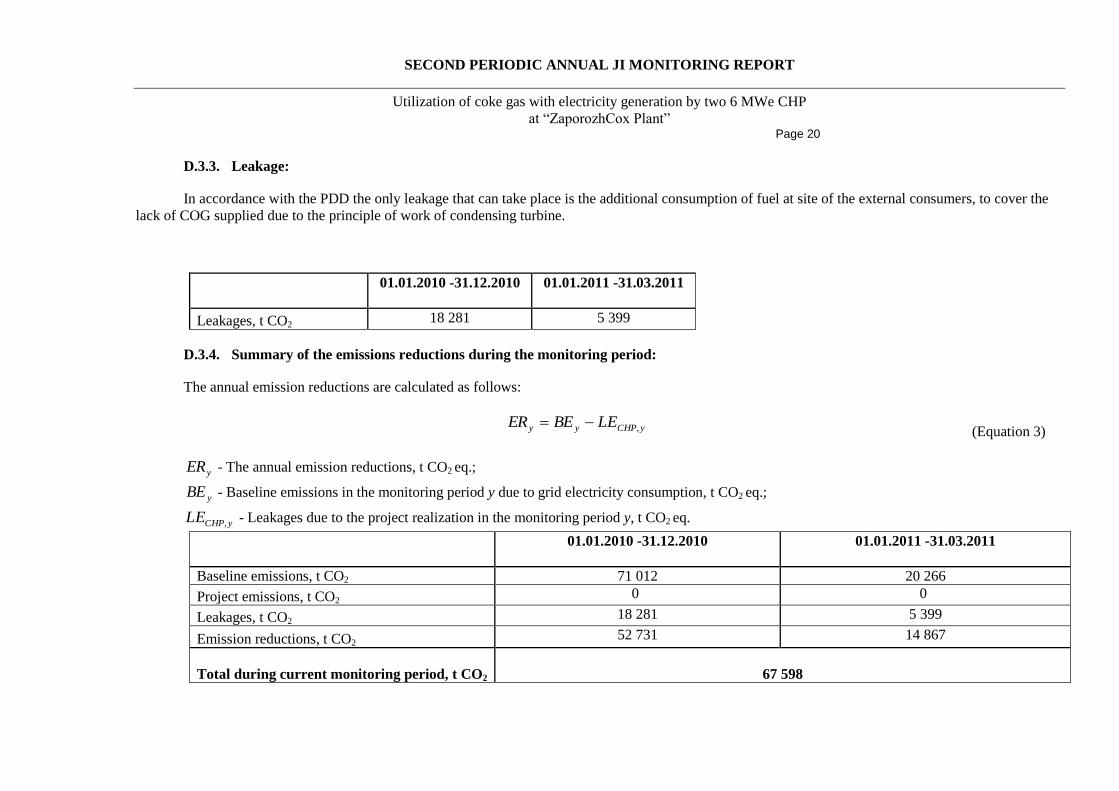
D.3.3. Leakage:
In accordance with the PDD the only leakage that can take place is the additional consumption of fuel at site of the external consumers, to cover the
lack of COG supplied due to the principle of work of condensing turbine.
01.01.2010 -31.12.2010 01.01.2011 -31.03.2011
Leakages, t CO2 18 281 5 399
D.3.4. Summary of the emissions reductions during the monitoring period:
The annual emission reductions are calculated as follows:
yCHPyy LEBEER , (Equation 3)
yER - The annual emission reductions, t CO2 eq.;
yBE - Baseline emissions in the monitoring period y due to grid electricity consumption, t CO2 eq.;
yCHPLE , - Leakages due to the project realization in the monitoring period y, t CO2 eq.