34
Second Quarter 2020 Earnings Review July 14, 2020 Citi | Investor Relations

Second Quarter 2020 Earnings Review
July 14, 2020
Citi | Investor Relations

Overview
2
Note:
(1) Preliminary. For additional information, please refer to Slide 32.
(2) Preliminary.
(3) Tangible Book Value per Share is a non-GAAP financial measures. For additional information, please refer to Slide 33.
Performance impacted by macro environment
– Despite a challenging environment, delivered solid revenue growth, expense control and
strong risk management
– Supported clients while maintaining credit discipline and balance sheet strength
– Credit reserve build primarily reflects deterioration in economic outlook and downgrades
in corporate loan portfolio
– Strong deposit growth across both Consumer and Institutional franchises
Strong capital and liquidity position
– Common Equity Tier 1 Capital Ratio of 11.5%(1)
– Liquidity Coverage Ratio of 117%(2)
– Tangible Book Value per Share increased 5% year-over-year to $71.15(3)
Priorities in this uncertain environment
– Operating from position of strength from capital, liquidity and balance sheet perspective
– Maintaining resources to support clients and employees, as well as broader economy
– Demonstrating operational resiliency as we manage through COVID-19 pandemic
– Focus on risk management and building a stronger company for the future

COVID-19 Response To Date – Supporting Our People, Clients & Communities
3
Employees Consumers Corporates Communities
• Committed more than
$100MM to date through Citi and Citi’s Foundation in
support of COVID-19-related community relief and
economic recovery efforts globally including:
― $25MM in initial
proceeds from Citi’s participation in SBA’s
Paycheck Protection Program to support
Community Development
Financial Institutions
― $4MM through Double the Good employee
donation campaign
• Announced $50MM facility to purchase loans from
Minority-Owned Depository Institutions
issued under SBA’s Paycheck Protection
Program
• Prudently extending credit
to corporate clients to support their liquidity
objectives and business needs in 2Q’20:
― $15B of draws on previously extended
credit facilities
― $18B of new credit facilities extended
― $26B of repayments on previous draws
• Facilitated $750B of
issuance in the debt and equity markets in 2Q’20,
driving repayments on previous draws
• Leveraging digital capabilities to assist clients
with supply chain management and liquidity
optimization
― In TTS, 20% increase in CitiDirect users and
strong growth in digital account openings
• Plan to participate in the Federal Reserve’s Main
Street Lending Program
• Slow and measured
reentry to site and rapid retreat where necessary
based on medical data and local conditions
• Enhanced flexibility and paid time off for colleagues
directly and indirectly impacted by COVID-19
• Additional health and well-
being resources
• Delivering virtual summer
internship program globally and guaranteed full-time
offers for those meeting minimum requirements in
hub locations
• In 1Q’20, provided > 75,000 colleagues globally with
special compensation, including $1,000 special
payment to eligible colleagues in US
• Extra cleaning and protective measures put in
place at our sites, branches and ATMs, and educating
our staff on preventive actions
• In the US, offering
comprehensive suite of customer relief treatments
across products:
― Credit Cards: provided assistance and relief
to ~2MM accounts, representing ~6% of
balances
― Mortgage: providedrelief to ~5% of
customers, representing ~7% of
balances
― Small Business: issued ~30K loans
totaling $3.4B through SBA’s Paycheck
Protection Program
• Similar programs in place in International GCB, in
line with local regulation
• Enhanced digital capabilities and servicing

2Q'20 1Q'20 %r 2Q'19 %r 1H'20 %r
Revenues $19,766 $20,731 (5)% $18,758 5% $40,497 8%
Operating Expenses 10,415 10,594 (2)% 10,500 (1)% 21,009 (0)%
Efficiency Ratio 52.7% 51.1% 56.0% 51.9%
Operating Margin 9,351 10,137 (8)% 8,258 13% 19,488 20%
Net Credit Losses 2,206 2,108 5% 1,963 12% 4,314 10%
Net ACL Build / (Release) 5,603 4,893 15% 111 NM 10,496 NM
Other Provisions 94 26 NM 19 NM 120 NM
Credit Costs 7,903 7,027 12% 2,093 NM 14,930 NM
EBT 1,448 3,110 (53)% 6,165 (77)% 4,558 (63)%
Income Taxes 131 576 (77)% 1,373 (90)% 707 (73)%
Effective Tax Rate 9% 19% 22% 16%
Net Income $1,316 $2,522 (48)% $4,799 (73)% $3,838 (60)%
Return on Assets 0.23% 0.49% 0.97% 0.36%
Return on Tangible Common Equity 2.9% 6.0% 11.9% 4.5%
EPS $0.50 $1.05 (52)% $1.95 (74)% $1.56 (59)%
Average Diluted Shares 2,084 2,114 (1)% 2,289 (9)% 2,103 (9)%
Average Assets ($B) $2,267 $2,080 9% $1,979 15% $2,173 11%
EOP Assets (Constant $B) 2,233 2,235 (0)% 1,957 14% 2,233 14%
EOP Loans (Constant $B) 685 726 (6)% 678 1% 685 1%
EOP Deposits (Constant $B) 1,234 1,193 3% 1,030 20% 1,234 20%
Citigroup – Summary Financial Results($MM, except EPS)
4
Note: Totals may not sum due to rounding. NM: Not meaningful. ACL: Allowance for Credit Losses. Constant dollar excludes the impact of foreign exchange translation into U.S.
dollars for reporting purposes and, as used throughout this presentation, is a non -GAAP financial measure. For a reconciliation of constant dollars to reported results, please
refer to Slide 34.
(1) Includes credit reserve build for loans and provision for credit losses on unfunded lending commitments.
(2) Includes provisions for credit losses on benefits and claims, HTM debt securities and other assets.
(3) Return on Tangible Common Equity (RoTCE) is a non-GAAP financial measure. For a reconciliation to reported results, please refer to Slides 33 and 34.
(1)
(3)
(2)

Global Consumer Banking
2Q'20 QoQ %r YoY %r 1H'20 %r
Revenues $7,339 (9)% (7)% $15,513 (2)%
North America 4,742 (9)% (5)% 9,966 0%
International 2,597 (8)% (12)% 5,547 (6)%
Expenses 4,013 (7)% (8)% 8,381 (4)%
North America 2,346 (7)% (10)% 4,882 (6)%
International 1,667 (5)% (4)% 3,499 (0)%
Operating Margin 3,326 (12)% (6)% 7,132 (1)%
Credit Costs 3,885 (19)% NM 8,716 NM
EBT (559) 45% NM (1,584) NM
Net Income $(396) 47% NM $(1,150) NM
Revenues $7,339 (9)% (7)% $15,513 (2)%
Retail Banking 2,836 (5)% (7)% 5,882 (3)%
Cards 4,503 (12)% (7)% 9,631 (2)%
Key Indicators (in Constant $B, except branches)
Branches 2,327 (0)% (3)% 2,327 (3)%
RB Average Deposits $302 6% 12% $296 10%
RB Average Loans 122 1% 6% 123 6%
Investment AUMs 187 11% 3% 187 3%
Cards Average Loans 150 (10)% (7)% 159 (2)%
Cards Purchase Sales 108 (15)% (23)% 236 (12)%
Note: Totals may not sum due to rounding. NM: Not meaningful. ACL: Allowance for Credit Losses. CECL: Current Expected Credit Losses. Constant dollar excludesthe
impact of foreign exchange translation into U.S. dollars for reporting purposes. For a reconciliation of constant dollars to reported results, please refer to Slide 34. 5
(Constant $MM)
• Revenues
– Down 7% YoY, driven by lower loan volumes and lower interest
rates across all regions, partially offset by strong deposit growth
• Expenses
– Down 8% YoY, driven by lower
volume-related expenses, reductions in marketing and other
discretionary spending, as well as efficiency savings, partially offset
by higher COVID-19 related expenses
• Credit Costs
– Up YoY, primarily reflecting net
ACL build of $2.0B driven by the impact of changes in economic
outlook under CECL

2Q'20 QoQ %r YoY %r 1H'20 %r
Revenues $4,742 (9)% (5)% $9,966 0%
Branded Cards 2,218 (5)% 1% 4,565 4%
Retail Services 1,402 (20)% (13)% 3,149 (4)%
Retail Banking 1,122 (1)% (3)% 2,252 (2)%
Expenses 2,346 (7)% (10)% 4,882 (6)%
Operating Margin 2,396 (11)% 2% 5,084 7%
Credit Costs 3,002 (23)% 100% 6,894 NM
EBT (606) 50% NM (1,810) NM
Net Income $(459) 50% NM $(1,369) NM
Key Indicators ($B, except branches, and as otherwise noted)
Branches 687 0% (0)% 687 (0)%
RB Average Deposits $173 7% 14% $167 11%
RB Average Loans 52 3% 9% 51 8%
Investment AUMs 69 12% 2% 69 2%
Branded Cards Average Loans 83 (11)% (7)% 88 (1)%
Branded Cards Purchase Sales 74 (14)% (21)% 160 (10)%
Retail Services Average Loans 46 (9)% (6)% 48 (3)%
Retail Services Purchase Sales 17 (6)% (25)% 35 (15)%
Active Digital Customers (MM) 20 0% 6%
Active Mobile Customers (MM) 13 1% 12%
North America Consumer Banking
Note: Totals may not sum due to rounding. NM: Not meaningful. ACL: Allowance for Credit Losses.
(1) Customers of all online and/or mobile services within the last 90 days through May 2020. For additional information, please refer to Slide 26.
(2) Customers of all mobile services (mobile apps or via mobile browser) within the last 90 days through May 2020. For additional information, please refer to Slide 26.
6
(1)
(2)
($MM)
• Revenues
– Down 5% YoY
– Branded Cards: Up 1% YoY, as a
favorable mix shift more than offset lower purchase sales and loan
volumes
– Retail Services: Down 13% YoY, reflecting lower average loans and
higher partner payments
– Retail Banking: Down 3% YoY, as lower deposit spreads more than
offset strong deposit growth and higher mortgage revenues
• Expenses– Down 10% YoY, driven by reductions
in marketing and other discretionary
spending, efficiency savings and lower volume-related expenses, partially
offset by COVID-19 related expenses
• Credit Costs
– NCLs grew 5% YoY, primarily
reflecting seasoning in Branded Cards portfolio
– Net ACL build of $1.5B, primarily
reflecting the impact of changes in economic outlook under CECL

• Revenues
– Latin America: Down 7% YoY, driven by lower cards purchase sales, a decline in
loan volumes and lower deposit spreads, partially offset by deposit growth
– Asia: Down 15% YoY, reflecting lower
cards purchase sales and lower deposit spreads, partially offset by strong deposit
growth
• Expenses
– Down 4% YoY, driven by efficiency savings and lower volume-related
expenses
• Credit Costs
– NCL rate of 1.79% vs. 1.81% in 2Q’19
– Net credit losses of $403MM down 1% YoY, primarily reflecting a decline in Latin
America
– Net ACL build of $461MM, primarily driven by the impact of changes in
economic outlook under CECL
2Q'20 QoQ %r YoY %r 1H'20 %r
Revenues $2,597 (8)% (12)% $5,547 (6)%
Latin America 1,050 (3)% (7)% 2,249 (3)%
Asia 1,547 (11)% (15)% 3,298 (8)%
Expenses 1,667 (5)% (4)% 3,499 (0)%
Latin America 604 (5)% (0)% 1,303 5%
Asia 1,063 (6)% (5)% 2,196 (3)%
Operating Margin 930 (13)% (23)% 2,048 (15)%
Credit Costs 883 1% NM 1,822 NM
EBT 47 (76)% (94)% 226 (86)%
Latin America 19 NM (93)% (38) NM
Asia 28 (88)% (95)% 264 (74)%
Net Income $63 (63)% (90)% $219 (82)%
Key Indicators (in Constant $B, except branches, and as otherwise noted)
Branches 1,640 (0)% (4)% 1,640 (4)%
RB Average Deposits $129 4% 10% $129 9%
RB Average Loans 70 (1)% 4% 71 5%
Investment AUMs 118 10% 4% 118 4%
Cards Average Loans 21 (10)% (9)% 23 (3)%
Cards Purchase Sales 18 (25)% (30)% 41 (17)%
Active Digital Customers (MM) 13 (0)% 13%
Active Mobile Customers (MM) 11 0% 22%
International Consumer Banking
7
Note: Totals may not sum due to rounding. NM: Not meaningful. ACL: Allowance for Credit Losses. Constant dollar excludes the impact of foreign exchange translation into U.S.
dollars for reporting purposes. For a reconciliation of constant dollars to reported results, please refer to Slide 34.
(1) Asia GCB includes the results of operations of GCB activities in certain EMEA countries for all periods presented.
(2) Customers of all online and/or mobile services within the last 90 days through May 2020. For additional information, please refer to Slide 26.
(3) Customers of all mobile services (mobile apps or via mobile browser) within the last 90 days through May 2020. For additional information, please refer to Slide 26.
(2)
(3)
(1)
(1)
(1)
(Constant $MM)
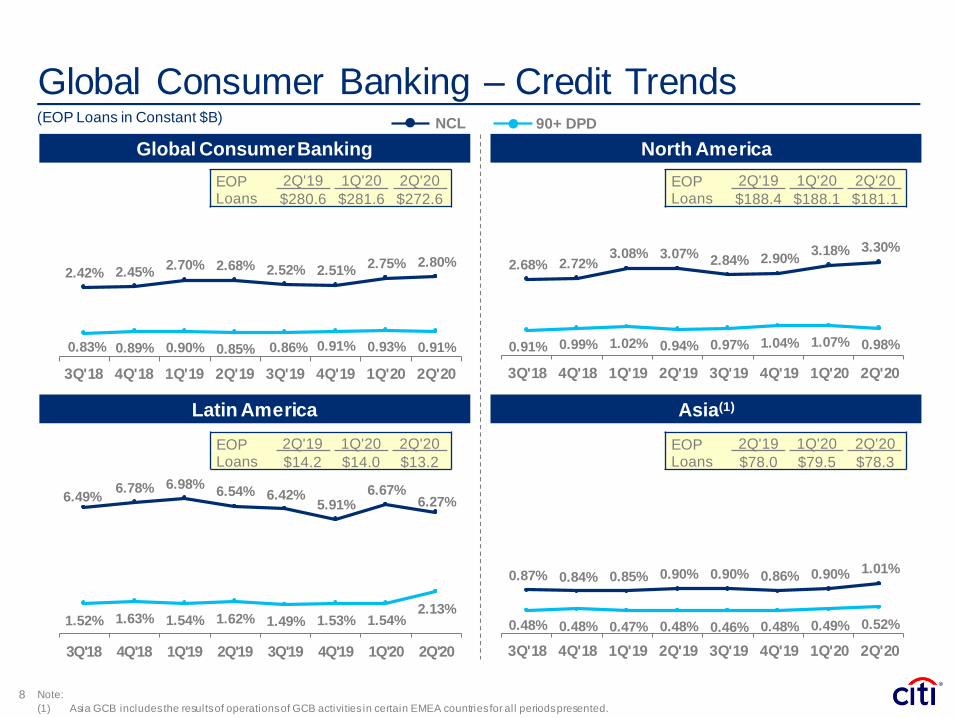
0.87% 0.84% 0.85% 0.90% 0.90% 0.86% 0.90% 1.01%
0.48% 0.48% 0.47% 0.48% 0.46% 0.48% 0.49% 0.52%
3Q'18 4Q'18 1Q'19 2Q'19 3Q'19 4Q'19 1Q'20 2Q'20
1.52% 1.63% 1.54% 1.62% 1.49% 1.53% 1.54%2.13%
6.49%6.78% 6.98%
6.54% 6.42%5.91%
6.67%6.27%
3Q'18 4Q'18 1Q'19 2Q'19 3Q'19 4Q'19 1Q'20 2Q'20
0.91% 0.99% 1.02% 0.94% 0.97% 1.04% 1.07% 0.98%
2.68% 2.72%3.08% 3.07%
2.84% 2.90%3.18% 3.30%
3Q'18 4Q'18 1Q'19 2Q'19 3Q'19 4Q'19 1Q'20 2Q'20
0.83% 0.89% 0.90% 0.85% 0.86% 0.91% 0.93% 0.91%
2.42% 2.45%2.70% 2.68% 2.52% 2.51%
2.75% 2.80%
3Q'18 4Q'18 1Q'19 2Q'19 3Q'19 4Q'19 1Q'20 2Q'20
NCL
Global Consumer Banking – Credit Trends
North AmericaGlobal Consumer Banking
Latin America Asia(1)
EOPLoans
2Q'19 1Q'20 2Q'20
$280.6 $281.6 $272.6
EOP Loans
2Q'19 1Q'20 2Q'20
$14.2 $14.0 $13.2
90+ DPD
EOPLoans
2Q'19 1Q'20 2Q'20
$78.0 $79.5 $78.3
EOPLoans
2Q'19 1Q'20 2Q'20
$188.4 $188.1 $181.1
Note:
(1) Asia GCB includes the results of operations of GCB activities in certain EMEA countries for all periods presented.
8
(EOP Loans in Constant $B)
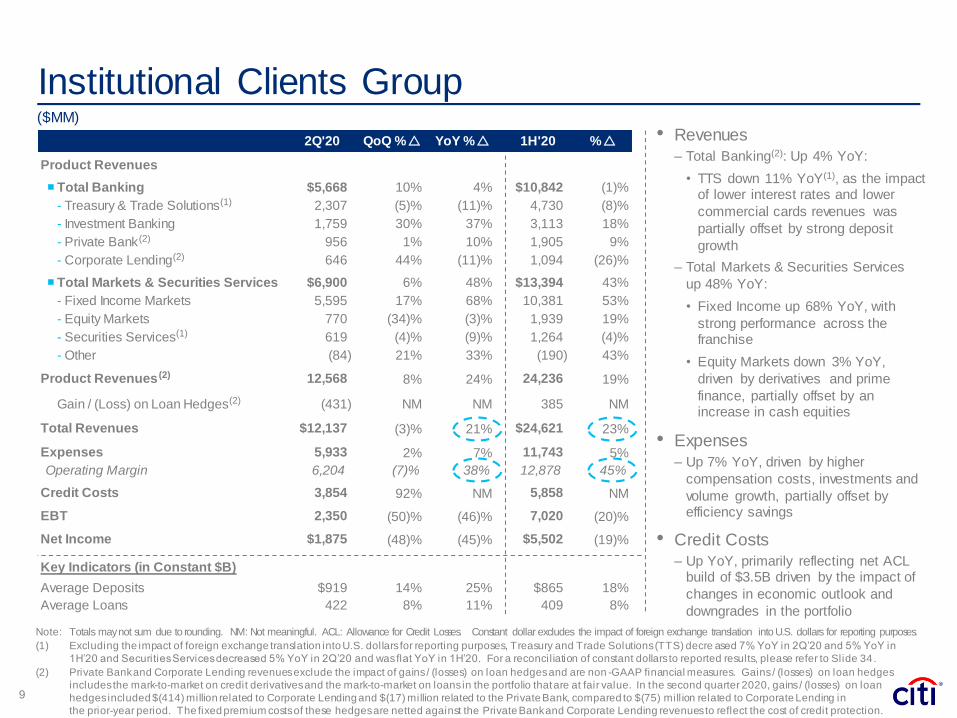
2Q'20 QoQ %r YoY %r 1H'20 %r
Product Revenues
Total Banking $5,668 10% 4% $10,842 (1)%
- Treasury & Trade Solutions 2,307 (5)% (11)% 4,730 (8)%
- Investment Banking 1,759 30% 37% 3,113 18%
- Private Bank 956 1% 10% 1,905 9%
- Corporate Lending 646 44% (11)% 1,094 (26)%
Total Markets & Securities Services $6,900 6% 48% $13,394 43%
- Fixed Income Markets 5,595 17% 68% 10,381 53%
- Equity Markets 770 (34)% (3)% 1,939 19%
- Securities Services 619 (4)% (9)% 1,264 (4)%
- Other (84) 21% 33% (190) 43%
Product Revenues 12,568 8% 24% 24,236 19%
Gain / (Loss) on Loan Hedges (431) NM NM 385 NM
Total Revenues $12,137 (3)% 21% $24,621 23%
Expenses 5,933 2% 7% 11,743 5%
Operating Margin 6,204 (7)% 38% 12,878 45%
Credit Costs 3,854 92% NM 5,858 NM
EBT 2,350 (50)% (46)% 7,020 (20)%
Net Income $1,875 (48)% (45)% $5,502 (19)%
Key Indicators (in Constant $B)
Average Deposits $919 14% 25% $865 18%
Average Loans 422 8% 11% 409 8%
• Revenues
– Total Banking(2): Up 4% YoY:
• TTS down 11% YoY(1), as the impact of lower interest rates and lower
commercial cards revenues was
partially offset by strong deposit
growth
– Total Markets & Securities Services
up 48% YoY:
• Fixed Income up 68% YoY, with
strong performance across the franchise
• Equity Markets down 3% YoY,
driven by derivatives and prime
finance, partially offset by an increase in cash equities
• Expenses
– Up 7% YoY, driven by higher
compensation costs, investments and
volume growth, partially offset by efficiency savings
• Credit Costs
– Up YoY, primarily reflecting net ACL build of $3.5B driven by the impact of
changes in economic outlook and
downgrades in the portfolio
Institutional Clients Group
9
($MM)
(2)
(2)
(2)
(1)
(1)
(2)
Note: Totals may not sum due to rounding. NM: Not meaningful. ACL: Allowance for Credit Losses. Constant dollar excludes the impact of foreign exchange translation into U.S. dollars for reporting purposes.
(1) Excluding the impact of foreign exchange translation into U.S. dollars for reporting purposes, Treasury and Trade Solutions (TTS) decre ased 7% YoY in 2Q’20 and 5% YoY in
1H’20 and Securities Services decreased 5% YoY in 2Q’20 and was flat YoY in 1H’20. For a reconciliation of constant dollars to reported results, please refer to Slide 34.
(2) Private Bank and Corporate Lending revenues exclude the impact of gains / (losses) on loan hedges and are non -GAAP financial measures. Gains / (losses) on loan hedges
includes the mark-to-market on credit derivatives and the mark-to-market on loans in the portfolio that are at fair value. In the second quarter 2020, gains / (losses) on loan
hedges included $(414) million related to Corporate Lending and $(17) million related to the Private Bank, compared to $(75) mill ion related to Corporate Lending in
the prior-year period. The fixed premium costs of these hedges are netted against the Private Bank and Corporate Lending revenues to reflect the cost of credit protection.

2Q'20 QoQ %r YoY %r 1H'20 %r
Revenues $290 NM (49)% $363 (65)%
Expenses 469 13% (2)% 885 (14)%
Credit Costs 164 (15)% NM 356 NM
EBT (343) 36% NM (878) NM
Income Taxes (178) 10% NM (376) NM
Net Income $(163) 54% NM $(514) NM
Corporate / Other
Note: Totals may not sum due to rounding. NM: Not meaningful.10
($MM)
• Revenues
– Down 49% YoY, reflecting the wind-down of legacy assets and
lower rate environment, partially offset by AFS gains and positive
marks on legacy securities
• Expenses
– Down 2% YoY, reflecting the wind-down of legacy assets,
partially offset by higher infrastructure costs and
incremental COVID-19 related expenses

3.40 2.89 3.13 2.214.82 4.90
0.90 1.22 0.841.21
1.14 1.47$4.29 $4.11 $3.97
$3.41
$5.96$6.37
1Q'19 2Q'19 3Q'19 4Q'19 1Q'20 2Q'20
10.54 10.42 10.54 10.50 10.22 9.61
0.86 1.24 0.77 1.13 1.11 1.47
$11.39 $11.66 $11.32 $11.63 $11.33 $11.08
2.72% 2.67% 2.56% 2.63%2.48%
2.17%
1Q'19 2Q'19 3Q'19 4Q'19 1Q'20 2Q'20
NIR
$(1.13)
$0.49
$(0.64)
$3.43
$0.49
$0.41 $3.91
Non-NIR
$(0.58)$(0.25)
Citigroup – Net Interest Revenue & Markets Revenue
(Constant $B)
2Q'20
QoQ r
11
2Q'20
YoY r
$2.25
Net Interest Revenue (NIR)
Markets(1) Revenue2Q'20
QoQ r
2Q'20
YoY r(Reported $B)
$0.23$0.35
$(0.81)$(0.61)
$0.25$0.33
$2.01$0.08
Citigroup NIM
Markets(1)
Ex-Markets
1H'20
YoY r
1H'20
YoY r
Note: Totals may not sum due to rounding. Excludes discontinued operations. Constant dollar excludesthe impact of foreign exchange translation into U.S. dollars for reporting
purposes. For a reconciliation of constant dollars to reported results, please refer to Slide 34.
NIM (%) includes the taxable equivalent adjustment (based on the U.S. federal statutory tax rate of 21% in all periods).
(1) Markets is defined as Fixed Income Markets and Equity Markets.
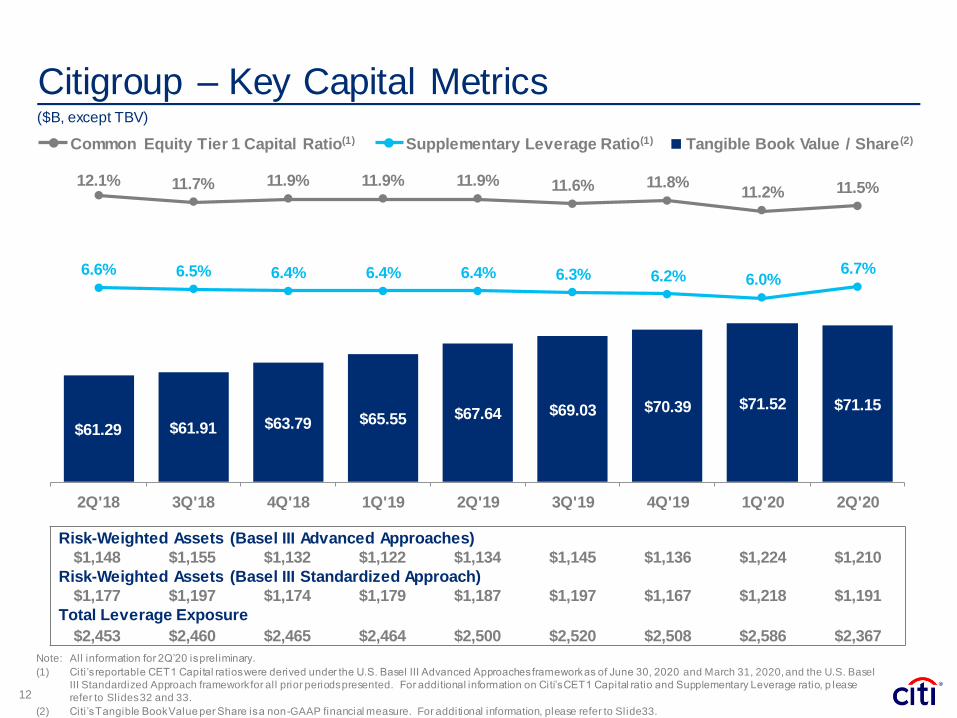
Citigroup – Key Capital Metrics
Note: All information for 2Q’20 is preliminary.
(1) Citi’s reportable CET1 Capital ratios were derived under the U.S. Basel III Advanced Approaches framework as of June 30, 2020 and March 31, 2020, and the U.S. Basel
III Standardized Approach framework for all prior periods presented. For additional information on Citi’s CET1 Capital ratio and Supplementary Leverage ratio, p lease
refer to Slides 32 and 33.
(2) Citi’s Tangible Book Value per Share is a non-GAAP financial measure. For additional information, please refer to Slide 33.
Common Equity Tier 1 Capital Ratio(1) Supplementary Leverage Ratio(1) Tangible Book Value / Share(2)
12
Risk-Weighted Assets (Basel III Advanced Approaches)
$1,148 $1,155 $1,132 $1,122 $1,134 $1,145 $1,136 $1,224 $1,210
Risk-Weighted Assets (Basel III Standardized Approach)
$1,177 $1,197 $1,174 $1,179 $1,187 $1,197 $1,167 $1,218 $1,191
Total Leverage Exposure
$2,453 $2,460 $2,465 $2,464 $2,500 $2,520 $2,508 $2,586 $2,367
$61.29 $61.91 $63.79 $65.55 $67.64 $69.03 $70.39 $71.52 $71.15
12.1% 11.7% 11.9% 11.9% 11.9% 11.6% 11.8%11.2% 11.5%
6.6% 6.5% 6.4% 6.4% 6.4% 6.3% 6.2% 6.0%6.7%
-5.0%
-3.0%
-1.0%
1.0%
3.0%
5.0%
7.0%
9.0%
11. 0%
13. 0%
2Q'18 3Q'18 4Q'18 1Q'19 2Q'19 3Q'19 4Q'19 1Q'20 2Q'20
40. 00
50. 00
60. 00
70. 00
80. 00
90. 00
100.00
($B, except TBV)

Conclusions
Note: GCB: Global Consumer Banking. ICG: Institutional Clients Group.
(1) Preliminary. For additional information on these measures, please refer to Slides 32 and 33.
(2) Preliminary. $900 billion of available liquidity resources including HQLA, additional unencumbered securities and available borrowing capacity at the FHLBs and Federal
Reserve Discount Window.
(3) Citi’s Tangible Book Value per Share is a non-GAAP financial measure. For additional information, please refer to Slide 33.
13
Operated well in challenging environment during 1H’20
– Results in GCB impacted by lower levels of activity due to COVID-19
– Solid client engagement across ICG and robust performance in Markets and Inv. Banking
– Delivered profitable first half despite ~$10.5B increase in credit reserves due to economic
outlook related to COVID-19
– Supported clients while maintaining credit discipline and balance sheet strength
Strong capital and liquidity position
– Common Equity Tier 1 Capital Ratio of 11.5%(1)
– Supplementary Leverage Ratio of 6.7%(1)
– Liquidity Coverage Ratio of 117%, with available liquidity of $900 billion(2)
– Tangible Book Value per share increased 5% year-over-year to $71.15(3)
Priorities in this uncertain environment
– Remain committed to serving clients, protecting employees and supporting economy
– Continue to demonstrate financial strength and operational resiliency
– Focus on risk management and building a stronger company for the future
Certain statements in this presentation are “forward-looking statements”
within the meaning of the rules and regulations of the U.S. Securities and
Exchange Commission (SEC). These statements are based on
management’s current expectations and are subject to uncertainty and
changes in circumstances. These statements are not guarantees of future
results or occurrences. Actual results and capital and other financial
condition may differ materially from those included in these statements due
to a variety of factors. These factors include, among others,
macroeconomic and other challenges and uncertainties related to the
COVID-19 pandemic, such as the extent and duration of the impact on
public health, the U.S. and global economies, financial markets and
consumer and corporate customers and clients, including economic
activity and employment, as well as the various actions taken in response
by governments, central banks and others, including Citi, and the
precautionary statements included in this presentation. These factors also
consist of those contained in Citigroup’s filings with the SEC, including
without limitation the “Risk Factors” section of Citigroup’s First Quarter
2020 Form 10-Q and Citigroup’s 2019 Form 10-K. Any forward-looking
statements made by or on behalf of Citigroup speak only as to the date
they are made, and Citi does not undertake to update forward-looking
statements to reflect the impact of circumstances or events that arise after
the date the forward-looking statements were made.14

Appendix
17. Citigroup Returns
18. Citigroup – LTM Efficiency Ratio and Expenses
19. Estimated FX Impact on Key P&L Metrics
20. CECL Details
21. Consumer Credit
22. ICG – Corporate Credit Exposure
23. ICG – Corporate Energy Exposure
24. ICG – Unfunded Corporate Energy Exposure
25. Regional Credit Portfolio
26. Consumer Drivers
27. Consumer Drivers (continued)
28. Institutional Drivers
29. Preferred Stock Dividend Schedule
30. Equity & CET1 Capital Drivers (QoQ)
31. Equity & CET1 Capital Drivers (YoY)
32. Common Equity Tier 1 Capital Ratio and Components
33. Supplementary Leverage Ratio; TCE Reconciliation
34. Adjusted Results and FX Impact Reconciliation
Table of Contents
16

Citigroup Returns
Note: Totals may not sum due to rounding. LTM’20: Last twelve months ending June 30, 2020.
(1) 2Q’20 represents 2Q’20 net income less 2Q’20 preferred dividends of $253 million. LTM’20 represents LTM’20 net income less L TM’20 preferred dividends of $1,094 million.
(2) Return on Assets (ROA) defined as annualized net income (before preferred dividends) divided by average assets.
(3) Tangible common equity (TCE) allocated to GCB and ICG based on estimated full year 2020 capital allocations. TCE is a non-GAAP financial measure. For additional
information on this measure, please refer to Slide 33.
Net Income
to Common
Average
GAAP
Assets
ROA(2)
(bps)
Average
Allocated
TCE(3) RoTCE
GCB $(0.4) $418 (38) $34 (4.7)%
ICG 1.9 1,756 43 87 8.6%
Corp / Other (0.4) 93 (70) 27 (6.2)%
Citigroup $1.1 $2,267 23 $149 2.9%
(1)
(1)
17
($B)
2Q’20 Returns
LTM’20 Returns
Net Income
to Common
Average
GAAP
Assets
ROA(2)
(bps)
Average
Allocated
TCE(3) RoTCE
GCB $1.9 $404 48 $34 5.6%
ICG 11.6 1,588 73 87 13.3%
Corp / Other (0.9) 95 23 28 (3.1)%
Citigroup $12.6 $2,086 66 $150 8.4%
(1)
(1)

2Q’20 1H’20 LTM’20
Operating Efficiency 52.7% 51.9% 54.1%
YoY r (bps) (328) (460) (254)
YoY r ex FX (bps) (316) (447) (248)
Note: LTM: Last Twelve Months.
Citigroup – LTM Efficiency Ratio and Expenses
18
$42.34 $42.32 $42.47 $42.24 $42.23 $42.43 $42.39 $42.28 $41.84 $41.50 $41.29 $41.44 $42.00 $42.01 $41.93
59.8%59.3% 59.2%
58.5%58.3% 58.2%
57.9% 57.7%57.4%
57.2%56.7% 56.7% 56.5%
55.0%
54.1%
4Q'16 1Q'17 2Q'17 3Q'17 4Q'17 1Q'18 2Q'18 3Q'18 4Q'18 1Q'19 2Q'19 3Q'19 4Q'19 1Q'20 2Q'20
LTM Efficiency Ratio and Expenses
($B)

Estimated FX(1) Impact on Key P&L Metrics
Note: Totals may not sum due to rounding.
(1) Impact of foreign exchange translation into U.S. dollars. Please also refer to Slide 34.
Year-over-Year Impact 2Q’20 1Q’20 4Q’19 3Q’19 2Q’19
Revenues $(0.4) $(0.3) $0.0 $(0.2) $(0.2)
Expenses (0.3) (0.2) 0.0 (0.2) (0.2)
Credit Costs (0.1) (0.0) 0.0 (0.0) (0.0)
Earnings Before Taxes $(0.1) $(0.1) $(0.0) $(0.1) $(0.1)
19
($B)

Balance
as of
12/31/19
CECL TransitionImpact
1Q’20 Build
1Q’20
FX /
Other(1)
Balance
as of
3/31/20
2Q’20 Build
2Q’20
FX /
Other(1)
Balance
as of
6/30/20
ACLL / Loans
as of
6/30/20
Cards $8.4 $4.5 $2.4 $(0.2) $15.1 $1.6 $0.0 $16.7 11.21%
All other GCB $1.2 $0.6 $0.4 $(0.2) $2.0 $0.4 $0.0 $2.4
Global Consumer Banking $9.6 $5.0 $2.8 $(0.4) $17.0 $2.0 $0.1 $19.1 7.00%
Institutional Clients Group $2.9 $(0.7) $1.3 $(0.0) $3.5 $3.4 $0.0 $6.8 1.71%
Corp / Other $0.3 $(0.1) $0.2 $(0.0) $0.3 $0.2 $(0.0) $0.5
Allowance for Credit Losses on Loans (ACLL) $12.8 $4.2 $4.3 $(0.5) $20.8 $5.5 $0.1 $26.4 3.89%
Allowance for Credit Losses on Unfunded Lending Commitments $1.5 $(0.2) $0.6 $(0.0) $1.8 $0.1 $(0.1) $1.9
Other(2) $0.0 $0.1 $0.0 $0.0 $0.1 $0.1 $(0.0) $0.2
Citigroup Allowance for Credit Losses $14.2 $4.1 $4.9 $(0.5) $22.8 $5.7 $0.0 $28.5
CECL Details
20
Note: Totals may not sum due to rounding.
(1) Includes the impact of foreign exchange translation, as well as other adjustments, on the opening balance and, in 1Q’20, the transition impact of the allowance for credit
losses, substantially all of which flows through OCI.
(2) Includes the allowance for held-to-maturity debt securities and other assets.
($B)
Allowance for Credit Losses
North America:
• Branded Cards: 10.1%
• Retail Services: 14.0%

($B) (%) 2Q'20 1Q'20 2Q'19 2Q'20 1Q'20 2Q'19
Korea 16.0 5.9% 4.0% 0.2% 0.2% 0.2% 0.7% 0.6% 0.6%
Hong Kong 12.8 4.7% 7.0% 0.1% 0.1% 0.0% 0.3% 0.2% 0.1%
Singapore 12.6 4.6% 2.0% 0.1% 0.1% 0.1% 0.3% 0.3% 0.3%
Australia 8.8 3.2% (8.8)% 0.7% 0.7% 0.8% 0.9% 0.8% 1.5%
Taiwan 7.8 2.9% (2.0)% 0.2% 0.2% 0.2% 0.4% 0.4% 0.3%
India 4.2 1.5% (4.4)% 1.5% 1.3% 1.2% 2.9% 2.0% 1.7%
Malaysia 3.7 1.4% (7.6)% 0.8% 1.2% 1.2% 0.9% 0.6% 0.4%
China 3.3 1.2% 12.3% 0.5% 0.4% 0.3% 1.2% 0.9% 0.6%
Thailand 2.6 1.0% 3.0% 1.6% 1.5% 1.4% 3.5% 3.2% 2.4%
Indonesia 0.7 0.3% (12.4)% 2.8% 2.0% 2.1% 6.5% 5.6% 6.3%
All Other 1.7 0.6% (0.6)% 1.9% 1.8% 1.4% 1.2% 3.7% 3.0%
Asia 74.2 27.2% 0.7% 0.5% 0.5% 0.4% 0.9% 0.8% 0.8%
Poland 1.9 0.7% (0.4)% 0.5% 0.5% 0.6% 1.3% 1.3% 1.4%
UAE 1.2 0.5% (14.6)% 2.5% 1.9% 1.5% 7.0% 4.8% 4.4%
Russia 0.8 0.3% (0.8)% 0.9% 0.6% 0.6% 2.6% 2.1% 1.9%
All Other 0.2 0.1% (22.6)% 2.0% 1.8% 1.2% 7.7% 5.0% 3.7%
EMEA 4.1 1.5% (6.3)% 1.2% 1.0% 0.9% 3.6% 2.8% 2.6%
Latin America 13.2 4.8% (7.2)% 2.1% 1.5% 1.5% 6.3% 7.0% 6.7%
Total International 91.5 33.6% (0.8)% 0.8% 0.7% 0.6% 1.8% 1.8% 1.8%
North America 181.1 66.4% (3.9)% 1.0% 1.1% 0.9% 3.3% 3.2% 3.1%
Global Consumer Banking 272.6 100.0% (2.9)% 0.9% 0.9% 0.8% 2.8% 2.7% 2.7%
Growth
YoY %
90+ DPD Ratio NCL Ratio2Q'20 Loans
Consumer Credit
21 Note: Totals may not sum due to rounding.
(Constant $B)

22
Region 2Q’20 1Q’20
North America 57% 57%
EMEA 24 25
Asia 12 12
Latin America 6 6
Total 100% 100%
ICG – Corporate Credit Exposure
Exposures Industry Composition – % of Portfolio
Geographic Distribution – % of Portfolio
Ratings Detail – % of Portfolio
Exposure Type 2Q’20 1Q’20
Direct outstandings(1) $359 $394
Unfunded lending commitments(2) 423 394
Total $782 $787
2Q’20 1Q’20
AAA / AA / A 49% 48%
BBB 31 33
BB / B 16 17
CCC or below 4 2
Total 100% 100%
Industry 2Q’20 1Q’20
Transportation & industrials 19% 19%
Autos 7 7
Transportation 4 4
Industrials 9 9
Private Bank 13 13
Consumer retail 11 10
Health 4 4
Technology, media and telecom 10 10
Power, chemicals, metals & mining 8 9
Banks and finance companies 7 8
Real estate 8 7
Energy and commodities 7 7
Public sector 3 3
Insurance 3 3
Asset managers and funds 3 3
Financial markets infrastructure 2 2
Securities firms 0 0
Other industries 2 1
Total 100% 100%
($B)
Note: 2Q’20 data is preliminary. Totals may not sum due to rounding. Data includes ICG excluding Private Bank delinquency managed portfolio in all periods.
(1) Includes drawn loans, overdrafts, bankers’ acceptances and leases.
(2) Includes unused commitments to lend, letters of credit and financial guarantees.

23
ICG – Corporate Energy Exposure
Energy / Energy-Related Exposure
Energy(1) Subsector Exposures
Geographic Distribution as of 2Q’20(2)
Ratings Detail
Note: 2Q’20 data is preliminary. Totals may not sum due to rounding. ICG: Institutional Clients Group. Reflects corporate credit exposures in the ICG.
(1) Includes energy-related exposures classified in other industries, primarily Public Sector and Transportation.
(2) Total exposure includes direct outstandings and unfunded commitments.
(3) E&P: Exploration and Production. RBL: Reserve-Based Lending. Services & Dril l ing includes Oil and Gas Equipment and Services, Oil and Gas Dril ling and Offshore Drill ing.
Funded Total Exposure(2)
2 2Q’20 1Q’20 2Q’20 1Q’20
AAA / AA / A 16 % 21 % 36 % 37 %
BBB 31 38 34 38
BB / B 33 30 21 19
CCC or below 20 10 10 7
Total 100 % 100 % 100 % 100 %
North America
57%
LATAM8% UK
14%
EMEA13%
Asia8%
Funded Total Exposure(2)
2Q’20 1Q’20 2Q’20 1Q’20
Energy $18.8 $19.3 $55.4 $55.4
Energy-Related(1) 3.4 3.2 5.8 5.4
Total $22.2 $22.5 $61.2 $60.8
(EOP in $B)
Funded
Total
Exposure(2)
2 2Q’20 1Q’20 2Q’20 1Q’20
Oil and Gas E&P(3) $6.0 $6.0 $15.2 $15.5
Memo: NA RBL(3) 2.9 3.1 4.9 5.6
Services and Drilling(3) 2.8 2.8 8.0 8.3
Refining 4.6 4.4 9.0 10.0
Midstream / Oil & Gas Storage & Transportation
2.4 2.6 8.5 7.8
Integrated Oil and Gas 5.1 5.5 17.9 16.7
Other 1.2 1.2 2.6 2.5
Total $22.2 $22.5 $61.2 $60.8
~82% of unfunded exposures as of 2Q’20 are investment grade
4.6% Funded Reserve Ratio

24
ICG – Unfunded Corporate Energy Exposure(1)
Facility Structure Ratings Detail
Subsector Ratings Detail
Key Takeaways 2Q’20
Note: 2Q’20 data is preliminary. Totals may not sum due to rounding. ICG: Institutional Clients Group. Preliminary.
(1) Represents unfunded commitments. Includes energy-related exposures classified in other industries, primarily Public Sector and Transportation.
(2) E&P: Exploration and Production. Services & Dril l ing includes Oil and Gas Equipment and Services, Oil and Gas Dril ling and Offshore Dril ling.
AAA /
AA / ABBB BB / B
CCC
or below
Total
Oil and Gas E&P(2) $2.9 $3.1 $2.7 $0.4 $9.1
Servicesand Drilling(2) 1.9 1.9 0.5 0.9 5.2
Refining 1.2 2.5 0.6 0.1 4.4
Midstream / Oil & Gas Storage & Transportation 1.9 3.4 0.6 0.1 6.1
Integrated Oil and Gas 9.9 2.2 0.7 – 12.8
Other 0.3 0.8 0.3 – 1.4
Total $18.2 $13.9 $5.5 $1.5 $39.0
(EOP in $B)
• Fronting exposure represents advances to borrowers on behalf of participating banks
• Letters of credit are generally short term and trade-related
• Exposures rated A or higher include, as an example, commercial paper backstops
• Generally protected by maintenance covenants; 48% of exposures are secured
AAA /
AA / ABBB BB / B
CCC
or below
Total
Fronting Exposure $5.1 – – – $5.1
Letters of Credit 1.9 2.4 0.9 0.1 5.3
Revolving Facility & Other 11.2 11.5 4.5 1.4 28.6
Total $18.2 $13.9 $5.5 $1.5 $39.0
A
B
C D
A
B
C
D
34% 60%
14%
26%
18%
2%
34%
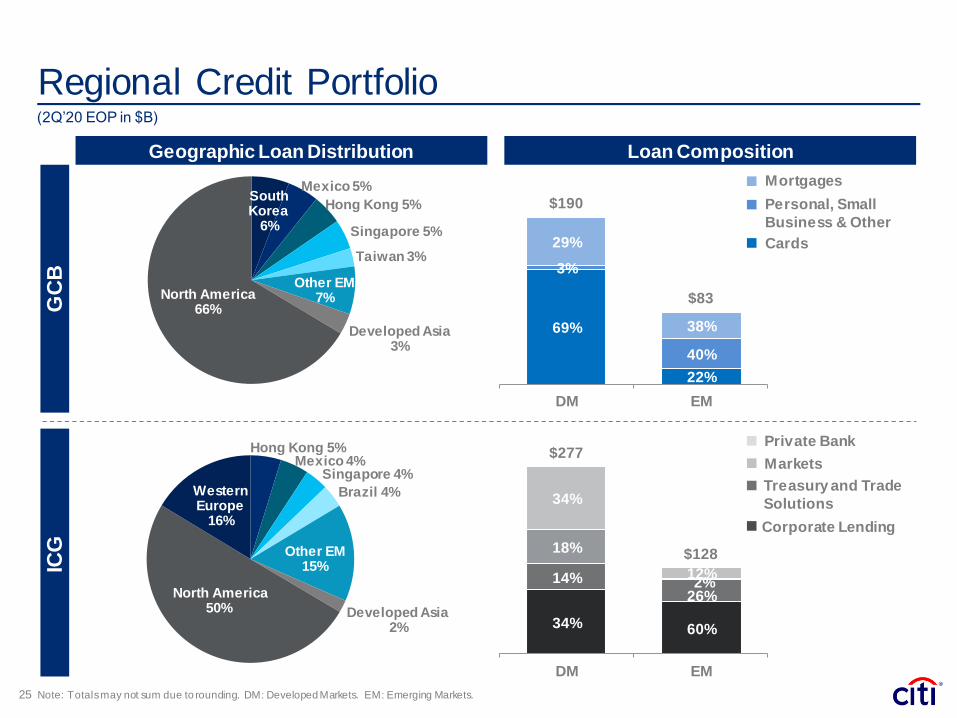
12%
$277
$128
DM EM
69%
22%
3%
40%
29%
38%
$190
$83
DM EM
South Korea
6%
Mexico 5%
Hong Kong 5%
Singapore 5%
Taiwan 3%
Other EM7%
Developed Asia3%
North America66%
Regional Credit Portfolio
Hong Kong 5%Mexico 4%
Singapore 4%
Brazil 4%
Other EM15%
Developed Asia2%
North America50%
Western Europe
16%
GC
BIC
G
Geographic Loan Distribution Loan Composition
Note: Totals may not sum due to rounding. DM: Developed Markets. EM: Emerging Markets.
Markets
Treasury and Trade
Solutions
Corporate Lending
Mortgages
Cards
Personal, Small
Business & Other
25
Private Bank
(2Q’20 EOP in $B)
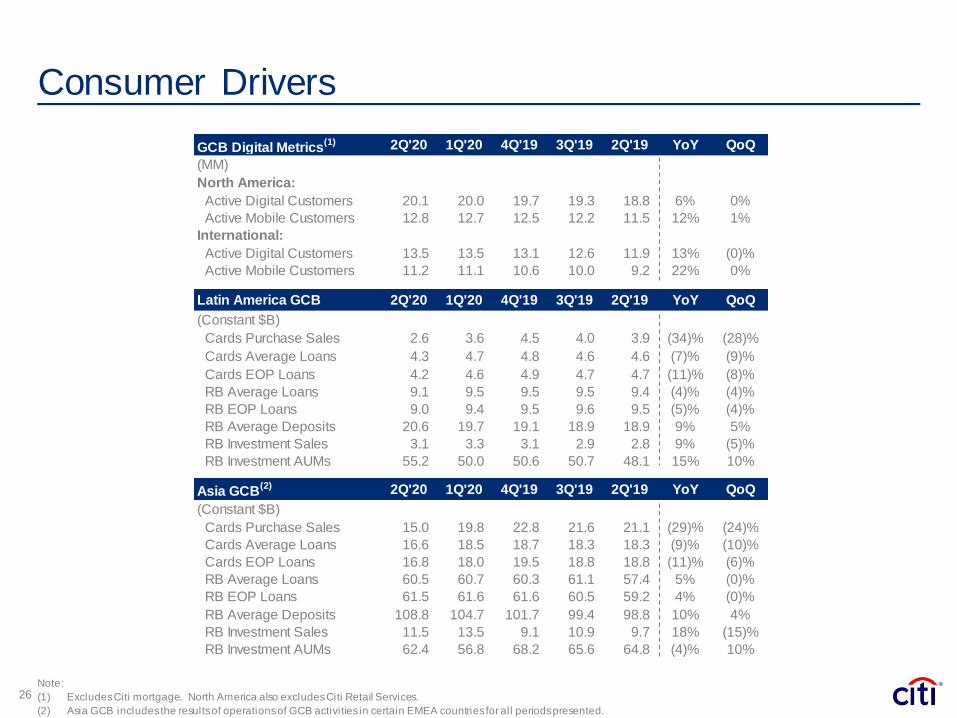
Asia GCB(2) 2Q'20 1Q'20 4Q'19 3Q'19 2Q'19 YoY QoQ
(Constant $B)
Cards Purchase Sales 15.0 19.8 22.8 21.6 21.1 (29)% (24)%
Cards Average Loans 16.6 18.5 18.7 18.3 18.3 (9)% (10)%
Cards EOP Loans 16.8 18.0 19.5 18.8 18.8 (11)% (6)%
RB Average Loans 60.5 60.7 60.3 61.1 57.4 5% (0)%
RB EOP Loans 61.5 61.6 61.6 60.5 59.2 4% (0)%
RB Average Deposits 108.8 104.7 101.7 99.4 98.8 10% 4%
RB Investment Sales 11.5 13.5 9.1 10.9 9.7 18% (15)%
RB Investment AUMs 62.4 56.8 68.2 65.6 64.8 (4)% 10%
Latin America GCB 2Q'20 1Q'20 4Q'19 3Q'19 2Q'19 YoY QoQ
(Constant $B)
Cards Purchase Sales 2.6 3.6 4.5 4.0 3.9 (34)% (28)%
Cards Average Loans 4.3 4.7 4.8 4.6 4.6 (7)% (9)%
Cards EOP Loans 4.2 4.6 4.9 4.7 4.7 (11)% (8)%
RB Average Loans 9.1 9.5 9.5 9.5 9.4 (4)% (4)%
RB EOP Loans 9.0 9.4 9.5 9.6 9.5 (5)% (4)%
RB Average Deposits 20.6 19.7 19.1 18.9 18.9 9% 5%
RB Investment Sales 3.1 3.3 3.1 2.9 2.8 9% (5)%
RB Investment AUMs 55.2 50.0 50.6 50.7 48.1 15% 10%
GCB Digital Metrics(1) 2Q'20 1Q'20 4Q'19 3Q'19 2Q'19 YoY QoQ
(MM)
North America:
Active Digital Customers 20.1 20.0 19.7 19.3 18.8 6% 0%
Active Mobile Customers 12.8 12.7 12.5 12.2 11.5 12% 1%
International:
Active Digital Customers 13.5 13.5 13.1 12.6 11.9 13% (0)%
Active Mobile Customers 11.2 11.1 10.6 10.0 9.2 22% 0%
Consumer Drivers
Note:
(1) Excludes Citi mortgage. North America also excludes Citi Retail Services.
(2) Asia GCB includes the results of operations of GCB activities in certain EMEA countries for all periods presented.
26

27.430.8
33.6
2Q'18 2Q'19 2Q'20
Consumer Drivers (continued)
E-Payment Penetration(4)
Note: LTM: Last Twelve Months.
(1) For additional information, please refer to footnote 1 on Slide 26.
(2) Agent contact rate defined as total agent handled calls divided by average total active accounts.
(3) E-statement penetration defined as total electronic statements divided by total statements (paper statements plus electronic statements).
(4) E-payment penetration defined as total electronic payments divided by total payments (paper payments plus electronic payments).
27
72% 75%78%
LTM'18 LTM'19 LTM'20
E-Statement Penetration(3)
Agent Contact Rate (2)
1.32 1.24
1.05
LTM'18 LTM'19 LTM'20
(20)%
47%50%
54%
LTM'18 LTM'19 LTM'20
~700 bps
~600 bps
Digital / Mobile Customers(1)
16.5
20.724.0
2Q'18 2Q'19 2Q'20
45%23%
Mobile CustomersDigital Customers(MM)

ICG 2Q'20 1Q'20 4Q'19 3Q'19 2Q'19 YoY QoQ
(Constant $B)
Average Deposits: 919 804 785 765 738 25% 14%
NA 481 402 392 374 351 37% 20%
EMEA 211 193 190 193 192 10% 9%
Latin America 40 34 33 31 30 30% 18%
Asia 187 176 170 166 164 14% 7%
EOP Deposits: 908 883 758 792 742 22% 3%
NA 472 445 374 393 356 33% 6%
EMEA 212 212 186 195 192 10% (0)%
Latin America 40 36 32 31 30 34% 10%
Asia 185 190 166 172 164 13% (3)%
Average Loans: 422 391 386 382 380 11% 8%
NA 215 196 191 189 188 14% 10%
EMEA 91 86 87 87 83 10% 5%
Latin America 43 36 36 36 38 15% 19%
Asia 73 73 72 70 72 1% 0%
EOP Loans: 404 435 384 392 386 5% (7)%
NA 203 224 191 191 191 6% (9)%
EMEA 88 95 85 92 86 2% (7)%
Latin America 42 41 36 36 37 14% 2%
Asia 71 75 72 73 72 (1)% (5)%
Institutional Drivers
Note: Totals may not sum due to rounding.28
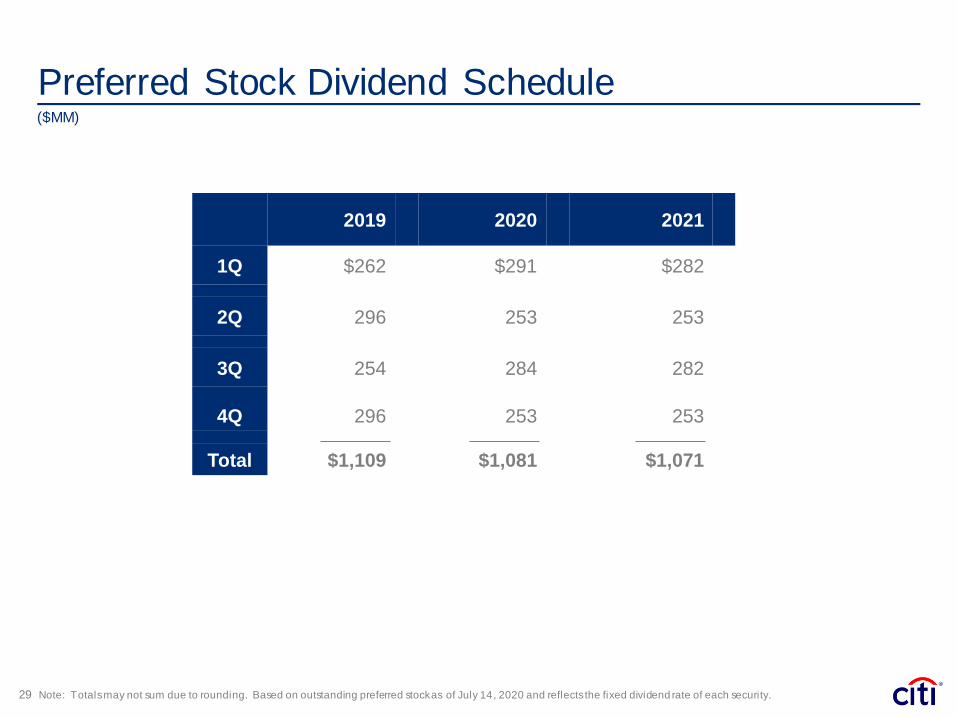
Preferred Stock Dividend Schedule
Note: Totals may not sum due to rounding. Based on outstanding preferred stock as of July 14, 2020 and reflects the fixed dividend rate of each security. 29
($MM)
2019 2020 2021
1Q $262 $291 $282
2Q 296 253 253
3Q 254 284 282
4Q 296 253 253
Total $1,109 $1,081 $1,071
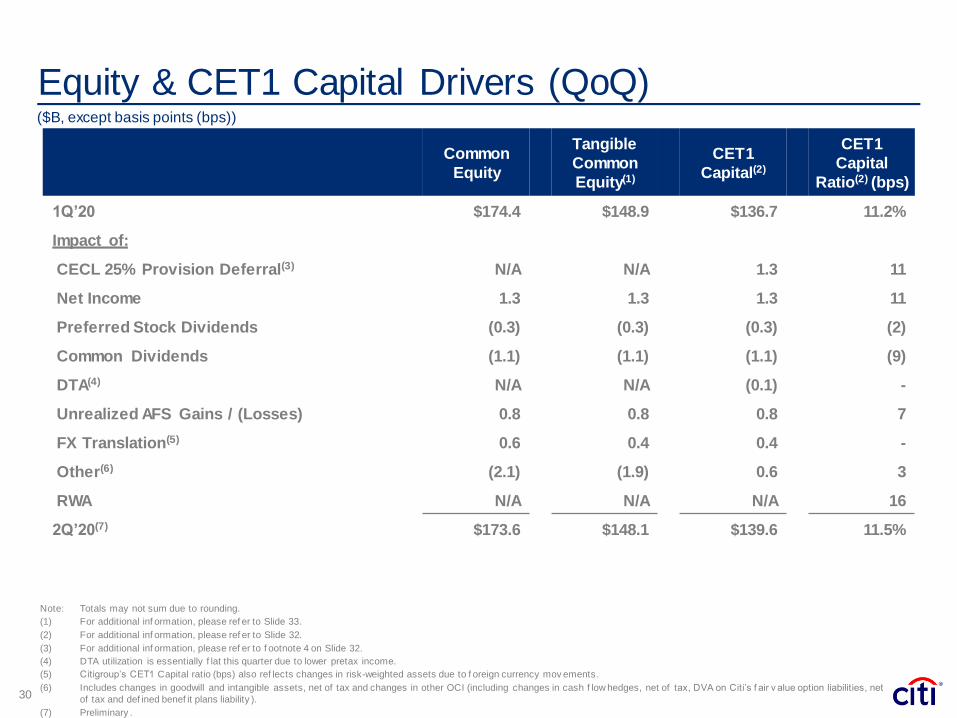
Equity & CET1 Capital Drivers (QoQ)
30
Note: Totals may not sum due to rounding.
(1) For additional inf ormation, please ref er to Slide 33.
(2) For additional inf ormation, please ref er to Slide 32.
(3) For additional inf ormation, please ref er to f ootnote 4 on Slide 32.
(4) DTA utilization is essentially f lat this quarter due to lower pretax income.
(5) Citigroup’s CET1 Capital ratio (bps) also ref lects changes in risk-weighted assets due to f oreign currency mov ements.
(6) Includes changes in goodwill and intangible assets, net of tax and changes in other OCI (including changes in cash f low hedges, net of tax, DVA on Citi’s f air v alue option liabilities, net
of tax and def ined benef it plans liability ).
(7) Preliminary .
($B, except basis points (bps))
Common
Equity
Tangible
Common
Equity(1)
CET1
Capital(2)
CET1
Capital
Ratio(2) (bps)
1Q’20 $174.4 $148.9 $136.7 11.2%
Impact of:
CECL 25% Provision Deferral(3) N/A N/A 1.3 11
Net Income 1.3 1.3 1.3 11
Preferred Stock Dividends (0.3) (0.3) (0.3) (2)
Common Dividends (1.1) (1.1) (1.1) (9)
DTA(4) N/A N/A (0.1) -
Unrealized AFS Gains / (Losses) 0.8 0.8 0.8 7
FX Translation(5) 0.6 0.4 0.4 -
Other(6) (2.1) (1.9) 0.6 3
RWA N/A N/A N/A 16
2Q’20(7) $173.6 $148.1 $139.6 11.5%
Equity & CET1 Capital Drivers (YoY)
31
($B, except basis points (bps))
Common
Equity
Tangible
Common
Equity(1)
CET1
Capital(2)
CET1
Capital
Ratio(2) (bps)
2Q’19 $179.4 $152.8 $141.1 11.9%
Impact of:
CECL Transition Impact(3) (3.1) (3.1) - -
CECL 25% Provision Deferral(4) N/A N/A 2.5 21
Net Income 13.7 13.7 13.7 114
Preferred Stock Dividends (1.1) (1.1) (1.1) (9)
Common Share Repurchases & Dividends (17.6) (17.6) (17.6) (147)
DTA(5) N/A N/A (0.8) (6)
Unrealized AFS Gains / (Losses) 4.1 4.1 4.1 34
FX Translation(6) (4.0) (3.3) (3.3) (10)
Other(7) 2.2 2.6 1.0 8
RWA(8) N/A N/A N/A (40)
2Q’20(9) $173.6 $148.1 $139.6 11.5%Note: Totals may not sum due to rounding.
(1) For additional inf ormation, please ref er to Slide 33.
(2) For additional inf ormation, please ref er to Slide 32.
(3) Common Equity and Tangible Common Equity ref lect the CECL transition adjustment to retained earnings f rom the adoption of CEC L on January 1, 2020.
(4) For additional inf ormation, please ref er to f ootnote 4 on Slide 32.
(5) Current YoY DTA utilization of $0.5 billion was more than of f set by valuation allowance releases and prior y ear adjustments in 2019.
(6) Citigroup’s CET1 Capital ratio (bps) also ref lects changes in risk-weighted assets due to f oreign currency mov ements.
(7) Includes changes in goodwill and intangible assets, net of tax and changes in other OCI (including changes in cash f low hedges, net of tax, DVA on Citi’s f air v alue option liabilities, net
of tax and def ined benef it plans liability ).
(8) Ref lects the change in Citi's reportable CET1 Capital ratio f rom the U.S. Basel III Standardized Approach to the Adv anced Approaches beginning 1Q’20. For additional inf ormation,
please ref er to f ootnote 1 on slide 32.
(9) Preliminary .
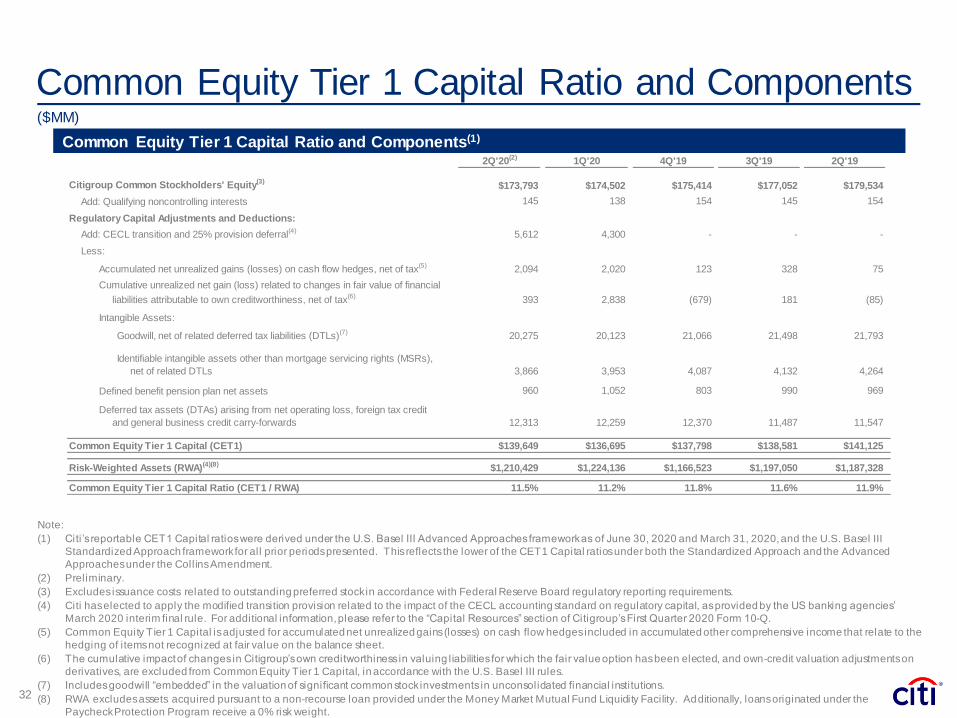
2Q'20(2) 1Q'20 4Q'19 3Q'19 2Q'19
Citigroup Common Stockholders' Equity(3) $173,793 $174,502 $175,414 $177,052 $179,534
Add: Qualifying noncontrolling interests 145 138 154 145 154
Regulatory Capital Adjustments and Deductions:
Add: CECL transition and 25% provision deferral(4) 5,612 4,300 - - -
Less:
Accumulated net unrealized gains (losses) on cash flow hedges, net of tax(5) 2,094 2,020 123 328 75
Cumulative unrealized net gain (loss) related to changes in fair value of financial
liabilities attributable to own creditworthiness, net of tax(6) 393 2,838 (679) 181 (85)
Intangible Assets:
Goodwill, net of related deferred tax liabilities (DTLs)(7) 20,275 20,123 21,066 21,498 21,793
Identifiable intangible assets other than mortgage servicing rights (MSRs),
net of related DTLs 3,866 3,953 4,087 4,132 4,264
Defined benefit pension plan net assets 960 1,052 803 990 969
Deferred tax assets (DTAs) arising from net operating loss, foreign tax credit
and general business credit carry-forwards 12,313 12,259 12,370 11,487 11,547
Common Equity Tier 1 Capital (CET1) $139,649 $136,695 $137,798 $138,581 $141,125
Risk-Weighted Assets (RWA)(4)(8) $1,210,429 $1,224,136 $1,166,523 $1,197,050 $1,187,328
Common Equity Tier 1 Capital Ratio (CET1 / RWA) 11.5% 11.2% 11.8% 11.6% 11.9%
Common Equity Tier 1 Capital Ratio and Components(1)
Note:
(1) Citi’s reportable CET1 Capital ratios were derived under the U.S. Basel III Advanced Approaches framework as of June 30, 2020 and March 31, 2020, and the U.S. Basel III
Standardized Approach framework for all prior periodspresented. This reflects the lower of the CET1 Capital ratios under both the Standardized Approach and the Advanced
Approaches under the Collins Amendment.
(2) Preliminary.
(3) Excludes issuance costs related to outstanding preferred stock in accordance with Federal Reserve Board regulatory reporting requirements.
(4) Citi has elected to apply the modified transition provision related to the impact of the CECL accounting standard on regulatory capital, as provided by the US banking agencies’
March 2020 interim final rule. For additional information, please refer to the “Capital Resources” section of Citigroup’s First Quarter 2020 Form 10-Q.
(5) Common Equity Tier 1 Capital is adjusted for accumulatednet unrealized gains (losses) on cash flow hedges included in accumulated other comprehensive income that relate to the
hedging of items not recognized at fair value on the balance sheet.
(6) The cumulative impact of changes in Citigroup’s own creditworthiness in valuing liabilities for which the fair value option has been elected, and own-credit valuation adjustments on
derivatives, are excluded from Common Equity Tier 1 Capital, in accordance with the U.S. Basel III rules.
(7) Includes goodwill “embedded” in the valuation of significant common stock investments in unconsolidated financial institutions.
(8) RWA excludes assets acquired pursuant to a non-recourse loan provided under the Money Market Mutual Fund Liquidity Facility. Additionally, loans originated under the
Paycheck Protection Program receive a 0% risk weight.
Common Equity Tier 1 Capital Ratio and Components
32
($MM)
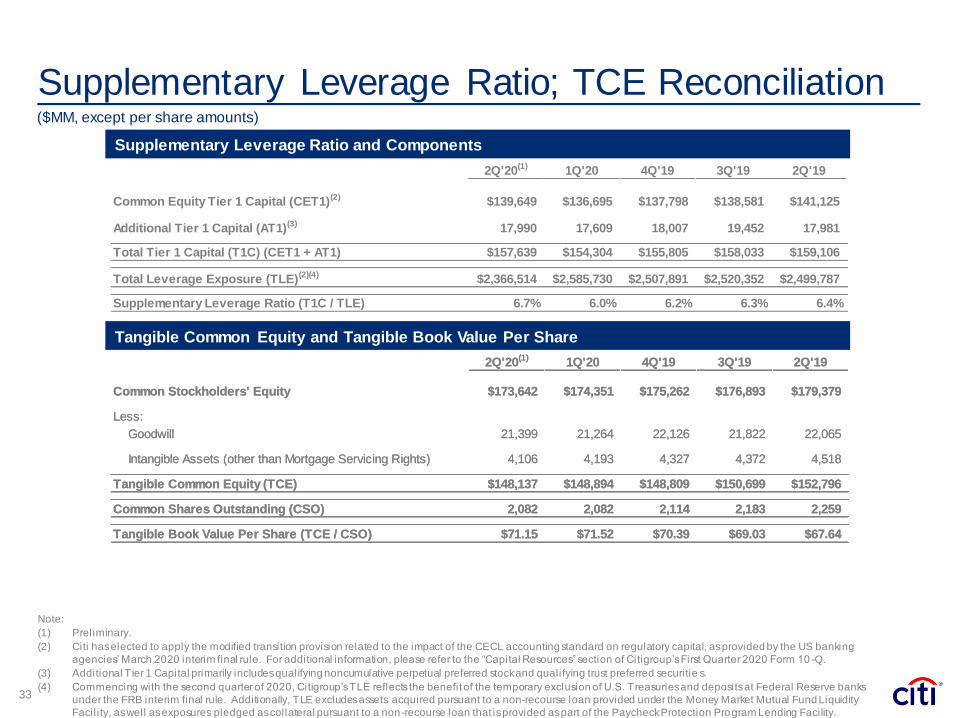
2Q'20(1) 1Q'20 4Q'19 3Q'19 2Q'19
Common Stockholders' Equity $173,642 $174,351 $175,262 $176,893 $179,379
Less:
Goodwill 21,399 21,264 22,126 21,822 22,065
Intangible Assets (other than Mortgage Servicing Rights) 4,106 4,193 4,327 4,372 4,518
Tangible Common Equity (TCE) $148,137 $148,894 $148,809 $150,699 $152,796
Common Shares Outstanding (CSO) 2,082 2,082 2,114 2,183 2,259
Tangible Book Value Per Share (TCE / CSO) $71.15 $71.52 $70.39 $69.03 $67.64
2Q'20(1) 1Q'20 4Q'19 3Q'19 2Q'19
Common Equity Tier 1 Capital (CET1)(2) $139,649 $136,695 $137,798 $138,581 $141,125
Additional Tier 1 Capital (AT1)(3) 17,990 17,609 18,007 19,452 17,981
Total Tier 1 Capital (T1C) (CET1 + AT1) $157,639 $154,304 $155,805 $158,033 $159,106
Total Leverage Exposure (TLE)(2)(4) $2,366,514 $2,585,730 $2,507,891 $2,520,352 $2,499,787
Supplementary Leverage Ratio (T1C / TLE) 6.7% 6.0% 6.2% 6.3% 6.4%
2Q'20(1) 1Q'20 4Q'19 3Q'19 2Q'19
Common Stockholders' Equity $173,642 $174,351 $175,262 $176,893 $179,379
Less:
Goodwill 21,399 21,264 22,126 21,822 22,065
Intangible Assets (other than Mortgage Servicing Rights) 4,106 4,193 4,327 4,372 4,518
Tangible Common Equity (TCE) $148,137 $148,894 $148,809 $150,699 $152,796
Common Shares Outstanding (CSO) 2,082 2,082 2,114 2,183 2,259
Tangible Book Value Per Share (TCE / CSO) $71.15 $71.52 $70.39 $69.03 $67.64
Supplementary Leverage Ratio and Components
Tangible Common Equity and Tangible Book Value Per Share
Supplementary Leverage Ratio; TCE Reconciliation
Note:
(1) Preliminary.
(2) Citi has elected to apply the modified transition provision related to the impact of the CECL accounting standard on regulatory capital, as provided by the US banking
agencies’ March 2020 interim final rule. For additional information, please refer to the “Capital Resources” section of Citigroup’s First Quarter 2020 Form 10 -Q.
(3) Additional Tier 1 Capital primarily includes qualifying noncumulative perpetual preferred stock and qualifying trust preferred securitie s.
(4) Commencing with the second quarter of 2020, Citigroup’s TLE reflects the benefit of the temporary exclusion of U.S. Treasuries and deposits at Federal Reserve banks
under the FRB interim final rule. Additionally, TLE excludes assets acquired pursuant to a non-recourse loan provided under the Money Market Mutual Fund Liquidity
Facility, aswell as exposures pledged as collateral pursuant to a non-recourse loan that is provided as part of the Paycheck Protection Program Lending Facility.
33
($MM, except per share amounts)

Citigroup 2Q'20 1Q'20 4Q'19 3Q'19 2Q'19 1Q'19 1H'20 1H'19
Reported Net Interest Revenue $11,080 $11,492 $11,997 $11,641 $11,950 $11,759 $22,572 $23,709
Impact of FX Translation - (160) (368) (326) (291) (367) (160) (657)
Net Interest Revenue in Constant Dollars $11,080 $11,332 $11,629 $11,315 $11,659 $11,392 $22,412 $23,052
Global Consumer Banking 2Q'20 1Q'20 2Q'19 1H'20 1H'19
Reported Retail Banking Revenues $2,836 $3,046 $3,202 $5,882 $6,308
Impact of FX Translation - (75) (155) - (229)
Retail Banking Revenues in Constant Dollars $2,836 $2,971 $3,047 $5,882 $6,079
Reported Cards Revenues $4,503 $5,128 $4,931 $9,631 $9,915
Impact of FX Translation - (39) (73) - (113)
Cards Revenues in Constant Dollars $4,503 $5,089 $4,858 $9,631 $9,802
International Consumer Banking 2Q'20 1Q'20 2Q'19 1H'20 1H'19
Reported Revenues $2,597 $2,950 $3,167 $5,547 $6,257
Impact of FX Translation - (115) (228) - (343)
Revenues in Constant Dollars $2,597 $2,835 $2,939 $5,547 $5,914
Reported Expenses $1,667 $1,832 $1,850 $3,499 $3,694
Impact of FX Translation - (68) (121) - (186)
Expenses in Constant Dollars $1,667 $1,764 $1,729 $3,499 $3,508
Reported Credit Costs $883 $939 $479 $1,822 $923
Impact of FX Translation - (62) (57) - (83)
Credit Costs in Constant Dollars $883 $877 $422 $1,822 $840
Reported Net Income $63 $156 $637 $219 $1,250
Impact of FX Translation - 13 (33) - (49)
Net Income in Constant Dollars $63 $169 $604 $219 $1,201
Citigroup 2Q'20 1Q'20 2Q'19 1H'20 1H'19
Reported Net Income $1,316 $2,522 $4,799 $3,838 $9,509
Less: Preferred Dividends 253 291 296 544 558
Net Income to Common Shareholders $1,063 $2,231 $4,503 $3,294 $8,951
Average TCE $148,516 $148,852 $152,193 $148,613 $151,821
RoTCE(1) 2.9% 6.0% 11.9% 4.5% 11.9%
Citigroup 2Q'20 1Q'20 2Q'19 1H'20 1H'19
Reported EOP Assets $2,233 $2,220 $1,988 $2,233 $1,988
Impact of FX Translation - 15 (32) - (32)
EOP Assets in Constant Dollars $2,233 $2,235 $1,957 $2,233 $1,957
Reported EOP Loans $685 $721 $689 $685 $689
Impact of FX Translation - 5 (10) - (10)
EOP Loans in Constant Dollars $685 $726 $678 $685 $678
Reported EOP Deposits $1,234 $1,185 $1,046 $1,234 $1,046
Impact of FX Translation - 8 (16) - (16)
EOP Deposits in Constant Dollars $1,234 $1,193 $1,030 $1,234 $1,030
Latin America Consumer Banking 2Q'20 1Q'20 2Q'19 1H'20 1H'19
Reported Revenues $1,050 $1,199 $1,320 $2,249 $2,592
Impact of FX Translation - (111) (193) - (266)
Revenues in Constant Dollars $1,050 $1,088 $1,127 $2,249 $2,326
Reported Expenses $604 $699 $704 $1,303 $1,377
Impact of FX Translation - (63) (97) - (132)
Expenses in Constant Dollars $604 $636 $607 $1,303 $1,245
Reported EBT $19 $(57) $321 $(38) $620
Impact of FX Translation - 12 (44) - (64)
EBT in Constant Dollars $19 $(45) $277 $(38) $556
Asia Consumer Banking(2) 2Q'20 1Q'20 2Q'19 1H'20 1H'19
Reported Revenues $1,547 $1,751 $1,847 $3,298 $3,665
Impact of FX Translation - (4) (35) - (77)
Revenues in Constant Dollars $1,547 $1,747 $1,812 $3,298 $3,588
Reported Expenses $1,063 $1,133 $1,146 $2,196 $2,317
Impact of FX Translation - (5) (24) - (54)
Expenses in Constant Dollars $1,063 $1,128 $1,122 $2,196 $2,263
Reported EBT $28 $236 $517 $264 $1,020
Impact of FX Translation - 3 (6) - (10)
EBT in Constant Dollars $28 $239 $511 $264 $1,010
Treasury and Trade Solutions 2Q'20 1Q'20 2Q'19 1H'20 1H'19
Reported Revenues $2,307 $2,423 $2,587 $4,730 $5,126
Impact of FX Translation - (38) (98) - (164)
Revenues in Constant Dollars $2,307 $2,385 $2,489 $4,730 $4,962
Securities Services 2Q'20 1Q'20 2Q'19 1H'20 1H'19
Reported Revenues $619 $645 $682 $1,264 $1,320
Impact of FX Translation - (12) (28) - (50)
Revenues in Constant Dollars $619 $633 $654 $1,264 $1,270
Adjusted Results and FX Impact Reconciliation
34Note: Totals may not sum due to rounding.
(1) RoTCE represents annualized net income available to common shareholders as a percentage of average TCE.
(2) Asia GCB includes the results of operations of GCB activities in certain EMEA countries for all periods presented.
($MM, except balance sheet items in $B)


