1 Second-Quarter 2021 Investor Call Corning Reports Outstanding Second-Quarter 2021 Results, Expects Continued Growth in Third Quarter Second-quarter core sales of $3.5B grew 35% from Q2 2020 and 17% from Q2 2019 Core EPS grew 112% year over year to $0.53 on higher sales and expanded margins Free cash flow of $471M grew $186M, or 65%, year over year July 27, 2021
Forward-Looking and Cautionary StatementsThe statements in this presentation that are not historical facts or information and contain words such as “will,” “believe,” “anticipate,” “expect,” “intend,” “plan,” “seek,” “see,” “would,” and “target” and similar expressions are forward-looking statements. These forward-looking statements are made pursuant to the safe harbor provisions of the Private Securities Litigation Reform Act of 1995 and include estimates and assumptions related to economic, competitive and legislative developments. Such statements relate to future events that by their nature address matters that are, to different degrees, uncertain. These forward-looking statements relate to, among other things, the Company’s future operating performance, the Company's share of new and existing markets, the Company's revenue and earnings growth rates, the Company’s ability to innovate and commercialize new products, and the Company’s implementation of cost-reduction initiatives and measures to improve pricing, including the optimization of the Company’s manufacturing capacity. These statements are subject to change and uncertainty which are, in many instances, beyond our control. There can be no assurance that future developments will be in accordance with management’s expectations. Actual results could differ materially from those expected by us, depending on the outcome of various factors. We do not undertake to update forward-looking statements.
Although the Company believes that these forward-looking statements are based upon reasonable assumptions regarding, among other things, current estimates and forecasts, general economic conditions, its knowledge of its business, and key performance indicators that impact the Company, actual results could differ materially. The Company does not undertake to update forward-looking statements. Some of the risks, uncertainties and other factors that could cause actual results to differ materially from those expressed in or implied by the forward-looking statements include, but are not limited to: the duration and severity of the COVID-19 pandemic, and its impact across our businesses on demand, operations and our global supply chains; the effects of acquisitions, dispositions and other similar transactions; global business, financial, economic and political conditions; tariffs and import duties; currency fluctuations between the U.S. dollar and other currencies, primarily the Japanese yen, new Taiwan dollar, euro, Chinese yuan and South Korean won; product demand and industry capacity; competitive products and pricing; availability and costs of critical components and materials; new product development and commercialization; order activity and demand from major customers; the amount and timing of our cash flows and earnings and other conditions, which may affect our ability to pay our quarterly dividend at the planned level or to repurchase shares at planned levels; possible disruption in commercial activities due to terrorist activity, cyber-attack, armed conflict, political or financial instability, natural disasters, or major health concerns; loss of intellectual property due to theft, cyber-attack, or disruption to our information technology infrastructure; unanticipated disruption to equipment, facilities, IT systems or operations; effect of regulatory and legal developments; ability to pace capital spending to anticipated levels of customer demand; rate of technology change; ability to enforce patents and protect intellectual property and trade secrets; adverse litigation; product and components performance issues; retention of key personnel; customer ability, to maintain profitable operations and obtain financing to fund ongoing operations and manufacturing expansions and pay receivables when due; loss of significant customers; changes in tax laws and regulations; the impacts of audits by taxing authorities; the potential impact of legislation, government regulations, and other government action and investigations; and other risks detailed in Corning’s SEC filings.
For a complete listing of risks and other factors, please reference the risk factors and forward-looking statements described in our annual reports on Form 10-K and quarterly reports on Form 10-Q.
Corning has included non-GAAP financial measures in this presentation to supplement Corning’s consolidated financial statements presented on a GAAP basis. In managing the Company and assessing our financial performance, we adjust certain measures provided by our consolidated financial statements to exclude specific items to arrive at core performance measures.
In managing the Company and assessing our financial performance, certain measures provided by our consolidated financial statements are adjusted to exclude specific items to report core performance measures. These items include gains and losses on our translated earnings contracts, acquisition-related costs, certain discrete tax items and other tax-related adjustments, restructuring, impairment losses, and other charges and credits, certain litigation-related expenses, pension mark-to-market adjustments and other items which do not reflect on-going operating results of the Company or our equity affiliates. Corning utilizes constant-currency reporting for our Display Technologies, Environmental Technologies, Specialty Materials and Life Sciences segments for the Japanese yen, South Korean won, Chinese yuan, new Taiwan dollar and the euro. The Company believes that the use of constant-currency reporting allows investors to understand our results without the volatility of currency fluctuations and reflects the underlying economics of the translated earnings contracts used to mitigate the impact of changes in currency exchange rates on earnings and cash flows. Corning also believes that reporting core performance measures provides investors greater transparency to the information used by the management team to make financial and operational decisions.
Core performance measures are not prepared in accordance with Generally Accepted Accounting Principles in the United States (“GAAP”). We believe investors should consider these non-GAAP measures in evaluating results as they are more indicative of our core operating performance and how management evaluates operational results and trends. These measures are not, and should not be viewed as a substitute for GAAP reporting measures. With respect to the Company’s outlook for future periods, it is not possible to provide reconciliations for these non-GAAP measures because the Company does not forecast the movement of foreign currencies against the U.S. dollar, or other items that do not reflect ongoing operations, nor does it forecast items that have not yet occurred or are out of the Company’s control. As a result, the Company is unable to provide outlook information on a GAAP basis.
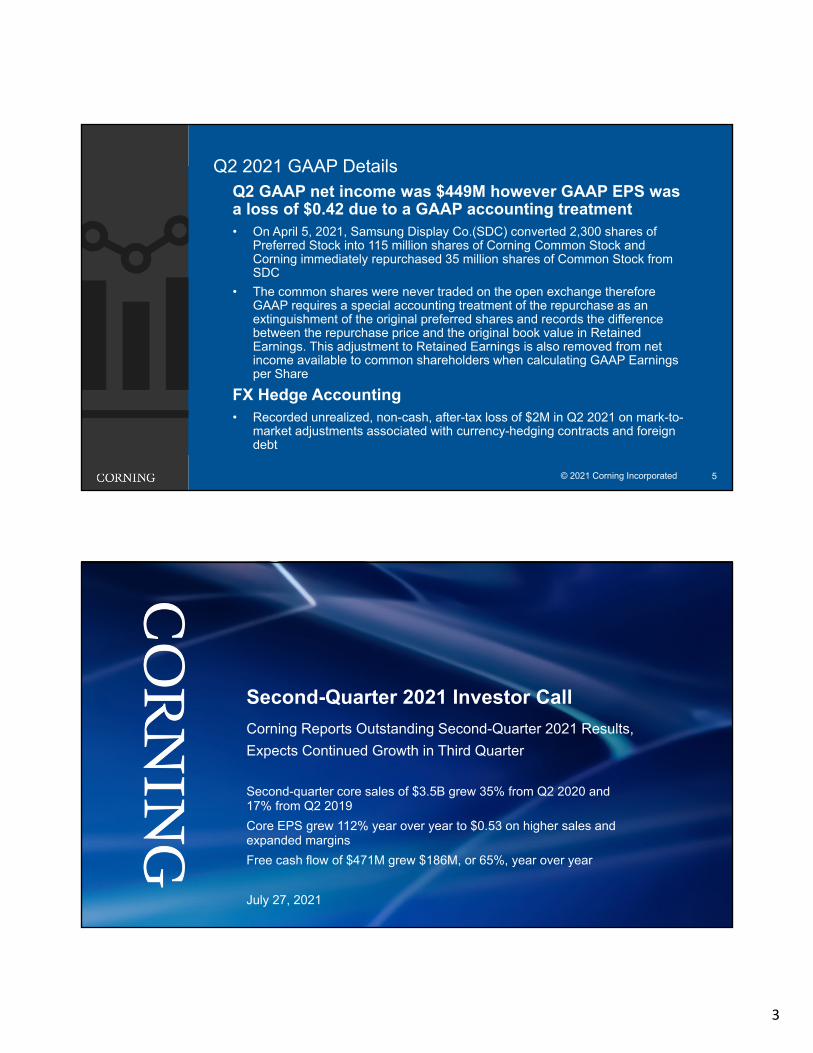
Q2 GAAP net income was $449M however GAAP EPS was a loss of $0.42 due to a GAAP accounting treatment• On April 5, 2021, Samsung Display Co.(SDC) converted 2,300 shares of
Preferred Stock into 115 million shares of Corning Common Stock and Corning immediately repurchased 35 million shares of Common Stock from SDC
• The common shares were never traded on the open exchange therefore GAAP requires a special accounting treatment of the repurchase as an extinguishment of the original preferred shares and records the difference between the repurchase price and the original book value in Retained Earnings. This adjustment to Retained Earnings is also removed from net income available to common shareholders when calculating GAAP Earnings per Share
FX Hedge Accounting• Recorded unrealized, non-cash, after-tax loss of $2M in Q2 2021 on mark-to-
market adjustments associated with currency-hedging contracts and foreign debt
“Corning had an outstanding second quarter. We are growing faster than our underlying markets and achieved a revenue milestone of $3.5 billion, establishing a strong sales run rate.
We are performing well as we continue to build a stronger, more agile company that’s consistently delivering meaningful and important contributions, Corning’s deep commitment to life-changing innovation and our people’s unwavering dedication continue to drive us forward.”
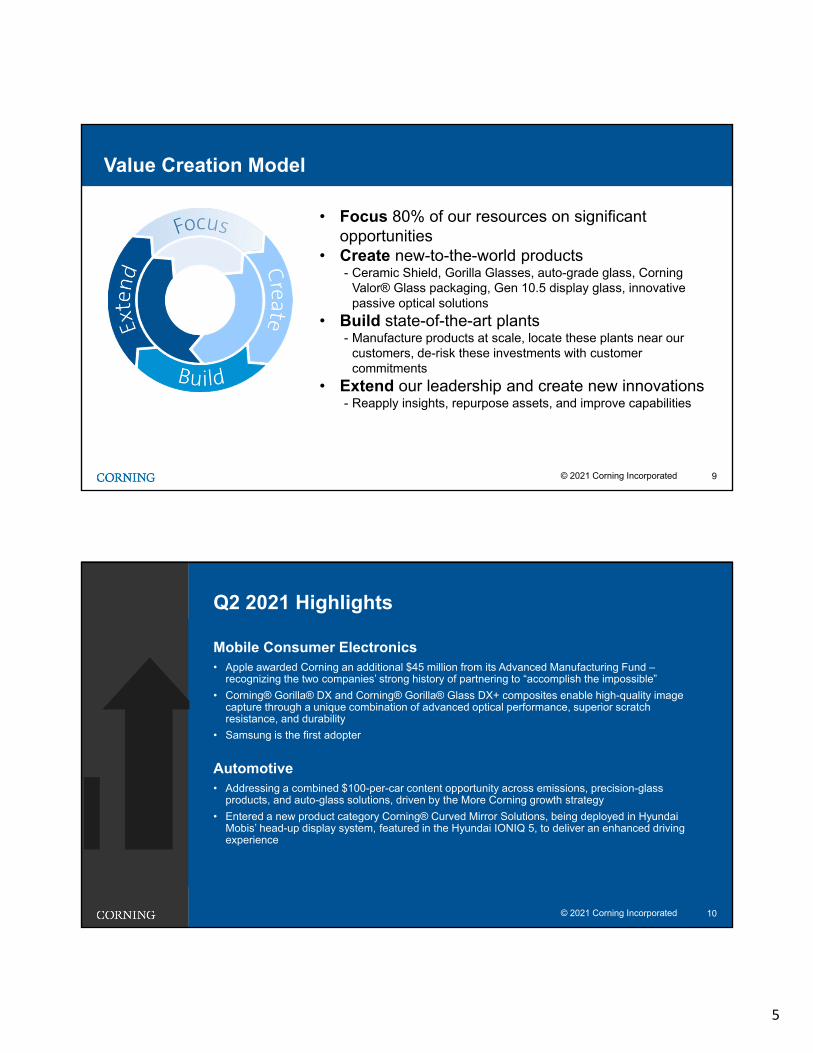
Automotive• Addressing a combined $100-per-car content opportunity across emissions, precision-glass
products, and auto-glass solutions, driven by the More Corning growth strategy
• Entered a new product category Corning® Curved Mirror Solutions, being deployed in Hyundai Mobis’ head-up display system, featured in the Hyundai IONIQ 5, to deliver an enhanced driving experience
Mobile Consumer Electronics• Apple awarded Corning an additional $45 million from its Advanced Manufacturing Fund –
recognizing the two companies’ strong history of partnering to “accomplish the impossible”
• Corning® Gorilla® DX and Corning® Gorilla® Glass DX+ composites enable high-quality image capture through a unique combination of advanced optical performance, superior scratch resistance, and durability
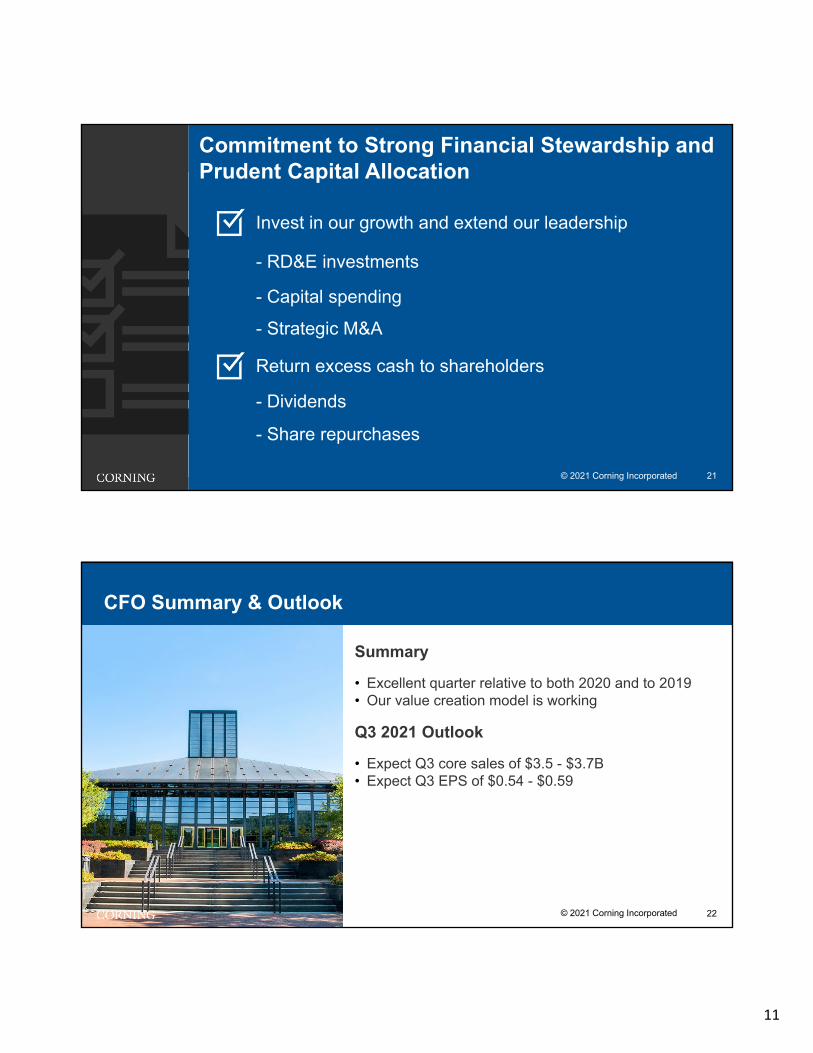
Display• Experienced the most favorable pricing environments in more than a decade, and during the
quarter announced its second moderate increase to display glass substrate prices this year
• Hosted an official grand opening of its Gen 10.5 facility in Wuhan, co-located with a BOE Technology Group Co., Ltd. plant
• The Wuhan plant further positions the company to capture demand for large-size TVs
Life Sciences• Strength across underlying lab research, bioprocessing, and diagnostics markets
• Cell- and gene-based therapies and advances in research are creating opportunities for Corning to capture more value with its innovations; Successfully building Valor® Glass franchise
• Collaborated with Thermo Fisher Scientific and OPTIMA Pharma to demonstrate how Valor Glass contributes to a 67% increase in vaccine packaging filling speed
Optical• Returned to growth as 5G, fiber-to-the-home, and cloud computing drive greater demand for
Corning’s content
• Outperforming the market and addressing customer challenges
• Introduced Corning SMF-28® Contour fiber, which offers an industry-first combination of superior bendability, compatibility with other fibers, and low signal loss
• Launched EDGETM Rapid Connect solutions that increase fiber density and reduce customer installation time by up to 70%
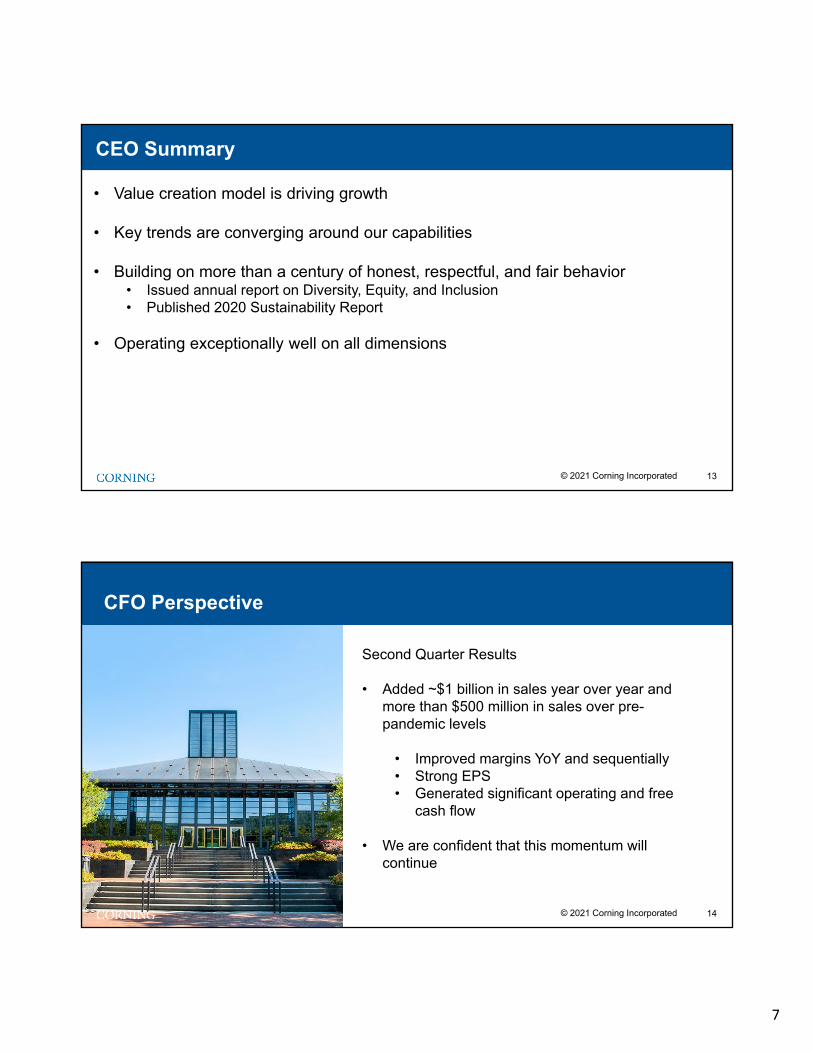
• Key trends are converging around our capabilities
• Building on more than a century of honest, respectful, and fair behavior• Issued annual report on Diversity, Equity, and Inclusion• Published 2020 Sustainability Report
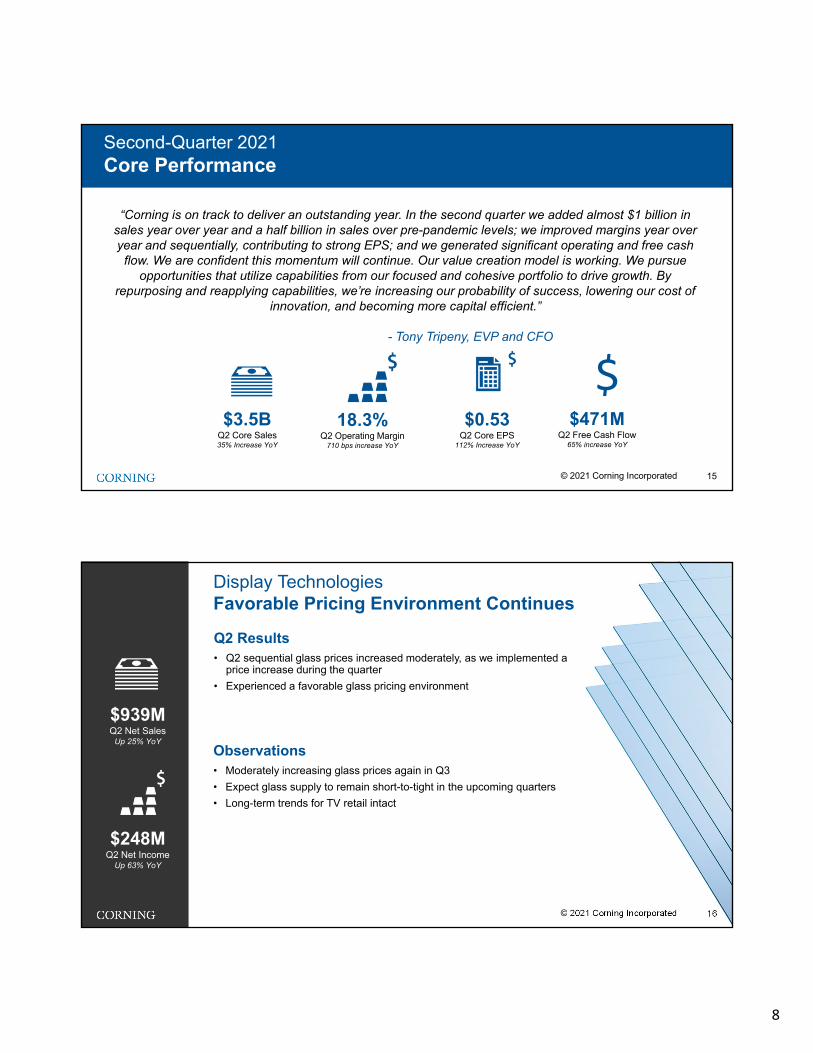
“Corning is on track to deliver an outstanding year. In the second quarter we added almost $1 billion in sales year over year and a half billion in sales over pre-pandemic levels; we improved margins year over year and sequentially, contributing to strong EPS; and we generated significant operating and free cash
flow. We are confident this momentum will continue. Our value creation model is working. We pursue opportunities that utilize capabilities from our focused and cohesive portfolio to drive growth. By
repurposing and reapplying capabilities, we’re increasing our probability of success, lowering our cost of innovation, and becoming more capital efficient.”
Q2 Results• Continued growth as sales surpassed $1B driven by growth in both
enterprise and carrier networks; 5G, fiber-to-the-home, and cloud computing continue to drive growth
• Profitability improvement driven by higher volume and better operational performance
Observations• Pace of data center builds is accelerating, and capital spending by
our customers is increasing
• Governments around the world are announcing and initiating plans to extend the reach of broadband
• Market leader and only large-scale end-to-end manufacturer of optical solutions
• Our broad customer base and unquestioned technology leadership put us squarely at the center of customer investments for fiber-to-the-home, rural broadband, 5G, and hyperscale data centers
Q2 Results• Q2 sales were $407M, up 80% year over year as vehicle
production improved from pre-pandemic lows and GPF adoption continued in Europe and China
• Auto markets continue to be constrained by chip shortages, impacting our automotive sales sequentially in Q2
• Diesel sales grew 101% year-over-year, driven by continued customer adoption of advanced aftertreatment in China and continued strength in the North American heavy-duty truck market
Observations• Ahead of our original timeframe to build a $500M GPF
business
• We are monitoring end market demand and supply chain as we move through the second half of the year
$407MQ2 Net SalesUp 80% YoY
$81MQ2 Net Income
Environmental TechnologiesAnother Quarter of YoY Growth
Q2 Results• Sales growth was driven by strong demand for premium cover
materials, strength in the IT market, and greater optical content in semiconductor manufacturing
• During the quarter, our premium glasses and surfaces supported new phone and IT launches – including 16 smartphones and 6 laptops and tablets featuring Gorilla Glass
• Net income declined sequentially and year over year, newer innovations can face high costs as we develop and scale our manufacturing process
Observations• We are well-positioned for growth in the smartphone, IT and
semiconductor markets
• Demand remains strong for our premium cover materials, IT products, and Advanced Optics content
Q2 Results• Q2 sales were $312M, up 28% year over year
• Sales growth was driven by ongoing recovery in academic and pharmaceutical research labs and continued strong demand for bioproduction vessels and diagnostic-related consumables
• Net income improvements driven by higher sales and solid operating performance
$312MQ2 Net SalesUp 28% YoY
$52MQ2 Net IncomeUp 68% YoY
Life SciencesContinued Strong Demand for Bioproduction Products
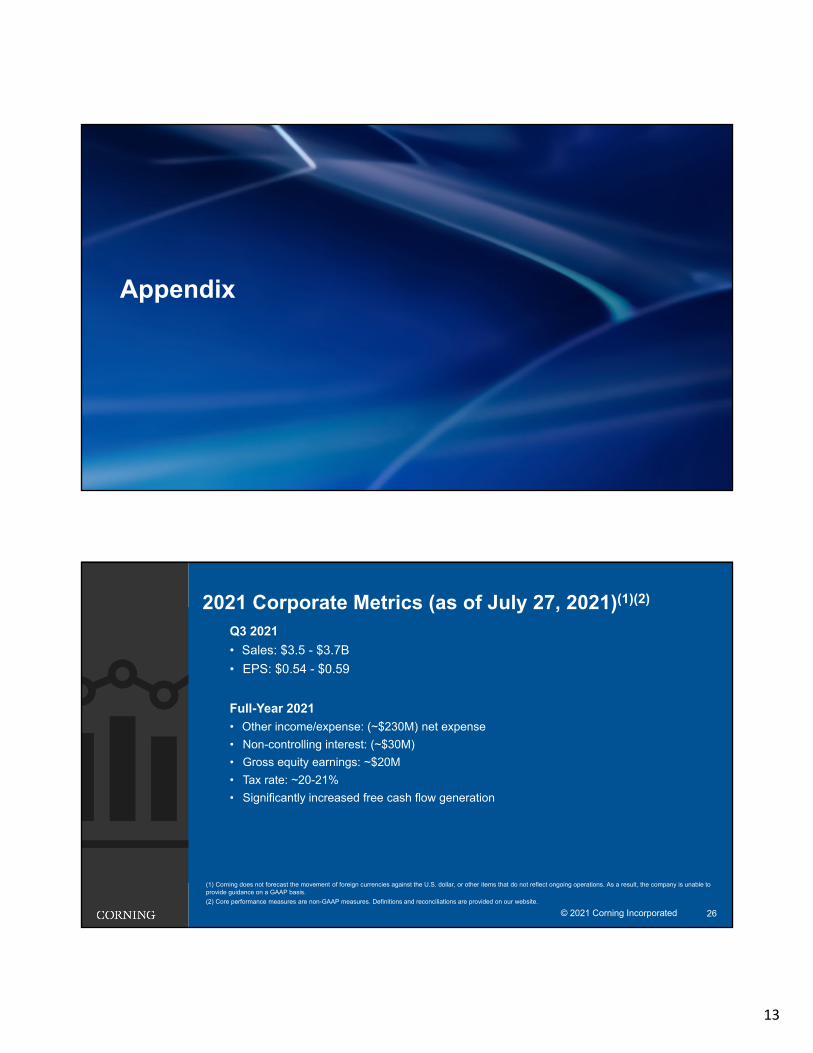
(1) Corning does not forecast the movement of foreign currencies against the U.S. dollar, or other items that do not reflect ongoing operations. As a result, the company is unable to provide guidance on a GAAP basis.
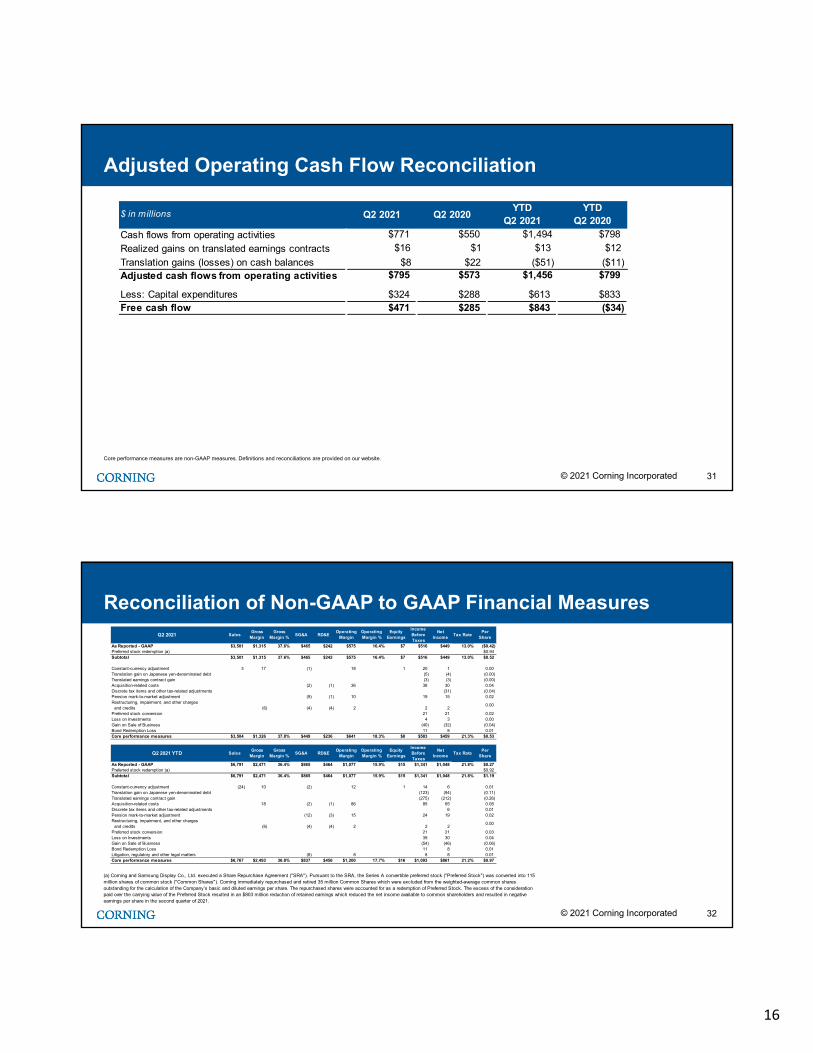
(2) Core performance measures are non-GAAP measures. Definitions and reconciliations are provided on our website.
Reconciliation of Non-GAAP to GAAP Financial Measures
(a) Corning and Samsung Display Co., Ltd. executed a Share Repurchase Agreement ("SRA"). Pursuant to the SRA, the Series A convertible preferred stock ("Preferred Stock") was converted into 115 million shares of common stock ("Common Shares"). Corning immediately repurchased and retired 35 million Common Shares which were excluded from the weighted-average common shares outstanding for the calculation of the Company’s basic and diluted earnings per share. The repurchased shares were accounted for as a redemption of Preferred Stock. The excess of the consideration paid over the carrying value of the Preferred Stock resulted in an $803 million reduction of retained earnings which reduced the net income available to common shareholders and resulted in negative earnings per share in the second quarter of 2021.
Constant-currency adjustment 3 17 (1) 18 1 20 1 0.00 Translation gain on Japanese yen-denominated debt (5) (4) (0.00)Translated earnings contract gain (3) (3) (0.00)Acquisition-related costs (2) (1) 36 38 30 0.04 Discrete tax items and other tax-related adjustments (31) (0.04)Pension mark-to-market adjustment (9) (1) 10 19 15 0.02 Restructuring, impairment, and other charges and credits (6) (4) (4) 2 2 2
0.00
Preferred stock conversion 21 21 0.02 Loss on Investments 4 3 0.00 Gain on Sale of Business (40) (32) (0.04)Bond Redemption Loss 11 8 0.01 Core performance measures $3,504 $1,326 37.8% $449 $236 $641 18.3% $8 $583 $459 21.3% $0.53
Net sales $ 3,501 $ 2,561 $ 6,791 $ 4,952 Cost of sales 2,186 1,805 4,320 3,635
Gross margin 1,315 756 2,471 1,317
Operating expenses: Selling, general and administrative expenses 465 401 865 796 Research, development and engineering expenses 242 430 464 691 Amortization of purchased intangibles 33 28 65 54
Operating income (loss) 575 (103) 1,077 (224)
Equity in earnings of affiliated companies 7 79 15 93 Interest income 2 3 5 9 Interest expense (78) (67) (155) (131) Translated earnings contract gain, net 3 37 275 105 Other income (expense), net 7 2 124 (9)
Income (loss) before income taxes 516 (49) 1,341 (157) Provision for income taxes (67) (22) (293) (10)
Net income (loss) 449 (71) 1,048 (167)
Net loss attributable to non-controlling interests - - - -
Net income (loss) attributable to Corning Incorporated $ 449 $ (71) $ 1,048 $ (167)
(Loss) earnings per common share available to common stockholders: Basic $ (0.42) $ (0.13) $ 0.27 $ (0.28)
Diluted $ (0.42) $ (0.13) $ 0.27 $ (0.28)
Reconciliation of net income (loss) attributable to Corning Incorporated versus net (loss) income available to common stockholders:
Net income (loss) attributable to Corning Incorporated $ 449 $ (71) $ 1,048 $ (167)
Series A convertible preferred stock dividend (25) (24) (49) Excess consideration paid for redemption of preferred shares (803) (803)
Net (loss) income available to common stockholders $ (354) $ (96) $ 221 $ (216)
June 30, June 30,2021 2020 2021 2020
CORNING INCORPORATED AND SUBSIDIARY COMPANIESCONSOLIDATED STATEMENTS OF INCOME (LOSS)
(Unaudited; in millions, except per share amounts)
Constant-currency adjustment 3 17 (1) 18 1 20 1 0.00 Translation gain on Japanese yen-denominated debt (5) (4) (0.00)Translated earnings contract gain (3) (3) (0.00)Acquisition-related costs (2) (1) 36 38 30 0.04 Discrete tax items and other tax-related adjustments (31) (0.04)Pension mark-to-market adjustment (9) (1) 10 19 15 0.02 Restructuring, impairment, and other charges and credits (6) (4) (4) 2 2 2
0.00
Preferred stock conversion 21 21 0.02 Loss on Investments 4 3 0.00 Gain on Sale of Business (40) (32) (0.04)Bond Redemption Loss 11 8 0.01 Core performance measures $3,504 $1,326 37.8% $449 $236 $641 18.3% $8 $583 $459 21.3% $0.53
(a) Corning and Samsung Display Co., Ltd. executed a Share Repurchase Agreement ("SRA"). Pursuant to the SRA, the Series A convertible preferred stock ("Preferred Stock") was converted into 115 million shares of common stock ("Common Shares"). Corning immediately repurchased and retired 35 million Common Shares which were excluded from the weighted-average common shares outstanding for the calculation of the Company’s basic and diluted earnings per share. The repurchased shares were accounted for as a redemption of Preferred Stock. The excess of the consideration paid over the carrying value of the Preferred Stock resulted in an $803 million reduction of retained earnings which reduced the net income available to common shareholders and resulted in negative earnings per share in the second quarter of 2021.
Current assets: Cash and cash equivalents $ 2,320 $ 2,672 Trade accounts receivable, net of doubtful accounts 2,057 2,133 Inventories, net 2,387 2,438 Other current assets 884 761
Total current assets 7,648 8,004
Property, plant and equipment, net of accumulated depreciation 15,455 15,742 Goodwill, net 2,433 2,460 Other intangible assets, net 1,228 1,308 Deferred income taxes 1,051 1,121 Other assets 1,991 2,140
Total Assets $ 29,806 $ 30,775
Liabilities and Equity
Current liabilities: Current portion of long-term debt and short-term borrowings $ 353 $ 156 Accounts payable 1,312 1,174 Other accrued liabilities 2,959 2,437
Total current liabilities 4,624 3,767
Long-term debt 7,025 7,816 Postretirement benefits other than pensions 723 727 Other liabilities 5,292 5,017
Total liabilities 17,664 17,327
Commitments and contingencies Shareholders’ equity:
Convertible preferred stock, Series A – Par value $100 per share; Shares authorized 0 and 3,100; Shares issued: 0 and 2,300 2,300 Common stock – Par value $0.50 per share; Shares authorized 3.8 billion; Shares issued: 1.8 billion and 1.7 billion 907 863 Additional paid-in capital – common stock 16,352 14,642 Retained earnings 15,739 16,120 Treasury stock, at cost; Shares held: 962 million and 961 million (19,986) (19,928) Accumulated other comprehensive loss (1,052) (740)