34
Second quarter 2021 results Analyst call Dirk Tirez, CEO Leen Geirnaerdt, CFO 6 August 2021

Second quarter 2021 resultsAnalyst call
Dirk Tirez, CEO Leen Geirnaerdt, CFO
6 August 2021

Investor presentationInterim financial report 2Q21
DisclaimerThis presentation is based on information published by bpost group in its Second Quarter 2021 Interim Financial Report,
made available on August 5th, 2021 at 5.45pm CET on corporate.bpost.be/investors. This information forms regulated
information as defined in the Royal Decree of November 14th, 2007. The information in this document may include
forward-looking statements1, which are based on current expectations and projections of management about future
events. By their nature, forward-looking statements are not guarantees of future performance and involve known and
unknown risks, uncertainties, assumptions and other factors because they relate to events and depend on circumstances
that will occur in the future whether or not outside the control of the Company. Such factors may cause actual results,
performance or developments to differ materially from those expressed or implied by such forward-looking statements.
Accordingly, no assurance is given that such forward-looking statements will prove to have been correct. They speak
only as at the date of the Presentation and the Company undertakes no obligation to update these forward-looking
statements contained herein to reflect actual results, changes in assumptions or changes in factors affecting these
statements. This material is not intended as and does not constitute an offer to sell any securities or a solicitation of any
offer to purchase any securities.
2Q21 Analyst Presentation 2
2Q21
1 as defined among others under the U.S. Private Securities Litigation Reform Act of 1995
Financial Calendar
09.11.2021 (17:45 CET)Quarterly results 3Q21
More on corporate.bpost.be/investors

Highlights of 2Q21
3
Mail & Retail
€ 71.7m14.1% EBIT margin
• Total operating income at
€ 508.1m (+8.5%) driven by
o volume rebound supported
by one-off COVID-19
communication
o positive mail price impact
o VAS and Retail profiting
from soft comps of last year
• Underlying mail volume
growth at +1.4%
• Adjusted EBIT up € +35.7m,
doubling YoY
Parcels & Logistics
Eurasia
€ 34.7m12.2% EBIT margin
• Total operating income at
€ 283,4m (-3.9%) against high
comparable base in 2Q20
o volume growth of +2.9% in
Parcels B2X1 from sustained
online sales,
o negative P/M of -6.9% of which
price impact of -2.8% from
COVID-19 surcharges to
customers in April and May-20
• Adjusted EBIT up € +2.3m, with
margin improvement supported
by benefits of operating leverage
in the integrated network
Parcels & Logistics
N. Am.
€ 10.8m 3.5% EBIT margin
• Total operating income at
€ 309.8m (-12.5%, or -4,6% at
constant exchange rate),
reflecting Radial’s non-
recurring extra volumes of last
year’s pandemic lockdown
• Adjusted EBIT down € -6.8m to
€ 10.8m driven by lower
operating income at Radial
and wage pressure in the U.S.
Group operating
income
€ 1,037.9m
Group adjusted
EBIT
€ 106.6m 10.3% EBIT margin
up € +31.6m compared
to prior year
2Q21 Analyst Presentation
2Q21
Compared to 2Q20 COVID lockdown, bpost delivers a strong quarter driven by mail revenues and sustained e-commerce in EuropeAs anticipated, accelerating contribution of new customers at Radial NA did not yet compensate non-recurring COVID lockdown growth of 2Q20
Updated
2021
guidance
raised,
group
adjusted
EBIT
expected to
be above
€ 340m
1 Parcels B2X sales and volumes do not include EuroSprinters and Dynagroup

Strong 2Q21 EBIT, driven by mail evolution and sustained activities at PaLo Eurasia in post-COVID environment
4
€ million
2Q21 Analyst Presentation
2Q21
1 Adjusted excludes items that are non-recurring in nature and significant (> € 20m). All profits or losses on disposal of activities are adjusted whatever the amount they represent, as well as the amortization and
impairment on the intangible assets recognized throughout the Purchase Price Allocation (PPA) of the acquisitions. Reversals of provisions whose addition had been excluded from income are also adjusted whatever
the amount they represent.
Adjusted1
Reported
106.6
70.2
EBIT
2Q20
Mail &
Retail
2.3
PaLo
Eurasia
-6.8
PaLo
N. America
0.4
Corporate
103.4
EBIT
2Q21
74.9
4.7
35.7
3.2
+31.6

€ million
2Q20 2Q21 2Q20 2Q21 % ↑
Total operating income 1,052.7 1,037.9 1,052.7 1,037.9 -1.4%
Operating expenses 917.0 866.5 917.0 866.5 -5.5%
EBITDA 135.7 171.4 135.7 171.4 26.2%Depreciation & Amortization 65.5 68.0 60.8 64.8 6.6%
EBIT 70.2 103.4 74.9 106.6 42.2%Margin (%) 6.7% 10.0% 7.1% 10.3%
Financial result -14.0 -4.1 -14.0 -4.1 -70.8%
Profit before tax 59.5 99.3 64.2 102.5 59.7%Income tax expense 15.9 26.9 16.1 27.6 71.1%
Net profit 43.6 72.4 48.0 74.9 55.9%
FCF 113.2 -60.9 44.1 -60.7 -
Net Debt at June 30 539.5 489.4 539.5 489.4 -9.3%
Capex 24.9 28.5 24.9 28.5 14.4%Average # FTEs and interims 37,853 38,221 37,853 38,221 1.0%
Reported Adjusted1
Key financials 2Q21
5 2Q21 Analyst Presentation
2Q21
1 1
1 Unaudited figures
1
2
Amortization and impairments
of intangibles recognized
during PPA are adjusted,
leading to increase in
EBIT (€ +3.2m) and income tax
expense (€ +0.8m)
2 2
Adjusted FCF excludes the cash
Radial receives on behalf of its
customers for performing billing
services1 1

Top-line driven by mail volume rebound and price increase, while retail and VAS also profited from soft comps of LY’s lockdown
6
2Q21 – M&R
M&R external operating income, € million
1
2
3
4
5
2Q21 Analyst Presentation
2Q20 407.5
Transactional
Advertising
Value added
services5.3
Proximity and
convenience
retail network
7.3
Press
448.9
-0.3
18.3
10.8
2Q21
+41.4
Domestic Mail
Operating income up € 28.8m:
• € +1.8m working days impact,
• € +3.3m volume (+1.4%
underlying volume growth
against -17.7% in 2Q20)
• € +23.7m from price and mix
impact
In Transactional Mail:
• Admin mail supported by
COVID-19 communication in
2Q21 (est. about € 8m)
• No change in known structural
trends of continued
e-substitution
Proximity and
convenience retail
network
Increase in Ubiway retail revenues
against lower revenues from
reduced footfall in 2Q20
Decline in banking & finance
revenues due to the low interest
rate environment
Value added services
Higher revenues from fines solution
and European licence plates
3
4
521
Domestic Mail units 2Q21:
• in line with 1Q21 volumes
• volume rebound from last year’s
2Q20 lockdown
• decline against 2Q19 from
structural mail volume trend
2Q19 excluding elections units
Domestic Mail units
in perspective

Doubled EBIT fueled by mail revenues and sustained parcel volumes handled in the mail network
7
2Q21 – M&R
2Q21 Analyst Presentation
Key takeaways 2Q21
• Total operating income up € +39.9m (+8.5%)
• Operating expenses (incl. adjusted D&A) increased by € -4.3m (+1.0%):
‐ (1) Higher payroll & interim costs driven by headcount and merit
increases, (2) higher material costs at Ubiway and 3rd party
remuneration from higher VAS and Proximity revenues, together
with (3) lower recoverable VAT.
‐ Partially compensated by non-repeating COVID-19 specific opex in
2Q20 (incl. premium, health and safety measures, bad debt risk),
positive evolution of the FTE wage mix, and increased parcel sorting
activities cross-charged to PaLo Eurasia.
• M&R adjusted EBIT nearly doubled (€ +35.7m) to € 71.7m, with a
margin of 14.1% in line with 1Q21 (13.9%)
2Q20 2Q21 % ↑
407.5 448.9 10.2%
170.7 188.9 10.7%
37.5 48.3 28.9%
85.8 85.4 -0.4%
89.7 97.0 8.1%
23.9 29.2 22.3%
60.7 59.2 -2.4%
468.1 508.1 8.5%411.2 414.2 0.7%
56.9 93.9 65.0%21.5 22.6 5.4%
35.4 71.3 101.1%7.6% 14.0%
36.0 71.7 99.0%7.7% 14.1%
-17.7% 1.4%
-16.7% -1.3%
-26.6% 15.6%
-8.0% -1.1%
€ million
Underlying Mail volume decline
Press
Advertising
Value added services
Intersegment operating income
Operating expenses
EBITDA
Reported EBIT
Transactional
Additional KPIs
Mail & Retail
Depreciation & Amortization
Margin (%)
Adjusted EBIT
Margin (%)
Total operating income
External operating income
Transactional
Advertising
Press
Proximity and convenience retail network
8
2Q21 – PaLo Eurasia
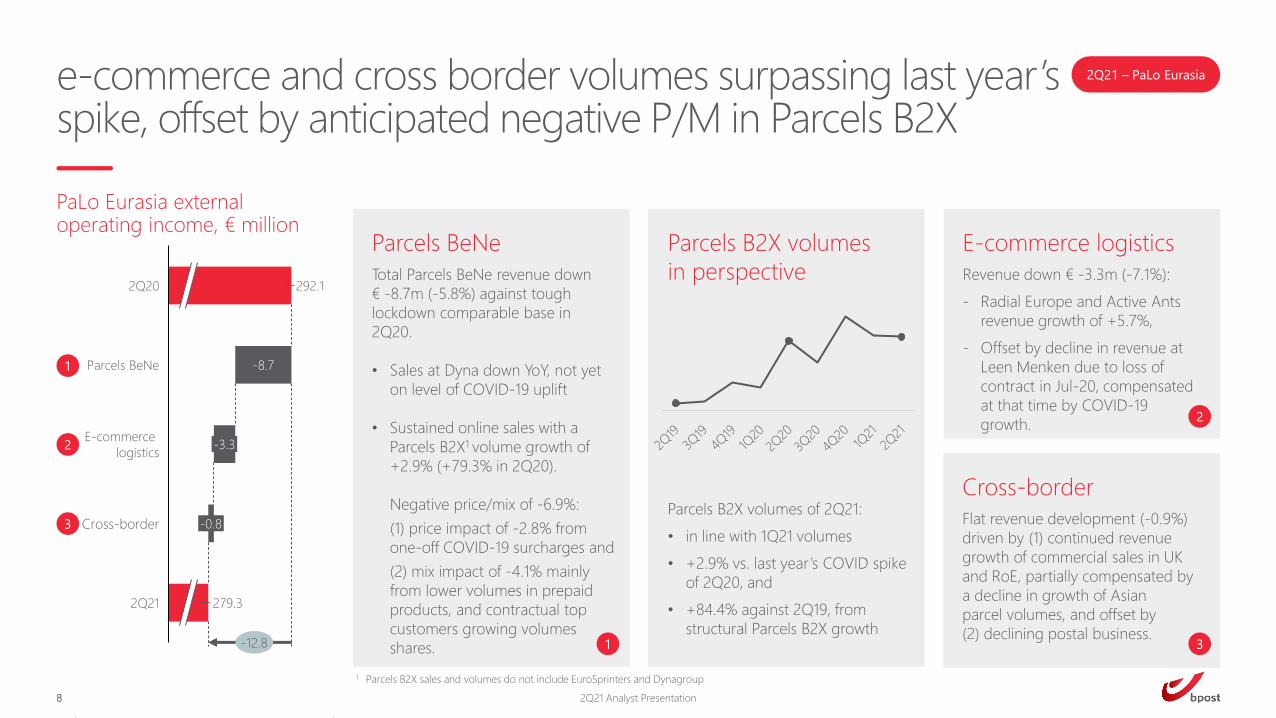
Parcels BeNe
Total Parcels BeNe revenue down
€ -8.7m (-5.8%) against tough
lockdown comparable base in
2Q20.
• Sales at Dyna down YoY, not yet
on level of COVID-19 uplift
• Sustained online sales with a
Parcels B2X1 volume growth of
+2.9% (+79.3% in 2Q20).
Negative price/mix of -6.9%:
(1) price impact of -2.8% from
one-off COVID-19 surcharges and
(2) mix impact of -4.1% mainly
from lower volumes in prepaid
products, and contractual top
customers growing volumes
shares.
PaLo Eurasia externaloperating income, € million
1
2
3
1
279.3
-8.7
292.12Q20
Parcels BeNe
-3.3E-commerce
logistics
-0.8Cross-border
2Q21
-12.8
e-commerce and cross border volumes surpassing last year’s spike, offset by anticipated negative P/M in Parcels B2X
E-commerce logistics
Revenue down € -3.3m (-7.1%):
‐ Radial Europe and Active Ants
revenue growth of +5.7%,
‐ Offset by decline in revenue at
Leen Menken due to loss of
contract in Jul-20, compensated
at that time by COVID-19
growth.
Cross-border
Flat revenue development (-0.9%)
driven by (1) continued revenue
growth of commercial sales in UK
and RoE, partially compensated by
a decline in growth of Asian
parcel volumes, and offset by
(2) declining postal business.
2
3
1 Parcels B2X sales and volumes do not include EuroSprinters and Dynagroup
2Q21 Analyst Presentation
Parcels B2X volumes
in perspective
Parcels B2X volumes of 2Q21:
• in line with 1Q21 volumes
• +2.9% vs. last year’s COVID spike
of 2Q20, and
• +84.4% against 2Q19, from
structural Parcels B2X growth
EBIT margin supported by benefits of operating leverage in the integrated network
9
2Q21 – PaLo Eurasia
2Q21 Analyst Presentation
1 2Q20 restated to reflect Parcels B2X volume growth
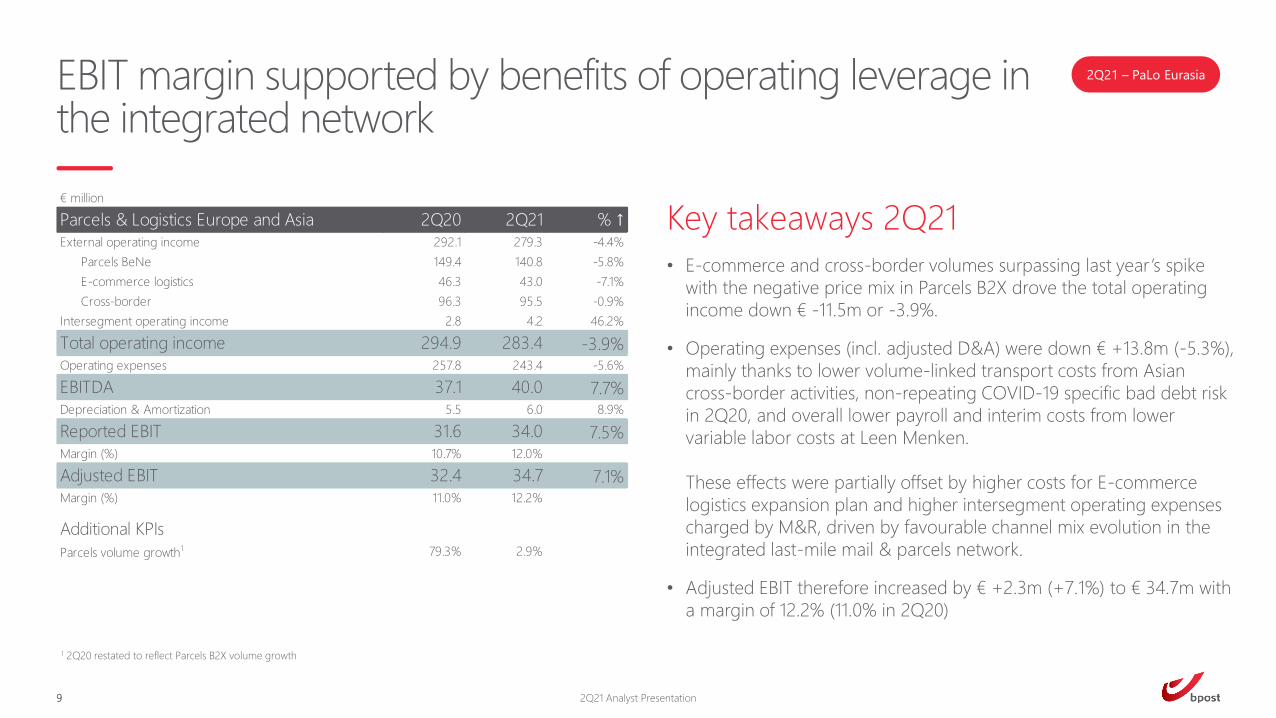
2Q20 2Q21 % ↑
292.1 279.3 -4.4%
149.4 140.8 -5.8%
46.3 43.0 -7.1%
96.3 95.5 -0.9%
2.8 4.2 46.2%
294.9 283.4 -3.9%257.8 243.4 -5.6%
37.1 40.0 7.7%5.5 6.0 8.9%
31.6 34.0 7.5%10.7% 12.0%
32.4 34.7 7.1%11.0% 12.2%
79.3% 2.9%
Parcels & Logistics Europe and Asia
Total operating income
Operating expenses
External operating income
Intersegment operating income
Parcels BeNe
E-commerce logistics
Cross-border
EBITDA
Depreciation & Amortization
Additional KPIs
Parcels volume growth1
€ million
Reported EBIT
Margin (%)
Adjusted EBIT
Margin (%)
Key takeaways 2Q21
• E-commerce and cross-border volumes surpassing last year’s spike
with the negative price mix in Parcels B2X drove the total operating
income down € -11.5m or -3.9%.
• Operating expenses (incl. adjusted D&A) were down € +13.8m (-5.3%),
mainly thanks to lower volume-linked transport costs from Asian
cross-border activities, non-repeating COVID-19 specific bad debt risk
in 2Q20, and overall lower payroll and interim costs from lower
variable labor costs at Leen Menken.
These effects were partially offset by higher costs for E-commerce
logistics expansion plan and higher intersegment operating expenses
charged by M&R, driven by favourable channel mix evolution in the
integrated last-mile mail & parcels network.
• Adjusted EBIT therefore increased by € +2.3m (+7.1%) to € 34.7m with
a margin of 12.2% (11.0% in 2Q20)
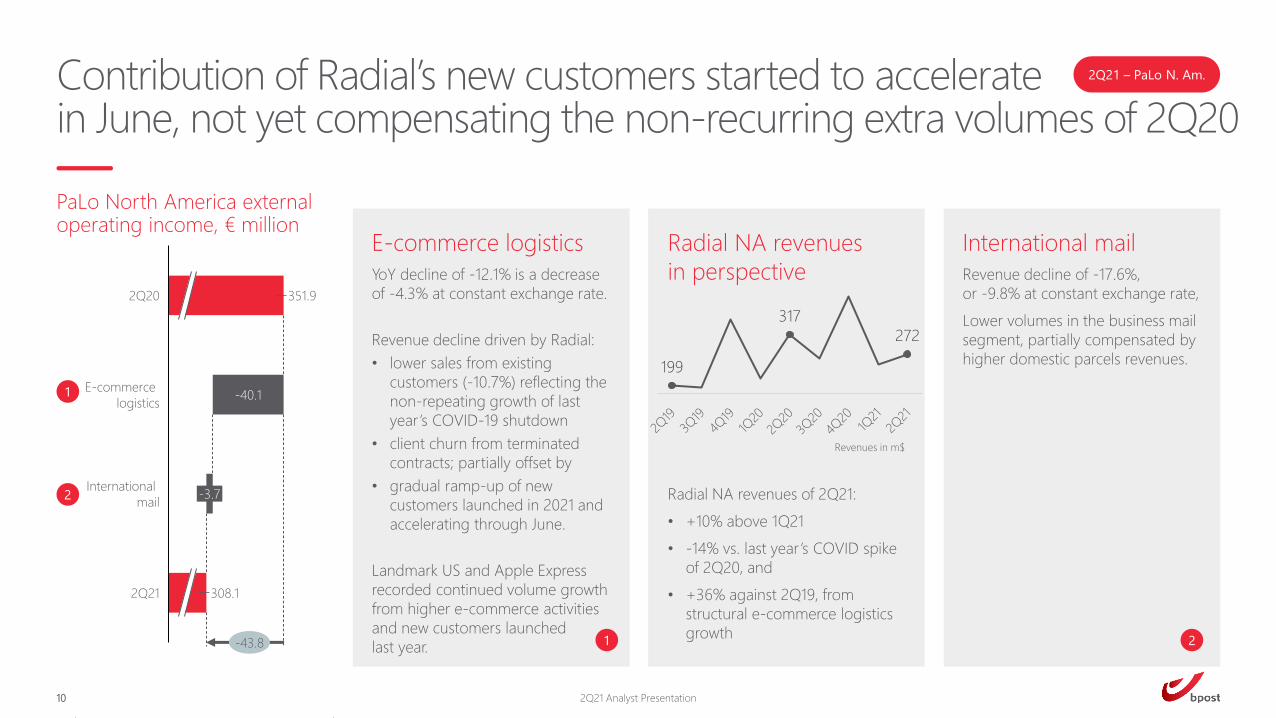
Contribution of Radial’s new customers started to accelerate in June, not yet compensating the non-recurring extra volumes of 2Q20
10
2Q21 – PaLo N. Am.
E-commerce logistics
YoY decline of -12.1% is a decrease
of -4.3% at constant exchange rate.
Revenue decline driven by Radial:
• lower sales from existing
customers (-10.7%) reflecting the
non-repeating growth of last
year’s COVID-19 shutdown
• client churn from terminated
contracts; partially offset by
• gradual ramp-up of new
customers launched in 2021 and
accelerating through June.
Landmark US and Apple Express
recorded continued volume growth
from higher e-commerce activities
and new customers launched
last year.
International mail
Revenue decline of -17.6%,
or -9.8% at constant exchange rate,
Lower volumes in the business mail
segment, partially compensated by
higher domestic parcels revenues.
1
2
1 2
PaLo North America externaloperating income, € million
2Q21 Analyst Presentation
351.9
2Q21
2Q20
-40.1E-commerce
logistics
-3.7International
308.1
-43.8
199
317
272
Radial NA revenues
in perspective
Radial NA revenues of 2Q21:
• +10% above 1Q21
• -14% vs. last year’s COVID spike
of 2Q20, and
• +36% against 2Q19, from
structural e-commerce logistics
growth
Revenues in m$

Very tough comps of the COVID-19 spike in 2Q20 and wage pressure in the U.S. result in a lower EBIT
Key takeaways 2Q21
• Total operating income down € -44.1m or -12.5%.
At constant exchange rate, this is a decline of € -15.1m or -4.6%.
• Operating expenses (incl. adjusted D&A) decreased by € +37.3m
(-11.1%, or -3.1% excl. FX). Variable opex evolved in line with the
revenue development, except for the labor costs due to current
wage rate pressure in the U.S..
In addition, lower bad debt expenses and cost containment in
general also contributed favourably to the opex development.
• Adjusted EBIT down € -6.8m to € 10.8m.
EBIT margin of 3.5%, growing quarter on quarter (2.9% in 1Q21).
11
2Q21 – PaLo N. Am.
2Q21 Analyst Presentation
2Q20 2Q21 % ↑
351.9 308.1 -12.4%
331.0 290.9 -12.1%
20.9 17.2 -17.6%
2.0 1.6 -16.1%
353.9 309.8 -12.5%318.2 280.5 -11.8%
35.7 29.2 -18.2%21.5 20.5 -4.5%
14.2 8.7 -38.8%4.0% 2.8%
17.6 10.8 -38.6%5.0% 3.5%
317.3 271.9 -14.3%
30.8 20.6 -33.2%
13.6 2.1 -84.3%
€ million
Parcels & Logistics North America
External operating income
Total operating income
EBITDA
International mail
Intersegment operating income
Operating expenses
E-commerce logistics
Additional KPIs, adjusted
Radial North America revenue, $m
Depreciation & Amortization
Reported EBIT
Margin (%)
Adjusted EBIT
Margin (%)
Radial North America EBITDA, $m
Radial North America EBIT, $m

Corporate EBIT in line with last year
Key takeaways 2Q21
• External revenues remained flat.
• Net operating expenses (incl. D&A) after intersegment operating
income remained globally stable YoY.
• Stable adjusted EBIT at € -10.6m.
12
2Q21 – Corporate
2Q21 Analyst Presentation
2Q20 2Q21 % ↑
1.3 1.7 32.2%
85.4 96.9 13.4%
86.7 98.5 13.7%80.6 90.2 11.9%
6.0 8.3 37.4%17.0 18.9 10.6%
-11.0 -10.6
-12.7% -10.7%
-11.0 -10.6
-12.7% -10.7%
€ million
Corporate
External operating income
Intersegment operating income
Total operating income
Operating expenses
EBITDA
Depreciation & Amortization
Reported EBIT
Margin (%)
Adjusted EBIT
Margin (%)
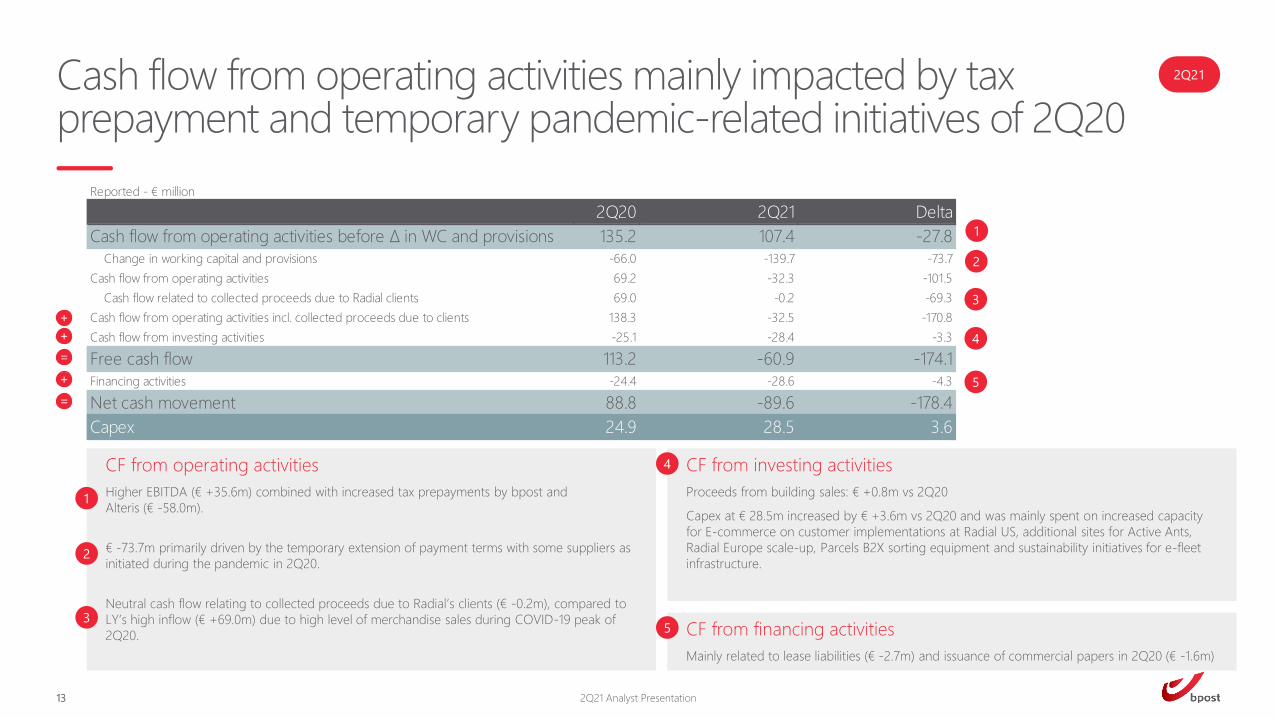
CF from investing activities
Proceeds from building sales: € +0.8m vs 2Q20
Capex at € 28.5m increased by € +3.6m vs 2Q20 and was mainly spent on increased capacity
for E-commerce on customer implementations at Radial US, additional sites for Active Ants,
Radial Europe scale-up, Parcels B2X sorting equipment and sustainability initiatives for e-fleet
infrastructure.
Cash flow from operating activities mainly impacted by tax prepayment and temporary pandemic-related initiatives of 2Q20
13 2Q21 Analyst Presentation
2Q21
+
+
=
+
=
Reported ‐ € million
2Q20 2Q21 Delta
Cash flow from operating activities before Δ in WC and provisions 135.2 107.4 -27.8
Change in working capital and provisions -66.0 -139.7 -73.7
Cash flow from operating activities 69.2 -32.3 -101.5
Cash flow related to collected proceeds due to Radial clients 69.0 -0.2 -69.3
Cash flow from operating activities incl. collected proceeds due to clients 138.3 -32.5 -170.8
Cash flow from investing activities -25.1 -28.4 -3.3
Free cash flow 113.2 -60.9 -174.1
Financing activities -24.4 -28.6 -4.3
Net cash movement 88.8 -89.6 -178.4
Capex 24.9 28.5 3.6
CF from financing activities
Mainly related to lease liabilities (€ -2.7m) and issuance of commercial papers in 2Q20 (€ -1.6m)
CF from operating activities
Higher EBITDA (€ +35.6m) combined with increased tax prepayments by bpost and
Alteris (€ -58.0m).
€ -73.7m primarily driven by the temporary extension of payment terms with some suppliers as
initiated during the pandemic in 2Q20.
Neutral cash flow relating to collected proceeds due to Radial’s clients (€ -0.2m), compared to
LY’s high inflow (€ +69.0m) due to high level of merchandise sales during COVID-19 peak of
2Q20.
1
1
2
2
3
3
4
5
4
5

14
2021 group EBIT outlook revised upwards Outlook FY21
In light of the second quarter results, and based on current assumptions of mail volume trend and normalization for COVID-19 e-commerce activities for the rest of the year, bpost expects the group adjusted EBIT to be above € 340m
2Q21 Analyst Presentation
Parcels &
Logistics Europe
& Asia
High single-digit % growth
in total operating income
with parcels and e-
commerce logistics
volumes expected to
normalize from elevated
COVID-19 levels
Operating expenses will
include investments to
grow omni-commerce
logistics in Europe
9-11% adjusted EBIT
margin
Parcels &
Logistics North
America
Mid- to high single-digit %
growth in total operating
income driven by Radial
existing customers growth
and new client launches,
normalized for 2020
COVID-19 spike
4-5% adjusted EBIT
margin
Group
Low to mid-single-digit %
growth in total operating
income
Adjusted EBIT above
€ 340m
Gross capex around
€ 200-220m, geared
towards the strategy to
grow omni-commerce
logistics
Mail &
Retail
Total operating income:
• Underlying Domestic
Mail volume decline up
to -8%
• Price and mix impact of
+7.0%
• Expected post COVID-
19 recovery in VAS
8-10% adjusted EBIT
margin
Dividend
2021 dividend in the range
of 30-50% of IRFS net
profit and payable in May
2022 after the General
Shareholders’ Meeting, in
accordance with the new
dividend policy

Update on management priorities
2Q21 Analyst Presentation15
Management
Progress in line with plan
• 2021 priorities from Q1 have all progressed
• Preparation of the end of year peak
• Cost reduction and operational efficiency in Mail & Retail Belgium
• Reduction in overhead and headquarters costs
• e-commerce logistics on both sides of the Atlantic
• Active portfolio management and capital allocation to booming e-commerce business
• These initiatives are the focus of the CEO and executive team for the coming months
• They aim at improving performance and predictability of the group
Negotiation of 7th Management Contract
2Q21 Analyst Presentation16
Management
bpost entrusted again by the Belgian Government
• Compensation for Services of General Economic Interest in the range of € 125-130m on an annual basis,
subject to inflation
• Services covered include
• In line with 6th Management contract: Retail Network, distribution of pensions, election materials, etc.
• New service: digital public services to close the digital gap
• Effective for the 5-years period from 1 January 2022 to 31 December 2026
• Outcome of several months of intense and fruitful collaboration with all stakeholders
• Evidence of alignment of interests of bpost stakeholders
• State Aid compliant
Preparation of the end of year peak
2Q21 Analyst Presentation17
Management
Preparation of the end of year (EOY) peak
• Secured distribution and sorting capacity to capture growth vs. 2020 peak (incl. through temporary parcel
sorting machinery in 2 sites)
• >50% increase from Dec ’20 to Dec ’21 of parcels absorption in regular mail rounds to reduce outsourcing to
sub-contractors and increase operational leverage
• Fleet optimization measures incl. replacement of 1,000 short-term leases by long-term leases
• Ongoing optimization of 2nd distribution wave compared to Q4, 2020

Other developments
2Q21 Analyst Presentation18
Management
Cost reduction and operational efficiency in Mail & Retail Belgium
• Ongoing capture of benefits of the Alternating Distribution Model (ADM)
• Productivity gains realized through restored reorganizations of mail offices
(77 reorganizations in 2020, more than double planned in 2021)
Active portfolio management
• Transfer of The Mail Group to Architect Equity was signed and closed on August 5, 2021.
Other developments
2Q21 Analyst Presentation19
Management
Parcel operating model optimization
• Launch of operational benchmarking and process optimization against best-in-class operators to further
improve our operating model. Objective to translate parcels growth into best-in-class satisfaction and
operating performance for profit growth. Appointment of Gerrit Mastenbroek as special advisor to the CEO to
support operating model optimisation.
Sustainability / ESG
• Established an ESG Committee with development of a bpost group ESG roadmap by year-end.
• Ambition for bpost to become one of the greenest postal operators in Europe by 2030. Investments to
accelerate this transition are captured within the capex envelope.

Half year2021 results
6 August 2021
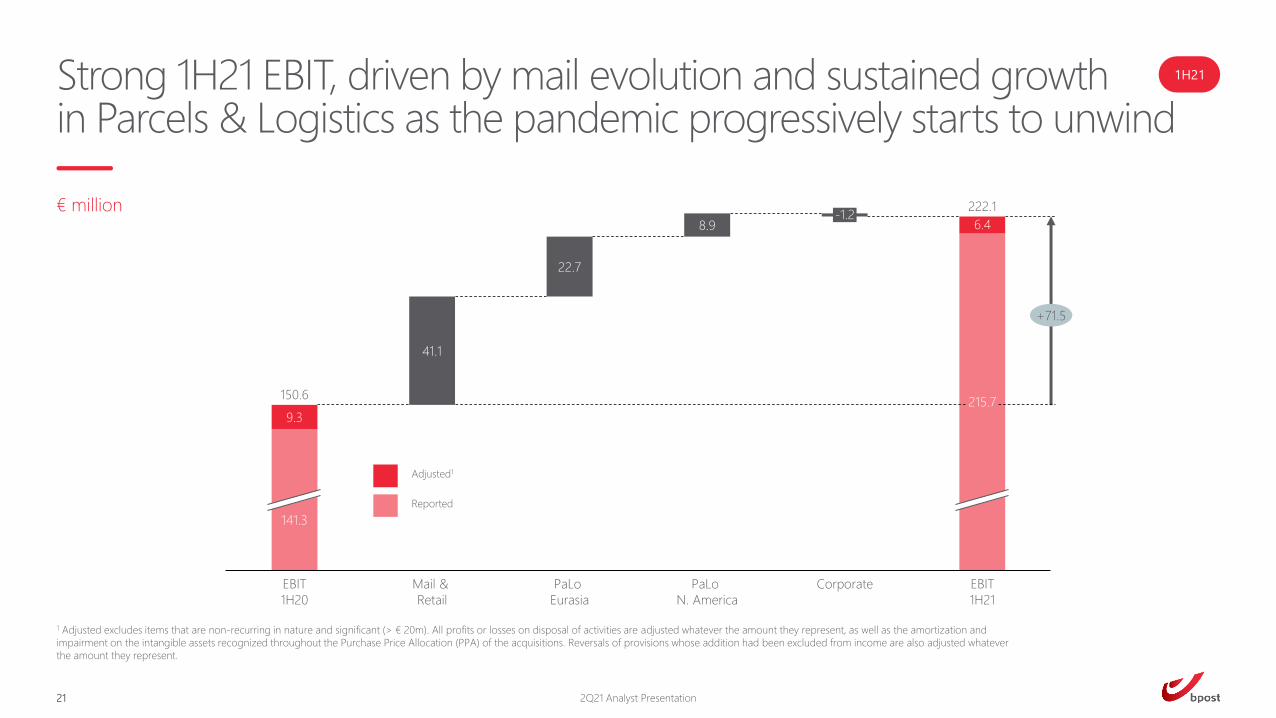
Strong 1H21 EBIT, driven by mail evolution and sustained growth in Parcels & Logistics as the pandemic progressively starts to unwind
21
€ million
2Q21 Analyst Presentation
1H21
1 Adjusted excludes items that are non-recurring in nature and significant (> € 20m). All profits or losses on disposal of activities are adjusted whatever the amount they represent, as well as the amortization and
impairment on the intangible assets recognized throughout the Purchase Price Allocation (PPA) of the acquisitions. Reversals of provisions whose addition had been excluded from income are also adjusted whatever
the amount they represent.
Adjusted1
Reported
141.3
EBIT
1H20
9.3
6.4
EBIT
1H21
150.6
222.1
215.7
Corporate
-1.2
PaLo
N. America
PaLo
Eurasia
Mail &
Retail
41.1
8.9
22.7
+71.5

€ million
1H20 1H21 1H20 1H21 % ↑
Total operating income 1,987.3 2,057.8 1,987.3 2,057.8 3.5%
Operating expenses 1,714.4 1,709.2 1,714.4 1,709.2 -0.3%
EBITDA 272.9 348.6 272.9 348.6 27.7%Depreciation & Amortization 131.6 132.9 122.3 126.5 3.4%
EBIT 141.3 215.7 150.6 222.1 47.5%Margin (%) 7.1% 10.5% 7.6% 10.8%
Financial result -18.4 -6.6 -18.4 -6.6 -63.8%
Profit before tax 131.0 209.0 140.2 215.5 53.6%Income tax expense 39.5 56.0 40.0 57.6 44.0%
Net profit 91.5 153.0 100.3 157.9 57.5%
FCF 307.4 86.5 290.3 99.3 -65.8%
Net Debt at June 30 539.5 489.4 539.5 489.4 -9.3%
Capex 45.4 48.1 45.4 48.1 6.0%Average # FTEs and interims 36,274 37,911 36,274 37,911 4.5%
Reported Adjusted1
Key financials 1H21
22 2Q21 Analyst Presentation
1H21
1 Unaudited figures
1
2
Amortization and impairments
of intangibles recognized
during PPA are adjusted,
leading to increase in
EBIT (€ +6.4m) and income tax
expense (€ +1.5m)
Adjusted FCF excludes the cash
Radial receives on behalf of its
customers for performing billing
services
1 1
2 2
1 1
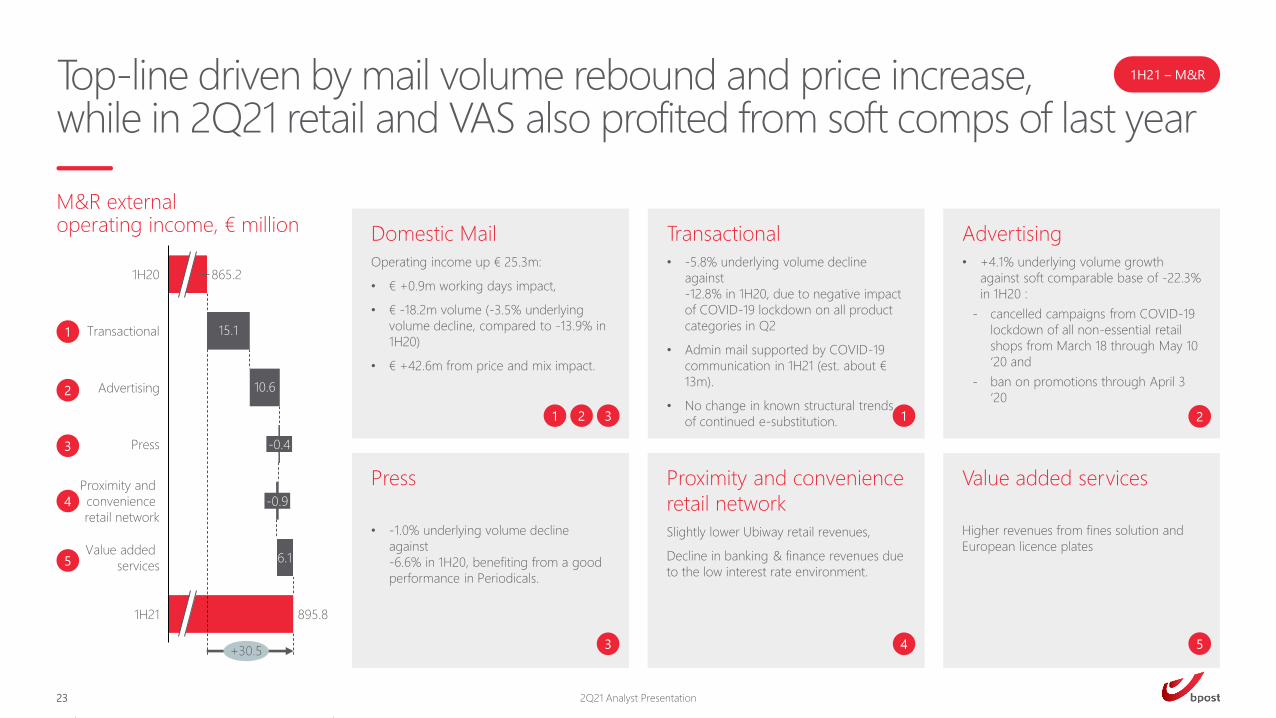
Top-line driven by mail volume rebound and price increase,while in 2Q21 retail and VAS also profited from soft comps of last year
23
1H21 – M&R
M&R external operating income, € million
1
2
3
4
5
2Q21 Analyst Presentation
865.21H20
15.1Transactional
10.6Advertising
-0.4Press
Value added
services
1H21 895.8
Proximity and
convenience
retail network
-0.9
6.1
+30.5
Transactional
• -5.8% underlying volume decline
against
-12.8% in 1H20, due to negative impact
of COVID-19 lockdown on all product
categories in Q2
• Admin mail supported by COVID-19
communication in 1H21 (est. about €
13m).
• No change in known structural trends
of continued e-substitution.
Domestic Mail
Operating income up € 25.3m:
• € +0.9m working days impact,
• € -18.2m volume (-3.5% underlying
volume decline, compared to -13.9% in
1H20)
• € +42.6m from price and mix impact.
Advertising
• +4.1% underlying volume growth
against soft comparable base of -22.3%
in 1H20 :
‐ cancelled campaigns from COVID-19
lockdown of all non-essential retail
shops from March 18 through May 10
‘20 and
‐ ban on promotions through April 3
‘20
Press
• -1.0% underlying volume decline
against
-6.6% in 1H20, benefiting from a good
performance in Periodicals.
Value added services
Higher revenues from fines solution and
European licence plates
3 1
Proximity and convenience
retail network
Slightly lower Ubiway retail revenues,
Decline in banking & finance revenues due
to the low interest rate environment.
4
2
3 5
21

EBIT increase driven by mail revenue and high parcel volumes handled through the mail network
24
1H21 – M&R
2Q21 Analyst Presentation
Key takeaways 1H21
• Total operating income up € +46.7m (+4.8%) driven by (1) price
increases, mail volumes bouncing back on soft comps last year and
one-off volumes from COVID-19 communication (est. about € +13m),
(2) VAS revenues progressively recovering, and (3) higher
intersegment income related to higher parcels volumes.
• Operating expenses (incl. adjusted D&A) remained nearly stable (€ -
5.6m or +0.6%):
(1) Higher payroll & interim costs driven by headcount from higher
parcel volumes, salary indexation, CLA 2021-22 impacts and
vaccination;
(2) Higher costs for fleet, higher 3rd party remuneration from higher
VAS revenues, and lower recoverable VAT; were compensated by
(3) Non-repeating COVID-19 specific opex in 1H20, favourable
evolution of the FTE wage mix, and increased parcel sorting activities
cross-charged to PaLo Eurasia.
• M&R adjusted EBIT increased by € +41.1m to € 142.3m
1H20 1H21 % ↑
865.2 895.8 3.5%
364.0 379.1 4.2%
85.3 95.9 12.5%
171.9 171.5 -0.2%
192.7 191.9 -0.5%
51.3 57.4 11.8%
102.9 119.1 15.8%
968.1 1,014.9 4.8%825.1 828.7 0.4%
143.0 186.1 30.1%43.0 44.6 3.8%
100.0 141.5 41.5%10.3% 13.9%
101.2 142.3 40.7%10.5% 14.0%
-13.9% -3.5%
-12.8% -5.8%
-22.3% 4.1%
-6.6% -1.0%
Transactional
Additional KPIs
Mail & Retail
Depreciation & Amortization
Margin (%)
Adjusted EBIT
Margin (%)
Total operating income
External operating income
Transactional
Advertising
Press
Proximity and convenience retail network
Value added services
Intersegment operating income
Operating expenses
EBITDA
Reported EBIT
Press
Advertising
€ million
Underlying Mail volume decline

25
1H21 – PaLo Eurasia
Parcels BeNe
Total Parcels BeNe revenues up
€ 32.4m (+12.7%) driven by growth
in Parcels B2X.
Parcels B2X1 revenues up 17.8%
driven by volume growth of +23.5%
of which:
• +54.1% in 1Q21 against pre
COVID-19 quarter of 1Q20, and
• +2.9% in 2Q21 against tough
lockdown comparable base of
2Q20.
Negative price/mix of -5.6% mainly
driven by mix impact, and to a
smaller extent by price impact from
one-off COVID-19 surcharges to
customers in April and May-20.
PaLo Eurasia externaloperating income, € million
1
2
3
1
27.8
502.51H20
32.4Parcels BeNe
0.5E-commerce
logistics
563.2
Cross-border
1H21
+60.6
PaLo Eurasia revenue driven by e-commerce development both domestically and abroad
E-commerce logistics
Revenue up € +0.5m (+0.5%) as a
result of:
‐ Radial Europe and Active Ants
revenue growth of +17.4%,
‐ Partially offset by decline in
revenue at Leen Menken due to
loss of contract in Jul-20.
Cross-border
Revenue up € +27.8m (+17.1%)
driven by:
‐ Steady revenue growth of cross-
border commercial sales in UK
and RoE, combined with slightly
slower growth of Asian parcel
volumes
‐ Partly offset by declining cross-
border postal business.
2 3
1 Parcels B2X sales and volumes do not include EuroSprinters and Dynagroup
2Q21 Analyst Presentation

Strong growth in parcels efficiently handled through the mail network drove EBIT growth and steep margin improvement
Key takeaways 1H21
• Total operating income up € +62.8m or +12.4%.
• Operating expenses (incl. adjusted D&A) up € -40.1m (+8.7%) due to
higher volume-linked costs : higher transport and higher
intersegment operating expenses charged by M&R.
This increase was partially compensated by lower variable labour
costs at Leen Menken and non-repeating COVID-19 specific opex in
1H20.
• Adjusted EBIT increased by € +22.7m (+46.2%) to € 72.0m, with a
margin of 12.6%.
Steep margin development thanks to the strong growth in parcels
volumes handled through the integrated mail & parcels network with
benefits of scale of the existing rounds.
26
1H21 – PaLo Eurasia
2Q21 Analyst Presentation
1 1H20 restated to reflect Parcels B2X volume growth
1H20 1H21 % ↑
502.5 563.2 12.1%
254.1 286.5 12.7%
85.6 86.1 0.5%
162.8 190.6 17.1%
5.9 8.0 37.4%
508.4 571.2 12.4%450.0 489.0 8.7%
58.4 82.2 40.8%10.6 11.7 10.1%
47.8 70.5 47.6%9.4% 12.3%
49.3 72.0 46.2%9.7% 12.6%
52.7% 23.5%
Parcels & Logistics Europe and Asia
Total operating income
Operating expenses
External operating income
Intersegment operating income
Parcels BeNe
E-commerce logistics
Cross-border
EBITDA
Depreciation & Amortization
Additional KPIs
Parcels volume growth1
€ million
Reported EBIT
Margin (%)
Adjusted EBIT
Margin (%)

Continued e-commerce development at PaLo NA despite slower growth at Radial against high comps of 2Q20, excluding FX
27
1H21 – PaLo N. Am.
E-commerce logistics
Decline of -2.6% is a YoY increase of +6.0% at
constant exchange rate:
• Radial North America
(1) continued growth from existing customers of
+3.9%, of which
• +25.6% in 1Q21 against softer pre-
lockdown comparable base of 1Q20 and
• -10.7% in 2Q21 reflecting the non-
recurring extra volumes of 2Q20
lockdown growth,
(2) gradual ramp-up of new customers launched
in 2021 and accelerating through June; partially
offset by
(3) client churn from terminated contracts
• Other business lines recording strong volume
growth from existing and new customers.
International mail
Revenue decline of -18.5%, or
-10.8% at constant exchange rate.
Lower volumes in the business mail segment, partially
compensated by higher domestic parcels revenues.
1
2
1 2
PaLo North America externaloperating income, € million
2Q21 Analyst Presentation
611.8
-7.9
1H20
-14.7E-commerce
logistics
International
589.31H21
-22.6

Nearly doubling EBIT driven by top-line development, despite slower growth at Radial in 2Q21 and wage pressure in the U.S.
Key takeaways 1H21
• Total operating income decline of € -23.3m or -3.8%, which
corresponds to a YoY increase of € +26.8 or +4.7% at constant
exchange rate.
• Operating expenses (incl. adjusted D&A) decreased by € +32.2m or
-5.3%.
At constant exchange rate, costs increased by € -17.2m, or +3.1%,
from higher volume-driven costs and wage rate pressure in the U.S.
• Adjusted EBIT up € +8.9m to € 19.0m.
28
1H21 – PaLo N. Am.
2Q21 Analyst Presentation
1H20 1H21 % ↑
611.8 589.3 -3.7%
569.0 554.3 -2.6%
42.8 34.9 -18.5%
3.3 2.6 -22.6%
615.2 591.9 -3.8%569.1 537.2 -5.6%
46.1 54.6 18.4%42.7 39.7 -6.8%
3.5 14.9 328.1%0.6% 2.5%
10.1 19.0 88.1%1.6% 3.2%
532.5 519.0 -2.5%
34.8 38.0 9.1%
0.7 2.1 196.0%
Radial North America EBITDA, $m
Radial North America EBIT, $m
Additional KPIs, adjusted
Radial North America revenue, $m
Depreciation & Amortization
Reported EBIT
Margin (%)
Adjusted EBIT
Margin (%)
EBITDA
International mail
Intersegment operating income
Operating expenses
E-commerce logistics
Parcels & Logistics North America
External operating income
Total operating income
€ million

Corporate EBIT almost neutral as building sales compensate net costs
Key takeaways 1H21
• External revenues up € +2.0m driven by higher building sales.
• Net operating expenses (incl. D&A) after intersegment operating
income increased by € -3.2m mainly driven by a phasing
impact related to long-term employee benefits.
• As a result, adjusted EBIT decreased by € -1.2m YoY to € -11.2m.
29
1H21 – Corporate
2Q21 Analyst Presentation
1H20 1H21 % ↑
7.6 9.6 25.6%
175.9 199.5 13.4%
183.5 209.1 13.9%158.2 183.5 16.0%
25.3 25.6 1.0%35.3 36.8 4.2%
-10.0 -11.2
-5.4% -5.4%
-10.0 -11.2
-5.4% -5.4%
Total operating income
Operating expenses
EBITDA
Depreciation & Amortization
Reported EBIT
Margin (%)
Adjusted EBIT
Margin (%)
€ million
Corporate
External operating income
Intersegment operating income

CF from investing activities
Proceeds from building sales: € -0.3m vs 1H20
Capex at € 48.1m increased by € +2.7m vs 1H20 and was mainly spent on increased capacity for
E-commerce on customer implementations at Radial US, additional sites for Active Ants, Radial
Europe scale-up, Parcels B2X sorting equipment and sustainability initiatives for e-fleet
infrastructure.
Cash flow from operating activities impacted by SGEI payment calendar, tax prepayment and pandemic-related initiatives of 1H20
30 2Q21 Analyst Presentation
1H21
+
+
=
+
=
CF from financing activities
Decision not to roll over maturing commercial paper in 2021: € -168.7m
CF from operating activities
€ -0.5m mainly due to higher EBITDA (€ +75.7m) amongst others neutralized by increased tax
prepayments by bpost and Alteris (€ -58.0m).
€ -186.9m primarily driven by
• temporarily extended payment terms with some suppliers at the beginning of the pandemic
in 2020 (of which € -101.9m relating to transport costs in the US),
• different payment schedule of SGEI (€ -80.5m received last year in January and paid in July
this year).
• partially offset by increased collections in line with high sales peak in 4Q20.
€ -12.8m compared to LY’s inflow (€ +17.1m) due to higher level of merchandise sales from
COVID-19 peak of 1H20.
Reported ‐ € million
1H20 1H21 Delta
Cash flow from operating activities before Δ in WC and provisions 273.0 272.5 -0.5
Change in working capital and provisions 51.8 -135.1 -186.9
Cash flow from operating activities 324.8 137.4 -187.4
Cash flow related to collected proceeds due to Radial clients 17.1 -12.8 -30.0
Cash flow from operating activities incl. collected proceeds due to clients 341.9 124.6 -217.4
Cash flow from investing activities -34.5 -38.1 -3.6
Free cash flow 307.4 86.5 -221.0
Financing activities -51.0 -222.2 -171.2
Net cash movement 256.4 -135.7 -392.1
Capex 45.4 48.1 2.7
1
1
2
2
3
3
4
4
5
5

Additionalinfo

Balance Sheet
32 2Q21 Analyst Presentation
2Q21
Main balance sheet movements
Trade and other receivables : decrease due to the settlement of the SGEI for the delivery of newspapers and periodicals for the year 2020 and the collection of the peak sales of year-end 2020.
The decrease of cash and cash equivalents is due to the closure in the first quarter of 2021 of the commercial paper program and the unwinding of the temporary initiatives set up in the context of the
pandemic in 2020.
The increase of assets held for sale and liabilities held for sales is mainly due to the ongoing sale process of The Mail Group (TMG), in the context of bpost’s active portfolio management.
Equity increased by the realized profit (€ +153.0m) and the exchange differences on translation of foreign operations (€ +19.9m).
The decrease of interest-bearing loans and borrowings is mainly due to the decision to reimburse the maturing commercial paper during the first quarter 2021 (€ -165.0m), partially compensated by
the increase of leases and the unfavorable impact of exchange rates. Net debt decreased by € 5.8m in 1H21, from € 495.2m to 489.4m.
Trade and other payables decreased mainly due to the phasing of year-end peak 2020, the unwinding of some temporary initiatives set up in the context of the pandemic and the decrease of social
payables given the payment of the 2020 accruals in the first half 2021.
€ million
Assets Dec 31, 2020 Jun 30, 2021
PPE 1,138.0 1,139.7
Intangible assets 771.7 775.0
Investments in associates and joint ventures 0.1 0.1
Other assets 54.1 67.7
Trade & other receivables 826.6 714.9
Inventories 32.7 33.5
Cash & cash equivalents 948.1 815.8
Assets held for sale 103.3 123.7
Total Assets 3,874.5 3,670.3
€ million
Equity and Liabilities Dec 31, 2020 Jun 30, 2021
Total equity 583.8 759.0
Interest-bearing loans & borrowings 1,443.2 1,305.0
Employee benefits 320.0 309.5
Trade & other payables 1,487.0 1,249.8
Provisions 27.0 23.4
Derivative instruments 0.3 0.7
Other liabilities 13.2 11.2
Liabilites held for sale 0.0 11.9
Total Equity and Liabilities 3,874.5 3,670.3
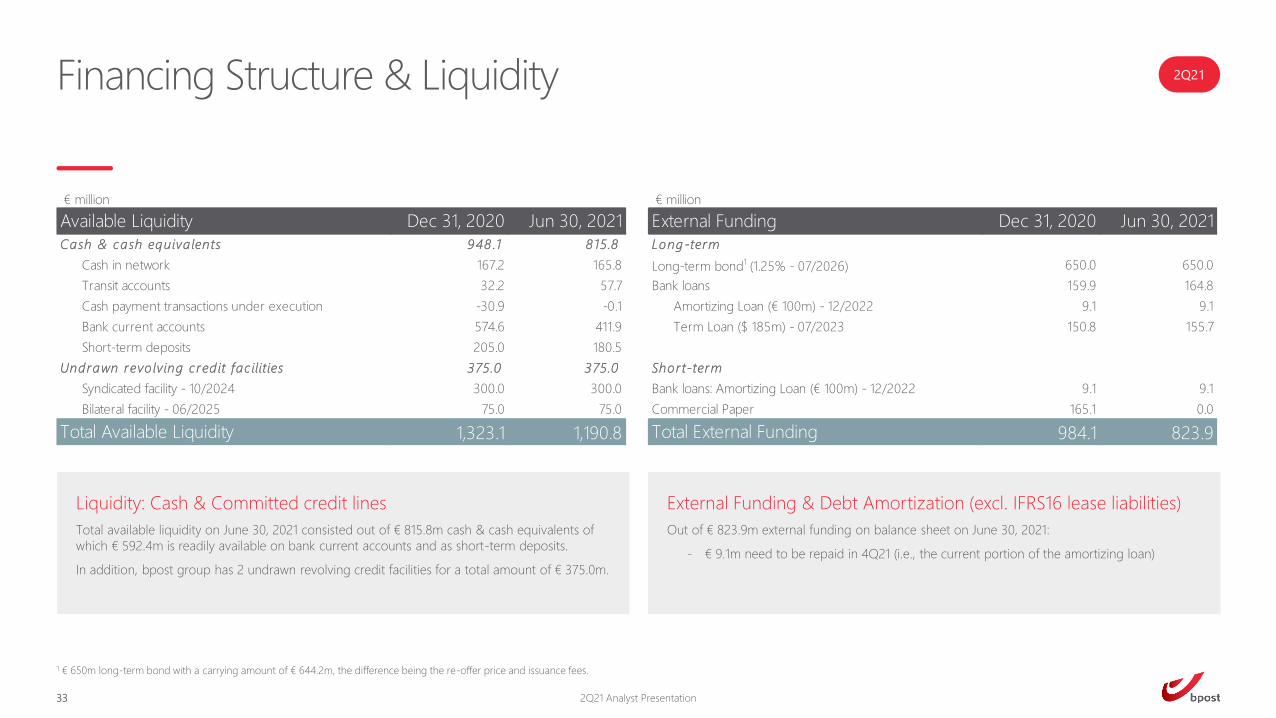
Financing Structure & Liquidity
33 2Q21 Analyst Presentation
2Q21
Liquidity: Cash & Committed credit lines
Total available liquidity on June 30, 2021 consisted out of € 815.8m cash & cash equivalents of
which € 592.4m is readily available on bank current accounts and as short-term deposits.
In addition, bpost group has 2 undrawn revolving credit facilities for a total amount of € 375.0m.
External Funding & Debt Amortization (excl. IFRS16 lease liabilities)
Out of € 823.9m external funding on balance sheet on June 30, 2021:
‐ € 9.1m need to be repaid in 4Q21 (i.e., the current portion of the amortizing loan)
1 € 650m long-term bond with a carrying amount of € 644.2m, the difference being the re-offer price and issuance fees.
€ million
Available Liquidity Dec 31, 2020 Jun 30, 2021
Cash & cash equiva lents 948 .1 8 15.8
Cash in network 167.2 165.8
Transit accounts 32.2 57.7
Cash payment transactions under execution -30.9 -0.1
Bank current accounts 574.6 411.9
Short-term deposits 205.0 180.5
Undrawn revo lving c red it fac ilities 375.0 375.0
Syndicated facility - 10/2024 300.0 300.0
Bilateral facility - 06/2025 75.0 75.0
Total Available Liquidity 1,323.1 1,190.8
€ million
External Funding Dec 31, 2020 Jun 30, 2021
Long-term
Long-term bond1 (1.25% - 07/2026) 650.0 650.0
Bank loans 159.9 164.8
Amortizing Loan (€ 100m) ‐ 12/2022 9.1 9.1
Term Loan ($ 185m) - 07/2023 150.8 155.7
Shor t-term
Bank loans: Amortizing Loan (€ 100m) ‐ 12/2022 9.1 9.1
Commercial Paper 165.1 0.0
Total External Funding 984.1 823.9

Key contact
34 2Q21 Analyst Presentation
Antoine LebecqHead of Investor Relations
Email: [email protected]
Direct: +32 (0) 2 276 29 85
Mobile: +32 (0) 471 81 24 77
Address: bpost group, Centre Monnaie, 1000 Brussels, Belgium


![Analyst & Conference Call [Company Update]](https://static.documents.pub/doc/80x56/577c98461a28ab163a8b4fee/analyst-conference-call-company-update.jpg)


![Analyst Call [Company Update]](https://static.documents.pub/doc/80x56/577ca5be1a28abea748ba457/analyst-call-company-update.jpg)


