38
1 NEWMONT CORPORATION SECOND QUARTER 2021 EARNINGS Second Quarter 2021 Earnings JULY 22, 2021 CREATING VALUE & IMPROVING LIVES THROUGH SUSTAINABLE, RESPONSIBLE MINING
1NEWMONT CORPORATIONSECOND QUARTER 2021 EARNINGS
Second Quarter 2021 Earnings
JULY 22, 2021CREATING VALUE & IMPROVING LIVES THROUGH SUSTAINABLE, RESPONSIBLE MINING

2NEWMONT CORPORATIONSECOND QUARTER 2021 EARNINGS
Cautionary Statement
This presentation contains “forward-looking statements” within the meaning of Section 27A of the Securities Act of 1933, as amended, and Section 21E of the Securities Exchange Act of 1934, as amended, which are intended to be covered by the safe harbor created by such sections and other applicable laws. Where a forward-looking statement expresses or implies an expectation or belief as to future events or results, such expectation or belief is expressed in good faith and believed to have a reasonable basis. However, such statements are subject to risks, uncertainties and other factors, which could cause actual results to differ materially from future results expressed, projected or implied by the forward-looking statements. Forward-looking statements often address our expected future business and financial performance and financial condition; and often contain words such as “anticipate,” “intend,” “plan,” “will,” “would,” “estimate,” “expect,” “believe,” “target,” “indicative,” “preliminary,” or “potential.” Forward-looking statements in this news release may include, without limitation, (i) estimates of future production and sales, including production outlook, average future production, upside potential and indicative production profiles; (ii) estimates of future costs applicable to sales and all-in sustaining costs; (iii) estimates of future capital expenditures, including development and sustaining capital; (iv) estimates of future cost reductions, full potential savings, value creation, improvements, synergies and efficiencies; (v) expectations regarding the Tanami Expansion 2, Ahafo North and Yanacocha Sulfides projects, as well as the development, growth and exploration potential of the Company’s other operations, projects and investments, including, without limitation, returns, IRR, schedule, approval and decision dates, mine life and mine life extensions, commercial start, first production, average production, average costs, impacts of improvement or expansion projects and upside potential; (vi) expectations regarding future investments or divestitures; (vii) expectations regarding free cash flow, and returns to stockholders, including with respect to future dividends and future share repurchases; (viii) expectations regarding future mineralization, including, without limitation, expectations regarding reserves and recoveries; (ix) estimates of future closure costs and liabilities; (x) expectations regarding the timing and/or likelihood of future borrowing, future debt repayment, financial flexibility and cash flow; and (xi) expectations regarding the impact of the Covid-19 pandemic and vaccine. Estimates or expectations of future events or results are based upon certain assumptions, which may prove to be incorrect. Such assumptions, include, but are not limited to: (i) there being no significant change to current geotechnical, metallurgical, hydrological and other physical conditions; (ii) permitting, development, operations and expansion of operations and projects being consistent with current expectations and mine plans, including, without limitation, receipt of export approvals; (iii) political developments in any jurisdiction in which the Company operates being consistent with its current expectations; (iv) certain exchange rate assumptions being approximately consistent with current levels; (v) certain price assumptions for gold, copper, silver, zinc, lead and oil; (vi) prices for key supplies being approximately consistent with current levels; (vii) the accuracy of current mineral reserve and mineralized material estimates; and (viii) other planning assumptions. Uncertainties relating to the impacts of Covid-19, include, without limitation, general macroeconomic uncertainty and changing market conditions, changing restrictions on the mining industry in the jurisdictions in which we operate, the ability to operate following changing governmental restrictions on travel and operations (including, without limitation, the duration of restrictions, including access to sites, ability to transport and ship doré, access to processing and refinery facilities, impacts to international trade, impacts to supply chain, including price, availability of goods, ability to receive supplies and fuel, impacts to productivity and operations in connection with decisions intended to protect the health and safety of the workforce, their families and neighboring communities), the impact of additional waves or variations of Covid, and the availability and impact of Covid vaccinations in the areas and countries in which we operate. Investors are reminded that only the second quarter has been declared by the Board of Directors at this time. Future dividends for 2021 have not yet been approved or declared by the Board of Directors, and an annualized dividend payout or dividend yield has not been declared by the Board. Management’s expectations with respect to future dividends are “forward-looking statements” and the Company’s dividend framework is non-binding. The declaration and payment of future dividends remain at the discretion of the Board of Directors and will be determined based on Newmont’s financial results, balance sheet strength, cash and liquidity requirements, future prospects, gold and commodity prices, and other factors deemed relevant by the Board. Investors are also cautioned that the extent to which the Company repurchases its shares, and the timing of such repurchases, will depend upon a variety of factors, including trading volume, market conditions, legal requirements, business conditions and other factors. The repurchase program may be discontinued at any time, and the program does not obligate the Company to acquire any specific number of shares of its common stock or to repurchase the full authorized amount during the authorization period. Consequently, the Board of Directors may revise or terminate such share repurchase authorization in the future. For a more detailed discussion of risks and other factors that might impact future looking statements, see the Company’s Annual Report on Form 10-K for the year ended December 31, 2020 filed with the U.S. Securities and Exchange Commission (the “SEC”), under the heading “Risk Factors", filed with the SEC, available on the SEC website or www.newmont.com. The Company does not undertake any obligation to release publicly revisions to any “forward-looking statement,” including, without limitation, outlook, to reflect events or circumstances after the date of this news release, or to reflect the occurrence of unanticipated events, except as may be required under applicable securities laws. Investors should not assume that any lack of update to a previously issued “forward-looking statement” constitutes a reaffirmation of that statement. Continued reliance on “forward-looking statements” is at investors’ own risk.
CAUTIONARY STATEMENT REGARDING FORWARD LOOKING STATEMENTS:

3NEWMONT CORPORATIONSECOND QUARTER 2021 EARNINGS
Tom PalmerPRESIDENT & CHIEF EXECUTIVE OFFICERCREATING VALUE & IMPROVING LIVES
THROUGH SUSTAINABLE, RESPONSIBLE MINING

4NEWMONT CORPORATIONSECOND QUARTER 2021 EARNINGS
Produced 1.45M attributable ounces of gold* and over 300k GEOs from co-products
Generated $578M of Free Cash Flow**, 97% attributable
Full-year results continue to be back-half weighted, in line with guidance ranges
Completed GT Gold transaction, increasing our interest in the prospective Golden Triangle
Declared industry-leading dividend of $0.55 per share for Q2**
Liquidity of $7.6B and net debt to adjusted EBITDA ratio of 0.2x
Approved full funds for Ahafo North, the best unmined gold deposit in West Africa
Published Annual Sustainability Report, a transparent review of our ESG performance
Launched first Climate Strategy Report, including pathways to achieve our climate targets
SECOND QUARTER HIGHLIGHTS
The World’s Leading Gold Company
*Includes production from the Company’s equity method investment in the Pueblo Viejo joint venture **See endnotes re non-GAAP metrics, dividends and share repurchase program

5NEWMONT CORPORATIONSECOND QUARTER 2021 EARNINGS
SAM S&P (DJSI)
99%Percentile ranking
global metals and mining sector
6 years as the top-ranked gold miner in the Dow Jones Sustainability Index
External Recognition for Responsible Business Practices
SUSTAINALYTICS
94%Top decile
ESG sector performance
TRANSPARENCY
#3Most transparent company in
S&P 500; Bloomberg ESG Disclosure Score
CLIMATE
A-CDP Climate Scores reflective of
coordinated action on climate issues
MSCI
ATop-quartile
Precious metals and mining
ISS GOVERNANCEQUALITYSCORE
1Top-decile for high-quality governance
practices and lower governance risk
GLOBAL TOP 100
#6Ranking among the 100 Best Corporate
Citizens by 3BL
HUMAN RIGHTS
#19Among more than 200 Companies
on Corporate Human Rights Benchmark
ESG RATINGS ESG RECOGNITION
Ratings and rankings can fluctuate throughout the year, either based on Newmont performance, or relative to sector rankings and/or ratings agency scoring changes and periodic updates. Ratings and recognition items shown here are effective as of July 16, 2021 and are subject to change.

6NEWMONT CORPORATIONSECOND QUARTER 2021 EARNINGS
World-Class Assets in Top-Tier Jurisdictions
LEGEND
Akyem
= World Class Asset
L E G E N D
= Emerging World Class Asset
20%
Ahafo
Ahafo North
Tanami
Tanami Expansion 2
Boddington
Cerro Negro
Nevada Gold Mines***
Turquoise Ridge/Twin Creeks
Goldstrike/Carlin
Cortez
*See endnotes re definition of world-class asset and calculation of Gold Equivalent Ounces (GEOs)** Yanacocha Sulfides is included in Newmont’s outlook but remains subject to approval***Newmont’s ownership interest is 38.5% of Nevada Gold Mines and 40% of Pueblo Viejo. In addition to the world-class assets featured above, Nevada Gold Mines also includes Long Canyon and Phoenix.
CC&V
Peñasquito
Pueblo Viejo***
Musselwhite
Éléonore
Porcupine
Merian
Yanacocha
Yanacocha Sulfides**
= Operations = Near-term Projects = Joint Ventures
World’s Leading Gold Company
▪ Nine world-class assets in top-tier jurisdictions*
▪ Robust gold reserves of 94Moz and 65Moz in GEO reserves*
▪ Stable production of ~8M GEOs* annually through 2030+

7NEWMONT CORPORATIONSECOND QUARTER 2021 EARNINGS
Steady Production Through Industry-Best Portfolio
INDICATIVE 10-YEAR GOLD PRODUCTION PROFILE *
(ATTRIBUTABLE MOZ PER YEAR)
*Indicative production profile includes existing assets and Yanacocha Sulfides which remains subject to approval, resource conversion and high confidence inventory. See endnotes.
**Gold and GEO production assumptions as of December 8, 2020; see endnote re calculation of GEOs
***Includes Newmont’s ownership interest of 38.5% in Nevada Gold Mines (North America) and 40% in Pueblo Viejo (South America)
~8 Million Gold Equivalent Ounces per Year for the Next Decade
-
1
2
3
4
5
6
7
8
9
2021 2022 2023 2024 2025 2026 2027 2028 2029 2030
South America***
Africa
North America***
Australia
Total GEOs **
8NEWMONT CORPORATIONSECOND QUARTER 2021 EARNINGS
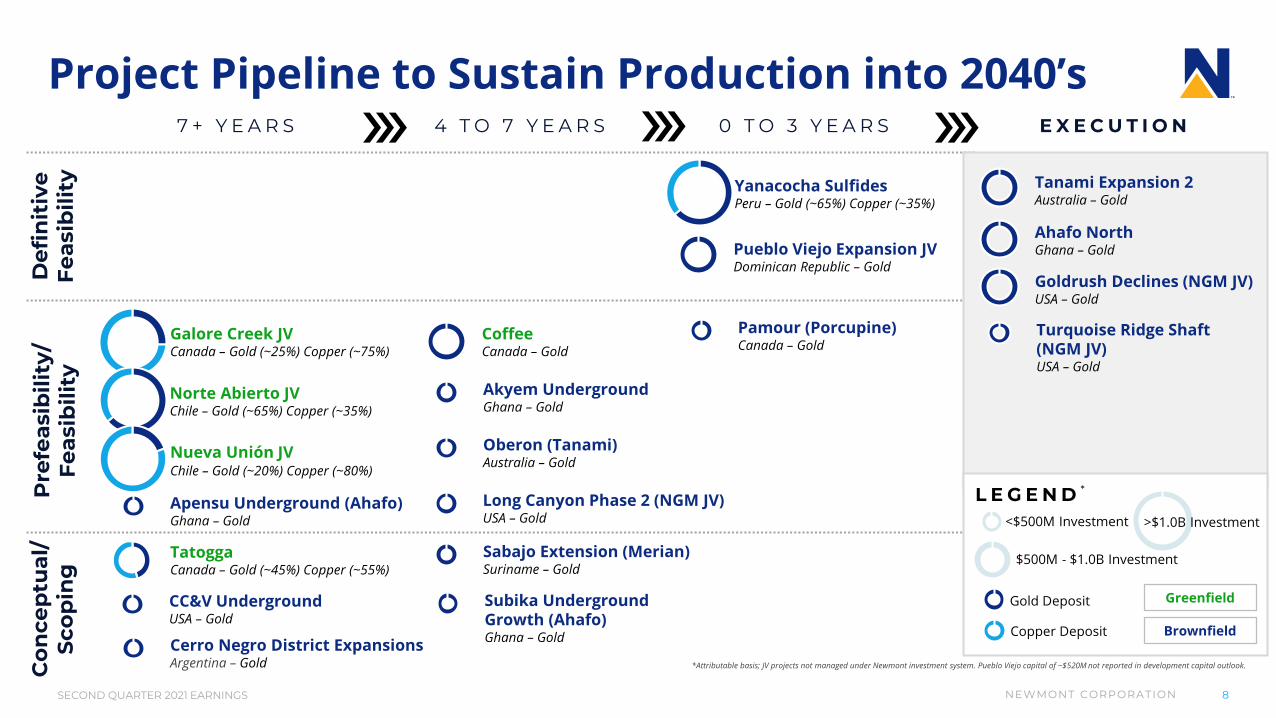
Project Pipeline to Sustain Production into 2040’s7 + Y E A R S 4 T O 7 Y E A R S 0 T O 3 Y E A R S
De
fin
itiv
e
Fe
asi
bili
tyP
refe
asi
bili
ty/
Fe
asi
bili
tyC
on
cep
tua
l/S
cop
ing
E X E C U T I O N
<$500M Investment
Brownfield
Greenfield
L E G E N D *
*Attributable basis; JV projects not managed under Newmont investment system. Pueblo Viejo capital of ~$520M not reported in development capital outlook.
Yanacocha SulfidesPeru – Gold (~65%) Copper (~35%)
Ahafo NorthGhana – Gold Pueblo Viejo Expansion JV
Dominican Republic – Gold
Galore Creek JVCanada – Gold (~25%) Copper (~75%)
Norte Abierto JVChile – Gold (~65%) Copper (~35%)
Nueva Unión JVChile – Gold (~20%) Copper (~80%)
Apensu Underground (Ahafo)Ghana – Gold
Akyem Underground Ghana – Gold
Oberon (Tanami)Australia – Gold
Long Canyon Phase 2 (NGM JV)USA – Gold
CoffeeCanada – Gold
Tanami Expansion 2Australia – Gold
Goldrush Declines (NGM JV)USA – Gold
Turquoise Ridge Shaft (NGM JV)USA – Gold
CC&V Underground USA – Gold
Cerro Negro District ExpansionsArgentina – Gold
Sabajo Extension (Merian) Suriname – Gold
Subika Underground Growth (Ahafo)Ghana – Gold
$500M - $1.0B Investment
>$1.0B Investment
Gold Deposit
Copper Deposit
TatoggaCanada – Gold (~45%) Copper (~55%)
Pamour (Porcupine)Canada – Gold

9NEWMONT CORPORATIONSECOND QUARTER 2021 EARNINGS
Ahafo North Receives Full Funds Approval
PROJECT OVERVIEW
Projected Capital Costs ($M) $750 – $850
Average Annual Gold Production (koz)* 275 – 325
Gold Costs Applicable to Sales ($/oz)* $450 – $550
Gold All-in Sustaining Costs ($/oz)* $600 – $700
Mine Life 13 years
Construction Completion Date H2 2023
*For the first five years (2024 – 2028). AISC is a non-GAAP measure, see endnotes
THE BEST UNMINED DEPOSIT IN WEST AFRICA
▪ Completed permitting process and received full funds approval in July 2021
▪ Open pit mine, stand-alone mill for processing 3.5Mozs of Reserves and 1.0Mozs of Resource
▪ Mineralization is open in all directions along 14km strike with significant upside potential
▪ Creating lasting value through local sourcing and hiring; targeting gender parity at startup
▪ Strong partnerships with local and regional communities, government agencies and stakeholders
Ahafo North

10NEWMONT CORPORATIONSECOND QUARTER 2021 EARNINGS
Worldwide Vaccination Rates for Total Population
LEGEND
UNITED STATES▪ 51% fully vaccinated▪ 55% at least one dose
CANADA▪ 43% fully vaccinated▪ 69% at least one dose
MEXICO▪ 16% fully vaccinated▪ 27% at least one dose
AUSTRALIA▪ 9% fully vaccinated▪ 27% at least one dose
PERU▪ 11% fully vaccinated▪ 18% at least one dose
SURINAME▪ 7% fully vaccinated▪ 29% at least one dose
ARGENTINA▪ 11% fully vaccinated▪ 43% at least one dose
GHANA▪ 1% fully vaccinated▪ 3% at least one dose

11NEWMONT CORPORATIONSECOND QUARTER 2021 EARNINGS
Rob AtkinsonCHIEF OPERATING OFFICERCREATING VALUE & IMPROVING LIVES
THROUGH SUSTAINABLE, RESPONSIBLE MINING

12NEWMONT CORPORATIONSECOND QUARTER 2021 EARNINGS
Africa Positioned to Deliver Strong H2
Akyem
▪ Akyem delivers strong performance due to higher grades from
changes to mine sequencing
▪ Ahafo grade improvements expected to continue each quarter
in 2021; remains a solid contributor despite mill maintenance
and power outages
▪ Progressing Subika underground mining method change,
improving grade and tons mined throughout 2021
▪ Completed permitting process for Ahafo North and received full
funds approval in July 2021
Q2 2021 YTD 2021
Gold production (Koz) 202 407
Gold Costs Applicable to Sales ($/oz) 763 760
Gold All-in Sustaining Costs ($/oz)* 1,000 974
*AISC is a non-GAAP measure, see endnotes

13NEWMONT CORPORATIONSECOND QUARTER 2021 EARNINGS
*AISC is a non-GAAP measure, see endnotes
▪ Tanami was a solid contributor as higher grade mined offset
unplanned mill maintenance; managing Covid-related impacts
▪ Tanami Expansion 2 project progressing; continued work on
hoist structure and underground shaft
▪ Boddington reached near-record mill performance; delivered
lower tons mined from unplanned fleet maintenance
▪ Progressing Autonomous Haulage; vehicles deployed to open pit
and on track for completion in Q3
Q2 2021 YTD 2021
Gold production (Koz) 299 568
Co-product GEO production (Koz) 43 75
Gold Costs Applicable to Sales ($/oz) 764 757
Gold All-in Sustaining Costs ($/oz)* 997 1,048
Australia Building Momentum into H2
Tanami Expansion 2

14NEWMONT CORPORATIONSECOND QUARTER 2021 EARNINGS
*AISC is a non-GAAP measure, see endnotes
▪ Peñasquito generated consistent performance; supported by Full
Potential improvements to recovery rates
▪ CC&V delivered lower tons mined and continued to experience
geochemistry challenges; grades to improve in H2 2021
▪ Porcupine delivered lower throughput and tons mined due to mill
and equipment maintenance; Full Potential initiatives identified
▪ Musselwhite continued to be impacted by Covid, resulting in lower
development and production rates
▪ Éléonore impacted by Covid; continued safety and productivity
improvements from tele-remote mucking
North America Delivers Solid Q2 Results
Q2 2021 YTD 2021
Gold production (Koz) 397 810
Co-product GEO production (Koz) 260 545
Gold Costs Applicable to Sales ($/oz) 769 752
Gold All-in Sustaining Costs ($/oz)* 985 971Peñasquito

15NEWMONT CORPORATIONSECOND QUARTER 2021 EARNINGS
South America Continues to Manage Covid Impacts
▪ Merian delivered steady throughput and higher grades due to ore
blending strategy; heavy rainfall limited tons mined
▪ Cerro Negro and Yanacocha continue to manage ongoing Covid-
related impacts
▪ Cerro Negro improved productivity while progressing mine
development and future growth projects
▪ Yanacocha delivered higher grades and recovery from leach pads;
leach-only operations ahead of Sulfides
▪ Yanacocha Sulfides advancing to full funds decision in December 2021
*Gold production shown on an attributable basis and includes 40% ownership in Pueblo Viejo; AISC is a non-GAAP measure, see endnotes
Yanacocha
Q2 2021 YTD 2021
Gold production (Koz)* 267 532
Gold Costs Applicable to Sales ($/oz) 721 753
Gold All-in Sustaining Costs ($/oz)* 1,022 1,041

16NEWMONT CORPORATIONSECOND QUARTER 2021 EARNINGS
Nancy BueseCHIEF FINANCIAL OFFICERCREATING VALUE & IMPROVING LIVES
THROUGH SUSTAINABLE, RESPONSIBLE MINING

17NEWMONT CORPORATIONSECOND QUARTER 2021 EARNINGS
METRICS Q2 2020 Q2 2021
Profit Metrics
Revenue ($M) $2,365 $3,065 +30%
Adjusted Net Income ($M)* $261 $670 +157%
Adjusted Net Income ($/diluted share)* $0.32 $0.83 +159%
Adjusted EBITDA ($M)*$984 $1,591 +62%
Cash Flow Metrics
Cash from continuing operations ($M) $668 $993 +49%
Consolidated Free Cash Flow ($M)*$388 $578 +49%
Attributable Free Cash Flow ($M)*$372 $560 +51%
Cash and cash equivalents ($M) $3,808 $4,583 +20%
Dividend declared $/share*$0.25 $0.55 +120%
Strong Financial Performance in the Second Quarter
*See endnotes.

18NEWMONT CORPORATIONSECOND QUARTER 2021 EARNINGS
Q2 Adjusted Net Income of $0.83 per ShareGAAP TO ADJUSTED NET INCOME ($/DILUTED SHARE) *
*See endnotes **Other includes impairment of long-lived and other assets and settlement costs.
$0.80 $0.83
$0.02 $0.02 $0.02
($0.03)
GAAP Net income from
continuing operations
Fair value of marketable
equity securities
adjustments
Reclamation and
remediation adjustments
Tax adjustments and
valuation allowance
Other** Adjusted net income

19NEWMONT CORPORATIONSECOND QUARTER 2021 EARNINGS
$1,200 $1,500 $1,800 $2,100
ATTRIBUTABLE FREE CASH FLOW INCREASES WITH HIGHER GOLD PRICE*5-Year Cumulative Attributable Free Cash Flow **
Superior Free Cash Flow Across Cycles
*Free Cash Flow assumptions as of December 8, 2020; **$1,200 gold price base generates ~$3.5 billion of Free Cash Flow from our five-year outlook. Includes impacts from approved projects and Yanacocha Sulfides. See endnotes re outlook, Free Cash Flow, Attributable Free Cash Flow and Dividends.
~$3.5B
~$9.5B
~$15.5B
~$21.5B
INC
RE
ME
NTA
L FC
F
+$1,200MPer Year
+$2,400MPer Year
+$3,600MPer Year
+$400M FCF per annum for every $100/oz increase in gold price
BA
SE

20NEWMONT CORPORATIONSECOND QUARTER 2021 EARNINGS
Industry-Leading Dividend Framework▪ Leading $1.00/share sustainable base dividend
▪ Targeting 40% – 60% of incremental attributable Free Cash Flow
above $1,200/oz returned to shareholders
▪ Evaluating gold price increments of ~$300/oz
▪ Approved quarterly by Board of Directors
ANNUALIZED DIVIDEND PAYOUT
*Investors are reminded that Newmont’s dividend framework is non-binding and an annualized dividend has not been declared by the Board. Dividends beyond the second quarter dividend remain subject to future consideration and declaration is the discretion of the Board. See endnote re dividends and returns to shareholders.
$1.00 $1.00 $1.00
$1,500/oz $1,800/oz $2,100/oz
$2.20 - $2.80
$2.80 - $3.70
$1.60 - $1.90Annualized dividend payout framework*
$1.00/share sustainable base dividend
(payable at $1,200/oz gold price)
+ $1.20/share incremental payment
(Q2 2021 dividend set assuming ~40% of incremental attributable FCF at $1,800/oz gold price)
= $2.20/share annualized dividend payout*
Declared Second Quarter Dividend of $0.55 per Share
Q2 2021Dividend

21NEWMONT CORPORATIONSECOND QUARTER 2021 EARNINGS
✓ Approved full funds for Ahafo North
✓ Yanacocha Sulfides expected to be approved in December 2021
✓ Completed GT Gold transaction, increasing our interest in the prospective Golden Triangle
✓ Maintained industry-leading dividend framework, providing stability and predictability
✓ Declared Q2 dividend of $0.55 per share, in line with prior quarter
✓ Completed $149M of share repurchases from $1B buyback program*
✓ Liquidity of $7.6B and cash balance of $4.6B at Q2
✓ Redeemed 2021 Senior Notes, paid $550M with available cash
✓ Maintained net debt to adjusted EBITDA ratio of 0.2x
Returned Over $1 Billion to Shareholders Through Dividends and Share Buybacks in H1 2021
INVESTING IN ORGANIC GROWTH
RETURNING CASH TO SHAREHOLDERS
MAINTAINING FINANCIAL FLEXIBILITY
Delivering on Capital Allocation Strategy in Q2
*Includes $15 million settled after June 30, 2021.

22NEWMONT CORPORATIONSECOND QUARTER 2021 EARNINGS
Tom PalmerPRESIDENT & CHIEF EXECUTIVE OFFICERCREATING VALUE & IMPROVING LIVES
THROUGH SUSTAINABLE, RESPONSIBLE MINING

23NEWMONT CORPORATIONSECOND QUARTER 2021 EARNINGS
#1 gold producer with ~8M GEOs* per year through 2030 and significant exposure to other metals
Industry’s best portfolio of world-class assets in top-tier jurisdictions
Recognized sustainability leader committed to creating value and improving lives
Proven operating model and deep bench of experienced leaders with strong track record
Strong Free Cash Flow generation with significant leverage to rising gold prices
Focused on industry-leading returns to shareholders with disciplined capital allocation through the cycle
*See endnotes

24NEWMONT CORPORATIONSECOND QUARTER 2021 EARNINGS
Appendix

25NEWMONT CORPORATIONSECOND QUARTER 2021 EARNINGS
*Attributable basis; **Attributable co-product gold equivalent ounces; includes copper, silver, lead and zinc; ***Consolidated basis for gold
2021 Consolidated Expense Outlook ($M) (+/-5%)
General & Administrative 260
Interest Expense 275
Depreciation and Amortization 2,500
Exploration & Advanced Projects 390
Adjusted Tax Rate bc 34% - 38%
Federal Tax Rate c 27% - 30%
Mining Tax Rate c 6% - 9%
Outlooka
a 2021 outlook projections used in this presentation are considered forward-looking statements and represent management’s good faith estimates or expectations of future production results as of December 8, 2020. Outlook is based upon certain assumptions, including, but not limited to, metal prices, oil prices, certain exchange rates and other assumptions. For example, 2021 Outlook assumes $1,200/oz Au, $22/oz Ag, $2.75/lb Cu, $1.05/lb Zn, $0.90/lb Pb, $0.75 USD/AUD exchange rate, $0.77 USD/CAD exchange rate and $50/barrel WTI; AISC and CAS estimates do not include inflation, for the remainder of the year. Production, CAS, AISC and capital estimates exclude projects that have not yet been approved, except for Yanacocha Sulfides which is included in Outlook as the development project is expected to reach execution stage in December 2021. The potential impact on inventory valuation as a result of lower prices, input costs, and project decisions are not included as part of this Outlook. Assumptions used for purposes of Outlook may prove to be incorrect and actual results may differ from those anticipated, including variation beyond a +/-5% range. Outlook cannot be guaranteed. As such, investors are cautioned not to place undue reliance upon Outlook and forward-looking statements as there can be no assurance that the plans, assumptions or expectations upon which they are placed will occur. Amounts may not recalculate to totals due to rounding. See cautionary at the beginning of this presentation. b The adjusted tax rate excludes certain items such as tax valuation allowance adjustments. c Assuming average prices of $1,500 per ounce for gold, $22 per ounce for silver, $2.75 per pound for copper, $0.90 per pound for lead, and $1.05 per pound for zinc and achievement of current production and sales volumes and cost estimates, we estimate our consolidated adjusted effective tax rate related to continuing operations for 2021 will be between 34%-38%.

26NEWMONT CORPORATIONSECOND QUARTER 2021 EARNINGS
Adjusted net income (loss)Management uses Adjusted net income (loss) to evaluate the Company’s operating performance and for planning and forecasting future business operations. The Company believes the use of Adjusted net income (loss) allows investors and others to understand the results of the continuing operations of the Company and its direct and indirect subsidiaries relating to the sale of products, by excluding certain items that have a disproportionate impact on our results for a particular period. Adjustments to continuing operations are presented before tax and net of our partners’ noncontrolling interests, when applicable. The tax effect of adjustments is presented in the Tax effect of adjustments line and is calculated using the applicable regional tax rate. Management’s determination of the components of Adjusted net income (loss) are evaluated periodically and based, in part, on a review of non-GAAP financial measures used by mining industry analysts. Net income (loss) attributable to Newmont stockholders is reconciled to Adjusted net income (loss) as follows:
(1) Per share measures may not recalculate due to rounding.(2) Change in fair value of investments, included in Other income, net, primarily represents unrealized gains and losses related to
the Company’s investment in current and non-current marketable and other equity securities. For additional information regarding our investments, see Note 15 of the Condensed Consolidated Financial Statements.
(3) (Gain) loss on asset and investment sales, included in Gain on asset and investment sales, net, primarily represents a gain on the sale of TMAC. For additional information, see Note 8 of the Condensed Consolidated Financial Statements.
(4) Reclamation and remediation charges, included in Reclamation and remediation, represent revisions to reclamation and remediation plans at the Company's former operating properties and historic mining operations that have entered the closure phase and have no substantive future economic value.
(5) Impairment of long-lived and other assets, included in Other expense, net, represents non-cash write-downs of various assets that are no longer in use.
(6) Settlement costs, included in Other expense, net, primarily are comprised of a voluntary contribution made to the Republic ofSuriname.
(7) Restructuring and severance, net, included in Other expense, net, primarily represents severance and related costs associatedwith significant organizational or operating model changes implemented by the Company. Total amounts are presented net of income (loss) attributable to noncontrolling interests of $— and $(1), respectively.
(8) COVID-19 specific costs included in Other expense, net, primarily includes amounts distributed from the Newmont Global Community Fund to help host communities, governments and employees combat the COVID-19 pandemic. Adjusted net income (loss) has not been adjusted for $19 and $40, respectively, of incremental COVID-19 costs incurred as a result of actions taken to protect against the impacts of the COVID-19 pandemic at our operational sites. See Note 7 of the Condensed Consolidated Financial Statements for further information.
(9) The tax effect of adjustments, included in Income and mining tax benefit (expense), represents the tax effect of adjustments in footnotes (2) through (8), as described above, and are calculated using the applicable regional tax rate.
(10) Valuation allowance and other tax adjustments, net, included in Income and mining tax benefit (expense), is recorded for items such as foreign tax credits, alternative minimum tax credits, capital losses, disallowed foreign losses, and the effects of changes in foreign currency exchange rates on deferred tax assets and deferred tax liabilities. The adjustment for the three and six months ended June 30, 2021 is due to increases or (decreases) to net operating losses, tax credit carryovers and other deferred tax assets subject to valuation allowance of $9 and $30 respectively, the effects of changes in foreign exchange rates on deferred tax assets and liabilities of $11 and $(17) respectively, changes to the reserve for uncertain tax positions of $22 and $22 respectively, and other tax adjustments of $(17) and $(19), respectively. Total amount is presented net of income (loss) attributable to noncontrolling interests of $(3) and $(5), respectively.
(11) Adjusted net income (loss) per diluted share is calculated using diluted common shares, which are calculated in accordance with U.S. GAAP.
Three Months EndedJune 30, 2021
Six Months EndedJune 30, 2021
per share data (1) per share data (1)
basic diluted basic diluted
Net income (loss) attributable to Newmont stockholders $ 650 $ 0.81 $ 0.81 $ 1,209 $ 1.51 $ 1.51
Net loss (income) attributable to Newmont stockholders from discontinued operations (10) (0.01) (0.01) (31) (0.04) (0.04)
Net income (loss) attributable to Newmont stockholders from continuing operations 640 0.80 0.80 1,178 1.47 1.47
Change in fair value of investments (2) (26) (0.03) (0.03) 84 0.10 0.10
(Gain) loss on asset and investment sales (3) — — — (43) (0.05) (0.05)
Reclamation and remediation charges (4) 20 0.02 0.02 30 0.04 0.04
Impairment of long-lived and other assets (5) 11 0.01 0.01 12 0.01 0.01
Settlement costs (6) 8 0.01 0.01 11 0.01 0.01
Restructuring and severance, net (7) 5 — — 9 0.01 0.01
COVID-19 specific costs (8) 1 — — 2 — —
Tax effect of adjustments (9) (11) — — (30) (0.03) (0.03)
Valuation allowance and other tax adjustments, net (10) 22 0.03 0.02 11 0.02 0.02
Adjusted net income (loss) $ 670 $ 0.84 $ 0.83 $ 1,264 $ 1.58 $ 1.58
Weighted average common shares (millions): (11) 801 803 801 802

27NEWMONT CORPORATIONSECOND QUARTER 2021 EARNINGS
EBITDA and Adjusted EBITDAManagement uses Earnings before interest, taxes and depreciation and amortization (“EBITDA”) and EBITDA adjusted for non-core or certain items that have a disproportionate impact on our results for a particular period (“Adjusted EBITDA”) as non-GAAP measures to evaluate the Company’s operating performance. EBITDA and Adjusted EBITDA do not represent, and should not be considered an alternative to, net income (loss), operating income (loss), or cash flow from operations as those terms are defined by GAAP, and do not necessarily indicate whether cash flows will be sufficient to fund cash needs. Although Adjusted EBITDA and similar measures are frequently used as measures of operations and the ability to meet debt service requirements by other companies, our calculation of Adjusted EBITDA is not necessarily comparable to such other similarly titled captions of other companies. The Company believes that Adjusted EBITDA provides useful information to investors and others in understanding and evaluating our operating results in the same manner as our management and Board of Directors. Management’s determination of the components of Adjusted EBITDA are evaluated periodically and based, in part, on a review of non-GAAP financial measures used by mining industry analysts. Net income (loss) attributable to Newmont stockholders is reconciled to EBITDA and Adjusted EBITDA as follows:
(1) Change in fair value of investments, included in Other income, net, primarily represents unrealized gains and losses related to the Company’s investment in current and non-current marketable and other equity securities. For additional information regarding our investments, see Note 15 of the Condensed Consolidated Financial Statements.
(2) (Gain) loss on asset and investment sales, included in Gain on asset and investment sales, net, primarily represents a gain on the sale of TMAC in 2021 and gains on the sale of Kalgoorlie and Continental in 2020. For additional information, see Note 8 of the Condensed Consolidated Financial Statements.
(3) Reclamation and remediation charges, included in Reclamation and remediation, represent revisions to reclamation and remediation plans at the Company's former operating properties and historic mining operations that have entered the closure phase and have no substantive future economic value.
(4) Impairment of long-lived and other assets, included in Other expense, net, represents non-cash write-downs of various assets that are no longer in use.
(5) Settlement costs, included in Other expense, net, are primarily comprised of a voluntary contribution made to the Republic of Suriname in 2021 and other certain costs associated with legal and other settlements in both periods presented.
(6) Restructuring and severance, included in Other expense, net, primarily represents severance and related costs associated with significant organizational or operating model changes implemented by the Company for all periods presented.
(7) COVID-19 specific costs, included in Other expense, net, primarily includes amounts distributed from Newmont Global Community Support Fund to help host communities, governments and employees combat the COVID-19 pandemic. For the three and six months ended June 30, 2021, Adjusted EBITDA has not been adjusted for $19 and $40 of incremental COVID-19 costs incurred as a result of actions taken to protect against the impacts of the COVID-19 pandemic at our operational sites. See Note 7 of the Condensed Consolidated Financial Statements for further information.
(8) Impairment of investments, included in Other income, net, primarily represents the other-than-temporary impairment of the TMAC investment recorded in 2020.
(9) Loss on debt extinguishment, included in Other income, net, primarily represents losses on the extinguishment of a portion of the 2022 Senior Notes and 2023 Senior Notes during 2020.
(10) Goldcorp transaction and integration costs, included in Other expense, net, primarily represents subsequent integration costs incurred during 2020 related to the Newmont Goldcorp transaction.
(11) Adjusted EBITDA has not been adjusted for cash care and maintenance costs, included in Care and maintenance, which represent costs incurred associated with certain mine sites being temporarily placed into care and maintenance in response to the COVID-19 pandemic. Cash care and maintenance costs were $2 and $2 during the three and six months ended June 30, 2021, respectively, relating to our Tanami mine site. Cash care and maintenance costs were $125 and $145 during the three and six months ended June 30, 2020, respectively, relating to our Musselwhite, Éléonore, Peñasquito, Yanacocha, and Cerro Negro mine sites.
Three Months Ended June 30,
Six Months EndedJune 30,
2021 2020 2021 2020
Net income (loss) attributable to Newmont stockholders $ 650 $ 344 $ 1,209 $ 1,166
Net income (loss) attributable to noncontrolling interests 11 3 31 5
Net loss (Income) from discontinued operations (10) 68 (31) 83
Equity loss (income) of affiliates (49) (29) (99) (66)
Income and mining tax expense (benefit) 341 164 576 141
Depreciation and amortization 561 528 1,114 1,093
Interest expense, net of capitalized interest 68 78 142 160
EBITDA $ 1,572 $ 1,156 $ 2,942 $ 2,582
Adjustments:
Change in fair value of investments (1) $ (26) $ (227) $ 84 $ (134)
(Gain) loss on asset and investment sales (2) — 1 (43) (592)
Reclamation and remediation adjustments (3) 20 — 30 —
Impairment of long-lived and other assets (4) 11 5 12 5
Settlement costs (5) 8 2 11 8
Restructuring and severance (6) 5 2 10 3
COVID-19 specific costs (7) 1 33 2 35
Impairment of investments (8) — — — 93
Loss on debt extinguishment (9) — 3 — 77
Goldcorp transaction and integration costs (10) — 7 — 23
Pension settlements — 2 — 2
Adjusted EBITDA (11) $ 1,591 $ 984 $ 3,048 $ 2,102

28NEWMONT CORPORATIONSECOND QUARTER 2021 EARNINGS
Free cash flow Management uses Free Cash Flow as a non-GAAP measure to analyze cash flows generated from operations. Free Cash Flow is Net cash provided by (used in) operating activities less Net cash provided by (used in) operating activities of discontinued operations less Additions to property, plant and mine development as presented on the Condensed Consolidated Statements of Cash Flows. The Company believes Free Cash Flow is also useful as one of the bases for comparing the Company’s performance with its competitors. Although Free Cash Flow and similar measures are frequently used as measures of cash flows generated from operations by other companies, the Company’s calculation of Free Cash Flow is not necessarily comparable to such other similarly titled captions of other companies.
The presentation of non-GAAP Free Cash Flow is not meant to be considered in isolation or as an alternative to net income as an indicator of the Company’s performance, or as an alternative to cash flows from operating activities as a measure of liquidity as those terms are defined by GAAP, and does not necessarily indicate whether cash flows will be sufficient to fund cash needs. The Company’s definition of Free Cash Flow is limited in that it does not represent residual cash flows available for discretionary expenditures due to the fact that the measure does not deduct the payments required for debt service and other contractual obligations or payments made for business acquisitions. Therefore, the Company believes it is important to view Free Cash Flow as a measure that provides supplemental information to the Company’s Condensed Consolidated Statements of Cash Flows.
The following table sets forth a reconciliation of Free Cash Flow, a non-GAAP financial measure, to Net cash provided by (used in) operating activities, which the Company believes to be the GAAP financial measure most directly comparable to Free Cash Flow, as well as information regarding Net cash provided by (used in) investing activities and Net cash provided by (used in) financing activities.
(1) Net cash provided by (used in) investing activities includes Additions to property, plant and mine development, which is included in the Company’s computation of Free Cash Flow.
Three Months EndedJune 30,
Six Months EndedJune 30,
2021 2020 2021 2020
Net cash provided by (used in) operating activities $ 995 $ 664 $ 1,836 $ 1,600
Less: Net cash used in (provided by) operating activities of discontinued operations (2) 4 (2) 7
Net cash provided by (used in) operating activities of continuing operations 993 668 1,834 1,607
Less: Additions to property, plant and mine development (415) (280) (814) (608)
Free Cash Flow $ 578 $ 388 $ 1,020 $ 999
Net cash provided by (used in) investing activities (1) $ (777) $ (284) $ (1,127) $ 839
Net cash provided by (used in) financing activities $ (1,155) $ (291) $ (1,666) $ (877)

29NEWMONT CORPORATIONSECOND QUARTER 2021 EARNINGS
Attributable Free cash flow Management uses Attributable Free Cash Flow as a non-GAAP measure to analyze cash flows generated from operations that are attributable to the Company. Attributable Free Cash Flow is Net cash provided by (used in) operating activities after deducting net cash flows from operations attributable to noncontrolling interests less Net cash provided by (used in) operating activities of discontinued operations after deducting net cash flows from discontinued operations attributable to noncontrolling interests less Additions to property, plant and mine development after deducting property, plant and mine development attributable to noncontrolling interests. The Company believes that Attributable Free Cash Flow is useful as one of the bases for comparing the Company’s performance with its competitors. Although Attributable Free Cash Flow and similar measures are frequently used as measures of cash flows generated from operations by other companies, the Company’s calculation of Attributable Free Cash Flow is not necessarily comparable to such other similarly titled captions of other companies.
The presentation of non-GAAP Attributable Free Cash Flow is not meant to be considered in isolation or as an alternative to Net income attributable to Newmont stockholders as an indicator of the Company’s performance, or as an alternative to Net cash provided by (used in) operating activities as a measure of liquidity as those terms are defined by GAAP, and does not necessarily indicate whether cash flows will be sufficient to fund cash needs. The Company’s definition of Attributable Free Cash Flow is limited in that it does not represent residual cash flows available for discretionary expenditures due to the fact that themeasure does not deduct the payments required for debt service and other contractual obligations or payments made for business acquisitions. Therefore, the Company believes it is important to view Attributable Free Cash Flow as a measure that provides supplemental information to the Company’s Condensed Consolidated Statements of Cash Flows.
The following tables set forth a reconciliation of Attributable Free Cash Flow, a non-GAAP financial measure, to Net cash provided by (used in) operating activities, which the Company believes to be the GAAP financial measure most directly comparable to Attributable Free Cash Flow, as well as information regarding Net cash provided by (used in) investing activities and Net cash provided by (used in) financing activities.
Three Months Ended June 30, 2021 Six Months Ended June 30, 2021
Consolidated
Attributable to noncontrolling
interests (1)
Attributable to Newmont
Stockholders Consolidated
Attributable to noncontrolling
interests (1)
Attributable to Newmont
Stockholders
Net cash provided by (used in) operating activities $ 995 $ (33) $ 962 $ 1,836 $ (53) $ 1,783
Less: Net cash used in (provided by) operating activities of discontinued operations (2) — (2) (2) — (2)
Net cash provided by (used in) operating activities of continuing operations 993 (33) 960 1,834 (53) 1,781
Less: Additions to property, plant and mine development (2) (415) 15 (400) (814) 31 (783)
Free Cash Flow $ 578 $ (18) $ 560 $ 1,020 $ (22) $ 998
Net cash provided by (used in) investing activities (3) $ (777) $ (1,127)
Net cash provided by (used in) financing activities $ (1,155) $ (1,666)
(1) Adjustment to eliminate a portion of Net cash provided by (used in) operating activities, Net cash provided by (used in) operating activities of discontinued operations and Additions to property, plant and mine development attributable to noncontrollinginterests, which relate to Yanacocha (48.65%) and Merian (25%).
(2) For the three months ended June 30, 2021 Yanacocha and Merian had total consolidated Additions to property, plant and mine development of $26 and $11, respectively, on a cash basis. For the six months ended June 30, 2021, Yanacocha and Merian had total consolidated Additions to property, plant and mine development of $54 and $22, respectively, on a cash basis.
(3) Net cash provided by (used in) investing activities includes Additions to property, plant and mine development, which is included in the Company’s computation of Free Cash Flow.

30NEWMONT CORPORATIONSECOND QUARTER 2021 EARNINGS
All-in Sustaining CostsNewmont has developed a metric that expands on GAAP measures, such as cost of goods sold, and non-GAAP measures, such as costs applicable to sales per ounce, to provide visibility into the economics of our mining operations related to expenditures, operating performance and the ability to generate cash flow from our continuing operations.
Current GAAP measures used in the mining industry, such as cost of goods sold, do not capture all of the expenditures incurred to discover, develop and sustain production. Therefore, we believe that all-in sustaining costs is a non-GAAP measure that provides additional information to management, investors and analysts that aids in the understanding of the economics of our operations and performance compared to other producers and provides investors visibility by better defining the total costs associated with production.
All-in sustaining cost (“AISC”) amounts are intended to provide additional information only and do not have any standardized meaning prescribed by GAAP and should not be considered in isolation or as a substitute for measures of performance prepared in accordance with GAAP. The measures are not necessarily indicative of operating profit or cash flow from operations as determined under GAAP. Other companies may calculate these measures differently as a result of differences in the underlying accounting principles, policies applied and in accounting frameworks such as in International Financial Reporting Standards (“IFRS”), or by reflecting the benefit from selling non-gold metals as a reduction to AISC. Differences may also arise related to definitional differences of sustaining versus development (i.e. non-sustaining) activities based upon each company’s internal policies.
The following disclosure provides information regarding the adjustments made in determining the all-in sustaining costs measure:
Costs applicable to sales. Includes all direct and indirect costs related to current production incurred to execute the current mine plan. We exclude certain exceptional or unusual amounts from Costs applicable to sales (“CAS”), such as significant revisions to recovery amounts. CAS includes by-product credits from certain metals obtained during the process of extracting and processing the primary ore-body. CAS is accounted for on an accrual basis and excludes Depreciation and amortization and Reclamation and remediation, which is consistent with our presentation of CAS on the Condensed Consolidated Statements of Operations. In determining AISC, only the CAS associated with producing and selling an ounce of gold is included in the measure. Therefore, the amount of gold CAS included in AISC is derived from the CAS presented in the Company’s Condensed Consolidated Statements of Operations less the amount of CAS attributable to the production of other metals at our Peñasquito, and Boddington mines. The other metals CAS at those mine sites isdisclosed in Note 3 of the Condensed Consolidated Financial Statements. The allocation of CAS between gold and other metals at the Peñasquito and Boddington mines is based upon the relative sales value of gold and other metals produced during the period.
Reclamation costs. Includes accretion expense related to reclamation liabilities and the amortization of the related Asset Retirement Cost (“ARC”) for the Company’s operating properties. Accretion related to the reclamation liabilities and the amortization of the ARC assets for reclamation does not reflect annual cash outflows but are calculated in accordance with GAAP. The accretion and amortization reflect the periodic costs of reclamation associated with current production and are therefore included in the measure. The allocation of these costs to gold and other metals is determined using the same allocation used in the allocation of CAS between gold and other metals at the Peñasquito and Boddington mines.
Advanced projects, research and development and exploration. Includes incurred expenses related to projects that are designed to sustain current production and exploration. We note that as current resources are depleted, exploration and advanced projects are necessary for us to replace the depleting reserves or enhance the recovery and processing of the current reserves to sustain production at existing operations. As these costs relate to sustaining our production, and are considered a continuing cost of a mining company, these costs are included in the AISC measure. These costs are derived from the Advanced projects, research and development and Exploration amounts presented in the Condensed Consolidated Statements of Operations less incurred expenses related to the development of new operations, or related to major projects at existing operations where these projects will materially benefit the operation in the future. The allocation of these costs to gold and other metals is determined using the same allocation used in the allocation of CAS between gold and other metals at the Peñasquito and Boddington mines. We also allocate these costs incurred at the Other North America, Other Australia and Corporate and Other locations using the proportion of CAS between gold and other metals.
General and administrative. Includes costs related to administrative tasks not directly related to current production, but rather related to supporting our corporate structure and fulfilling our obligations to operate as a public company. Including these expenses in the AISC metric provides visibility of the impact that general and administrative activities have on current operations and profitability on a per ounce basis. We allocate these costs to gold and other metals at the Other North America, Other Australia and Corporate and Other locations using the proportion of CAS between gold and other metals.
Care and maintenance and Other expense, net. Care and maintenance includes direct operating costs incurred at the mine sites during the period that these sites were temporarily placed into care and maintenance in response to the COVID-19 pandemic. For Other expense, net we exclude certain exceptional or unusual expenses, such as restructuring, as these are not indicative to sustaining our current operations. Furthermore, this adjustment to Other expense, net is also consistent with the nature of the adjustments made to Net income (loss) attributable to Newmont stockholders as disclosed in the Company’s non-GAAP financial measure Adjusted net income (loss). The allocation of these costs to gold and other metals is determined using the same allocation used in the allocation of CAS between gold and other metals at the Peñasquito and Boddington mines. We also allocate these costs incurred at the Other North America, Other Australia and Corporate and Other locations using the proportion of CAS between gold and other metals.
Treatment and refining costs. Includes costs paid to smelters for treatment and refining of our concentrates to produce the salable metal. These costs are presented net as a reduction of Sales on the Condensed Consolidated Statements of Operations. The allocation of these costs to gold and other metals is determined using the same allocation used in the allocation of CAS between gold and other metals at the Peñasquito, and Boddington mines.
Sustaining capital and finance lease payments. We determined sustaining capital and finance lease payments as those capital expenditures and finance lease payments that are necessary to maintain current production and execute the current mine plan. We determined development (i.e. non-sustaining) capital expenditures and finance lease payments to be those payments used to develop new operations or related to projects at existing operations where those projects will materially benefit the operation and are excluded from the calculation of AISC. The classification of sustaining and development capital projects and finance leases is based on a systematic review of our project portfolio in light of the nature of each project. Sustaining capital and finance lease payments are relevant to the AISC metric as these are needed to maintain the Company’s current operations and provide improved transparency related to our ability to finance these expenditures from current operations. The allocation of these costs to gold and other metals is determined using the same allocation used in the allocation of CAS between gold and other metals at the Peñasquito and Boddington mines. We also allocate these costs incurred at the Other North America, Other Australia and Corporate and Other locations using the proportion of CAS between gold and other metals.

31NEWMONT CORPORATIONSECOND QUARTER 2021 EARNINGS
All-in Sustaining Costs
(1) Excludes Depreciation and amortization and Reclamation and remediation.(2) Includes by-product credits of $74 and excludes co-product revenues of
$435.(3) Includes stockpile and leach pad inventory adjustments of $5 at CC&V.(4) Reclamation costs include operating accretion and amortization of asset
retirement costs of $20 and $31, respectively, and exclude accretion and reclamation and remediation adjustments at former operating properties that have entered the closure phase and have no substantive future economic value of $13 and $24, respectively.
(5) Advanced projects, research and development and Exploration excludes development expenditures of $1 at CC&V, $2 at Porcupine, $1 at Éléonore, $2 at Other North America, $3 at Yanacocha, $1 at Cerro Negro, $9 at Other South America, $7 at Tanami, $4 at Other Australia, $4 at Ahafo, $1 at Akyem, $4 at NGM and $4 at Corporate and Other, totaling $43 related to developing new operations or major projects at existing operations where these projects will materially benefit the operation.
(6) Care and maintenance includes $2 at Tanami of cash care and maintenance costs associated with the site temporarily being placed into care and maintenance or operating at reduced levels in response to the COVID-19 pandemic, during the period ended June 30, 2021 that we would have continued to incur if the site were not temporarily placed into care and maintenance.
(7) Other expense, net includes incremental COVID-19 costs incurred as a result of actions taken to protect against the impacts of the COVID-19 pandemic at our operational sites of $6 for North America, $11 for South America and $2 for Africa, totaling $19.
(8) Other expense, net is adjusted for impairment of long-lived and other assets of $11, settlement costs of $8, restructuring and severance of $5 and distributions from the Newmont Global Community Support Fund of $1.
(9) Includes sustaining capital expenditures of $74 for North America, $30 for South America, $58 for Australia, $29 for Africa, $54 for Nevada, and $6 for Corporate and Other, totaling $251 and excludes development capital expenditures, capitalized interest and the change in accrued capital totaling $164. The following are major development projects: Pamour, Yanacocha Sulfides, Quecher Main, Cerro Negro expansion projects, Tanami Expansion 2, Subika Mining Method Change, Ahafo North, Goldrush Complex and Turquoise Ridge 3rd shaft.
(10) Includes finance lease payments for sustaining projects of $17.(11) Per ounce measures may not recalculate due to rounding.(12) Gold equivalent ounces is calculated as pounds or ounces produced
multiplied by the ratio of the other metals price to the gold price, using Gold ($1,200/oz.), Copper ($2.75/lb.), Silver ($22.00/oz.), Lead ($0.90/lb.) and Zinc ($1.05/lb.) pricing for 2021.
Three Months EndedJune 30, 2021
Costs
Applicable to
Sales(1)(2)(3)
Reclamation
Costs(4)
Advanced Projects,
Research and
Development and
Exploration(5)
General and
Administrative
Care and
Maintenance
and Other
Expense,
Net(6)(7)(8)
Treatment
and
Refining
Costs
Sustaining
Capital and
Lease
Related
Costs(9)(10)
All-In
Sustaining
Costs
Ounces
(000)
Sold
All-In
Sustaining
Costs Per
oz.(11)
Gold
CC&V $ 59 $ 1 $ 5 $ — $ — $ — $ 7 $ 72 63 $ 1,142
Musselwhite 37 1 2 — 1 — 9 50 35 1,420
Porcupine 61 1 5 — — — 13 80 66 1,193
Éléonore 65 — 1 — 1 — 19 86 67 1,287
Peñasquito 95 2 — — 1 5 14 117 181 656
Other North America — — (1) — 1 — — — — —
North America 317 5 12 — 4 5 62 405 412 985
Yanacocha 32 24 — — 8 — 6 70 68 1,029
Merian 83 1 3 — 2 — 10 99 108 909
Cerro Negro 69 2 — — 4 — 14 89 79 1,133
Other South America — — — 2 1 — — 3 — —
South America 184 27 3 2 15 — 30 261 255 1,022
Boddington 162 3 1 — — 3 24 193 189 1,023
Tanami 65 1 1 — 2 — 30 99 109 919
Other Australia — — — 2 1 — 2 5 — —
Australia 227 4 2 2 3 3 56 297 298 997
Ahafo 92 2 1 — 2 — 19 116 104 1,122
Akyem 56 7 1 — 1 — 11 76 90 828
Other Africa — — 1 2 — — — 3 — —
Africa 148 9 3 2 3 — 30 195 194 1,000
Nevada Gold Mines 215 3 4 2 2 — 54 280 285 985
Nevada 215 3 4 2 2 — 54 280 285 985
Corporate and Other — — 14 38 (2) — 5 55 — —
Total Gold $ 1,091 $ 48 $ 38 $ 46 $ 25 $ 8 $ 237 $ 1,493 1,444 $ 1,035
Gold equivalent ounces -
other metals (12)
Peñasquito $ 152 $ 3 $ 1 $ — $ 2 $ 14 $ 25 $ 197 260 $ 755
Other North America — — — 1 — — — 1 — —
North America 152 3 1 1 2 14 25 198 260 761
Boddington 38 — 1 — — 2 5 46 42 1,088
Other Australia — — — 1 — — — 1 — —
Australia 38 — 1 1 — 2 5 47 42 1,113
Corporate and Other — — 6 16 — — 1 23 — —
Total Gold Equivalent Ounces $ 190 $ 3 $ 8 $ 18 $ 2 $ 16 $ 31 $ 268 302 $ 886
Consolidated $ 1,281 $ 51 $ 46 $ 64 $ 27 $ 24 $ 268 $ 1,761

32NEWMONT CORPORATIONSECOND QUARTER 2021 EARNINGS
All-in Sustaining Costs
Six Months EndedJune 30, 2021
Costs
Applicable to
Sales(1)(2)(3)
Reclamation
Costs(4)
Advanced Projects,
Research and
Development and
Exploration(5)
General and
Administrative
Care and
Maintenance
and Other
Expense,
Net(6)(7)(8)
Treatment
and
Refining
Costs
Sustaining
Capital and
Lease
Related
Costs(9)(10)
All-In
Sustaining
Costs
Ounces
(000)
Sold
All-In
Sustaining
Costs Per
oz.(11)
Gold
CC&V $ 120 $ 3 $ 5 $ — $ — $ — $ 16 $ 144 119 $ 1,209
Musselwhite 76 1 4 — 1 — 18 100 74 1,359
Porcupine 127 2 9 — — — 22 160 140 1,146
Éléonore 118 1 2 — 3 — 37 161 128 1,258
Peñasquito 184 4 1 — 4 15 30 238 371 644
Other North America — — — 2 1 — — 3 — —
North America 625 11 21 2 9 15 123 806 832 971
Yanacocha 82 36 2 — 16 — 8 144 129 1,117
Merian 164 2 3 — 3 — 20 192 216 887
Cerro Negro 109 3 1 — 10 — 25 148 126 1,181
Other South America — — — 4 2 — — 6 — —
South America 355 41 6 4 31 — 53 490 471 1,041
Boddington 293 6 3 — — 6 80 388 335 1,157
Tanami 135 1 2 — 3 — 55 196 231 854
Other Australia — — — 5 1 — 3 9 — —
Australia 428 7 5 5 4 6 138 593 566 1,048
Ahafo 184 4 3 — 3 — 36 230 208 1,108
Akyem 122 15 1 — 1 — 19 158 194 806
Other Africa — — 1 4 — — — 5 — —
Africa 306 19 5 4 4 — 55 393 402 974
Nevada Gold Mines 442 5 6 5 2 — 85 545 590 924
Nevada 442 5 6 5 2 — 85 545 590 924
Corporate and Other — — 39 91 — — 8 138 — —
Total Gold $ 2,156 $ 83 $ 82 $ 111 $ 50 $ 21 $ 462 $ 2,965 2,861 $ 1,037
Gold equivalent ounces -
other metals (12)
Peñasquito $ 307 $ 5 $ 1 $ — $ 6 $ 57 $ 48 $ 424 558 $ 760
Other North America — — — 1 — — — 1 — —
North America 307 5 1 1 6 57 48 425 558 762
Boddington 65 1 1 — — 3 17 87 71 1,216
Other Australia — — — 1 — — — 1 — —
Australia 65 1 1 1 — 3 17 88 71 1,231
Corporate and Other 6 16 — 1 23 — —
Total Gold Equivalent Ounces $ 372 $ 6 $ 8 $ 18 $ 6 $ 60 $ 66 $ 536 629 $ 851
Consolidated $ 2,528 $ 89 $ 90 $ 129 $ 56 $ 81 $ 528 $ 3,501
(1) Excludes Depreciation and amortization and Reclamation and remediation.(2) Includes by-product credits of $130 and excludes co-product revenues of
$825.(3) Includes stockpile and leach pad inventory adjustments of $9 at CC&V and
$10 at NGM.(4) Reclamation costs include operating accretion and amortization of asset
retirement costs of $40 and $49, respectively, and exclude accretion and reclamation and remediation adjustments at former operating properties that have entered the closure phase and have no substantive future economic value of $26 and $37, respectively.
(5) Advanced projects, research and development and Exploration excludes development expenditures of $3 at CC&V, $3 at Porcupine, $2 at Éléonore, $2 at Other North America, $4 at Yanacocha, $1 at Merian, $1 at Cerro Negro, $15 at Other South America, $9 at Tanami, $6 at Other Australia, $5 at Ahafo, $2 at Akyem, $8 at NGM and $4 at Corporate and Other, totaling $65 related to developing new operations or major projects at existing operations where these projects will materially benefit the operation.
(6) Care and maintenance includes $2 at Tanami of cash care and maintenance costs associated with the site temporarily being placed into care and maintenance or operating at reduced levels in response to the COVID-19 pandemic, during the period ended June 30, 2021 that we would have continued to incur if the site were not temporarily placed into care and maintenance.
(7) Other expense, net includes incremental COVID-19 costs incurred as a result of actions taken to protect against the impacts of the COVID-19 pandemic at our operational sites of $13 for North America, $23 for South America, $1 for Australia and $3 for Africa, totaling $40.
(8) Other expense, net is adjusted for impairment of long-lived and other assets of $12, settlement costs of $11, restructuring and severance costs of $10 and distributions from the Newmont Global Community Support Fund of $2.
(9) Includes sustaining capital expenditures of $147 for North America, $53 for South America, $146 for Australia, $54 for Africa, $85 for Nevada, and $9 for Corporate and Other, totaling $494 and excludes development capital expenditures, capitalized interest and the change in accrued capital totaling $320. The following are major development projects: Pamour, Yanacocha Sulfides, Quecher Main, Cerro Negro expansion projects, Tanami Expansion 2, Subika Mining Method Change, Ahafo North, Goldrush Complex and Turquoise Ridge 3rd shaft.
(10) Includes finance lease payments for sustaining projects of $34.(11) Per ounce measures may not recalculate due to rounding.(12) Gold equivalent ounces is calculated as pounds or ounces produced
multiplied by the ratio of the other metals price to the gold price, using Gold ($1,200/oz.), Copper ($2.75/lb.), Silver ($22.00/oz.), Lead ($0.90/lb.) and Zinc ($1.05/lb.) pricing for 2021.

33NEWMONT CORPORATIONSECOND QUARTER 2021 EARNINGS
Gold All-in Sustaining Costs - 2021 OutlookA reconciliation of the 2021 Gold AISC outlook to the 2021 Gold CAS outlook are provided below. The estimates in the table below are considered “forward-looking statements” within the meaning of Section 27A of the Securities Act of 1933, as amended, and Section 21E of the Securities Exchange Act of 1934, as amended, which are intended to be covered by the safe harbor created by such sections and other applicable laws.
(1) Excludes Depreciation and amortization and Reclamation and remediation.
(2) Includes stockpile and leach pad inventory adjustments.
(3) Reclamation costs include operating accretion and amortization of asset retirement costs.
(4) Advanced Project and Exploration excludes non-sustaining advanced projects and exploration.
(5) Includes stock-based compensation.
(6) Excludes development capital expenditures, capitalized interest and change in accrued capital.
(7) The reconciliation is provided for illustrative purposes in order to better describe management’s estimates of the components of the calculation. Estimates for each component of the forward-looking All-in sustaining costs per ounce are independently calculated and, as a result, the total All-in sustaining costs and the All-in sustaining costs per ounce may not sum to the component ranges. While a reconciliation to the most directly comparable GAAP measure has been provided for 2021 AISC Gold and Co-Product Outlook on a consolidated basis, a reconciliation has not been provided on an individual site or project basis in reliance on Item 10(e)(1)(i)(B) of Regulation S-K because such reconciliation is not available without unreasonable efforts.
(8) All values are presented on a consolidated basis for Newmont.
(9) Consolidated production for Yanacocha and Merian is presented on a total production basis for the mine site and excludes production from Pueblo Viejo.
2021 Outlook - Gold (7)(8)
(in millions, except ounces and per ounce) Outlook Estimate
Cost Applicable to Sales (1)(2) $ 4,750
Reclamation Costs (3) 150
Advanced Projects & Exploration (4) 150
General and Administrative (5) 230
Other Expense 20
Treatment and Refining Costs 50
Sustaining Capital (6) 870
Sustaining Finance Lease Payments 30
All-in Sustaining Costs $ 6,250
Ounces (000) Sold (9) 6,400
All-in Sustaining Costs per Oz $ 970

34NEWMONT CORPORATIONSECOND QUARTER 2021 EARNINGS
Co-Product All-in Sustaining Costs - 2021 OutlookA reconciliation of the 2021 Co-products AISC outlook to the 2021 Co-Products CAS outlook is provided below. The estimates in the table below are considered “forward-looking statements” within the 27A of the Securities Act of 1933, as amended, and Section 21E of the Securities Exchange Act of 1934, as amended, which are intended to be covered by the safe harbor created by such sections and other applicable laws.
(1) Excludes Depreciation and amortization and Reclamation and remediation.
(2) Includes stockpile and leach pad inventory adjustments.
(3) Reclamation costs include operating accretion and amortization of asset retirement costs.
(4) Advanced Project and Exploration excludes non-sustaining advanced projects and exploration.
(5) Includes stock-based compensation.
(6) Excludes development capital expenditures, capitalized interest and change in accrued capital.
(7) The reconciliation is provided for illustrative purposes in order to better describe management’s estimates of the components of the calculation. Estimates for each component of the forward-looking All-in sustaining costs per ounce are independently calculated and, as a result, the total All-in sustaining costs and the All-in sustaining costs per ounce may not sum to the component ranges. While a reconciliation to the most directly comparable GAAP measure has been provided for 2021 AISC Gold and Co-Product Outlook on a consolidated basis, a reconciliation has not been provided on an individual site or project basis in reliance on Item 10(e)(1)(i)(B) of Regulation S-K because such reconciliation is not available without unreasonable efforts.
(8) All values are presented on a consolidated basis for Newmont.
(9) Co-Product GEO are all non-gold co-products (Peñasquito silver, zinc, lead, Boddington copper).
2021 Outlook - Co-Product (7)(8)
(in millions, except ounces and per ounce) Outlook Estimate
Cost Applicable to Sales (1)(2) $ 790
Reclamation Costs (3) 10
Advanced Projects & Exploration (4) 10
General and Administrative (5) 30
Other Expense —
Treatment and Refining Costs 160
Sustaining Capital (6) 130
Sustaining Finance Lease Payments 20
All-in Sustaining Costs $ 1,150
Co-Product GEO (000) Sold (9) 1,300
All-in Sustaining Costs per Co Product GEO $ 880

35NEWMONT CORPORATIONSECOND QUARTER 2021 EARNINGS
Net Debt to Adjusted EBITDA RatioManagement uses net debt to Adjusted EBITDA as non-GAAP measures to evaluate the Company’s operating performance, including our ability to generate earnings sufficient to service our debt. Net debt to Adjusted EBITDA represents the ratio of the Company’s debt, net of cash and cash equivalents, to Adjusted EBITDA. Net debt to Adjusted EBITDA does not represent, and should not be considered an alternative to, net income (loss), operating income (loss), or cash flow from operations as those terms are defined by GAAP, and does not necessarily indicate whether cash flows will be sufficient to fund cash needs. Although Net Debt to Adjusted EBITDA and similar measures are frequently used as measures of operations and the ability to meet debt service requirements by other companies, our calculation of net debt to Adjusted EBITDA measure is not necessarily comparable to such other similarly titled captions of other companies. The Company believes that net debt to Adjusted EBITDA provides useful information to investors and others in understanding and evaluating our operating results in the same manner as our management and Board of Directors. Management’s determination of the components of net debt to Adjusted EBITDA is evaluated periodically and based, in part, on a review of non-GAAP financial measures used by mining industry analysts. Net income (loss) attributable to Newmont stockholders is reconciled to Adjusted EBITDA as follows:
Three Months Ended
June 30, 2021 March 31, 2021 December 31, 2020 September 30, 2020
Net income (loss) attributable to Newmont stockholders $ 650 $ 559 $ 824 $ 839
Net income (loss) attributable to noncontrolling interests 11 20 (60) 17
Net loss (income) from discontinued operations (10) (21) (18) (228)
Equity loss (income) of affiliates (49) 50 (70) (53)
Income and mining tax expense (benefit) 341 235 258 305
Depreciation and amortization 561 553 615 592
Interest expense, net of capitalized interest 68 74 73 75
EBITDA 1,572 1,370 1,622 1,547
EBITDA Adjustments:
Change in fair value of investments (26) 110 (61) (57)
Reclamation and remediation charges 20 10 213 —
Impairment of long-lived and other assets 11 1 20 24
Settlement costs 8 3 24 26
Restructuring and severance 5 5 6 9
COVID-19 specific costs 1 1 25 32
Loss (gain) on asset and investment sales — (43) (84) (1)
Pension settlements — — 7 83
Adjusted EBITDA 1,591 1,457 1,772 1,663
12 month trailing Adjusted EBITDA $ 6,483
Total Debt $ 5,480
Lease and other financing obligations 677
Less: Cash and cash equivalents 4,583
Total net debt $ 1,574
Net debt to adjusted EBITDA 0.2

36NEWMONT CORPORATIONSECOND QUARTER 2021 EARNINGS
EndnotesInvestors are encouraged to read the information contained in this presentation in conjunction with the most recent Form 10-Q for the quarter ended June 30, 2021 filed with the SEC on July 22, 2021, and with the Cautionary Statement on slide 2 and the following notes below
Outlook Assumptions. Outlook and projections used in this presentation are considered forward-looking statements and represent management’s good faith estimates or expectations based upon certain assumptions, including, but not limited to, metal prices, oil prices, certain exchange rates and other assumptions. For example, 2021 Outlook assumes $1,200/oz Au, $22/oz Ag, $2.75/lb Cu, $1.05/lb Zn, $0.90/lb Pb, $0.75 USD/AUD exchange rate, $0.77 USD/CAD exchange rate and $50/barrel WTI; AISC and CAS estimates do not include inflation, for the remainder of the year. Production, CAS, AISC and capital estimates exclude projects that have not yet been approved, except for Yanacocha Sulfides which is included in Outlook as the development projects are expected to reach execution stage in 2021. The potential impact on inventory valuation as a result of lower prices, input costs, and project decisions are not included as part of this Outlook. Assumptions used for purposes of Outlook may prove to be incorrect and actual results may differ from those anticipated, including variation beyond a +/-5% range. Investors are cautioned that operating and financial performance may vary materially from outlook as a result of the evolving COVID-19 pandemic, See COVID-19 endnote below. Investors are cautioned not to place undue reliance upon Outlook and forward-looking statements as there can be no assurance that the plans, assumptions or expectations upon which they are placed will occur.
COVID-19. While the medical community is progressing development of vaccines and other treatment options and governmental agencies, private agencies and the Company seek to mitigate the spread of COVID-19, the availability, efficacy and timing of such measures remains uncertain. The extent to which COVID-19 will impact the Company in the future will depend on future developments, which are highly uncertain and cannot be predicted. Efforts to slow the spread of COVID-19 have already impacted the operation of Newmont’s mines and the development of projects and impacted exploration activities. For companies, such as Newmont, that operate in multiple jurisdictions, disadvantage and risk of loss due to the limitations of certain local health systems and infrastructure to contain diseases and potential endemic health issues may occur. Impacts of changing government restriction as a result of COVID-19 and potential subsequent pandemic waves could include additional travel restraints, more stringent product shipment restraints, delays in product refining and smelting due to restrictions or temporary closures, other supply chain disruptions and workforce interruptions, including healthy and safety considerations, and reputational damage in connection with challenges or reactions to action or perceived inaction by the Company related to the COVID-19 pandemic, which could have a material adverse effect on the Company’s cash flows, earnings, results of operations. No assurances can be provided that the Company’s operations, exploration plans and drilling programs, and other outlook will not be impacted by COVID-19 in the future.
World-class asset: Defined as +500k GEO’s/year consolidated; <$900/oz AISC, mine life >10 years in countries classified in the A and B rating ranges for each of Moody’s, S&P and Fitch
Dividend. Our future 2021 dividends have not yet been approved or declared by the Board of Directors. An annualized dividend payout level has not been declared by the Board and is non-binding. The Company’s dividend framework is non-binding. Management’s expectations with respect to future dividends, annualized dividends or dividend yield are “forward-looking statements.” The declaration and payment of future dividends remain at the discretion of the Board of Directors and will be determined based on Newmont’s financial results, balance sheet strength, cash and liquidity requirements, future prospects, gold and commodity prices, and other factors deemed relevant by the Board. The duration, scope and impact of COIVD-19 presents additional uncertainties with respect to future dividends and no assurance is being provided that the Company will pay future dividends at the increased payment level. The Board of Directors reserves all powers related to the declaration and payment of dividends. Consequently, in determining the dividend to be declared and paid on the common stock of the Company, the Board of Directors may revise or terminate the payment level at any time without prior notice.
Share Repurchase Program. Investors are also cautioned that the extent to which the Company repurchases its shares, and the timing of such repurchases, will depend upon a variety of factors, including trading volume, market conditions, legal requirements, business conditions and other factors. The repurchase program announced in January 2021 may be discontinued at any time, and the program does not obligate the Company to acquire any specific number of shares of its common stock or to repurchase the full $1.0 billion amount during the 18 month authorization period. Consequently, the Board of Directors may revise or terminate such share repurchase authorization in the future.
Gold equivalent ounces (GEOs) are calculated as pounds or ounces produced multiplied by the ratio of the other metal’s price to the gold price, using Gold ($1,200/oz.), Copper ($2.75/lb.), Silver ($22/oz.), Lead ($0.90/lb.), and Zinc ($1.05/lb.) pricing.
Reserves and Resources gold equivalent ounces (GEO’s): Gold Equivalent Ounces calculated using Mineral Reserve pricing: Gold ($1,200/oz.), Copper ($2.75/lb.), Silver ($17/oz.), Lead ($0.90/lb.), and Zinc ($1.15/lb.) and Resource pricing Gold ($1,400/oz.), Copper ($3.25/lb.), Silver ($20/oz.), Lead ($1.10/lb.), and Zinc ($1.40/lb.) and metallurgical recoveries for each metal on a site-by-site basis as metal * [(metal price * metal recovery) / (gold price * gold recovery)].
37NEWMONT CORPORATIONSECOND QUARTER 2021 EARNINGS
EndnotesReserves Estimates: The reserves stated in this presentation were prepared in compliance with Industry Guide 7 published by the United States SEC and represent the amount of gold, copper, silver, lead and zinc that we estimated, at December 31, 2020, could be economically and legally extracted or produced at the time of the reserve determination. The term “economically,” as used in this definition, means that profitable extraction or production has been established or analytically demonstrated in a feasibility study to be viable and justifiable under reasonable investment and market assumptions. The term “legally,” as used in this definition, does not imply that all permits needed for mining and processing have been obtained or that other legal issues have been completely resolved. However, for a reserve to exist, Newmont must have a justifiable expectation, based on applicable laws and regulations, that issuance of permits or resolution of legal issues necessary for mining and processing at a particular deposit will be accomplished in the ordinary course and in a timeframe consistent with Newmont’s current mine plans. Reserves in this presentation are aggregated from the proven and probable classes. The term “Proven Reserves” used in the tables of the appendix means reserves for which (a) quantity is estimated from dimensions revealed in outcrops, trenches, workings or drill holes; (b) grade and/or quality are estimated from the results of detailed sampling; and (c) the sites for inspection, sampling and measurements are spaced so closely and the geologic character is sufficiently defined that size, shape, depth and mineral content of reserves are well established. The term “Probable Reserves” means reserves for which quantity and grade are estimated from information similar to that used for proven reserves, but the sites for sampling are farther apart or are otherwise less closely spaced. The degree of assurance, although lower than that for proven reserves, is high enough to assume continuity between points of observation. Newmont classifies all reserves as Probable on its development projects until a year of production has confirmed all assumptions made in the reserve estimates. Proven and Probable reserves include gold, copper, silver, zinc, lead or molybdenum attributable to Newmont’s ownership or economic interest. Proven and probable reserves were calculated using cut-off grades. The term “cutoff grade” means the lowest grade of mineralized material considered economic to process. Cut-off grades vary between deposits depending upon prevailing economic conditions, mineability of the deposit, by-products, amenability of the ore to gold, copper, silver, zinc, lead, molybdenum extraction and type of milling or leaching facilities available.
Estimates of proven and probable reserves are subject to considerable uncertainty. Such estimates are, or will be, to a large extent, based on the prices of gold, silver, copper, zinc and lead and interpretations of geologic data obtained from drill holes and other exploration techniques, which data may not necessarily be indicative of future results. If our reserve estimations are required to be revised using significantly lower gold, silver, zinc, copper and lead prices as a result of a decrease in commodity prices, increases in operating costs, reductions in metallurgical recovery or other modifying factors, this could result in material write-downs of our investment in mining properties, goodwill and increased amortization, reclamation and closure charges. Producers use feasibility studies for undeveloped ore bodies to derive estimates of capital and operating costs based upon anticipated tonnage and grades of ore to be mined and processed, the predicted configuration of the ore body, expected recovery rates of metals from the ore, the costs of comparable facilities, the costs of operating and processing equipment and other factors. Actual operating and capital cost and economic returns on projects may differ significantly from original estimates. Further, it may take many years from the initial phases of exploration until commencement of production, during which time, the economic feasibility of production may change.
It is noted that US SEC has adopted amendments to the disclosure requirements for mining registrants. Under these new rules, SEC Industry Guide 7 will be rescinded and replaced with the disclosure standards under new Regulation S-K Subpart 1300. SEC Industry Guide 7 remains in effect, subject to a transition period. Newmont will be required to comply with the new rules for fiscal years 2021 and after. As such, reserve disclosures presented herein have been prepared in accordance with the SEC’s Industry Guide 7. Whereas reserve disclosures as at December 31, 2021 are expected to be presented in in accordance with the new Regulation S-K 1300 requirements of the SEC. Accordingly, future adjustment to estimates of reserves or mineralized material will occur due to the differing standards under the new requirements.
Notice to US Investors: While Newmont’s reserves were prepared in compliance with Industry Guide 7, the term resource, measured resource, indicated resources and inferred resources are not SEC recognized terms. Investors are advised that the SEC does not recognize these terms and “resources” have not been prepared in accordance with Industry Guide 7. Newmont has determined that such “resources” would be substantively the same as those prepared using the Guidelines established by the Society of Mining, Metallurgy and Exploration (SME) and defined as “Mineral Resource”. Estimates of resources are subject to further exploration and development, are subject to additional risks, and no assurance can be given that they will eventually convert to future reserves. Inferred Resources, in particular, have a great amount of uncertainty as to their existence and their economic and legal feasibility. Investors are cautioned not to assume that any part or all of the Inferred Resource exists or is economically or legally mineable. Also, disclosure of contained ounces is permitted under the SME Guideline and other regulatory guidelines, such as Canada’s NI 43-101 and Australia’s JORC. However, the SEC generally requires mineral resource information in SEC-filed documents to be reported only as in-place tonnage and grade. Investors are reminded that even if significant mineralization is discovered and converted to resource or reserves, during the time necessary to ultimately move such mineralization to production the economic feasibility of production may change.
Investors are encouraged to see the Company’s “Proven and Probable Reserve” and “Mineralized Material” tables prepared in compliance with the SEC’s Industry Guide 7, available at www.newmont.com. For more information investors are also encouraged to refer to the Company’s Annual Report to be filed with the SEC on February 18, 2021, which includes Proven and Probable reserve tables and Mineralized Material tables, as well as discussion of risks under the heading "Risk Factors", which will be available at www.sec.gov or on the Company’s website at www.newmont.com.

38NEWMONT CORPORATIONSECOND QUARTER 2021 EARNINGS
EndnotesAdjusted Net Income is a non-GAAP metric. Adjusted Net Income per share refers to Adjusted Net Income per diluted share. See appendix for more information and reconciliation to the nearest GAAP metric.
Free Cash Flow. FCF or Free cash flow are used herein is a forward-looking statement and is subject to risks and uncertainties. FCF is a non-GAAP metric and is generated from Net cash provided from operating activities of continuing operations less Additions to property, plant and mine development. See appendix for more information and for a reconciliation to the nearest GAAP metric.
Attributable Free Cash Flow. Attributable FCF or Attributable Free cash flow are used herein is a forward-looking statement and is subject to risks and uncertainties. Attributable FCF is a non-GAAP metric and is generated from Net cash provided from operating activities of continuing operations on an attributable basis less Additions to property, plant and mine development on an attributable basis. See appendix for more information and for a reconciliation to the nearest GAAP metric.
All-in Sustaining Cost. AISC or All-in sustaining cost is a non-GAAP metric. See appendix for more information and a reconciliation to the nearest GAAP metric. AISC as used in the Company’s outlook is a forward-looking statement and is therefore subject to uncertainties. AISC a non-GAAP metric defined as the sum of cost applicable to sales (including all direct and indirect costs related to current gold production incurred to execute on the current mine plan), remediation costs (including operating accretion and amortization of asset retirement costs), G&A, exploration expense, advanced projects and R&D, treatment and refining costs, other expense, net of one-time adjustments, sustaining capital and finance lease payments. See appendix for more information and a reconciliation of 2021 AISC outlook to the 2021 CAS outlook.
EBITDA and Adjusted EBITDA are a non-GAAP financial measures. EBITDA is calculated as Earnings before interest, taxes and depreciation and amortization. For management’s EBITDA and Adjusted EBITDA calculations and reconciliation to the nearest GAAP metric, please see appendix for more information. Please also refer also to appendix for a reconciliation of Adjusted EBITDA to the nearest GAAP metric.
Full Potential. Full Potential improvement value creation is considered an operating measure provided for illustrative purposes, and should not be considered GAAP or non-GAAP financial measures. Full Potential amounts are estimates utilized by management that represent estimated cumulative incremental value realized as a result of Full Potential projects implemented and are based upon both cost savings and efficiencies that have been monetized for purposes of the estimation. Because Full Potential improvement estimates reflect differences between certain actual costs incurred and management estimates of costs that would have been incurred in the absence of the Full Potential program, such estimates are necessarily imprecise and are based on numerous judgments and assumptions. Expectations of the results of Full Potential savings, synergies or improvements are forward-looking statements and subject to risks and uncertainties.
Sustainalytics. Sustainalytics ESG ranking is based on publicly disclosed data available from Bloomberg terminal data accessed July 16, 2021.
Third-Party Data. This presentation may contain industry, market and competitive position data which have come from a third-party sources. For example, references to the Company’s ranking as the #2 most transparent company on S&P 500 Index is sourced from the Bloomberg ESG disclosure rankings. Third party industry publications, studies and surveys generally state that the data contained therein have been obtained from sources believed to be reliable, but that there is no guarantee of the accuracy or completeness of such data. While Newmont believes that such information has been prepared by a reputable


