Page 1
Secondary School Education in Assam (India) with Special Reference to
Mathematics
N R Das
Professor
Department of Mathematics
Gauhati University
Guwahati
Assam
&
Karuna Baruah ([email protected] )
Senior Lecturer
Department of Mathematics
Barbhag College
Nalbari Assam 781347
Page 2
1
Secondary school education in Assam with special reference to mathematics
N R Das1 Karuna Baruah
2
1 Professor, Department of Mathematics, Gauhati University
2 Senior Lecturer, Department of Mathematics, Barbhag College
Abstract
This paper describes the prevailing academic scenarios of a representative group of secondary
schools in Assam (India) with special references to students performance in general and
mathematics performance in particular. The state of Assam is one of the economically
backward regions of India and is witnessing socio-political disturbances mainly centered with
younger population. Object oriented education leading ensured employment is expected to
reduce the present social crisis in this region. Appropriate secondary school knowledge
backed by perfect learning in mathematics can make students competent for future career.
Investigation of prevailing education scenario vis-à-vis mathematics performance of students
of 21 representative schools of Assam revealed wide variations of academic environment
amongst the school so also the variations of performances. The financial and managerial
statuses of the schools seem to be major factors influencing academic performance. In
general, academic performances as well as mathematics performances of the government and
private schools are better than the schools not getting government aids. The study also
revealed that mathematics performances of schools are positively correlated with (a) the
academic performance of school indicated by school leaving pass percentage and also (b)
with the performances in subjects other than mathematics. On the other hand, students and
teacher ratio seems not to affect the mathematics performance of the schools. Improvement of
the performance of secondary school in Assam is required considering the societal needs.
Page 3
2
Introduction
Education is considered as an important index to measure societal development. This
is the reason that education is taken as priority sector for development by all nations. Every
nation develops the system of education to express and promote its unique socio-cultural
identity and also to meet the challenges of the times. The role of educational development in
mitigating several problems of the human society has been realized at all levels. School
education is an important segment of the whole educational structure and it is considered as a
powerful instrument to develop students’ behavior and hence the society.
There have been many studies related to education issues in India. While discussing
the education and cast in India, Chauhan (2008) pointed that low school enrolment and
completion rates, high dropout and failure rates are reported are the characteristics amongst
the weaker section of the society. Shortcoming related to teaching staff has also been
identified as the major problems in effective teaching learning (Desai, 1999). Despite of
government’s effort to provide uniform level of education for its citizen, non-uniform
academic experiences of students belonging to different schools are evident in India. Such
differences are not only between urban and rural schools, but also amongst the schools
having similar location. The existences of varying academic experiences viz., rich and poor,
rural and urban in India are also reported (Banaji S. 2005). The micro level investigations are
also conducted to assist effective teaching-learning in India. The importance of curriculum
reform through changes in evaluation process in effective teaching-learning process is
evidenced by such study (Agrawal, 2004).
The importance of quality education in nation building has also been realized by
several nations including developed countries. Several developed nations including USA
realized that their role as leaders in the world’s economy and their capacity to produce wealth
and quality jobs depend directly on the ability of education system to produce students who
Page 4
3
can compete in mathematics and science dominated industries of the future. Thus, improving
mathematics and science education has been the priority of the policymaking agenda (Anon,
2005).
Students’ performance in mathematics subject has been investigated through bilateral
surveys in two European countries (Robertson, 2000). Requirements of changes in national
policies suiting their respective culture are emphasized in order to minimize the differences in
performances amongst the countries.
The interactions of a large number of socio-economic as well as academic
environmental factors influence the student’s performance in school. Poor school
performance not only results in the child having a low self-esteem, but also causes significant
stress to the parents (Karande and Kulkarni, 2005). Identification of causes of poor
performance and execution of corrective action plan so that the students can perform up to
their full potential is required.
A psychological aspect of female students with special reference to mathematics
subject has been matter of investigation in past reporting that high mathematics anxiety is
associated with low mathematics achievement (Yee, 1987). Another interesting finding of
such study was that for the most capable students, test anxiety seems to act as a facilitator in
their mathematics performance. The role of teachers has also been pointed out by the study
stating that students' scores on the perception of their mathematics teachers have the strongest
correlation with their mathematics anxiety scores. Teacher’s quality supported by training
and experiences has influencing role in effective teaching-learning. Teaching experience
plays important role in success of education (Tui, 1987).
From the above discussion it is evident that education has not only the priority area of
policy makers, but adequate attention has also drawn to many researchers. The present
investigation is concerning the secondary school education prevailing in a region of India.
Page 5
4
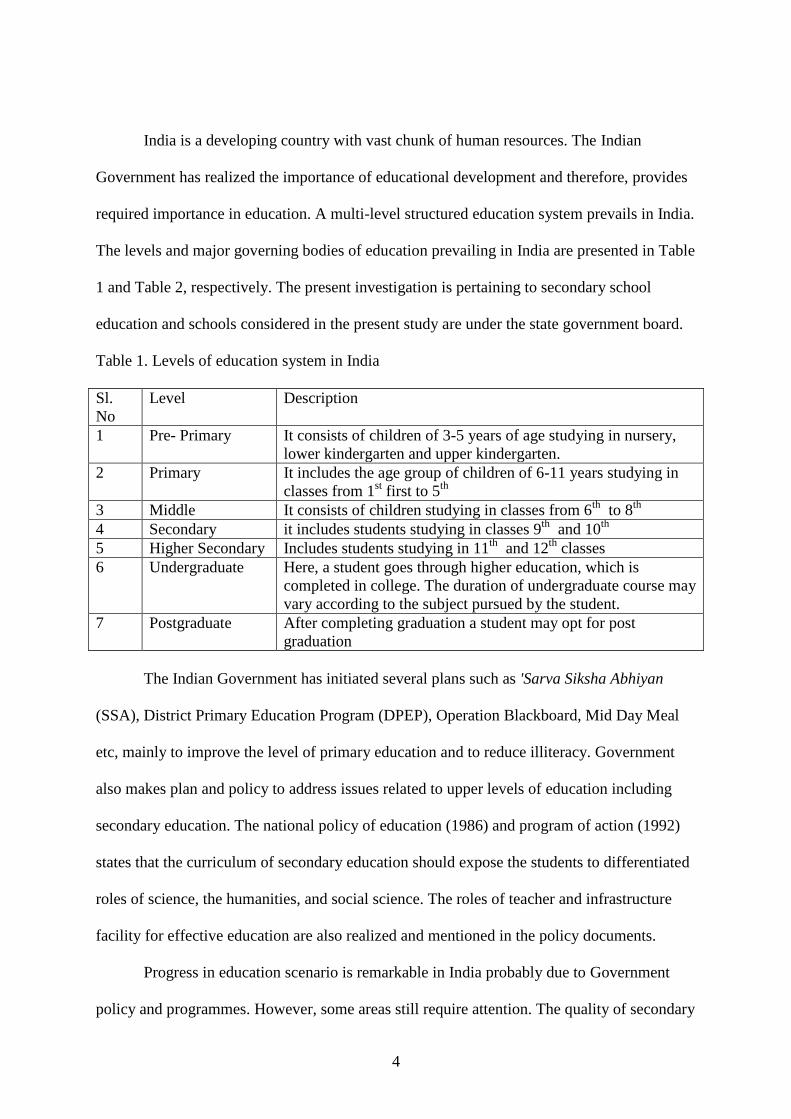
India is a developing country with vast chunk of human resources. The Indian
Government has realized the importance of educational development and therefore, provides
required importance in education. A multi-level structured education system prevails in India.
The levels and major governing bodies of education prevailing in India are presented in Table
1 and Table 2, respectively. The present investigation is pertaining to secondary school
education and schools considered in the present study are under the state government board.
Table 1. Levels of education system in India
Sl.
No
Level Description
1 Pre- Primary It consists of children of 3-5 years of age studying in nursery,
lower kindergarten and upper kindergarten.
2 Primary It includes the age group of children of 6-11 years studying in
classes from 1st first to 5
th
3 Middle It consists of children studying in classes from 6th
to 8th
4 Secondary it includes students studying in classes 9th
and 10th
5 Higher Secondary Includes students studying in 11th
and 12th
classes
6 Undergraduate Here, a student goes through higher education, which is
completed in college. The duration of undergraduate course may
vary according to the subject pursued by the student.
7 Postgraduate After completing graduation a student may opt for post
graduation
The Indian Government has initiated several plans such as 'Sarva Siksha Abhiyan
(SSA), District Primary Education Program (DPEP), Operation Blackboard, Mid Day Meal
etc, mainly to improve the level of primary education and to reduce illiteracy. Government
also makes plan and policy to address issues related to upper levels of education including
secondary education. The national policy of education (1986) and program of action (1992)
states that the curriculum of secondary education should expose the students to differentiated
roles of science, the humanities, and social science. The roles of teacher and infrastructure
facility for effective education are also realized and mentioned in the policy documents.
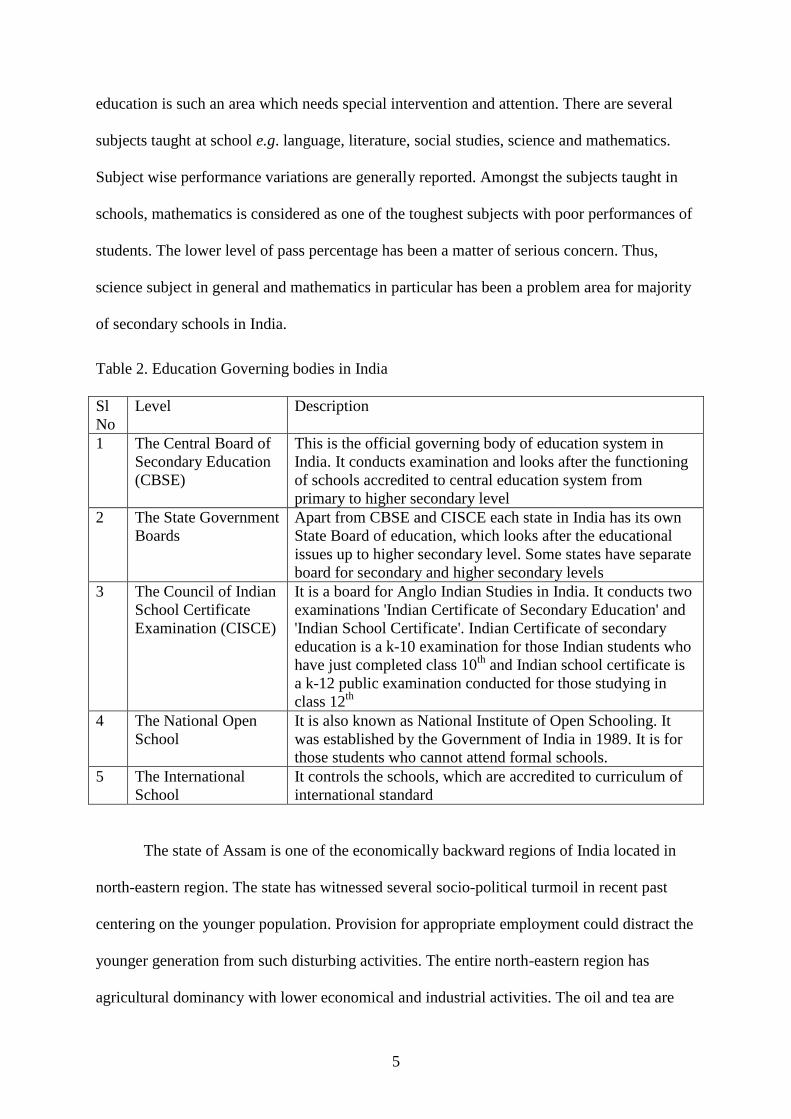
Progress in education scenario is remarkable in India probably due to Government
policy and programmes. However, some areas still require attention. The quality of secondary
Page 6
5
education is such an area which needs special intervention and attention. There are several
subjects taught at school e.g. language, literature, social studies, science and mathematics.
Subject wise performance variations are generally reported. Amongst the subjects taught in
schools, mathematics is considered as one of the toughest subjects with poor performances of
students. The lower level of pass percentage has been a matter of serious concern. Thus,
science subject in general and mathematics in particular has been a problem area for majority
of secondary schools in India.
Table 2. Education Governing bodies in India
Sl
No
Level Description
1 The Central Board of
Secondary Education
(CBSE)
This is the official governing body of education system in
India. It conducts examination and looks after the functioning
of schools accredited to central education system from
primary to higher secondary level
2 The State Government
Boards
Apart from CBSE and CISCE each state in India has its own
State Board of education, which looks after the educational
issues up to higher secondary level. Some states have separate
board for secondary and higher secondary levels
3 The Council of Indian
School Certificate
Examination (CISCE)
It is a board for Anglo Indian Studies in India. It conducts two
examinations 'Indian Certificate of Secondary Education' and
'Indian School Certificate'. Indian Certificate of secondary
education is a k-10 examination for those Indian students who
have just completed class 10th
and Indian school certificate is
a k-12 public examination conducted for those studying in
class 12th
4 The National Open
School
It is also known as National Institute of Open Schooling. It
was established by the Government of India in 1989. It is for
those students who cannot attend formal schools.
5 The International
School
It controls the schools, which are accredited to curriculum of
international standard
The state of Assam is one of the economically backward regions of India located in
north-eastern region. The state has witnessed several socio-political turmoil in recent past
centering on the younger population. Provision for appropriate employment could distract the
younger generation from such disturbing activities. The entire north-eastern region has
agricultural dominancy with lower economical and industrial activities. The oil and tea are
Page 7
6
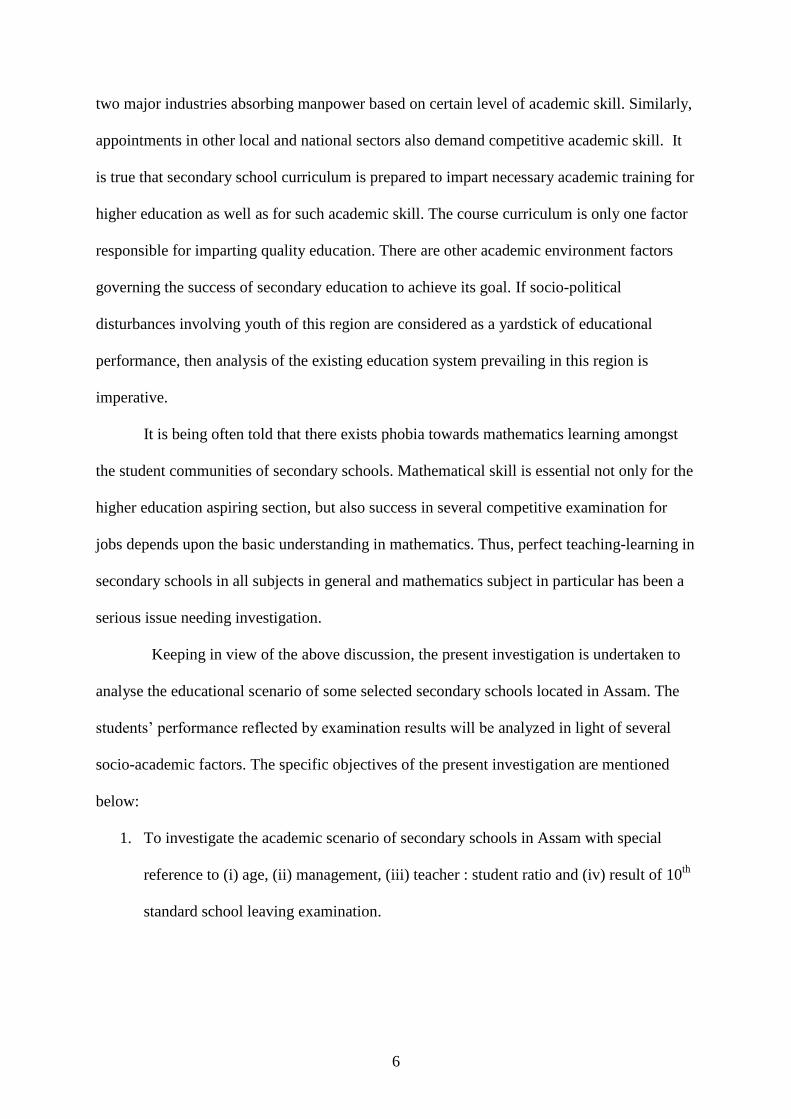
two major industries absorbing manpower based on certain level of academic skill. Similarly,
appointments in other local and national sectors also demand competitive academic skill. It
is true that secondary school curriculum is prepared to impart necessary academic training for
higher education as well as for such academic skill. The course curriculum is only one factor
responsible for imparting quality education. There are other academic environment factors
governing the success of secondary education to achieve its goal. If socio-political
disturbances involving youth of this region are considered as a yardstick of educational
performance, then analysis of the existing education system prevailing in this region is
imperative.
It is being often told that there exists phobia towards mathematics learning amongst
the student communities of secondary schools. Mathematical skill is essential not only for the
higher education aspiring section, but also success in several competitive examination for
jobs depends upon the basic understanding in mathematics. Thus, perfect teaching-learning in
secondary schools in all subjects in general and mathematics subject in particular has been a
serious issue needing investigation.
Keeping in view of the above discussion, the present investigation is undertaken to
analyse the educational scenario of some selected secondary schools located in Assam. The
students’ performance reflected by examination results will be analyzed in light of several
socio-academic factors. The specific objectives of the present investigation are mentioned
below:
1. To investigate the academic scenario of secondary schools in Assam with special
reference to (i) age, (ii) management, (iii) teacher : student ratio and (iv) result of 10th
standard school leaving examination.
Page 8
7
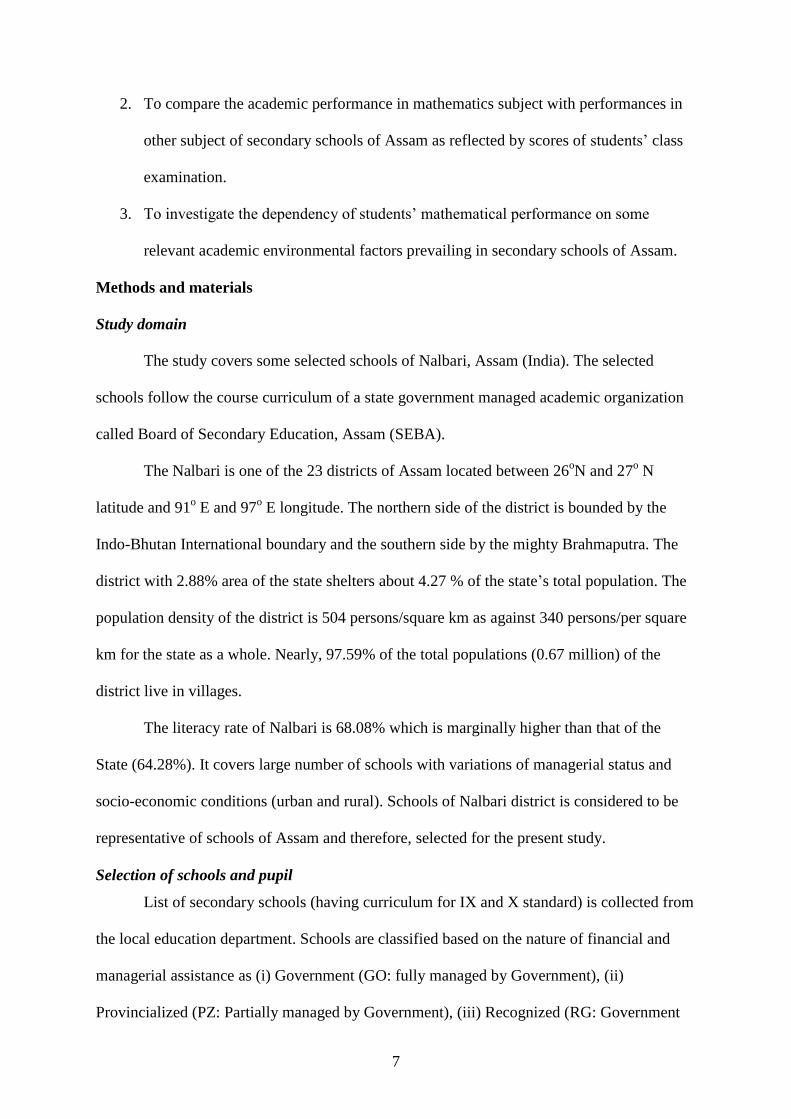
2. To compare the academic performance in mathematics subject with performances in
other subject of secondary schools of Assam as reflected by scores of students’ class
examination.
3. To investigate the dependency of students’ mathematical performance on some
relevant academic environmental factors prevailing in secondary schools of Assam.
Methods and materials
Study domain
The study covers some selected schools of Nalbari, Assam (India). The selected
schools follow the course curriculum of a state government managed academic organization
called Board of Secondary Education, Assam (SEBA).
The Nalbari is one of the 23 districts of Assam located between 26oN and 27
o N
latitude and 91o E and 97
o E longitude. The northern side of the district is bounded by the
Indo-Bhutan International boundary and the southern side by the mighty Brahmaputra. The
district with 2.88% area of the state shelters about 4.27 % of the state’s total population. The
population density of the district is 504 persons/square km as against 340 persons/per square
km for the state as a whole. Nearly, 97.59% of the total populations (0.67 million) of the
district live in villages.
The literacy rate of Nalbari is 68.08% which is marginally higher than that of the
State (64.28%). It covers large number of schools with variations of managerial status and
socio-economic conditions (urban and rural). Schools of Nalbari district is considered to be
representative of schools of Assam and therefore, selected for the present study.
Selection of schools and pupil
List of secondary schools (having curriculum for IX and X standard) is collected from
the local education department. Schools are classified based on the nature of financial and
managerial assistance as (i) Government (GO: fully managed by Government), (ii)
Provincialized (PZ: Partially managed by Government), (iii) Recognized (RG: Government
Page 9
8
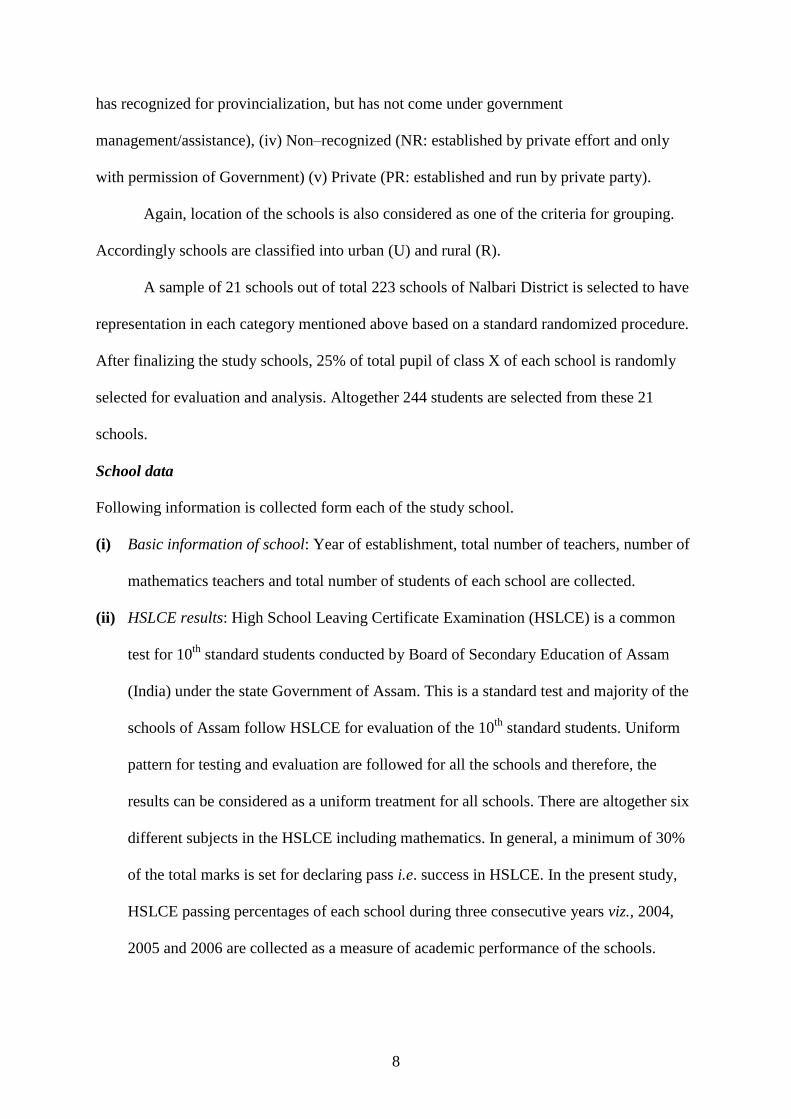
has recognized for provincialization, but has not come under government
management/assistance), (iv) Non–recognized (NR: established by private effort and only
with permission of Government) (v) Private (PR: established and run by private party).
Again, location of the schools is also considered as one of the criteria for grouping.
Accordingly schools are classified into urban (U) and rural (R).
A sample of 21 schools out of total 223 schools of Nalbari District is selected to have
representation in each category mentioned above based on a standard randomized procedure.
After finalizing the study schools, 25% of total pupil of class X of each school is randomly
selected for evaluation and analysis. Altogether 244 students are selected from these 21
schools.
School data
Following information is collected form each of the study school.
(i) Basic information of school: Year of establishment, total number of teachers, number of
mathematics teachers and total number of students of each school are collected.
(ii) HSLCE results: High School Leaving Certificate Examination (HSLCE) is a common
test for 10th
standard students conducted by Board of Secondary Education of Assam
(India) under the state Government of Assam. This is a standard test and majority of the
schools of Assam follow HSLCE for evaluation of the 10th
standard students. Uniform
pattern for testing and evaluation are followed for all the schools and therefore, the
results can be considered as a uniform treatment for all schools. There are altogether six
different subjects in the HSLCE including mathematics. In general, a minimum of 30%
of the total marks is set for declaring pass i.e. success in HSLCE. In the present study,
HSLCE passing percentages of each school during three consecutive years viz., 2004,
2005 and 2006 are collected as a measure of academic performance of the schools.
Page 10
9
(iii) Results of annual examination: The school conducts annual test of all the six subjects
including mathematics. Though each school conducts test individually, the syllabus is
common and therefore, the test is considered uniform treatment for all the study school.
For the present study, following information relating to results of annual tests for all the
students are collected: (a) percentage scores of all the subjects excluding mathematics
and (b) percentage scores in mathematics subject only.
Data analysis
Collected information is analysed as given below:
Coding of school
Each school is considered as an individual study sample and schools are coded such
that status with respect to (a) management, (b) location, (c) age of establishment can be read
from the codes. For example, SPZ_R_059 is a provincialized (PZ), rural (R) school with an age
of establishment of 59 years. If schools have identical years of establishments then they
subscript a, b etc are used for distinction, e.g., SRG_R_017a and SRG_R_017b both are RG category
of school with 17 years of age.
Academic performance indicators
Three indicators are defined as a measure academic performance of the schools
under study as discussed below.
(i) Pass percentage in HSLCE (PSLCE): The percentages of successful students in
HSLCE during 2004, 2005 and 2006 of a school are averaged to estimate PSLCE of
the school. It is assumed that higher the PSLCE better the academic performance of
the school.
(ii) Class average performance excluding mathematics (CAO): This is the average of the
individual students’ percentage score in all the subjects excluding mathematics in two
consecutive year’s annual examinations viz., Class VIII and Class IX. Higher CAO
Page 11
10
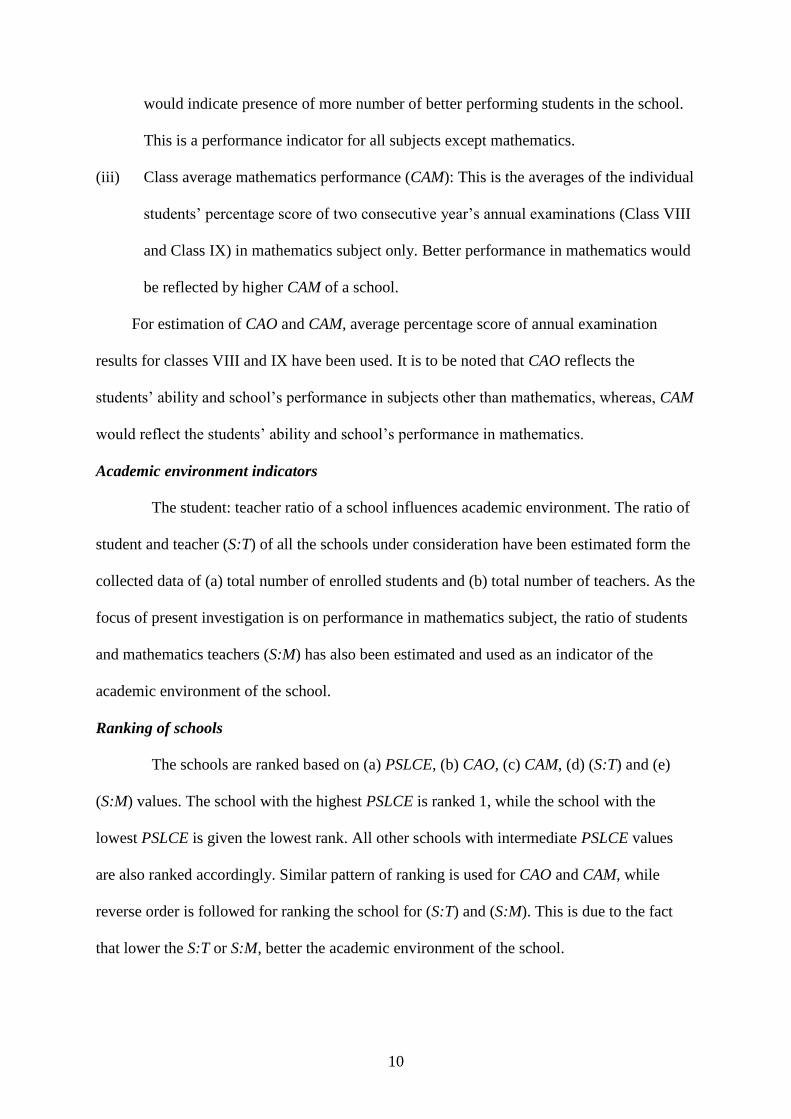
would indicate presence of more number of better performing students in the school.
This is a performance indicator for all subjects except mathematics.
(iii) Class average mathematics performance (CAM): This is the averages of the individual
students’ percentage score of two consecutive year’s annual examinations (Class VIII
and Class IX) in mathematics subject only. Better performance in mathematics would
be reflected by higher CAM of a school.
For estimation of CAO and CAM, average percentage score of annual examination
results for classes VIII and IX have been used. It is to be noted that CAO reflects the
students’ ability and school’s performance in subjects other than mathematics, whereas, CAM
would reflect the students’ ability and school’s performance in mathematics.
Academic environment indicators
The student: teacher ratio of a school influences academic environment. The ratio of
student and teacher (S:T) of all the schools under consideration have been estimated form the
collected data of (a) total number of enrolled students and (b) total number of teachers. As the
focus of present investigation is on performance in mathematics subject, the ratio of students
and mathematics teachers (S:M) has also been estimated and used as an indicator of the
academic environment of the school.
Ranking of schools
The schools are ranked based on (a) PSLCE, (b) CAO, (c) CAM, (d) (S:T) and (e)
(S:M) values. The school with the highest PSLCE is ranked 1, while the school with the
lowest PSLCE is given the lowest rank. All other schools with intermediate PSLCE values
are also ranked accordingly. Similar pattern of ranking is used for CAO and CAM, while
reverse order is followed for ranking the school for (S:T) and (S:M). This is due to the fact
that lower the S:T or S:M, better the academic environment of the school.
Page 12
11
Investigation of mathematics performance in the light of measured parameters
The CAM ranks are considered as the performance indicator in mathematics subject of
the schools. Ranks for other parameters are compared with the CAM ranks through x-y plot to
investigate their relationship (CAM ranks are plotted in y-axis, while ranks for other
parameters are plotted in x-axis). For a given pair of ranks, greater deviation of the plots from
the x = y line would reflect lack of mutual dependence of the parameters.
Results and discussion
The results of this study are presented and discussed below.
Characteristics of the schools under study
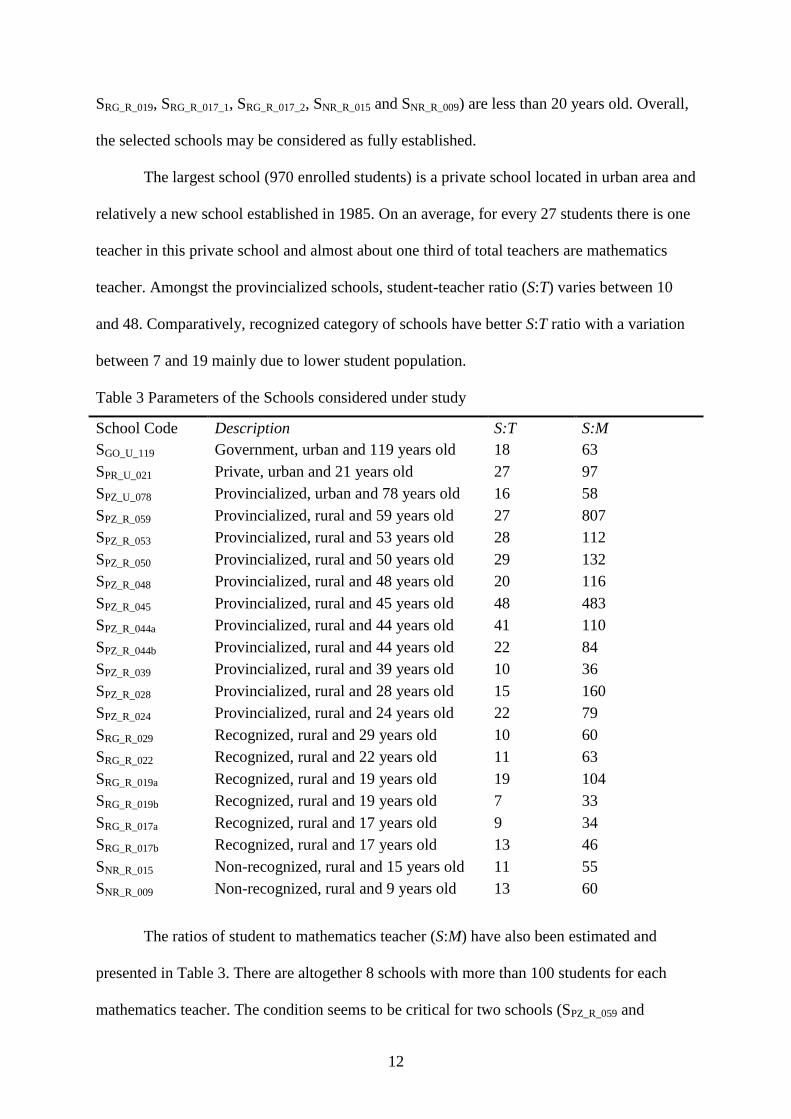
Age of school, type of management, location and teacher-student ratio are some of the
influencing parameters of academic environment of a school. Information collected from the
schools relating to these parameters is presented in Table 3. The overall academic
environment with reference to these selected parameters of the schools under study are
considered relevant for the present study and discussed below. The study schools are coded
with descriptions of managerial status, location and age.
Amongst the schools, there is one Government school and eleven schools are
provincialized. Six schools obtained the Government recognition to operate, whereas, two
other have not yet recognized. There is only one private school in the selected sample. As
mentioned earlier, the numbers of schools in each category are selected based on standard
sampling procedure.
Rural dominance is noticed as there are only three schools (SGO_U_119, SPR_U_021 and
SPZ_U_078) located in urban area.
There is school as old as 119 years (SGO_U_119) amongst the selected schools.
Altogether, there are nine schools (SGO_U_119, SPZ_U_078, SPZ_R_059, SPZ_R_053, SPZ_R_050,
SPZ_R_048, SPZ_R_045, SPZ_R_044 and SPZ_R_044) more than 40 years old. Six schools (SRG_R_019,
Page 13
12
SRG_R_019, SRG_R_017_1, SRG_R_017_2, SNR_R_015 and SNR_R_009) are less than 20 years old. Overall,
the selected schools may be considered as fully established.
The largest school (970 enrolled students) is a private school located in urban area and
relatively a new school established in 1985. On an average, for every 27 students there is one
teacher in this private school and almost about one third of total teachers are mathematics
teacher. Amongst the provincialized schools, student-teacher ratio (S:T) varies between 10
and 48. Comparatively, recognized category of schools have better S:T ratio with a variation
between 7 and 19 mainly due to lower student population.
Table 3 Parameters of the Schools considered under study
School Code Description S:T S:M
SGO_U_119 Government, urban and 119 years old 18 63
SPR_U_021 Private, urban and 21 years old 27 97
SPZ_U_078 Provincialized, urban and 78 years old 16 58
SPZ_R_059 Provincialized, rural and 59 years old 27 807
SPZ_R_053 Provincialized, rural and 53 years old 28 112
SPZ_R_050 Provincialized, rural and 50 years old 29 132
SPZ_R_048 Provincialized, rural and 48 years old 20 116
SPZ_R_045 Provincialized, rural and 45 years old 48 483
SPZ_R_044a Provincialized, rural and 44 years old 41 110
SPZ_R_044b Provincialized, rural and 44 years old 22 84
SPZ_R_039 Provincialized, rural and 39 years old 10 36
SPZ_R_028 Provincialized, rural and 28 years old 15 160
SPZ_R_024 Provincialized, rural and 24 years old 22 79
SRG_R_029 Recognized, rural and 29 years old 10 60
SRG_R_022 Recognized, rural and 22 years old 11 63
SRG_R_019a Recognized, rural and 19 years old 19 104
SRG_R_019b Recognized, rural and 19 years old 7 33
SRG_R_017a Recognized, rural and 17 years old 9 34
SRG_R_017b Recognized, rural and 17 years old 13 46
SNR_R_015 Non-recognized, rural and 15 years old 11 55
SNR_R_009 Non-recognized, rural and 9 years old 13 60
The ratios of student to mathematics teacher (S:M) have also been estimated and
presented in Table 3. There are altogether 8 schools with more than 100 students for each
mathematics teacher. The condition seems to be critical for two schools (SPZ_R_059 and
Page 14
13
SPZ_R_045), where there is only one mathematics teacher for each 807 and 483 enrolled
students of these schools, respectively.
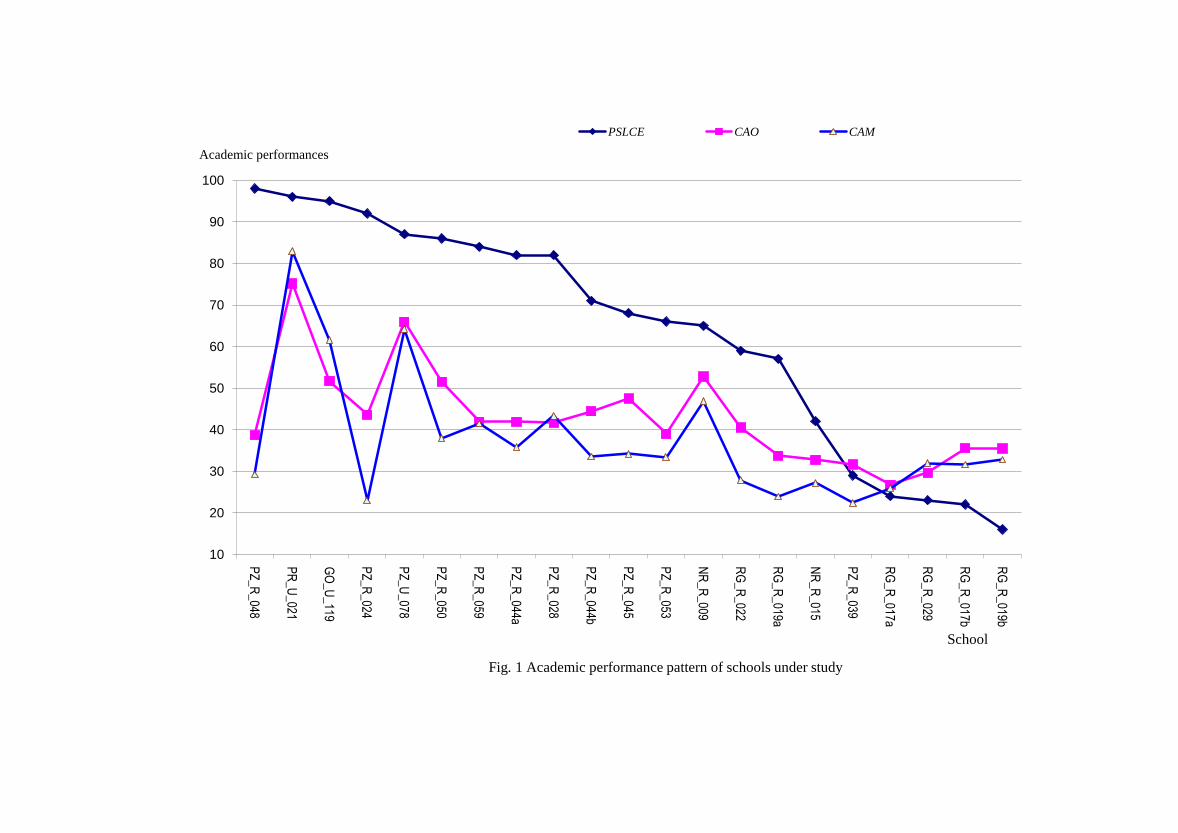
Academic performance
As discussed earlier, three indices viz., PSLCE, CAO and CAM are defined for
evaluating the academic performances of the selected schools. Varied performances are
noticed with reference to these parameters amongst the 21 schools under study which is
presented in Fig. 1 (see appendix). All the three parameters for the 21 schools are presented
in Fig. 1 and discussed below.
Pass percentage of school leaving certificate examination (PSLCE)
There is a remarkable variation of the pass percentages amongst the 21 schools under
study. The highest and the lowest PSLCE have been 98% (SPZ_R_048) and 16% (SRG_R_019b),
respectively. There are 15 schools with more than 50% PSLCE, out of which 9 schools
having more than 80% PSLCE. Six schools recorded between 50 % and 80% PSLCE,
whereas PSLCE of remaining six schools are below 50%.
If PSLCE is considered as the yardstick for overall academic performance, the
majority of provincialized (7 out of 11) schools along with the lone government (GO) and
private (PR) are better performer having more than 80% PSLCE. Another fact worth
mentioning that performances of all the three schools located at urban area are better having
more than 80% PSLE.
The six intermediate performer categories of schools (50-80% PSLCE) belong to PR
(3), RG (1) and NR (1). The bottom categories of PSLCE performer belong to four RG
schools along with one each PZ and NR. The performances of non-recognized schools are
better than recognized schools as evident from the facts that all the four schools having less
than 30% PSLCE are recognized category of school.
Government (GO) schools are few in number and it is fully aided and managed by
government. Thus, infrastructural facility and prospect of availability of quality teacher are
Page 15
14
better in GO schools compared to other category of schools. The provincialized (PZ) schools
are aided by government and managed by local management bodies. Limited financial aids
including salary of teachers are provided by government. Infrastructural facilities and
financial condition of this category of school is better than recognized (RG) and non-
recognized (NR) schools. As mentioned earlier, RG and NR schools are not aided by
government and only established with anticipation of getting provincialization status in near
future. Mostly these schools are running with varying degree of financial constraints.
Introduction of private (PR) schools are relatively new in educational scenario of Assam.
There are several objectives of initiating private school discussion of which is considered out
of scope of the present study. As students fees constitutes major component of revenue of PR
category of school these schools are remain alert to perform better so as to attract more
students. PR schools also create infrastructural facility and attempted to appoint qualified
teacher with an aim to improve performance.
This part of the results of the present investigation concerning PSLCE performance
can be viewed as the reflection of status of the schools with regards to financial and
managerial aids as discussed above. The students of GO and PR schools are exposed to
favourable academic environment in terms of infrastructure and teacher resulting higher
PSLCE. On the other hand, students of RG and NR school might have not received similar
treatment as that of GO and PR. Similarly, the performance of seven PZ schools can also be
explained on the basis of students’ exposure to better academic environment. However, the
relatively worse PSLCE performance of four PZ schools viz., SPZ_R_044b (71%), SPZ_R_045
(68%), SPZ_R_053 (66%) and SPZ_R_039 (29%) would require further investigation. All these
schools are old and receiving financial aids from government. The student teacher ratio of
these schools are also comparable with other schools except SPZ_R_045 which has S:T=48.
Page 16
15
Students’ performance in annual examination
The performances of the schools in terms of CAO are also in similar pattern as that
of PSLCE barring a few exceptions. In general, urban located private, government and
provincialized schools’ class average scores are better than recognized and non-recognized
schools. The highest CAO (75.19) of SPR_U_021 is substantially higher than the lowest CAO
(26.76) of SRG_R_017a. There are only five schools with more than 50% CAO belonging to two
PZ, and one each of PR, GO and NR amongst the 21 schools. It is also noticed that
performances of majority of students fall within 30% to 50% as CAO of 13 schools falls in
this range. Again majority of these 13 schools belong to PZ (8), followed by RG (4) and NR
(1). The worse performer schools with CAO less than 30% belong to RG (2) and PZ (1).
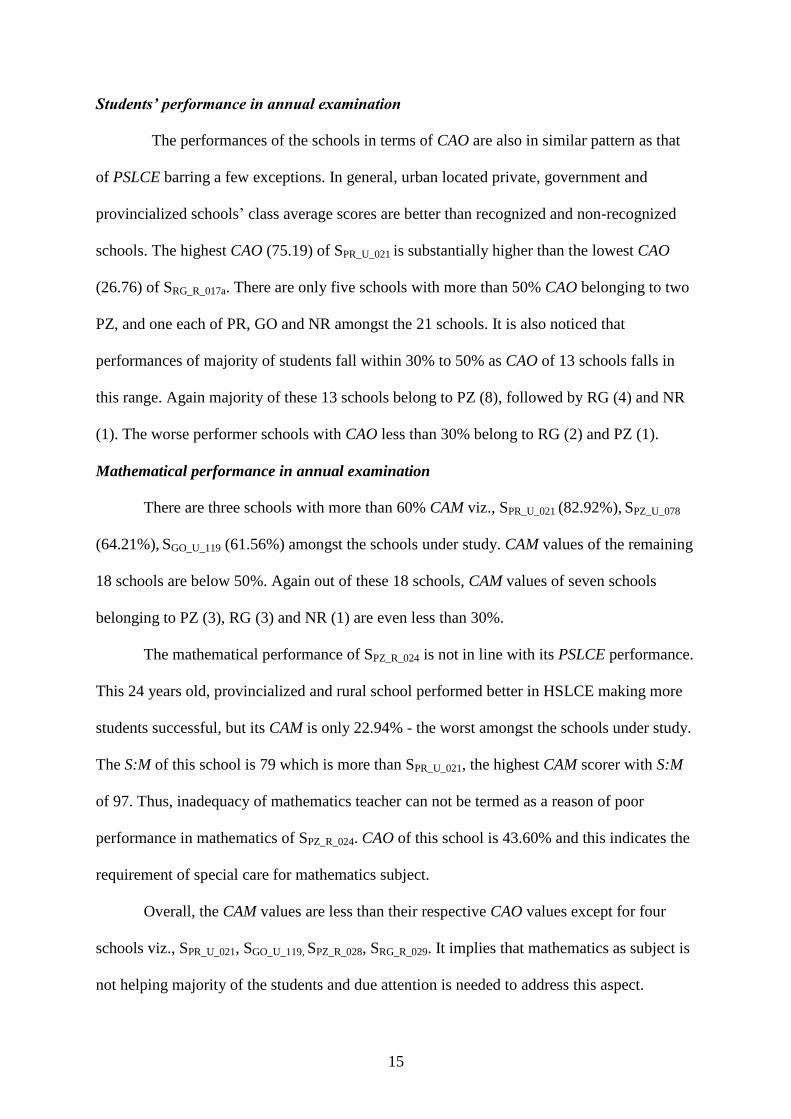
Mathematical performance in annual examination
There are three schools with more than 60% CAM viz., SPR_U_021 (82.92%), SPZ_U_078
(64.21%), SGO_U_119 (61.56%) amongst the schools under study. CAM values of the remaining
18 schools are below 50%. Again out of these 18 schools, CAM values of seven schools
belonging to PZ (3), RG (3) and NR (1) are even less than 30%.
The mathematical performance of SPZ_R_024 is not in line with its PSLCE performance.
This 24 years old, provincialized and rural school performed better in HSLCE making more
students successful, but its CAM is only 22.94% - the worst amongst the schools under study.
The S:M of this school is 79 which is more than SPR_U_021, the highest CAM scorer with S:M
of 97. Thus, inadequacy of mathematics teacher can not be termed as a reason of poor
performance in mathematics of SPZ_R_024. CAO of this school is 43.60% and this indicates the
requirement of special care for mathematics subject.
Overall, the CAM values are less than their respective CAO values except for four
schools viz., SPR_U_021, SGO_U_119, SPZ_R_028, SRG_R_029. It implies that mathematics as subject is
not helping majority of the students and due attention is needed to address this aspect.
Page 17
16
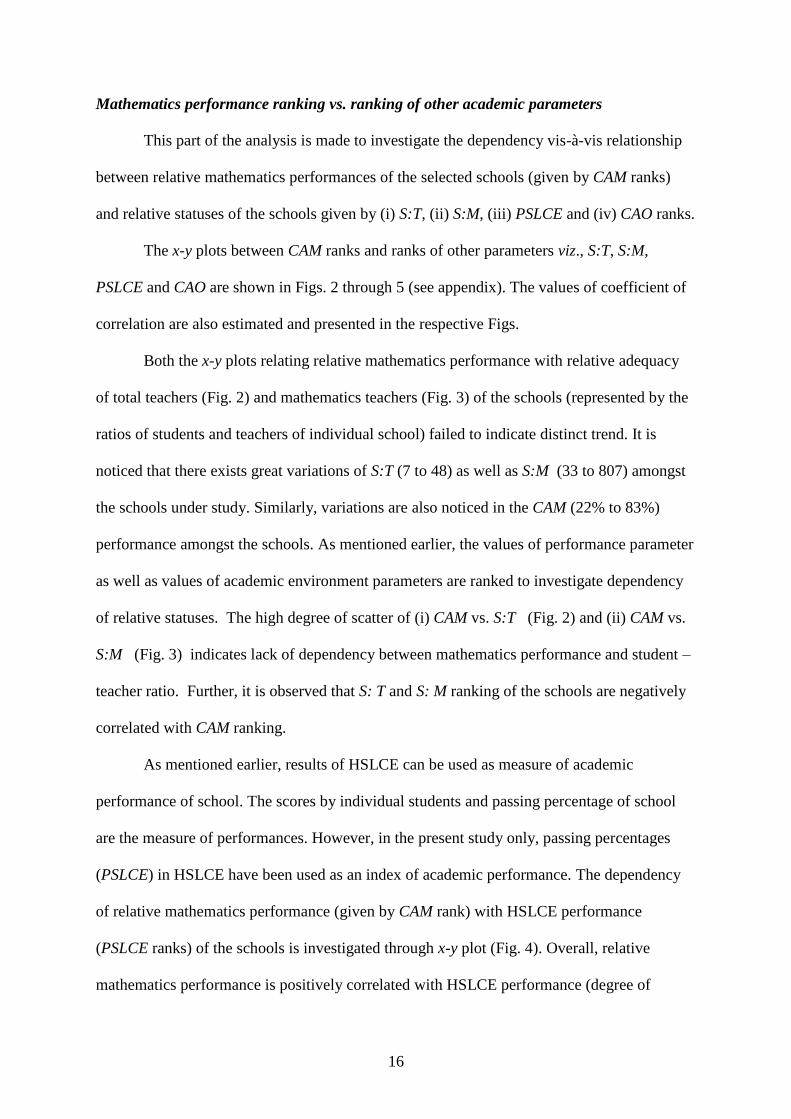
Mathematics performance ranking vs. ranking of other academic parameters
This part of the analysis is made to investigate the dependency vis-à-vis relationship
between relative mathematics performances of the selected schools (given by CAM ranks)
and relative statuses of the schools given by (i) S:T, (ii) S:M, (iii) PSLCE and (iv) CAO ranks.
The x-y plots between CAM ranks and ranks of other parameters viz., S:T, S:M,
PSLCE and CAO are shown in Figs. 2 through 5 (see appendix). The values of coefficient of
correlation are also estimated and presented in the respective Figs.
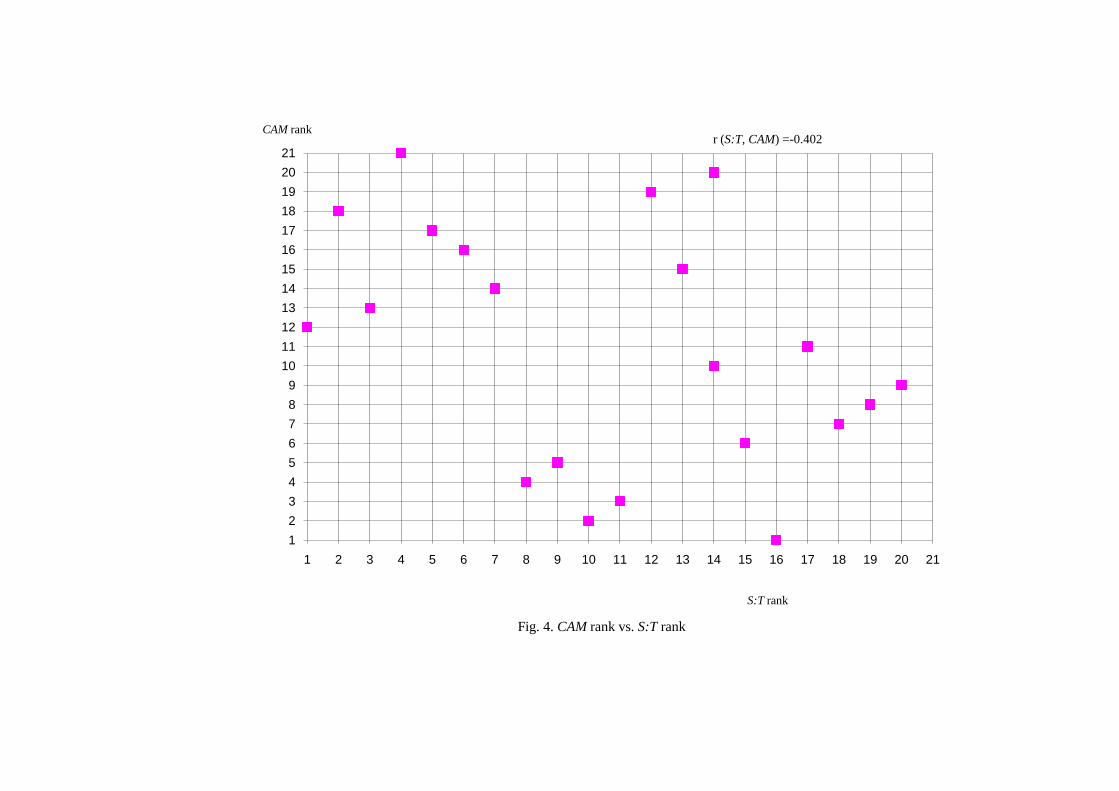
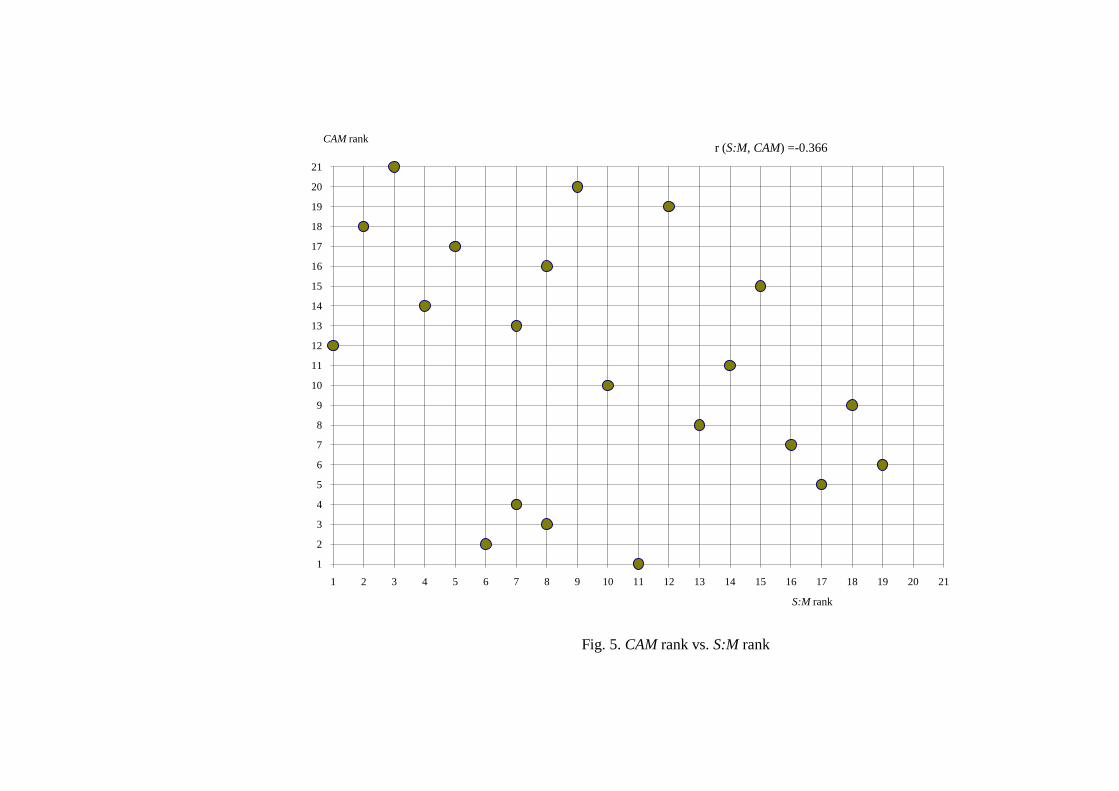
Both the x-y plots relating relative mathematics performance with relative adequacy
of total teachers (Fig. 2) and mathematics teachers (Fig. 3) of the schools (represented by the
ratios of students and teachers of individual school) failed to indicate distinct trend. It is
noticed that there exists great variations of S:T (7 to 48) as well as S:M (33 to 807) amongst
the schools under study. Similarly, variations are also noticed in the CAM (22% to 83%)
performance amongst the schools. As mentioned earlier, the values of performance parameter
as well as values of academic environment parameters are ranked to investigate dependency
of relative statuses. The high degree of scatter of (i) CAM vs. S:T (Fig. 2) and (ii) CAM vs.
S:M (Fig. 3) indicates lack of dependency between mathematics performance and student –
teacher ratio. Further, it is observed that S: T and S: M ranking of the schools are negatively
correlated with CAM ranking.
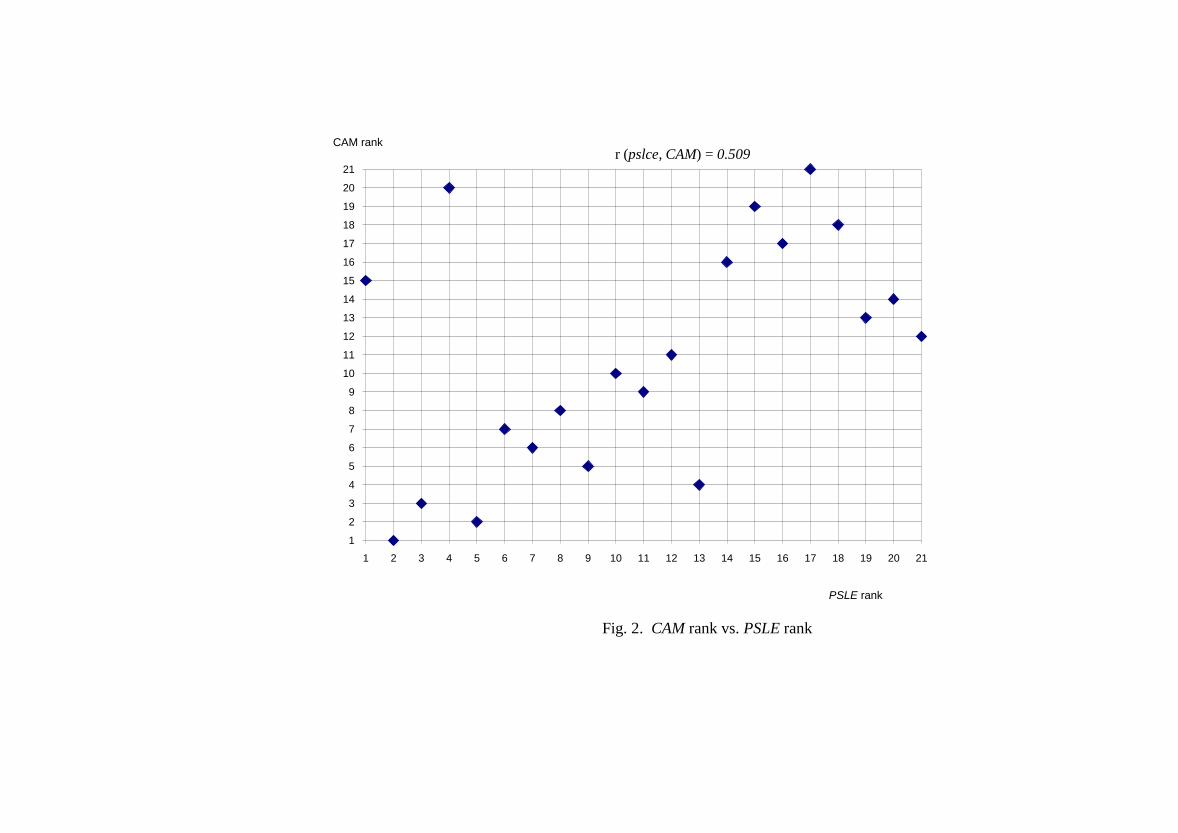
As mentioned earlier, results of HSLCE can be used as measure of academic
performance of school. The scores by individual students and passing percentage of school
are the measure of performances. However, in the present study only, passing percentages
(PSLCE) in HSLCE have been used as an index of academic performance. The dependency
of relative mathematics performance (given by CAM rank) with HSLCE performance
(PSLCE ranks) of the schools is investigated through x-y plot (Fig. 4). Overall, relative
mathematics performance is positively correlated with HSLCE performance (degree of
Page 18
17
correlation as 0.509). However, there are several schools exceptional to this relation. The
most prominent exceptional schools are SPZ_R_048 (1st PSLCE and 15
th CAM), SPZ_R_024 (4
th
PSLCE and 20th
CAM), SNR_R_009 (13th
PSLCE and 4th
CAM rank) and SRG_R_019 (21st PSLCE
and 12th
CAM). SPZ_R_048 being a provincialized school is expected not to constrained by
managerial and financial factors and is showing the best HSLCE performance. However, the
poor performance in mathematics as well as in other subject is a matter of concern. Mere
maintaining higher level of pass percentage can not be considered as the objective of
secondary education. If CAM and CAO are considered as the reflection of students
understanding on the respective subjects, then the reason(s) of poor CAM (also CAO) of
SPZ_R_048 School should be investigated for initiating appropriate corrective measures.
Otherwise, the group of learners studying in this school would be deprived of some required
academic treatments so as to improve their performance. Similar, is the case of SPZ_R_024.
However, the cases of SNR_R_009 and SRG_R_019 are different as reflected by better relative
performances in mathematics associated with poor HSLCE performance.
The average mark obtained by a group of student in a given subject is considered as
an index of performance of the group on that subject. Accordingly, CAO and CAM have been
defined and evaluated in the present study to reflect the relevant performances of the 21
schools under study. The dependency of relative performances in mathematics on the relative
performances in other subjects is examined by the plot given in Fig. 5. In general, the plot
reflects dependency between CAM and CAO with value of positive coefficient of correlation
as 0.788. Thus, schools with better performance in subjects other than mathematics are also
better performer in mathematics barring few exceptions. The clear example being SPZ_R_024
with relatively better CAO performer with 8th
rank while poor performance in CAM with 20th
rank.
Page 19
18
Conclusions
A wide range of variations are observed amongst the secondary schools of Nalbari
district of Assam with reference to managerial status and academic performance.
Investigation of the prevailing education scenario vis-à-vis mathematics performance of
students of 21 representative schools of Assam revealed wide variations of academic
environment amongst the school so also the performances. The financial and managerial
status of the schools seems to be the major factors of academic performance. In general,
academic performances as well as mathematics performances of the government and private
schools are better than the schools not getting government aids. The study also revealed that
mathematics performances of schools are positively correlated with (a) the academic
performance of school indicated by school leaving pass percentage and also (b) with the
performances in subjects other than mathematics. On the other hand, students and teacher
ratio seems not to affect the mathematics performance of the schools under study. The
requirement of urgent attention to improve the performance of secondary school is indicated
considering the societal needs. The state of Assam is one of the economically backward
regions of India and is witnessing socio-political disturbances manly centered with younger
population. Object oriented education leading to increase in employment opportunities is
expected to reduce the present social crisis. Appropriate secondary school knowledge backed
by perfect learning in mathematics can make the students competent for future career.
Page 20
19
References
Agrawal M. (2004). Curricular reform in schools: the importance of evaluation, J. Curriculum
Studies, (2004), 36 (3), 361–379
Anonymous (2005). Keeping America Competitive: Five Strategies to Improve Mathematics
and Science Education, Report by Education Commission of the States,
http://www.ecs.org/clearinghouse
Banaji S. (2005). Portrait of an Indian education, Changing English, 12(2), 157–166
Chauhan C. P. S. (2008). Education and caste in India, Asia Pacific Journal of Education,
28(3), 217–234
Desai G. (1999). Vocational Teachers in Higher Secondary Schools in Developing Countries:
a case study of Gujarat, Research in Post-Compulsory Education, 4(3), 259-259
Karande, S. and Kulkarni, M. (2005). Poor School Performance, Indian Journal of Pediatrics,
72 (11), 961-967
Robertson, I. J. (2000). Collaboration and Comparisons: a bilateral study of mathematics
performance in Scotland and France, Comparative Education, 36(4). 437–457
Tui, O. S. (1987), Validation of an observer rating scale of mathematics teacher classroom
performance, Asia Pacific Journal of Education, 8 (2), 56-66
Yee, F. P. (1987). Anxiety and Mathematics Performance in Female Secondary School
Students in Singapore, Asia Pacific Journal of Education, 8(2), 22-31
Page 22
10
20
30
40
50
60
70
80
90
100
PZ
_R_048
PR
_U_021
GO
_U_119
PZ
_R_024
PZ
_U_078
PZ
_R_050
PZ
_R_059
PZ
_R_044a
PZ
_R_028
PZ
_R_044b
PZ
_R_045
PZ
_R_053
NR
_R_009
RG
_R_022
RG
_R_019a
NR
_R_015
PZ
_R_039
RG
_R_017a
RG
_R_029
RG
_R_017b
RG
_R_019b
Academic performances
School
Fig. 1 Academic performance pattern of schools under study
PSLCE CAO CAM
Page 23
1
2
3
4
5
6
7
8
9
10
11
12
13
14
15
16
17
18
19
20
21
1 2 3 4 5 6 7 8 9 10 11 12 13 14 15 16 17 18 19 20 21
CAM rank
PSLE rank
Fig. 2. CAM rank vs. PSLE rank
r (pslce, CAM) = 0.509
Page 24
1
2
3
4
5
6
7
8
9
10
11
12
13
14
15
16
17
18
19
20
21
1 2 3 4 5 6 7 8 9 10 11 12 13 14 15 16 17 18 19 20 21
CAM rank
CAO rank
Fig.3. CAM rank vs. CAO rank
r (CAO, CAM) =0.788
Page 25
1
2
3
4
5
6
7
8
9
10
11
12
13
14
15
16
17
18
19
20
21
1 2 3 4 5 6 7 8 9 10 11 12 13 14 15 16 17 18 19 20 21
CAM rank
S:T rank
Fig. 4. CAM rank vs. S:T rank
r (S:T, CAM) =-0.402
Page 26
1
2
3
4
5
6
7
8
9
10
11
12
13
14
15
16
17
18
19
20
21
1 2 3 4 5 6 7 8 9 10 11 12 13 14 15 16 17 18 19 20 21
CAM rank
S:M rank
Fig. 5. CAM rank vs. S:M rank
r (S:M, CAM) =-0.366