Section 2 Our performance 11 FINANCIAL STATEMENTS GOVERNANCE OVERVIEW OUR PERFORMANCE OUR IMPACT ON SOCIETY The headline growth rates were reduced by currency movements and helped by acquisitions. Currency movements reduced sales by £27m and operating profits by £11m. This was the result of non-dollar currency depreciation relative to sterling. At constant exchange rates (i.e. stripping out the impact of those currency movements), our sales and adjusted operating profit grew 5% and 1% respectively. Acquisitions, primarily in our education company, contributed £318m to sales and £39m to operating profits. This includes integration costs and investments related to our newly-acquired companies, which we expense. The disposal of our 50% stake in FTSE International in 2011 reduced operating profits by £20m. Our underlying revenue and adjusted operating profit (i.e. stripping out the impact of both portfolio changes and currency movements) declined by 1% and 2% respectively. Our tax rate in 2012 was 23.1% compared to 22.4% in 2011 reflecting movements in tax settlements with revenue authorities in each year. Adjusted earnings per share were 84.2p (2011: 86.5p). Our performance: 2012 financial overview In 2012, Pearson increased sales by 4% in headline terms to £6.1bn generating a total adjusted operating profit of £936m (2011: £942m). Watch an interview with Robin Freestone, Chief financial officer of Pearson. ar2012.pearson.com Cash generation Headline operating cash flow declined by £195m due to longer debtor days, currency fluctuations and increased investment in new education programmes. Free cash flow declined by £115m to £657m, additionally reflecting from lower tax payments. Our average working capital to sales ratio improved by a further 0.4 percentage points to 13.8% reflecting the benefits from our shift to more digital and service- orientated businesses. Return on invested capital Our return on average invested capital was 9.1%, well ahead of our cost of capital and level with 2011. ROIC was affected by profit decline at Pearson in Practice and the sale of FTSE International (one of our least capital-intensive businesses), offset by a lower cash tax charge. 84.2p 77.5p 84.2p 86.5p 77.5p 65.4p Adjusted earnings per share Pence 12 11 10 09 08 46.7p 57.7p 07 Average annual growth (headline) 13%. £788m £1,057m Operating cash flow £m 12 11 10 09 08 £788m £796m £983m £1,057m £913m ting cash flow Operat £m 12 11 10 09 08 £684m 07 KEY FINANCIAL GOALS Return on invested capital 12 11 10 09 08 10.3% 9.2% on invested capital Return % 12 11 10 09 08 9.1% 9.1% 1 0.3% 8.9% 9.2% 8.9% 07 Average capital/actual cash tax
Transcript
Section 2 Our performance 11
FIN
AN
CIA
L S
TA
TE
ME
NT
SG
OV
ER
NA
NC
EO
VE
RV
IEW
OU
R P
ER
FO
RM
AN
CE
OU
R IM
PA
CT
ON
SO
CIE
TY
The headline growth rates were reduced by currency
movements and helped by acquisitions. Currency
movements reduced sales by £27m and operating
profits by £11m. This was the result of non-dollar
currency depreciation relative to sterling. At constant
exchange rates (i.e. stripping out the impact of those
currency movements), our sales and adjusted
operating profit grew 5% and 1% respectively.
Acquisitions, primarily in our education company,
contributed £318m to sales and £39m to operating
profits. This includes integration costs and investments
related to our newly-acquired companies, which
we expense. The disposal of our 50% stake in FTSE
International in 2011 reduced operating profits by £20m.
Our underlying revenue and adjusted operating profit
(i.e. stripping out the impact of both portfolio changes
and currency movements) declined by 1% and 2%
respectively.
Our tax rate in 2012 was 23.1% compared to 22.4%
in 2011 reflecting movements in tax settlements with
revenue authorities in each year.
Adjusted earnings per share were 84.2p (2011: 86.5p).
Our performance: 2012 financial overview
In 2012, Pearson increased sales by 4% in headline terms to £6.1bn generating a total adjusted operating profit of £936m (2011: £942m).
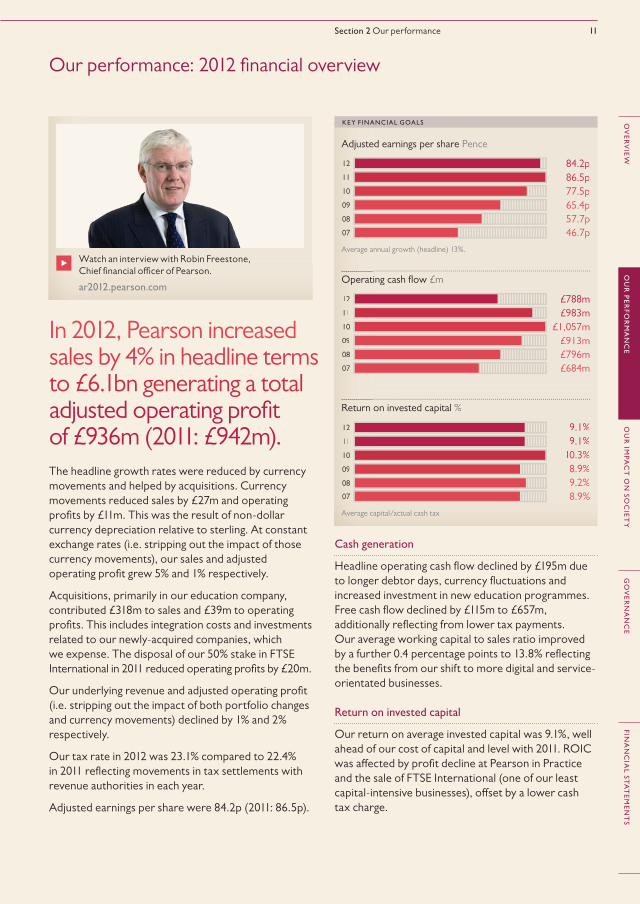
Watch an interview with Robin Freestone,
Chief financial officer of Pearson.
ar2012.pearson.com
Cash generation
Headline operating cash flow declined by £195m due
to longer debtor days, currency fluctuations and
increased investment in new education programmes.
Free cash flow declined by £115m to £657m,
additionally reflecting from lower tax payments.
Our average working capital to sales ratio improved
by a further 0.4 percentage points to 13.8% reflecting
the benefits from our shift to more digital and service-
orientated businesses.
Return on invested capital
Our return on average invested capital was 9.1%, well
ahead of our cost of capital and level with 2011. ROIC
was affected by profit decline at Pearson in Practice
and the sale of FTSE International (one of our least
capital-intensive businesses), offset by a lower cash
tax charge.
84.2p
86.5p
77.5p
65.4p
84.2p
86.5p
77.5p
65.4p
Adjusted earnings per share Pence
12
11
10
09
08
46.7p
57.7p
07
Average annual growth (headline) 13%.
£788m
£796m
£983m
£1,057m
£913m
Operating cash flow £m
12
11
10
09
08
£788m
£796m
£983m
£1,057m
£913m
ting cash flow Operat £m
12
11
10
09
08
£684m07
KEY F INANCIAL GOALS
Return on invested capital %
12
11
10
09
08
9.1%
9.1%
10.3%
8.9%
9.2%
on invested capital Return %
12
11
10
09
08
9.1%
9.1%
10.3%
8.9%
9.2%
8.9%07
Average capital/actual cash tax
12 Pearson plc Annual report and accounts 2012
Our performance: 2012 financial overviewcontinued
Outlook: 2013
We expect the external environment to remain
challenging for our developed world and publishing
businesses in 2013 owing to a combination of cyclical
and structural factors: pressures on education budgets
and college enrolments; retail consolidation; the shift
in our business model from print sales to digital
subscriptions; changing consumer behaviour and a
dynamic competitive landscape. In general, we expect
market conditions to remain favourable for our
businesses in developing economies and education
software and services.
In order to reshape the company to take advantage
of significant growth opportunities, we will expense
approximately £150m of restructuring costs in 2013
(the restructuring cost will be approximately £100m
net of cost savings achieved in the year). This
investment has two objectives:
1. to accelerate our transition from print to digital
business models and from developed to developing
economies; and
2. to separate Penguin activities from Pearson central
services and operations, and to reduce fixed cost
infrastructure in Pearson, in preparation for the
Penguin Random House merger.
We expect this transformation programme to
generate approximately £100m of annual cost savings
from 2014. In 2014, we intend to reinvest the £100m
of cost savings in the organic development of our
fast-growing digital, services and emerging markets
businesses and further restructuring, including the
Penguin Random House integration. We expect these
businesses to contribute to faster organic growth,
improving margins and improved cash flow and
capital intensity from 2015. The precise phasing of
restructuring costs and benefits will depend on
timing of completion of the Penguin Random House
combination, which remains subject to regulatory
approval and which we expect to complete in the
second half of 2013.
Statutory results
Our statutory results show a decrease of £603m
in operating profit to £515m, from £1,118m in 2011,
reflecting the absence in 2012 of the £412m profit on
the sale of FTSE International in 2011 and the £113m
closure-related costs on Pearson in Practice in 2012.
Basic earnings per share similarly fell to 40.5p in 2012,
down from 119.6p in 2011.
Balance sheet
Our net debt increased to £918m (£499m in 2011)
reflecting acquisition investment of £759m and
sustained organic investment in our business, partly
offset by cash generation. Since 2000, Pearson’s net
debt/EBITDA ratio has fallen from 3.9x to 0.9x and
our interest cover has increased from 3.1x to 18.0x.
Dividend
The board is proposing a dividend increase of 7% to
45.0p, subject to shareholder approval. 2012 will be
Pearson’s 21st straight year of increasing our dividend
above the rate of inflation. Over the past ten years
we have increased our dividend at a compound
annual rate of 7%, returning more than £2.5bn to
shareholders. We have a progressive dividend policy:
we intend to sustain our dividend cover at around
2.0x over the long term, increasing our dividend
more in line with earnings growth.
Dividend per share paid in fiscal year Pence
12
11
10
09
08
45.0p
42.0p
38.7p
35.5p
33.8p
nd per share paid in fiscal year Dividen Pence
12
11
10
09
08
45.0p
42.0p
38.7p
35.5p
33.8p
31.6p07
Section 2 Our performance 13
FIN
AN
CIA
L S
TA
TE
ME
NT
SG
OV
ER
NA
NC
EO
VE
RV
IEW
OU
R P
ER
FO
RM
AN
CE
OU
R IM
PA
CT
ON
SO
CIE
TY
At this early stage in the year we expect Pearson 2013
operating profits and adjusted EPS to be broadly level
with 2012 before expensing these restructuring costs
(compared to 2012 adjusted EPS of 82.6p under
revised IAS 19 which we will adopt in 2013) and
including Penguin for the full year.
This guidance is struck at the 2012 average exchange
rate of £1:$1.59 and reflects the following outlook:
Education
In Education, we expect to achieve modest revenue
growth in 2013 with margins similar to 2012.
North America
In North America, we anticipate modest growth with
challenging cyclical and structural market conditions
in publishing offset by growth in digital and services.
International
We expect our International education business to
show good growth. Austerity measures will continue
to affect education spending in much of the developed
world and we expect a slower year for UK examinations
and qualifications. However, we see significant
opportunity in emerging markets in Asia, Latin
America, the Middle East and Sub-Saharan Africa –
which together accounted for 45% of our International
education revenues in 2012.
Professional
Our Professional education business will reflect
the closure of our UK professional training business
and continued growth from our professional
certification business.
FT Group
We expect the FT Group to benefit from continued
growth in digital and subscription revenues in 2013
but advertising to remain weak and volatile with
profits reflecting further actions to accelerate the shift
from print to digital. Mergermarket will benefit from
its high subscription renewal rates, with market
activity likely to boost its core product offerings.
Penguin
As previously announced, subject to regulatory
approval, we expect Penguin’s combination with
Random House to be completed in the second half
of 2013. We believe that the combined organisation
will have a stronger platform and greater resources
to invest in rich content, new digital publishing models
and high-growth emerging markets. The organisation
will generate synergies from shared resources such
as warehousing, distribution, printing and central
functions. We expect market conditions to remain
similar to 2012 with a tough environment in the
physical bookstore channel but helped by good
growth in digital.
Interest and tax
In 2013, our net interest charge to adjusted earnings
will exclude pension income and charges following the
adoption of IAS 19 revised and be similar to the £65m
reported in 2012 on a comparable basis. We anticipate
our P&L tax charge against adjusted earnings to be in
the 23–25% range with our cash tax rates around the
same level.
Exchange rates
Pearson generates approximately 60% of its sales in
the US. A five cent move in the average £:$ exchange
rate for the full year (which in 2012 was £1:$1.59) has
an impact of approximately 1.4p on adjusted earnings
per share.
14 Pearson plc Annual report and accounts 2012
CASE STUDY
KEY PERFORMANCE INDICATORS
North American Education
North American Education is Pearson’s largest business, with 2012 sales of £2.7bn and operating profit of £536m.
Total number of MyLab registrations
Online learning
Pearson’s pioneering ‘MyLab’ digital learning,
homework and assessment programmes grew
well with student registrations in North America
up 11% to almost 10 million, with graded
submissions up 12% to almost 320 million across
the globe. Evaluation studies show that the
use of MyLab programmes can significantly
improve student test scores and institutional
efficiency. http://bit.ly/ymMMAi
9.9m2012
8.9m2011
Sales Adjusted operating profit
2012 £2,658m 2012 £536m
2011 £2,584m 2011 £493m
Headline growth 3% Headline growth 9%
CER growth 2% CER growth 8%
Underlying growth (4)% Underlying growth 3%
Section 2 Our performance 15
FIN
AN
CIA
L S
TA
TE
ME
NT
SG
OV
ER
NA
NC
EO
VE
RV
IEW
OU
R P
ER
FO
RM
AN
CE
OU
R IM
PA
CT
ON
SO
CIE
TY
In 2012, our strength in digital and services businesses
and tight cost control enabled us to perform ahead of
our more traditional print publishing markets, which
declined by 10% for the industry as a whole and were
adversely affected by state budget pressures and
declines in college enrolments.
Higher Education highlights in 2012 include:
› In Higher Education, the publishing market declined
by 6% net in 2012, according to the Association of
American Publishers. Total US College enrolments
were 2% lower in 2012 than in 2011, affected by rising
employment rates, state budget pressures and
regulatory change affecting the for-profit sector.
In a difficult trading environment Pearson gained share
for the 14th consecutive year, again benefiting from
our lead in technology and customisation.
› We launched Pearson Workforce Education which
delivers more than 60 online courses in high demand
occupational training areas from IT and Healthcare
to management and soft skills courses; and Propero,
which combines on-demand tutoring, student support
and online courses to expand access to higher education
and support degree completion.
› We announced the acquisition of a 5% stake in NOOK
Media for $89.5m in December 2012 with the option
to purchase up to an additional 5%, subject to certain
conditions. This strategic investment will help
accelerate customer access to digital content by
pairing the company’s leading expertise in online
learning with NOOK Media’s expertise in online
distribution and customer service. This will facilitate
improved discovery of available digital content and
services, as well as seamless access.
CASE STUDY
eCollege registrations
Student registrations at eCollege grew 3% to 8.7
million, despite pressure in the for-profit college
market. We won new online enterprise learning
contracts with California State University and
Rutgers University. Our strong managed
enrolment services and student marketing
product offering, coupled with continued strong
growth at Arizona State University, helped our
online enterprise learning business to grow 150%
to almost 44,000 enrolments. In November 2012,
we acquired EmbanetCompass for $650 million
which provides a full range of services targeted
towards online graduate programmes.
16 Pearson plc Annual report and accounts 2012
› We continued to produce strong growth in secure
online testing, an important market for the future.
We increased online testing volumes by more than
10%, delivering 6.5 million state accountability tests,
4.5 million constructed response items and 21 million
spoken tests. We now assess oral proficiency in
English, Spanish, French, Dutch, Arabic and Chinese.
We also launched the Online Assessment Readiness
Tool for the PARCC and the Smarter Balance
Assessment Consortium (SBAC) Common Core
consortia to help 45 states prepare for the transition
to online assessments.
› We won new state contracts in Colorado and
Missouri and a new contract with the College Board
to deliver ReadiStep, a middle school assessment that
measures and tracks college readiness skills. We
extended our contract with the College Board to
deliver the ACCUPLACER assessment, a computer-
adaptive diagnostic, placement and online intervention
system that supports 1,300 institutions and 7 million
students annually.
Assessment and Information highlights in 2012 include:
› At our Assessment and Information business,
revenues were flat in 2012. State funding pressures
and the transition to Common Core assessments
continued to make market conditions tough for our
state assessment and teacher testing businesses.
› The Partnership for Assessment of Readiness for
College and Careers (PARCC), a consortium of
23 states, awarded Pearson and Educational Testing
Service (ETS) the contract to develop test items that
will be part of the new English and mathematics
assessments to be administered from the 2014–2015
school year. The assessments will be based on what
students need to be ready for college and careers, and
will measure and track their progress along the way.
North American Education continued
CASE STUDY
Connections Education
Connections Education, which operates online
K-12 schools in 22 states and a nationwide
charter school programme, served more than
43,000 students in 2012, up 31% from 2011
and broadened its product offering to include
virtual classrooms for public school campuses.
Connections Academy Schools have
consistently high performance ratings,
particularly in states focused on measuring
growth in student learning.
Section 2 Our performance 17
FIN
AN
CIA
L S
TA
TE
ME
NT
SG
OV
ER
NA
NC
EO
VE
RV
IEW
OU
R P
ER
FO
RM
AN
CE
OU
R IM
PA
CT
ON
SO
CIE
TY
› Pearson gained share in very tough market conditions,
taking an estimated 31% of new adoptions where we
competed. enVisionMATH continued to perform
strongly, with a recent What Works Clearing House
study showing that students using the programme
outperformed peers by between six and eight
percentiles in maths across a broad range of student
populations. iLit, our new digital reading intervention
programme, was successfully implemented in 20
districts with early results showing strong reading gains.
› We won five Race To The Top (RTTT) state deals
(Kentucky, Florida, Colorado, North Carolina and
New York) led by Schoolnet. PowerSchool won three
state/province-level contracts (North Carolina, New
Brunswick and Northwest Territories). We launched
our mobile PowerSchool applications and grew our
third-party partner ecosystem to over 50 partners.
PowerSchool supports more than 12 million students,
up more than 20% on 2011 while Schoolnet supports
8.3 million students, up almost 160% on 2011.
› Our clinical assessment business was boosted by
strong growth at AIMSweb, our progress monitoring
service which enables early intervention and
remediation for struggling students. AIMSweb
delivered 58 million assessments in 2012, up 12%.
School highlights in 2012 include:
› In School, the textbook publishing market declined
15% in 2012, according to the Association of American
Publishers. There were several pressures on the
industry including weakness in state budgets, a lower
new adoption opportunity (total opportunity of
$380m in 2012 against $650m in 2011) and delays
in purchasing decisions during the transition to the
new Common Core standards.
OpenClass
OpenClass, Pearson’s free learning management
system, has been installed by almost 1,300 K-12
and college institutions in the US and now serves
approximately 100,000 users. In November 2012,
we launched Project Blue Sky, a cloud-based content
service that allows college instructors to combine
Open Educational Resources (OER) with instructor-
created and Pearson content.
CASE STUDY
18 Pearson plc Annual report and accounts 2012
CASE STUDY
KEY PERFORMANCE INDICATORS
International Education
Our businesses in emerging markets continued to perform strongly, supported by good enrolment trends and sustained investment.
Businesses in China
In China, student enrolments at Wall Street
English increased 15% to almost 61,000, boosted
by good underlying demand and the launch of
ten new centres taking the total to 66. Our
students rapidly acquired high-level English skills
with average grade levels achieved rising by 8%
during 2012. Enrolments at Global Education,
our test preparation services for English language
qualifications, increased 16% to more than
1 million, through 73 owned and 372 franchised
learning centres.
Sales Adjusted operating profit
2012 £1,568m 2012 £216m
2011 £1,424m 2011 £196m
Headline growth 10% Headline growth 10%
CER growth 13% CER growth 16%
Underlying growth 7% Underlying growth 11%
61,0002012
53,0002011
Wall Street English student enrolments in China
Section 2 Our performance 19
FIN
AN
CIA
L S
TA
TE
ME
NT
SG
OV
ER
NA
NC
EO
VE
RV
IEW
OU
R P
ER
FO
RM
AN
CE
OU
R IM
PA
CT
ON
SO
CIE
TY
Our businesses in emerging markets continued to
perform strongly, supported by good enrolment
trends and sustained investment. Our UK business
was resilient during the year despite significant
regulatory and policy changes across vocational and
general qualifications, apprenticeships and higher
education. In the rest of the world, a recovery in Japan
following the 2011 tsunami and a strong competitive
performance in Italy more than offset weak market
conditions in Spain.
Key highlights in 2012 include:
› In English Language Learning, Wall Street English
(WSE), Pearson’s worldwide chain of English language
centres for professionals, opened a net of 11 new
centres around the world, bringing the total number
to 460. Student numbers fell by 2% to more than
191,000, primarily due to the closure of a large
franchise centre in Chile with approximately 7,000
students. MyEnglishLabs enrolments grew 60% to
263,000 supported by the launch of our next
generation platform which supports 13 languages
and 43 new courses. We acquired GlobalEnglish, a
leading provider of cloud-based, on-demand Business
English learning, assessment and performance support
software, for $90m in cash in July 2012.
› More than 1.1 million students registered for our
MyLab digital learning, homework and assessment
programmes, an increase of 18%, with good growth in
school, ELT and institutional selling in higher education.
United Kingdom highlights in 2012 include:
› In the United Kingdom, we marked more than
6.3 million GCSE, A/AS Level and other examinations
with 90% using onscreen technology and more than
3.8 million test scripts for over half a million pupils
taking National Curriculum Tests at Key Stage Two
in 2012. We launched our Next Generation BTECs
which are now the leading vocational qualification
on the new funding and accountability frameworks in
schools. Our vocational qualifications business grew
well with the continued popularity of BTEC amongst
employers and universities and a strong performance
in work-based learning (with registrations now up to
170,000) further boosted by a good performance
from EDI.
CASE STUDY
Sistema success in Brazil
In Brazil, we ended 2012 with 533,000
students in our public and private
sistemas (or learning systems) and
added 24,000 students in our two
largest private sistemas, COC and
Dom Bosco, up 8% on 2011. Our public
sistema, NAME, includes the top
performing lower secondary school in
Brazil and test scores for all our public
school students are, on average, 20%
above the 2011 national IDEB standard
for 4th and 8th grade students.
20 Pearson plc Annual report and accounts 2012
International Education continued
› In South Africa we held share in school publishing in
market conditions which were tougher than expected
despite a year of major curriculum reform. Student
enrolments grew strongly at CTI, up 19% to more
than 10,000. We partnered with UNISA, South
Africa’s largest university and the largest distance
learning provider in Africa, to provide 30,000 students
with access to our MyLabs software, digital resources
and customised eBooks.
› In India, TutorVista is now managing 35 schools and
its multimedia teaching solution Digiclass is installed
in approximately 17,000 classrooms. ActiveTeach, our
digital learning platform for schools, was adopted by
200 schools serving approximately 100,000 students.
› In the Middle East, the Abu Dhabi Education Council
purchased our print and digital Maths and Science
resources for all schools from grades 6 to 10, the
American University of Sharjah adopted MyLabs for
four mathematics courses and three science courses,
and we are providing access to digital course content
for 5,000 students at Abu Dhabi’s Higher Colleges of
Technology through our Pearson e-texts iPad app.
CASE STUDY
New online university launch in Mexico
In Mexico, we partnered with local curriculum
and technology experts INITE to launch
UTEL, a new university enabling Mexicans to
enrol in online degree courses in management,
IT, marketing, engineering and computer
science. UTEL enrolled 2,500 undergraduate
students and 4,000 learners in shorter
corporate training or continuing professional
education courses. UTEL’s services arm, Scala,
signed its first contract to provide online
learning services to an existing higher
education institution.
Section 2 Our performance 21
FIN
AN
CIA
L S
TA
TE
ME
NT
SG
OV
ER
NA
NC
EO
VE
RV
IEW
OU
R P
ER
FO
RM
AN
CE
OU
R IM
PA
CT
ON
SO
CIE
TY
Our Professional Education business is focused
on publishing, training, testing and certification
for professionals. The weakness in our UK training
business, Pearson in Practice, had a significant negative
impact on our 2012 performance and resulted in our
decision to exit the business. Other parts of the
Professional division performed well.
Professional testing highlights in 2012 include:
› Professional testing continued to see good revenue
and profit growth with test volumes at Pearson VUE
up 7% on 2011 to almost 8 million with Certiport
adding an additional 2.3 million tests, up 13% on 2011.
There were key renewals of the National Council of
State Boards of Nursing contract running until 2019
and the Computing Technology Industry Association
contract was secured with Pearson VUE as the single
vendor running through to 2017.
Professional Education
› We won a number of new contracts including a
ten-year contract to administer all computer and
paper-based tests for the Australia CPA Professional
exams and five-year contracts with the National
Center for Assessment in Saudi Arabia and the
National Council of State Boards of Nursing to
provide the NCLEX-RN in Canada beginning in
2015 for ten Canadian registered nurse (RN)
regulatory bodies.
› The partnership with the American Council on
Education to develop an online General Educational
Development (GED) test aligned with new Common
Core standards has now launched computer-based
testing in 37 jurisdictions.
› Continuing our digital transformation, we adapted
our booking service for the Driving Standards Agency
(DSA) to work on mobile devices. We also introduced
one-to-many biometric matching technology into
testing centres to enhance fraud detection.
Professional training
› Professional training was very weak with our UK
adult training business, Pearson in Practice, facing a
dramatic fall in demand as a result of changes to the
apprenticeships programme. We believe this business
no longer has a sustainable model and announced in
January that we are to exit Pearson in Practice. The
cost of exit and impairment is £113m and is reported
as a loss on closure in Pearson’s 2012 statutory accounts.
› TQ continues to make significant progress in the
direct delivery of training services overseas. In Saudi
Arabia, we extended the contract to operate the
Saudi Petroleum Services Institute for five years and
won a five-year contract to run a new Institute at Al
Khafji. In Oman, a TQ-led consortium won the bid
to provide training to BP, including a wide range of
technical and English language training for BP workers
as they prepare to open up the Khazzan oilfield for
full scale production in 2016.
Professional publishing highlights in 2012 include:
› Professional publishing grew modestly with good profit
growth. In the US, growth of eBook sales and other
digital products and services continued to outpace
ongoing challenges in the traditional retail channel.
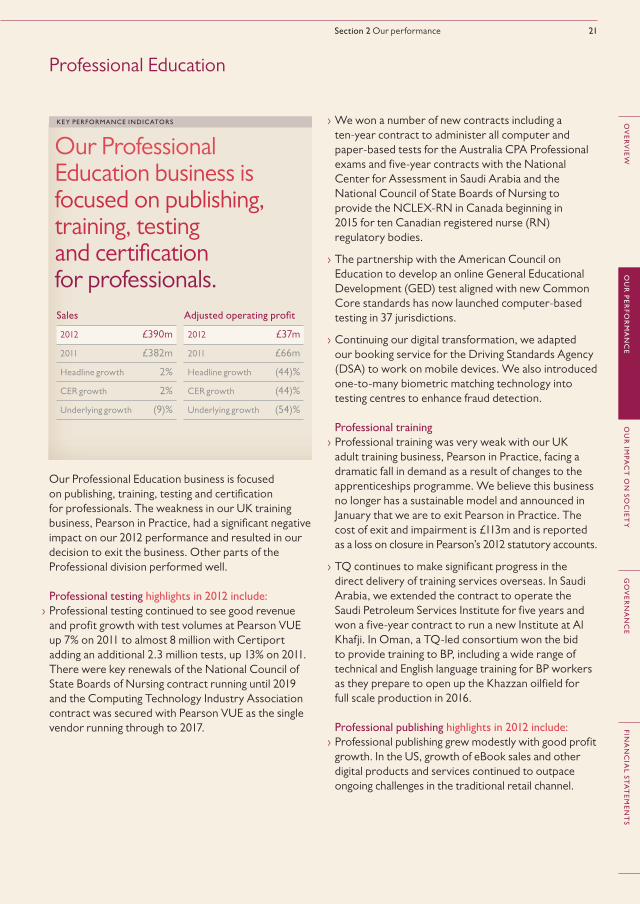
Our Professional Education business is focused on publishing, training, testing and certification for professionals.
KEY PERFORMANCE INDICATORS
Sales Adjusted operating profit
2012 £390m 2012 £37m
2011 £382m 2011 £66m
Headline growth 2% Headline growth (44)%
CER growth 2% CER growth (44)%
Underlying growth (9)% Underlying growth (54)%
22 Pearson plc Annual report and accounts 2012
CASE STUDY
KEY PERFORMANCE INDICATORS
Financial Times Group
The FT Group is a leading provider of essential information in attractive niches of the global business information market.
Sales Adjusted operating profit*
2012 £443m 2012 £49m
2011 £427m 2011 £76m
Headline growth 4% Headline growth (36)%
CER growth 4% CER growth (32)%
Underlying growth 4% Underlying growth (7)%
* Reflects the absence in 2012
of the £20m 2011 profit
from Pearson’s stake in FTSE
International following its sale.
Financial Times digital subscriptions
Growth in digital readership
The Financial Times digital readership continues to
grow strongly with digital subscriptions increasing
18% to almost 316,000 and with 3.5 million FT
web app users. 316,0002012
267,0002011
Section 2 Our performance 23
FIN
AN
CIA
L S
TA
TE
ME
NT
SG
OV
ER
NA
NC
EO
VE
RV
IEW
OU
R P
ER
FO
RM
AN
CE
OU
R IM
PA
CT
ON
SO
CIE
TY
› Educational services are an important area of
expansion. The FT Non-Executive Director
Certificate (in partnership with Pearson Learning
Studio and Edexcel) was attended by over 150
candidates across five intakes. FT Newslines, an
annotations tool on FT.com that allows students and
faculties from around the world to create and share
annotations on FT articles, is now being used at many
business schools. The new FTChinese MBA Gym App,
which features tailored training courses categorised
by topic, has ranked among the top paid-for education
apps on the iTunes Store and was recognised as one
of the ‘App Store Best of 2012’ by Apple in China.
› Money-Media revenues and profits continued to grow
well boosted by a strong subscription performance,
with the number of individual users growing 6% year
on year to 220,000, and new product launches,
including Ignites Retirement Research which broadens
Money-Media’s product offering into the investment
industry research sector.
Economist Group highlights in 2012 include:
› In The Economist Group (50% owned by Pearson),
The Economist launched three HTML5-powered
apps in collaboration with FT Labs. The Economist’s
worldwide print and digital circulation increased by
2% to 1.67 million (at 31 December 2012) of which
150,000 customers bought digital-only copies. The
Economist Intelligence Unit acquired Clearstate in
Singapore and Bazian, a London-based healthcare
research company, as part of its strategy to build a
a strong offering following investment in its product
breadth, strong editorial analysis and global presence.
We launched several new products and services,
including a new mergermarket Android app, a
Debtwire Analytics platform in Europe and Policy
and Regulatory Report (PaRR), a global intelligence,
analysis and proprietary data product focused on
competition law, IP and trade law, and sector-specific
regulatory change. We also expanded our coverage in
faster growth markets such as Latin America, China
and the Middle East, generating new business and
extending our international reach.
Digital and services revenues accounted for 50% of
FT Group revenues (31% in 2008). Content revenues
comprised 61% of revenues (48% in 2008), while
advertising accounted for 39% of FT Group revenues
(52% in 2008).
Financial Times highlights in 2012 include:
› The Financial Times digital readership continues to
grow strongly with digital subscriptions increasing 18%
to almost 316,000 and with 3.5 million FT web app
users. The FT’s total paid circulation was more than
602,000 across print and online, modestly up on 2011,
with digital subscriptions exceeding print circulation
for the first time. The FT now has almost 2,800 direct
corporate licences, up 40% on 2011.
› We continued to invest in new products and
innovation, including launching a Windows 8 app and
the FT web app on Chrome for Android; a bespoke
web app for Latin America; a rebrand of the
conferences division, FT Live, with the introduction
of live streaming at key events; and the launch of
GatekeeperIQ, a new subscription service to track
large, retail investment platforms.
› Advertising was generally weak and volatile with
poor visibility but the FT grew market share with
mobile, luxury and business education showing good
growth. Digital revenues benefited from the launch
of FT SmartMatch, which automatically puts client
content such as articles, white papers and videos in
front of FT.com users while they’re reading related
FT news stories.
› FT Live, our events business, continued to grow
strongly and launch new events, including the Global
Commodities Summit, delivering more than 200
events that attracted over 17,000 delegates.
We launched a digital portal that offers on-demand
webinars, livestreamed events and social media tools.
CASE STUDY
Growth in mobile
Mobile devices now account
for 30% of FT.com traffic and
15% of new subscriptions.
24 Pearson plc Annual report and accounts 2012
CASE STUDY
KEY PERFORMANCE INDICATORS
Penguin
Penguin is one of the most famous brands in book publishing, known around the world for the quality of its publishing and its consistent record of innovation.
Sales Adjusted operating profit
2012 £1,053m 2012 £98m
2011 £1,045m 2011 £111m
Headline growth 1% Headline growth (12)%
CER growth 1% CER growth (11)%
Underlying growth (2)% Underlying growth (14)%
255
254
255
254
US bestsellers No.
12
11
The number of Penguin books entering the Top Ten bestseller lists in the US (New York Times).
90
78
90
78
UK bestsellers No.
12
11
The number of Penguin books entering the Top Ten besteller lists in the UK (Nielsen Bookscan Top Ten).
eBook sales % of sales
eBook revenue grew strongly in 2012 and accounted for 17% of Penguin’s global revenue
2011
12%2012
17%
Section 2 Our performance 25
FIN
AN
CIA
L S
TA
TE
ME
NT
SG
OV
ER
NA
NC
EO
VE
RV
IEW
OU
R P
ER
FO
RM
AN
CE
OU
R IM
PA
CT
ON
SO
CIE
TY
In October 2012, Pearson and Bertelsmann
announced an agreement to create the world’s leading
consumer publishing company by combining Penguin
and Random House. Pearson will own 47% of the
combined organisation, which is subject to regulatory
approval and is expected to complete in the second
half of 2013. We believe that the combined
organisation will have a stronger platform and greater
resources to invest in rich content, new digital
publishing models and high-growth emerging markets.
In market conditions that remained challenging,
Penguin had a solid year with momentum and share
improving in the second half of the year. It also made
several moves to offer a broader range of services to
more authors across more platforms in more markets.
Key highlights in 2012 include:
› In the United States, we published 255 New York Times
bestsellers (254 in 2011) including No Easy Day: The
Firsthand Account of the Mission that Killed Osama bin
Laden by ‘Mark Owen’, Bared to You by Sylvia Day and
Nate Silver’s The Signal and the Noise as well as new
titles from bestselling authors including Ken Follett,
Nora Roberts, Tom Clancy and Harlan Coben.
› In the UK, we published 90 Bookscan bestsellers,
our best year on record (and compared to 78 in 2011)
including Sylvia Day’s Bared to You; Jamie Oliver’s
15 Minute Meals; Clare Balding’s My Animals and Other
Family and Daniel Kahneman’s Thinking, Fast and Slow.
› eBook revenue grew strongly in 2012 and accounted
for 17% of Penguin’s global revenue (12% in 2011),
and almost 30% in the US (20% in 2011). We
continued to invest in digital publishing programmes,
making eBooks available in new markets including
Australia, India, Brazil and China; launching a number
of digital-only imprints around the world and
expanding our eSpecials list. Global app sales grew
by more than 200% driven by brands including Wreck
this App, Mad Libs, Moshi Monsters and LEGO®.
DK was Apple’s only trade publisher launch partner
for the January launch of the iBooks Author 2 platform
and now has more than 50 interactive titles available.
CASE STUDY
Strong publishing list for 2013
Penguin has a strong publishing list for
2013 with major new books from authors
including Khaled Hosseini, Elizabeth Gilbert,
Sylvia Day, Nora Roberts, Nathaniel
Philbrick and Sarah Dessen in the US,
and Jamie Oliver, John Le Carré, Jennifer
Saunders, Malcolm Gladwell, Steven D Levitt
& Stephen J Dubner, Jeremy Paxman,
Jonathan Coe and John Green in the UK. DK
will launch more LEGO® titles, including the
LEGO® Play book, and Mary Berry’s Cookery
Course. New apps for 2013 include Anne
Frank: The Diary of a Young Girl, I’m Ready
to Spell and Poems by Heart.
26 Pearson plc Annual report and accounts 2012
Penguin continued
› In Brazil, we acquired 45% of Companhia das Letras,
a leading trade book publisher. In India, we launched
a local eBook programme and enjoyed considerable
success in commercial fiction with bestselling authors
including Ravinder Singh and Shobhaa De. In China,
we expanded our local publishing programmes in both
Chinese and English with more than 100 titles now
available, including a first local language top ten title,
tennis player Li Na’s autobiography, and we launched
our first list of eBooks.
› DK performed strongly and grew share globally led
by our LEGO® publishing list. In the UK, DK
celebrated a number one bestseller with Mary Berry’s
Complete Cookbook, which has sold more than one
million copies worldwide. BradyGames had
bestsellers with Borderlands 2, Skylanders Giants
and Call of Duty: Black Ops II.
› Author Solutions, which we acquired in July 2012 for
$116m, had a good start. It is the world’s leading
provider of professional self-publishing services and
broadens our expertise in online marketing, consumer
analytics, professional services and user-generated
content. In February 2013 Penguin India launched
Partridge, a new self-publishing imprint, in partnership
with Author Solutions.
Pick of the yearIn 2012, Penguin enjoyed bestseller success around the world, including publishing 255 New York Times
bestsellers and 90 top ten bestsellers in the UK. Here’s a taste of the highlights:
CASE STUDY
Section 2 Our performance 27
FIN
AN
CIA
L S
TA
TE
ME
NT
SG
OV
ER
NA
NC
EO
VE
RV
IEW
OU
R P
ER
FO
RM
AN
CE
OU
R IM
PA
CT
ON
SO
CIE
TY
to a loss of £19m in 2011. The majority of the loss in
2012 relates to movements in the valuation of put
options associated with acquisitions. In 2011 the loss
relates mainly to foreign exchange differences on a
proportion of the unhedged US dollar proceeds
from the Interactive Data sale in 2010.
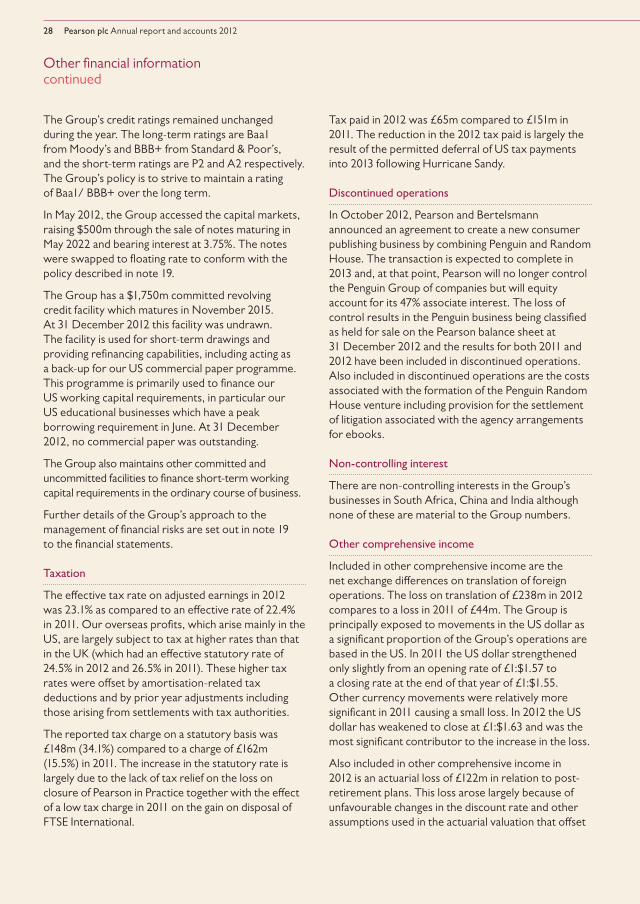
Funding position and liquid resources
The Group finances its operations by a mixture of
cash flows from operations, short-term borrowings
from banks and commercial paper markets, and
longer-term loans from banks and capital markets.
Our objective is to secure continuity of funding at a
reasonable cost from diverse sources and with varying
maturities. The Group does not use off-balance sheet
special purpose entities as a source of liquidity or for
any other financing purposes. The net debt position
of the Group is set out below.
Acquisition activity in 2012, is a large contributor to
the increase in the Group’s net debt. Reflecting the
geographical and currency split of our business, a large
proportion of our debt is denominated in US dollars
(see note 19 for our policy). The strengthening of
sterling against the US dollar during 2012 (from $1.55
to $1.63:£1) decreases the sterling equivalent value
of our reported net debt.
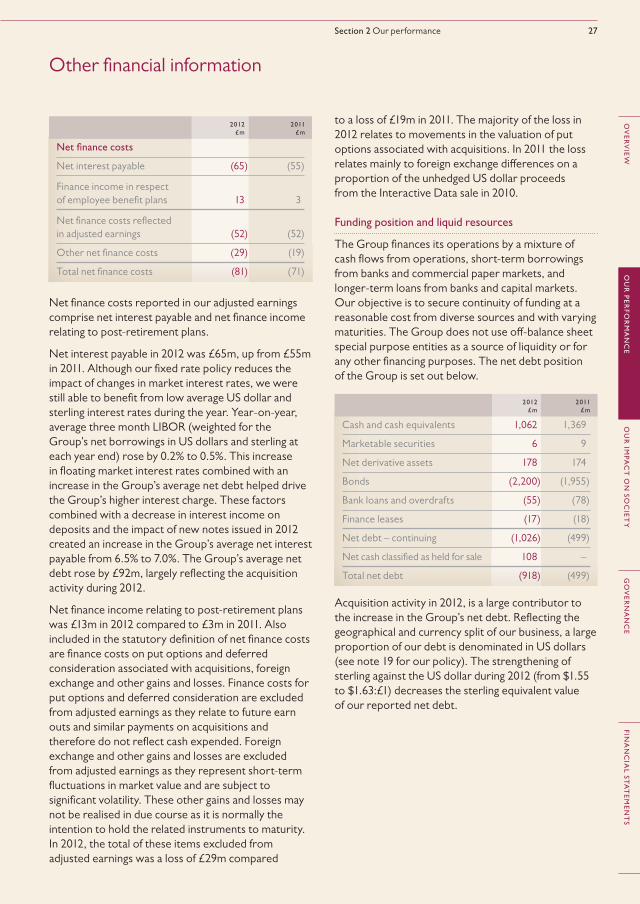
Net finance costs reported in our adjusted earnings
comprise net interest payable and net finance income
relating to post-retirement plans.
Net interest payable in 2012 was £65m, up from £55m
in 2011. Although our fixed rate policy reduces the
impact of changes in market interest rates, we were
still able to benefit from low average US dollar and
sterling interest rates during the year. Year-on-year,
average three month LIBOR (weighted for the
Group’s net borrowings in US dollars and sterling at
each year end) rose by 0.2% to 0.5%. This increase
in floating market interest rates combined with an
increase in the Group’s average net debt helped drive
the Group’s higher interest charge. These factors
combined with a decrease in interest income on
deposits and the impact of new notes issued in 2012
created an increase in the Group’s average net interest
payable from 6.5% to 7.0%. The Group’s average net
debt rose by £92m, largely reflecting the acquisition
activity during 2012.
Net finance income relating to post-retirement plans
was £13m in 2012 compared to £3m in 2011. Also
included in the statutory definition of net finance costs
are finance costs on put options and deferred
consideration associated with acquisitions, foreign
exchange and other gains and losses. Finance costs for
put options and deferred consideration are excluded
from adjusted earnings as they relate to future earn
outs and similar payments on acquisitions and
therefore do not reflect cash expended. Foreign
exchange and other gains and losses are excluded
from adjusted earnings as they represent short-term
fluctuations in market value and are subject to
significant volatility. These other gains and losses may
not be realised in due course as it is normally the
intention to hold the related instruments to maturity.
In 2012, the total of these items excluded from
adjusted earnings was a loss of £29m compared
Other financial information
2012
£m
2011
£m
Cash and cash equivalents 1,062 1,369
Marketable securities 6 9
Net derivative assets 178 174
Bonds (2,200) (1,955)
Bank loans and overdrafts (55) (78)
Finance leases (17) (18)
Net debt – continuing (1,026) (499)
Net cash classified as held for sale 108 –
Total net debt (918) (499)
2012
£m
2011
£m
Net finance costs
Net interest payable (65) (55)
Finance income in respect
of employee benefit plans 13 3
Net finance costs reflected
in adjusted earnings (52) (52)
Other net finance costs (29) (19)
Total net finance costs (81) (71)
28 Pearson plc Annual report and accounts 2012
Tax paid in 2012 was £65m compared to £151m in
2011. The reduction in the 2012 tax paid is largely the
result of the permitted deferral of US tax payments
into 2013 following Hurricane Sandy.
Discontinued operations
In October 2012, Pearson and Bertelsmann
announced an agreement to create a new consumer
publishing business by combining Penguin and Random
House. The transaction is expected to complete in
2013 and, at that point, Pearson will no longer control
the Penguin Group of companies but will equity
account for its 47% associate interest. The loss of
control results in the Penguin business being classified
as held for sale on the Pearson balance sheet at
31 December 2012 and the results for both 2011 and
2012 have been included in discontinued operations.
Also included in discontinued operations are the costs
associated with the formation of the Penguin Random
House venture including provision for the settlement
of litigation associated with the agency arrangements
for ebooks.
Non-controlling interest
There are non-controlling interests in the Group’s
businesses in South Africa, China and India although
none of these are material to the Group numbers.
Other comprehensive income
Included in other comprehensive income are the
net exchange differences on translation of foreign
operations. The loss on translation of £238m in 2012
compares to a loss in 2011 of £44m. The Group is
principally exposed to movements in the US dollar as
a significant proportion of the Group’s operations are
based in the US. In 2011 the US dollar strengthened
only slightly from an opening rate of £1:$1.57 to
a closing rate at the end of that year of £1:$1.55.
Other currency movements were relatively more
significant in 2011 causing a small loss. In 2012 the US
dollar has weakened to close at £1:$1.63 and was the
most significant contributor to the increase in the loss.
Also included in other comprehensive income in
2012 is an actuarial loss of £122m in relation to post-
retirement plans. This loss arose largely because of
unfavourable changes in the discount rate and other
assumptions used in the actuarial valuation that offset
The Group’s credit ratings remained unchanged
during the year. The long-term ratings are Baa1
from Moody’s and BBB+ from Standard & Poor’s,
and the short-term ratings are P2 and A2 respectively.
The Group’s policy is to strive to maintain a rating
of Baa1/ BBB+ over the long term.
In May 2012, the Group accessed the capital markets,
raising $500m through the sale of notes maturing in
May 2022 and bearing interest at 3.75%. The notes
were swapped to floating rate to conform with the
policy described in note 19.
The Group has a $1,750m committed revolving
credit facility which matures in November 2015.
At 31 December 2012 this facility was undrawn.
The facility is used for short-term drawings and
providing refinancing capabilities, including acting as
a back-up for our US commercial paper programme.
This programme is primarily used to finance our
US working capital requirements, in particular our
US educational businesses which have a peak
borrowing requirement in June. At 31 December
2012, no commercial paper was outstanding.
The Group also maintains other committed and
uncommitted facilities to finance short-term working
capital requirements in the ordinary course of business.
Further details of the Group’s approach to the
management of financial risks are set out in note 19
to the financial statements.
Taxation
The effective tax rate on adjusted earnings in 2012
was 23.1% as compared to an effective rate of 22.4%
in 2011. Our overseas profits, which arise mainly in the
US, are largely subject to tax at higher rates than that
in the UK (which had an effective statutory rate of
24.5% in 2012 and 26.5% in 2011). These higher tax
rates were offset by amortisation-related tax
deductions and by prior year adjustments including
those arising from settlements with tax authorities.
The reported tax charge on a statutory basis was
£148m (34.1%) compared to a charge of £162m
(15.5%) in 2011. The increase in the statutory rate is
largely due to the lack of tax relief on the loss on
closure of Pearson in Practice together with the effect
of a low tax charge in 2011 on the gain on disposal of
FTSE International.
Other financial information continued
Section 2 Our performance 29
FIN
AN
CIA
L S
TA
TE
ME
NT
SG
OV
ER
NA
NC
EO
VE
RV
IEW
OU
R P
ER
FO
RM
AN
CE
OU
R IM
PA
CT
ON
SO
CIE
TY
by continuing asset returns and deficit funding. In total,
our worldwide deficit in respect of pensions and post-
retirement benefits increased from £141m in 2011 to
£198m at the end of 2012; this amount includes a
deficit of £26m which specifically relates to Penguin
and has been classified as a liability held for sale.
Acquisitions
In May 2012, the Professional business acquired
Certiport Inc. for $140m. Certiport is based in
the US and is a leading provider of certification and
assessment programmes in IT and digital literacy.
In July 2012, the International Education business
completed the purchase of GlobalEnglish
Corporation, a leading provider of cloud-based,
on demand business English learning, assessment
and performance support software for a net cash
consideration of $90m. Also in July 2012, Penguin
acquired Author Solutions, Inc., the world’s leading
provider of professional self-publishing services, for
$116m in cash. The $650m acquisition of
EmbanetCompass by the North American Education
business was completed in November 2012.
EmbanetCompass partners with leading non-profit
colleges in North America to provide online learning
solutions for university programmes.
Net cash consideration for all acquisitions made in
the year ended 31 December 2012 was £759m and
provisional goodwill recognised was £505m. In total,
acquisitions completed in the year contributed an
additional £45m of sales and £5m of operating profit
before acquisition costs and intangible amortisation.
Return on invested capital (ROIC)
Our ROIC is calculated as total adjusted operating
profit less cash tax, expressed as a percentage of
average gross invested capital. ROIC remained flat at
9.1% in both 2011 and 2012. The impact of lower cash
tax payments in 2012 has been offset by slightly lower
profit and increased investment in new acquisitions.
the effect of continuing asset returns and deficit
funding in the UK plan. In 2011 the loss of £64m
was also due to discount rate and other assumption
changes outweighing improved asset returns and
deficit funding.
Dividends
The dividend accounted for in our 2012 financial
statements totalling £346m represents the final
dividend in respect of 2011 (28.0p) and the interim
dividend for 2012 (15.0p). We are proposing a final
dividend for 2012 of 30.0p, bringing the total paid and
payable in respect of 2012 to 45.0p, a 7% increase on
2011. This final 2012 dividend was approved by the
board in February 2013, is subject to approval at the
forthcoming AGM and will be charged against 2013
profits. For 2012, the dividend is covered 1.9 times
by adjusted earnings.
We seek to maintain a balance between the
requirements of our shareholders for a rising
stream of dividend income and the reinvestment
opportunities which we identify around the Group
and through acquisitions. The board expects to raise
the dividend above inflation, more in line with earnings
growth, thereby maintaining dividend cover at around
two times earnings in the long term.
Pensions
Pearson operates a variety of pension plans. Our UK
Group plan has by far the largest defined benefit section.
We have some smaller defined benefit sections in the
US and Canada but, outside the UK, most of our
companies operate defined contribution plans.
The charge to profit in respect of worldwide
pensions and post-retirement benefits for continuing
operations amounted to £84m in 2012 (2011: £82m)
of which a charge of £97m (2011: £85m) was reported
in operating profit and a net benefit of £13m (2011:
£3m) was reported against net finance costs. In
addition to these amounts, in 2012 a charge of £11m
(2011: £11m) has been reported in operating profit
in respect of discontinued operations.
The overall surplus on the UK Group plan of £25m
at the end of 2011 has become a deficit of £19m
at 31 December 2012. The deficit has arisen due
to unfavourable movements in the discount rate and
other assumptions used to value the liabilities, offset
30 Pearson plc Annual report and accounts 2012
Supplier payment policy
Operating companies are responsible for agreeing
the terms and conditions under which business
transactions with their suppliers are conducted.
These supplier payment terms vary by operating
company, reflecting the different industries and
countries in which they operate. It is company policy
that suppliers are aware of such terms of payment and
that payments to them are made in accordance with
these, provided that the supplier is also complying
with all the relevant terms and conditions. Group
trade creditors at 31 December 2012 were equivalent
to approximately 34 days of purchases during the year
ended on that date. The company does not have any
significant trade creditors and therefore is unable to
disclose average supplier payment terms.
Capital expenditure
Net capital expenditure in the year on property,
plant equipment and software amounted to £152m.
The analysis of capital expenditure and details of
capital commitments are shown in notes 10, 11 and
36 of the financial statements.
Related party transactions
Transactions with related parties are shown in note 37
of the financial statements.
Post balance sheet events
In January 2013, the Group completed the purchase
of a 5% equity investment in NOOK Media, LLC for
$89.5m. NOOK Media is a new company consisting
of Barnes & Noble’s digital businesses including its
NOOK e-reader and tablets, the NOOK digital
bookstore and its 674 college bookstores across
America.
In February 2013 the Group completed the purchase
of the remaining minority interest in Tutorvista,
the Bangalore-based tutoring services company
for £17m.
Other financial information continued
Section 2 Our performance 31
FIN
AN
CIA
L S
TA
TE
ME
NT
SG
OV
ER
NA
NC
EO
VE
RV
IEW
OU
R P
ER
FO
RM
AN
CE
OU
R IM
PA
CT
ON
SO
CIE
TY
EMERGING MARKETS
We conduct regular risk reviews to identify risk
factors which may affect our business and financial
performance and to assist management in prioritising
their response to those risks. Our Group internal
audit and risk assurance function facilitates risk
reviews with each business, shared service operations
and corporate functions, identifying measures and
controls to mitigate these risks. These reviews are
designed so that the different businesses are able
to tailor and adapt their risk management processes
to suit their specific circumstances. Management
is responsible for considering and executing the
appropriate action to mitigate these risks whenever
possible. It is not possible to identify every risk that
could affect our businesses, and the actions taken
to mitigate the risks described below cannot
provide absolute assurance that a risk will not
materialise and/or adversely affect our business
or financial performance.
Our principal risks and uncertainties are outlined
below. These are the most significant risks that may
adversely affect our business strategy, financial
position or future performance. The risk assessment
process evaluates the probability of the risk
materialising and the financial or strategic impact of
the risk. Those risks which have a higher probability
and significant impact on strategy, reputation or
operations or a financial impact greater than
£40 million are identified as principal risks. The risk
assessment and reporting criteria are designed to
provide the board with a consistent, Group-wide
perspective of the key risks. The reports to the board,
which are submitted twice per year, include an
assessment of the probability and impact of risks
materialising, as well as risk mitigation initiatives and
their effectiveness.
Principal risks and uncertainties
PRINCIPAL RISKS – IMPACT AND PROBABIL ITY
BRAND/REPUTATION PERCEPTION
TESTING FAILURES
EDUCATION REGULATION AND FUNDING
TECHNOLOGY CHANGES
ECONOMIC UNCERTAINTIES
DATA PRIVACY BREACH
INTELLECTUAL PROPERTY RIGHTS
ACQUIS ITIONS AND MERGERS
IMP
AC
T
PROBABIL ITY
32 Pearson plc Annual report and accounts 2012
Principal risks and uncertainties continued
Principal risks Mitigating factors
TECHNOLOGY CHANGES
Our education, business information and book publishing businesses will be impacted by the rate of and state of technological change, including the digital revolution and other disruptive technologies.
We operate in markets which are dependent on Information Technology (IT) systems and technological change.
We are transforming our products and services for the digital environment along with managing our print inventories. Our content is being adapted to new technologies across our businesses and is priced to drive demand. We develop new distribution channels by adapting our product offering and investing in new formats. We continue to monitor contraction in the consumer book market to minimise the impact of customer bankruptcy.
We mitigate IT risks by establishing strong IT policies and operational controls, employing project management techniques to manage new software developments and/or systems implementations and have implemented an array of security measures to protect our IT assets from attacks or failures that could impact the confidentiality, availability or integrity of our systems.
EDUCATION REGULATION AND FUNDING
Our US educational solutions and assessment businesses and our UK training businesses may be adversely affected by changes in government funding resulting from either general economic conditions, changes in government educational funding, programmes, policy decisions, legislation and/or changes in the procurement processes.
In the US we actively monitor changes through participation in advisory boards and representation on standard setting committees. Our customer relationship teams have detailed knowledge of each state market. We are investing in new and innovative ways to expand and combine our product and services to provide a superior customer offering when compared to our competitors, thereby reducing our reliance on any particular funding stream in the US market. We work through our own government relations team and our industry trade associations including the Association of American Publishers. We are also monitoring municipal funding and the impact on our education receivables.
In the UK we maintain relationships with those government departments and agencies that are responsible for policy and funding. We work proactively with them to ensure our education, training and apprenticeship programmes meet existing and new government objectives at the right quality. Changes in the UK government’s funding policy for apprenticeships affected the business model for the Pearson in Practice adult training business. As a result, in January 2013 we announced that we will exit this particular business. We will continue to provide training and support for young adults who wish to develop skills and enter the UK workforce through our qualifications and curriculum businesses.
ECONOMIC UNCERTAINTIES
Global economic conditions may adversely impact our financial performance.
A significant deterioration in Group profitability and/ or cash flow caused by prolonged economic instability could reduce our liquidity and/or impair our financial ratios, and trigger a need to raise additional funds from the capital markets and/or renegotiate our banking covenants.
We generate a substantial proportion of our revenue in foreign currencies, particularly the US dollar, and foreign exchange rate fluctuation could adversely affect our earnings and the strength of our balance sheet.
The Group’s approach to funding is described on page 27 and the Group’s approach to the management of financial risks is set out in note 19 to the financial statements.
Section 2 Our performance 33
FIN
AN
CIA
L S
TA
TE
ME
NT
SG
OV
ER
NA
NC
EO
VE
RV
IEW
OU
R P
ER
FO
RM
AN
CE
OU
R IM
PA
CT
ON
SO
CIE
TY
Principal risks Mitigating factors
INTELLECTUAL PROPERTY RIGHTS
If we do not adequately protect our intellectual property and proprietary rights our competitive position and results may be adversely affected and limit our ability to grow.
We seek to mitigate this type of risk through general vigilance, co-operation with other publishers and trade associations, advances in technology, as well as recourse to law as necessary. Digital rights management standards and monitoring programmes have been developed. We have a piracy task force to identify weaknesses and remediate breaches. We monitor activities and regulations in each market for developments in copyright/intellectual property law and enforcement and take legal action where necessary.
EMERGING MARKETS
Our investment into inherently riskier emerging markets is growing and the returns may be lower than anticipated.
We draw on our experience of developing businesses outside our core markets and our existing international infrastructure to manage specific country risks. We continue to strengthen our financial control and managerial resources in these markets to manage expansion. The diversification of our international portfolio, and relative size of ‘emerging markets’ in relation to the Group, further minimises the effect any one territory could have on the overall Group results.
DATA PRIVACY BREACH
Failure to comply with data privacy regulations and standards or weakness in internet security could result in a major data privacy breach causing reputational damage to our brands and financial loss.
Through our global security team we have established various data privacy and security programmes. We constantly test and re-evaluate our data security procedures and controls across all our businesses with the aim of ensuring personal data is secured and we comply with relevant legislation and contractual requirements. We pursue appropriate privacy accreditations, e.g., TRUSTe Privacy and Safe Harbor Seal. We regularly monitor regulation changes to assess impact on existing processes and programmes.
TESTING FAILURES
A control breakdown or service failure in our school assessment businesses could result in financial loss and reputational damage.
Our professional services and school assessment businesses involve complex contractual relationships with both government agencies and commercial customers for the provision of various testing services. Our financial results, growth prospects and/or reputation may be adversely affected if these contracts and relationships are poorly managed.
We seek to minimise the risk of a breakdown in our student marking with the use of robust quality assurance procedures and controls and oversight of contract performance, combined with our investment in technology, project management and skills development of our people.
In addition to the internal business procedures and controls implemented to ensure we successfully deliver on our contractual commitments, we also seek to develop and maintain good relationships with our customers to minimise associated risks.
We also look to diversify our portfolio to minimise reliance on any single contract.
ACQUIS ITIONS AND MERGERS
Failure to generate anticipated revenue growth, synergies and/or cost savings from acquisitions, mergers and other business combinations could lead to goodwill and intangible asset impairments.
We perform pre-transaction due diligence and closely monitor actual performance to ensure we are meeting operational and financial targets. Any divergence from these plans will result in management action to improve performance and minimise the risk of any impairments. Executive management and the board receive regular reports on the status of acquisition and mergers.
In October 2012, we announced an agreement with Bertelsmann to combine our respective consumer publishing businesses in a newly-created venture named Penguin Random House. The combination is subject to customary regulatory and other approvals and is expected to complete in the second half of 2013.
BR AND/REPUTATION PERCEPTION
Our business depends on a strong brand, and any failure to maintain, protect and enhance our brand would hurt our ability to retain or expand our business.
We mitigate this risk through the development of comprehensive processes to enable our business units to effectively manage relationships with stakeholders, customers, communities and employees. We have an ongoing process to understand and evaluate potential brand threats and monitor and evaluate information about our brand across media sources.