+ All Categories
Home > Documents > Section 20 Construction and Housing - Census.gov 20 Construction and Housing This section presents...

Section 20 Construction and Housing - Census.gov 20 Construction and Housing This section presents...

Date post: 10-Jun-2018
Category:
Upload: ledang
View: 214 times
Download: 0 times
Share this document with a friend
28
Section 20 Construction and Housing This section presents data on the con- struction industry and on various indica- tors of its activity and costs; on housing units and their characteristics and occu- pants; and on the characteristics and vacancy rates for commercial buildings. This edition contains data from the 2005 American Housing Survey. The principal source of these data is the U.S. Census Bureau, which issues a vari- ety of current publications, as well as data from the decennial census. Current construction statistics compiled by the Census Bureau appear in its New Residen- tial Construction and New Residential Sales press releases and Web site <http://www.census.gov/const/www/>. Statistics on expenditures by owners of residential properties are issued quarterly and annually in Expenditures for Residen- tial Improvements and Repairs. Value of New Construction Put in Place presents data on all types of construction. Reports of the censuses of construction industries (see below) are also issued on various topics. Other Census Bureau publications include the Current Housing Reports series, which comprise the quarterly Housing Vacan- cies, the quarterly Market Absorption of Apartments, the biennial American Housing Survey (formerly Annual Housing Survey), and reports of the censuses of housing and of construction industries. Other sources include the monthly Dodge Construction Potentials of McGraw-Hill Construction, New York, NY, which present national and state data on con- struction contracts; the National Associa- tion of Home Builders with state-level data on housing starts; the NATIONAL ASSOCIATION OF REALTORS®, which pre- sents data on existing home sales; the Bureau of Economic Analysis, which pre- sents data on residential capital and gross housing product; and the U.S. Energy Information Administration, which pro- vides data on commercial buildings through its periodic sample surveys. Censuses and surveys—Censuses of the construction industry were first con- ducted by the Census Bureau for 1929, 1935, and 1939; beginning in 1967, a census has been taken every 5 years (through 2002, for years ending in ‘‘2’’ and ‘‘7’’). The latest reports are part of the 2002 Economic Census. See text, Section 15, Business Enterprise. The construction sector of the economic census, covers all employer establish- ments primarily engaged in (1) building construction by general contractors or operative builders; (2) heavy (nonbuild- ing) construction by general contractors; and (3) construction by special trade con- tractors. This sector includes construction management and land subdividers and developers. The 2002 census was con- ducted in accordance with the 2002 North American Industrial Classification System (NAICS). See text, Section 15, Business Enterprise. From 1850 through 1930, the Census Bureau collected some housing data as part of its censuses of population and agriculture. Beginning in 1940, separate censuses of housing have been taken at 10-year intervals. For the 1970 and 1980 censuses, data on year-round housing units were collected and issued on occu- pancy and structural characteristics, plumbing facilities, value, and rent; for 1990 such characteristics were presented for all housing units. The American Housing Survey (Current Housing Reports Series H-150 and H-170), which began in 1973, provided an annual and ongoing series of data on selected housing and demographic characteristics until 1983. In 1984, the name of the sur- vey was changed from the Annual Hous- ing Survey. Currently, national data are collected every other year, and data for Construction and Housing 585 U.S. Census Bureau, Statistical Abstract of the United States: 2009
Transcript

Section 20

Construction and Housing

This section presents data on the con-struction industry and on various indica-tors of its activity and costs; on housingunits and their characteristics and occu-pants; and on the characteristics andvacancy rates for commercial buildings.This edition contains data from the 2005American Housing Survey.

The principal source of these data is theU.S. Census Bureau, which issues a vari-ety of current publications, as well asdata from the decennial census. Currentconstruction statistics compiled by theCensus Bureau appear in its New Residen-tial Construction and New ResidentialSales press releases and Web site<http://www.census.gov/const/www/>.Statistics on expenditures by owners ofresidential properties are issued quarterlyand annually in Expenditures for Residen-tial Improvements and Repairs. Value ofNew Construction Put in Place presentsdata on all types of construction. Reportsof the censuses of construction industries(see below) are also issued on varioustopics.

Other Census Bureau publications includethe Current Housing Reports series, whichcomprise the quarterly Housing Vacan-cies, the quarterly Market Absorptionof Apartments, the biennial AmericanHousing Survey (formerly Annual HousingSurvey), and reports of the censuses ofhousing and of construction industries.

Other sources include the monthly DodgeConstruction Potentials of McGraw-HillConstruction, New York, NY, whichpresent national and state data on con-struction contracts; the National Associa-tion of Home Builders with state-leveldata on housing starts; the NATIONALASSOCIATION OF REALTORS®, which pre-sents data on existing home sales; theBureau of Economic Analysis, which pre-sents data on residential capital and grosshousing product; and the U.S. Energy

Information Administration, which pro-vides data on commercial buildingsthrough its periodic sample surveys.

Censuses and surveys—Censuses ofthe construction industry were first con-ducted by the Census Bureau for 1929,1935, and 1939; beginning in 1967, acensus has been taken every 5 years(through 2002, for years ending in ‘‘2’’and ‘‘7’’). The latest reports are part of the2002 Economic Census. See text, Section15, Business Enterprise.

The construction sector of the economiccensus, covers all employer establish-ments primarily engaged in (1) buildingconstruction by general contractors oroperative builders; (2) heavy (nonbuild-ing) construction by general contractors;and (3) construction by special trade con-tractors. This sector includes constructionmanagement and land subdividers anddevelopers. The 2002 census was con-ducted in accordance with the 2002 NorthAmerican Industrial Classification System(NAICS). See text, Section 15, BusinessEnterprise.

From 1850 through 1930, the CensusBureau collected some housing data aspart of its censuses of population andagriculture. Beginning in 1940, separatecensuses of housing have been taken at10-year intervals. For the 1970 and 1980censuses, data on year-round housingunits were collected and issued on occu-pancy and structural characteristics,plumbing facilities, value, and rent; for1990 such characteristics were presentedfor all housing units.

The American Housing Survey (CurrentHousing Reports Series H-150 and H-170),which began in 1973, provided an annualand ongoing series of data on selectedhousing and demographic characteristicsuntil 1983. In 1984, the name of the sur-vey was changed from the Annual Hous-ing Survey. Currently, national data arecollected every other year, and data for

Construction and Housing 585

U.S. Census Bureau, Statistical Abstract of the United States: 2009

selected metropolitan areas are collectedon a rotating basis. All samples representa cross section of the housing stock intheir respective areas. Estimates are sub-ject to both sampling and nonsamplingerrors; caution should therefore be usedin making comparisons between years.

Data on residential mortgages were col-lected continuously from 1890 to 1970,except 1930, as part of the decennial cen-sus by the Census Bureau. Since 1973,mortgage status data, limited to singlefamily homes on less than 10 acres withno business on the property, have beenpresented in the American Housing Sur-vey. Data on mortgage activity are cov-ered in Section 25, Banking and Finance.

Housing units—In general, a housingunit is a house, an apartment, a group ofrooms or a single room occupied orintended for occupancy as separate livingquarters; that is, the occupants live sepa-rately from any other individual in thebuilding, and there is direct access fromthe outside or through a common hall.Transient accommodations, barracks forworkers, and institutional-type quartersare not counted as housing units.

Statistical reliability—For a discussionof statistical collection and estimation,sampling procedures, and measures ofstatistical reliability applicable to CensusBureau data, see Appendix III.

586 Construction and Housing

U.S. Census Bureau, Statistical Abstract of the United States: 2009

Table 919. Construction—Establishments, Employees, and Payroll by Kind ofBusiness (NAICS Basis): 2004 and 2005

[6,648 represents 6,648,000. Covers establishments with payroll. Excludes most government employees, railroad employees, andself-employed persons. Kind-of-business classification based on North American Industry Classification System (NAICS) 2002. Forstatement on methodology, see Appendix III]

Industry2002

NAICScode 1

Establishments Paid employees 2

(1,000)Annual payroll

(mil. dol.)

2004 2005 2004 2005 2004 2005

Construction . . . . . . . . . . . . . . . . . . . . . 23 760,372 787,672 6,648 6,781 268,268 292,519

Construction of buildings . . . . . . . . . . . . . . . . . . . 236 233,617 243,567 1,579 1,613 68,877 76,180Residential building construction . . . . . . . . . . . . 2361 190,924 200,826 873 919 35,236 40,451

New single-family housing construction(except operative builders). . . . . . . . . . . . . . 236115 113,948 111,872 444 464 15,883 18,173

New multifamily housing construction(except operative builders). . . . . . . . . . . . . . 236116 4,955 4,621 47 46 2,116 2,230

New housing operative builders . . . . . . . . . . . 236117 10,774 13,213 158 166 9,944 11,756Residential remodelers . . . . . . . . . . . . . . . . . 236118 61,247 71,120 224 242 7,293 8,293

Nonresidential building construction . . . . . . . . . . 2362 42,693 42,741 706 694 33,641 35,728Industrial building construction . . . . . . . . . . . . 23621 1,884 2,085 73 76 3,192 3,457Commercial and institutional buildingconstruction . . . . . . . . . . . . . . . . . . . . . . . 23622 40,809 40,656 633 618 30,448 32,272

Heavy and civil engineering construction . . . . . . . . 237 50,146 50,827 908 908 43,423 47,153Utility system construction . . . . . . . . . . . . . . . . 2371 20,843 20,945 452 446 19,938 21,558

Water and sewer line and related structures . . . 23711 13,810 13,701 192 193 8,409 9,072Oil and gas pipeline and related structures. . . . 23712 1,702 1,717 84 86 3,741 4,171Power and communication line andrelated structures . . . . . . . . . . . . . . . . . . . . 23713 5,331 5,527 176 167 7,789 8,315

Land subdivision. . . . . . . . . . . . . . . . . . . . . . . 2372 11,915 12,448 64 69 3,203 3,792Highway, street, and bridge construction . . . . . . . 2373 12,030 11,940 313 311 16,496 17,517Other heavy and civil engineering construction . . . 2379 5,358 5,494 80 82 3,786 4,286

Specialty trade contractors . . . . . . . . . . . . . . . . . . 238 476,609 493,278 4,161 4,260 155,968 169,187Foundation, structure, and buildingexterior contractors . . . . . . . . . . . . . . . . . . . . 2381 113,498 115,719 1,044 1,065 35,089 38,122Poured concrete foundation and structures

contractors . . . . . . . . . . . . . . . . . . . . . . . 23811 26,534 26,646 277 283 9,933 10,850Structural steel and precast concretecontractors . . . . . . . . . . . . . . . . . . . . . . . . 23812 3,500 3,524 64 65 2,596 2,815

Framing contractors . . . . . . . . . . . . . . . . . . . 23813 18,127 18,732 162 169 4,804 5,305Masonry contractors. . . . . . . . . . . . . . . . . . . 23814 26,470 26,997 225 229 7,200 7,792Glass and glazing contractors . . . . . . . . . . . . 23815 5,292 5,328 48 48 1,779 1,905Roofing contractors . . . . . . . . . . . . . . . . . . . 23816 19,170 19,344 181 185 5,935 6,488Siding contractors . . . . . . . . . . . . . . . . . . . . 23817 10,091 10,425 51 49 1,531 1,596Other foundation, structure, and buildingexterior contractors . . . . . . . . . . . . . . . . . . 23819 4,314 4,723 36 37 1,311 1,370

Building equipment contractors . . . . . . . . . . . . . 2382 171,809 177,316 1,785 1,806 73,626 78,955Electrical contractors . . . . . . . . . . . . . . . . . . 23821 72,817 75,325 744 760 30,917 33,126Plumbing, heating, and air-conditioningcontractors . . . . . . . . . . . . . . . . . . . . . . . . 23822 92,898 95,478 933 936 37,416 40,073

Other building equipment contractors . . . . . . . 23829 6,094 6,513 108 110 5,293 5,756

Building finishing contractors . . . . . . . . . . . . . . . 2383 123,276 129,107 863 894 28,764 31,247Drywall and insulation contractors. . . . . . . . . . 23831 20,406 21,368 294 304 10,333 11,040Painting and wall covering contractors . . . . . . . 23832 39,495 41,172 217 225 6,512 7,144Flooring contractors . . . . . . . . . . . . . . . . . . . 23833 15,707 16,354 82 85 2,907 3,136Tile and terrazzo contractors . . . . . . . . . . . . . 23834 10,226 10,971 63 66 2,076 2,275Finish carpentry contractors. . . . . . . . . . . . . . 23835 31,501 32,921 150 156 4,871 5,403Other building finishing contractors . . . . . . . . . 23839 5,941 6,321 58 59 2,065 2,249

Other specialty trade contractors . . . . . . . . . . . . 2389 68,026 71,136 469 495 18,488 20,863Site preparation contractors. . . . . . . . . . . . . . 23891 35,622 37,749 269 289 11,017 12,590All other specialty trade contractors. . . . . . . . . 23899 32,404 33,387 200 206 7,471 8,273

1 North American Industry Classification System code, 2002; see text, Section 15. 2 Employees on the payroll for the payperiod including March 12.

Source: U.S. Census Bureau, ‘‘County Business Patterns’’; annual. See <http://www.census.gov/epcd/cbp/view/cbpview.html>.

Construction and Housing 587

U.S. Census Bureau, Statistical Abstract of the United States: 2009

Table 920. Construction Materials—Producer Price Indexes: 1990 to 2007

[1982 = 100, except as noted. Data for 2007 are preliminary. For discussion of producer price indexes, see text, Section 14. Thisindex, more formally known as the special commodity grouping index for construction materials, covers materials incorporated asintegral part of a building or normally installed during construction and not readily removable. Excludes consumer durables suchas kitchen ranges, refrigerators, etc. This index is not the same as the stage-of-processing index of intermediate materials and com-ponents for construction]

Commodity 1990 1995 2000 2002 2003 2004 2005 2006 2007

Construction materials . . . . . . . . . . . . . . . . 119.6 138.8 144.1 144.0 147.1 161.5 169.6 180.2 183.1

Interior solvent-based paint . . . . . . . . . . . . . . . . . 133.0 164.5 191.1 190.5 198.0 (NA) (NA) (NA) (NA)Architectural coatings . . . . . . . . . . . . . . . . . . . . . 132.7 152.3 168.7 175.2 180.6 187.4 203.3 220.2 230.5Construction products from plastics . . . . . . . . . . . . 117.2 133.8 135.8 136.1 138.6 144.6 158.8 181.8 179.1Douglas fir, dressed . . . . . . . . . . . . . . . . . . . . . . 138.4 198.8 185.2 178.5 176.7 (NA) (NA) (NA) (NA)Southern pine, dressed . . . . . . . . . . . . . . . . . . . . 111.2 166.9 161.0 145.2 145.4 (NA) (NA) (NA) (NA)Softwood lumber . . . . . . . . . . . . . . . . . . . . . . . . 123.8 178.5 178.6 170.8 170.8 209.8 203.6 189.4 170.7Millwork . . . . . . . . . . . . . . . . . . . . . . . . . . . . . . 130.4 163.8 176.4 179.8 181.8 191.9 197.2 201.8 201.3Softwood plywood . . . . . . . . . . . . . . . . . . . . . . . 119.6 188.1 173.3 164.1 195.9 250.9 223.5 190.5 197.7Hardwood plywood and related products . . . . . . . . 102.7 122.2 130.2 131.5 129.0 134.4 138.1 (NA) (NA)Hardwood veneer and plywood 1. . . . . . . . . . . . . . (NA) (NA) (NA) (NA) (NA) (NA) (NA) 101.4 102.4Softwood plywood veneer,excluding reinforced/backed . . . . . . . . . . . . . . . . 142.3 203.5 182.2 172.8 184.1 209.5 206.2 (NA) (NA)

Building paper and building board mill products . . . . 112.2 144.9 138.8 129.3 159.9 192.4 184.9 173.0 155.0Steel pipe and tubes 2. . . . . . . . . . . . . . . . . . . . . 102.6 104.4 106.6 106.7 113.3 166.3 193.3 200.9 201.9Builders’ hardware . . . . . . . . . . . . . . . . . . . . . . . 133.0 153.2 163.8 169.3 170.3 172.9 179.2 187.8 197.8Plumbing fixtures and brass fittings . . . . . . . . . . . . 144.3 166.0 180.4 181.9 183.4 188.3 197.6 207.2 220.8Heating equipment . . . . . . . . . . . . . . . . . . . . . . . 131.6 147.5 155.6 157.9 163.2 169.5 179.9 185.7 195.3Metal doors, sash, and trim . . . . . . . . . . . . . . . . . 131.4 156.5 165.1 168.0 169.9 175.8 184.9 192.9 197.3Siding, aluminum 3 . . . . . . . . . . . . . . . . . . . . . . . (NA) 132.4 142.2 141.0 152.6 (NA) (NA) (NA) (NA)Sheet metal products . . . . . . . . . . . . . . . . . . . . . 129.2 138.9 144.0 145.2 146.6 162.6 169.4 176.1 181.1Outdoor lighting equipment, including parts 4. . . . . . 113.0 120.8 124.7 126.2 126.9 129.4 131.8 137.7 139.8Commercial fluorescent fixtures 5 . . . . . . . . . . . . . 113.0 121.0 117.7 114.0 115.2 113.6 (NA) (NA) (NA)Commercial and industrial lighting fixtures. . . . . . . . 127.5 138.9 140.3 139.5 141.9 142.3 147.0 151.9 158.3Architectural and ornamental metalwork 6 . . . . . . . . 118.7 128.0 139.8 144.2 147.2 172.5 185.4 191.5 200.5Fabricated ferrous wire products 2 . . . . . . . . . . . . . 114.6 125.7 130.0 129.7 131.3 149.3 157.1 162.6 166.5Elevators, escalators, and other lifts. . . . . . . . . . . . 110.1 113.0 118.7 120.0 118.7 120.5 123.5 126.0 129.4Stamped metal switch and receptacle box . . . . . . . 158.0 183.5 183.0 195.4 196.1 205.2 (NA) (NA) (NA)Electrical conduit and conduit fittings 7 . . . . . . . . . . (NA) (NA) (NA) (NA) (NA) (NA) 106.6 116.6 111.9Other noncurrent-carrying wiring devices 7 . . . . . . . (NA) (NA) (NA) (NA) (NA) (NA) 102.3 108.0 114.1Concrete ingredients and related products . . . . . . . 115.3 134.7 155.6 162.6 164.8 170.4 185.3 204.9 219.8Concrete products . . . . . . . . . . . . . . . . . . . . . . . 113.5 129.4 147.8 152.7 153.6 161.2 177.2 195.1 203.3Clay construction products excluding refractories . . . 129.9 141.3 152.8 152.8 154.2 156.6 165.4 176.8 178.7Prep asphalt and tar roofing and siding products . . . 95.8 97.8 100.0 106.6 110.6 111.3 125.0 137.0 138.7Gypsum products . . . . . . . . . . . . . . . . . . . . . . . . 105.2 154.5 201.4 168.9 171.5 198.8 229.6 274.9 233.7Insulation materials. . . . . . . . . . . . . . . . . . . . . . . 108.4 118.8 128.6 128.3 128.8 137.2 142.2 149.9 145.4Paving mixtures and blocks . . . . . . . . . . . . . . . . . 101.2 105.8 130.4 136.2 142.6 144.9 156.9 200.5 218.9

NA Not available. 1 December 2005 = 100. 2 June 1982 = 100. 3 December 1982 = 100. 4 June 1985 = 100.5 Recessed nonair. 6 December 1983 = 100. 7 December 2004 = 100

Source: U.S. Bureau of Labor Statistics, Producer Price Indexes, monthly and annual. See <http://www.bls.gov/ppi/home.htm>.

Table 921. Value of New Construction Put in Place: 1980 to 2007

[In millions of dollars (273,936 represents $273,936,000,000). Represents value of construction put in place during year; differsfrom building permit and construction contract data in timing and coverage. Includes installed cost of normal building serviceequipment and selected types of industrial production equipment (largely site fabricated). Excludes cost of shipbuilding, land, andmost types of machinery and equipment. For methodology, see Appendix III. For details, see Tables 922 and 923]

YearTotal

Private Public

TotalResidential

buildingsNon-

residential Total FederalState

and local

1980 . . . . . . . . . 273,936 210,290 100,381 109,909 63,646 9,642 54,0041985 . . . . . . . . . 403,416 325,601 160,520 165,081 77,815 12,004 65,8111990 . . . . . . . . . 476,778 369,300 191,103 178,197 107,478 12,099 95,3791991 . . . . . . . . . 432,592 322,483 166,251 156,232 110,109 12,845 97,2641992 . . . . . . . . . 463,661 347,814 199,393 148,421 115,847 14,376 101,4711993 . . . . . . . . . 502,435 375,073 225,067 150,006 127,362 14,424 112,9381994 . . . . . . . . . 549,420 418,999 258,561 160,438 130,421 14,440 115,981

1995 . . . . . . . . . 567,896 427,885 247,351 180,534 140,011 15,751 124,2601996 . . . . . . . . . 623,313 476,638 281,115 195,523 146,675 15,325 131,3501997 . . . . . . . . . 656,171 502,734 289,014 213,720 153,437 14,087 139,3501998 . . . . . . . . . 706,779 552,001 314,607 237,394 154,778 14,318 140,4601999 . . . . . . . . . 768,811 599,729 350,562 249,167 169,082 14,025 155,057

2000 . . . . . . . . . 831,075 649,750 374,457 275,293 181,325 14,166 167,1572001 . . . . . . . . . 864,159 662,247 388,324 273,922 201,912 15,081 186,8302002 . . . . . . . . . 873,090 659,651 421,912 237,739 213,438 16,578 196,8602003 . . . . . . . . . 921,403 705,276 475,941 229,335 216,127 17,913 198,2142004 . . . . . . . . . 1,023,487 803,305 564,827 238,478 220,183 18,342 201,8412005 . . . . . . . . . 1,132,149 897,989 641,345 256,644 234,160 17,300 216,8602006 . . . . . . . . . 1,192,238 937,047 641,332 295,715 255,191 17,603 237,5882007 . . . . . . . . . 1,161,742 875,010 525,443 349,566 286,733 19,336 267,397

Source: U.S. Census Bureau, ‘‘Construction Spending’’; <http://www.census.gov/const/www/c30index.html>.

588 Construction and Housing

U.S. Census Bureau, Statistical Abstract of the United States: 2009

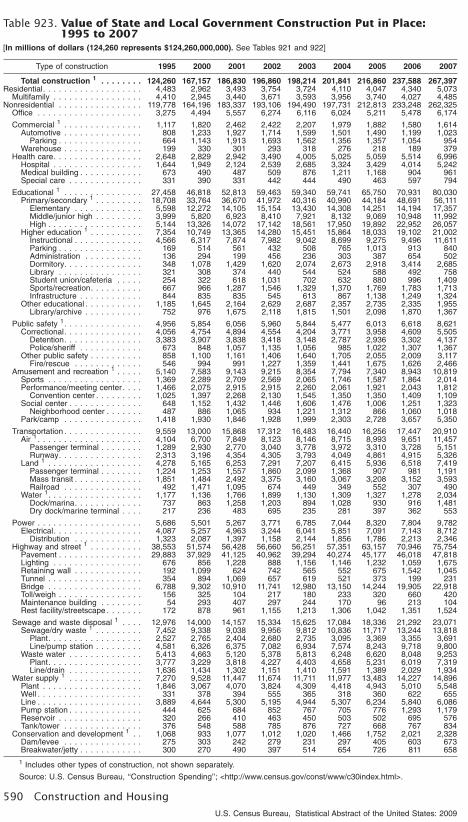
Table 922. Value of Private Construction Put in Place: 1995 to 2007

[In millions of dollars (427,885 represents $427,885,000,000). Represents value of construction put in place during year; differsfrom building permit and construction contract data in timing and coverage. See Appendix III and Tables 921 and 923]

Type of construction 1995 2000 2001 2002 2003 2004 2005 2006 2007

Total construction 1 . . . . . 427,885 649,750 662,247 659,651 705,276 803,305 897,989 937,047 875,010Residential . . . . . . . . . . . . . . . . . . 247,351 374,457 388,324 421,912 475,941 564,827 641,345 641,332 525,443

New single family . . . . . . . . . . . . 153,515 236,788 249,086 265,889 310,575 377,557 433,510 415,997 303,447New multifamily . . . . . . . . . . . . . 17,889 28,259 30,305 32,952 35,116 39,944 47,297 53,020 49,149Improvements . . . . . . . . . . . . . . 75,947 109,410 108,933 123,071 130,250 147,326 160,538 172,315 172,848

Nonresidential . . . . . . . . . . . . . . . . 180,534 275,293 273,922 237,739 229,335 238,478 256,644 295,715 349,566Lodging. . . . . . . . . . . . . . . . . . . 7,131 16,304 14,519 10,467 9,930 11,982 12,666 17,687 28,604Office 1 . . . . . . . . . . . . . . . . . . . 22,996 52,407 49,745 35,296 30,579 32,879 37,276 46,194 55,195

General . . . . . . . . . . . . . . . . . 20,569 49,637 47,136 32,356 27,380 28,679 32,962 41,390 49,785Financial . . . . . . . . . . . . . . . . 2,339 2,689 2,586 2,857 3,174 4,186 4,285 4,742 5,281

Commercial 1 . . . . . . . . . . . . . . . 44,096 64,055 63,606 59,008 57,505 63,195 66,584 72,148 81,745Automotive 1. . . . . . . . . . . . . . 4,191 5,967 5,650 5,807 5,039 5,235 5,614 5,463 6,353

Sales . . . . . . . . . . . . . . . . . 883 1,629 2,014 2,235 2,099 2,443 2,834 2,306 2,564Service/parts . . . . . . . . . . . . 2,448 3,009 2,394 2,308 1,866 1,978 1,805 2,089 2,394Parking . . . . . . . . . . . . . . . 860 1,330 1,242 1,265 1,074 814 975 1,068 1,395

Food/beverage 1 . . . . . . . . . . . 7,169 8,786 8,765 7,914 8,369 8,232 7,795 7,417 7,761Food . . . . . . . . . . . . . . . . . 3,062 4,792 4,300 4,207 4,234 3,590 3,128 2,773 2,849Dining/drinking. . . . . . . . . . . 3,408 2,935 3,441 2,916 3,321 3,937 4,078 3,735 3,799Fast food . . . . . . . . . . . . . . 699 1,058 1,024 792 813 705 590 908 1,113

Multiretail 1 . . . . . . . . . . . . . . . 11,976 14,911 16,373 15,581 15,400 18,828 22,750 29,126 33,207General merchandise . . . . . . 5,339 5,100 5,066 6,009 5,341 6,416 6,740 5,849 7,471Shopping center. . . . . . . . . . 4,086 6,803 7,769 6,605 6,867 9,256 12,462 18,446 20,649Shopping mall . . . . . . . . . . . 2,175 2,523 2,701 2,108 2,231 2,138 2,631 3,320 4,064

Other commercial 1 . . . . . . . . . 8,432 13,537 11,945 12,083 11,249 13,341 11,744 10,574 12,823Drug store . . . . . . . . . . . . . 536 1,682 1,185 1,644 1,790 1,427 1,315 1,301 1,479Building supply store. . . . . . . 1,372 2,592 3,016 2,471 2,268 2,521 2,416 2,628 3,618Other stores . . . . . . . . . . . . 5,653 8,136 6,995 7,145 6,214 8,229 7,075 5,707 6,914

Warehouse. . . . . . . . . . . . . . . 9,299 14,822 15,691 11,908 12,345 12,074 12,827 14,292 15,790General commercial . . . . . . . 8,944 13,511 14,440 10,934 11,004 10,830 11,468 13,298 14,552

Farm . . . . . . . . . . . . . . . . . . . 3,014 5,988 5,135 5,611 5,103 5,485 5,854 5,277 5,812

Health care . . . . . . . . . . . . . . . . 15,259 19,455 19,506 22,438 24,217 26,272 28,495 33,183 36,780Hospital . . . . . . . . . . . . . . . . . 8,807 10,183 11,313 13,925 15,234 16,147 18,250 22,860 25,915Medical building . . . . . . . . . . . 4,064 5,066 4,638 4,924 6,068 7,615 8,031 7,292 7,631Special care . . . . . . . . . . . . . . 2,388 4,206 3,555 3,538 2,915 2,510 2,213 3,032 3,234

Educational 1 . . . . . . . . . . . . . . . 5,699 11,683 12,846 13,109 13,424 12,701 12,788 13,745 16,572Preschool. . . . . . . . . . . . . . . . 326 770 874 593 711 674 516 489 703Primary/secondary . . . . . . . . . . 1,245 2,948 3,536 3,605 3,204 3,202 2,718 3,205 3,845Higher education 1 . . . . . . . . . . 3,055 6,333 6,597 6,875 7,259 6,496 6,946 7,561 9,420

Instructional . . . . . . . . . . . . 1,712 3,058 3,210 3,619 3,701 3,200 3,556 3,454 4,052Dormitory . . . . . . . . . . . . . . 483 1,356 1,555 1,528 1,761 1,669 1,537 2,085 2,947Sports/recreation . . . . . . . . . 192 645 755 772 677 739 821 854 870

Other educational . . . . . . . . . . 817 1,318 1,421 1,651 1,785 1,998 2,294 2,067 2,235Gallery/museum. . . . . . . . . . 571 920 990 1,312 1,371 1,335 1,745 1,675 1,993

Religious . . . . . . . . . . . . . . . . . . 4,348 8,030 8,393 8,335 8,559 8,153 7,715 7,690 7,464House of worship . . . . . . . . . . 2,951 5,656 6,040 6,021 6,238 6,015 5,992 6,231 6,309Other religious . . . . . . . . . . . . 1,389 2,347 2,330 2,312 2,322 2,138 1,723 1,459 1,155

Auxiliary building . . . . . . . . . 619 1,280 1,247 1,358 1,296 1,258 1,251 1,190 1,014Public safety . . . . . . . . . . . . . . . 185 423 274 217 185 289 408 448 500Amusement and recreation 1. . . . . 5,886 8,768 7,828 7,478 7,781 8,432 7,507 9,041 9,350

Theme/amusement park . . . . . . 563 747 462 230 270 198 200 386 486Sports . . . . . . . . . . . . . . . . . . 910 1,068 1,067 1,427 1,306 900 807 839 1,682Fitness . . . . . . . . . . . . . . . . . 637 1,152 1,294 1,286 1,262 1,141 1,425 1,999 1,770Performance/meeting center . . . 365 732 977 900 844 1,054 1,072 783 834Social center . . . . . . . . . . . . . 1,558 2,368 2,337 2,285 1,996 2,594 1,626 1,478 1,482Movie theater/studio. . . . . . . . . 848 1,461 792 568 855 1,218 1,248 1,214 1,085

Transportation 1 . . . . . . . . . . . . . 4,759 6,879 7,058 6,773 6,568 6,841 7,124 7,937 8,775Air . . . . . . . . . . . . . . . . . . . . 666 1,804 1,993 1,281 1,012 869 748 715 613Land . . . . . . . . . . . . . . . . . . . 4,008 4,907 4,883 5,325 5,462 5,800 6,214 7,049 7,818

Railroad . . . . . . . . . . . . . . . 3,509 4,263 4,456 4,584 4,851 5,392 5,816 6,589 7,212Communication. . . . . . . . . . . . . . 11,112 18,799 19,596 18,384 14,456 15,468 18,846 21,621 26,194Power 1. . . . . . . . . . . . . . . . . . . 22,006 29,344 31,499 32,608 33,619 27,360 26,304 30,481 39,465

Electricity . . . . . . . . . . . . . . . . 14,274 23,374 25,270 24,998 25,592 20,431 19,192 21,660 27,843Gas . . . . . . . . . . . . . . . . . . . 6,279 4,891 5,078 6,080 6,358 5,096 5,239 5,741 7,409Oil . . . . . . . . . . . . . . . . . . . . 929 1,003 943 1,193 1,068 1,579 1,293 1,876 2,617

Sewage and waste disposal . . . . . 576 508 402 246 278 331 240 284 328Water supply . . . . . . . . . . . . . . . 670 714 563 397 393 405 326 445 431Manufacturing 1 . . . . . . . . . . . . . 35,364 37,583 37,815 22,744 21,434 23,667 29,886 34,278 37,599

Food/beverage/tobacco . . . . . . 4,525 3,985 4,088 2,817 2,695 3,157 4,677 4,892 3,985Textile/apparel/leather & allied . . 824 413 307 284 218 188 415 146 26Wood . . . . . . . . . . . . . . . . . . 616 483 343 477 376 485 982 1,505 680Paper . . . . . . . . . . . . . . . . . . 1,448 479 1,265 584 818 548 467 562 489Print/publishing . . . . . . . . . . . . 1,197 848 1,232 666 630 654 777 748 240Petroleum/coal . . . . . . . . . . . . 4,741 1,255 1,171 887 717 1,204 771 1,666 2,490Chemical . . . . . . . . . . . . . . . . 5,531 3,798 4,896 5,625 5,368 5,507 6,588 9,239 12,981Plastic/rubber . . . . . . . . . . . . . 1,475 1,645 1,379 776 659 936 877 839 804Nonmetallic mineral . . . . . . . . . 856 1,898 2,216 536 865 896 1,163 1,961 3,806Primary metal . . . . . . . . . . . . . 2,533 1,976 773 241 436 312 836 1,489 1,378Fabricated metal . . . . . . . . . . . 808 2,148 1,447 833 662 595 699 568 509Machinery . . . . . . . . . . . . . . . 1,275 864 863 797 707 645 917 924 558Computer/electronic/electrical. . . 6,332 6,392 6,029 1,918 1,444 2,835 4,247 4,324 2,726Transportation equipment . . . . . 2,382 6,318 6,901 3,832 3,314 2,610 3,702 2,557 3,458Furniture . . . . . . . . . . . . . . . . 213 148 232 148 278 217 96 131 173

1 Includes other types of construction not shown separately.

Source: U.S. Census Bureau, ‘‘Construction Spending’’; <http://www.census.gov/const/www/c30index.html>.

Construction and Housing 589

U.S. Census Bureau, Statistical Abstract of the United States: 2009

Table 923. Value of State and Local Government Construction Put in Place:1995 to 2007

[In millions of dollars (124,260 represents $124,260,000,000). See Tables 921 and 922]

Type of construction 1995 2000 2001 2002 2003 2004 2005 2006 2007

Total construction 1 . . . . . . . . 124,260 167,157 186,830 196,860 198,214 201,841 216,860 237,588 267,397Residential. . . . . . . . . . . . . . . . . . . 4,483 2,962 3,493 3,754 3,724 4,110 4,047 4,340 5,073

Multifamily . . . . . . . . . . . . . . . . . 4,410 2,945 3,440 3,671 3,593 3,956 3,740 4,027 4,485Nonresidential . . . . . . . . . . . . . . . . 119,778 164,196 183,337 193,106 194,490 197,731 212,813 233,248 262,325

Office . . . . . . . . . . . . . . . . . . . . 3,275 4,494 5,557 6,274 6,116 6,024 5,211 5,478 6,174

Commercial 1 . . . . . . . . . . . . . . . 1,117 1,820 2,462 2,422 2,207 1,979 1,882 1,580 1,614Automotive . . . . . . . . . . . . . . . 808 1,233 1,927 1,714 1,599 1,501 1,490 1,199 1,023

Parking . . . . . . . . . . . . . . . . 664 1,143 1,913 1,693 1,562 1,356 1,357 1,054 954Warehouse . . . . . . . . . . . . . . . 199 330 301 293 318 276 218 189 379

Health care. . . . . . . . . . . . . . . . . 2,648 2,829 2,942 3,490 4,005 5,025 5,059 5,514 6,996Hospital . . . . . . . . . . . . . . . . . 1,644 1,949 2,124 2,539 2,685 3,324 3,429 4,014 5,242Medical building . . . . . . . . . . . . 673 490 487 509 876 1,211 1,168 904 961Special care . . . . . . . . . . . . . . 331 390 331 442 444 490 463 597 794

Educational 1 . . . . . . . . . . . . . . . 27,458 46,818 52,813 59,463 59,340 59,741 65,750 70,931 80,030Primary/secondary 1 . . . . . . . . . 18,708 33,764 36,670 41,972 40,316 40,990 44,184 48,691 56,111

Elementary . . . . . . . . . . . . . 5,598 12,272 14,105 15,154 13,430 14,308 14,251 14,194 17,357Middle/junior high . . . . . . . . . 3,999 5,820 6,923 8,410 7,921 8,132 9,069 10,948 11,992High . . . . . . . . . . . . . . . . . . 5,144 13,326 14,072 17,142 18,561 17,950 19,892 22,952 26,057

Higher education 1 . . . . . . . . . . 7,354 10,749 13,365 14,280 15,451 15,864 18,033 19,102 21,002Instructional . . . . . . . . . . . . . 4,566 6,317 7,874 7,982 9,042 8,699 9,275 9,496 11,611Parking . . . . . . . . . . . . . . . . 169 514 561 432 508 765 1,013 913 840Administration . . . . . . . . . . . 136 294 199 456 236 303 387 654 502Dormitory. . . . . . . . . . . . . . . 348 1,078 1,429 1,620 2,074 2,673 2,918 3,414 2,685Library . . . . . . . . . . . . . . . . 321 308 374 440 544 524 588 492 758Student union/cafeteria . . . . . 254 322 618 1,031 702 632 880 996 1,409Sports/recreation. . . . . . . . . . 667 966 1,287 1,546 1,329 1,370 1,769 1,783 1,713Infrastructure . . . . . . . . . . . . 844 835 835 545 613 867 1,138 1,249 1,324

Other educational . . . . . . . . . . . 1,185 1,645 2,164 2,629 2,687 2,357 2,735 2,335 1,955Library/archive . . . . . . . . . . . 752 976 1,675 2,118 1,815 1,501 2,098 1,870 1,367

Public safety 1. . . . . . . . . . . . . . . 4,956 5,854 6,056 5,960 5,844 5,477 6,013 6,618 8,621Correctional. . . . . . . . . . . . . . . 4,056 4,754 4,894 4,554 4,204 3,771 3,958 4,609 5,505

Detention. . . . . . . . . . . . . . . 3,383 3,907 3,838 3,418 3,148 2,787 2,936 3,302 4,137Police/sheriff . . . . . . . . . . . . 673 848 1,057 1,135 1,056 985 1,022 1,307 1,367

Other public safety . . . . . . . . . . 858 1,100 1,161 1,406 1,640 1,705 2,055 2,009 3,117Fire/rescue . . . . . . . . . . . . . 546 994 991 1,227 1,359 1,441 1,675 1,626 2,466

Amusement and recreation 1 . . . . . 5,140 7,583 9,143 9,215 8,354 7,794 7,340 8,943 10,819Sports . . . . . . . . . . . . . . . . . . 1,369 2,289 2,709 2,569 2,065 1,746 1,587 1,864 2,014Performance/meeting center . . . . 1,466 2,075 2,915 2,915 2,260 2,061 1,921 2,043 1,812

Convention center . . . . . . . . . 1,025 1,397 2,268 2,130 1,545 1,350 1,350 1,409 1,109Social center . . . . . . . . . . . . . . 648 1,152 1,432 1,446 1,606 1,476 1,006 1,251 1,323

Neighborhood center . . . . . . . 487 886 1,065 934 1,221 1,312 866 1,060 1,018Park/camp . . . . . . . . . . . . . . . 1,418 1,930 1,846 1,928 1,999 2,303 2,728 3,657 5,350

Transportation . . . . . . . . . . . . . . . 9,559 13,000 15,868 17,312 16,483 16,440 16,256 17,447 20,910Air 1 . . . . . . . . . . . . . . . . . . . . 4,104 6,700 7,849 8,123 8,146 8,715 8,993 9,651 11,457

Passenger terminal . . . . . . . . 1,289 2,930 2,770 3,040 3,778 3,972 3,310 3,728 5,151Runway. . . . . . . . . . . . . . . . 2,313 3,196 4,354 4,305 3,793 4,049 4,861 4,915 5,326

Land 1 . . . . . . . . . . . . . . . . . . 4,278 5,165 6,253 7,291 7,207 6,415 5,936 6,518 7,419Passenger terminal . . . . . . . . 1,224 1,253 1,557 1,860 2,099 1,368 907 981 1,191Mass transit . . . . . . . . . . . . . 1,851 1,484 2,492 3,375 3,160 3,067 3,208 3,152 3,593Railroad . . . . . . . . . . . . . . . 492 1,471 1,095 674 449 349 552 307 490

Water 1. . . . . . . . . . . . . . . . . . 1,177 1,136 1,766 1,899 1,130 1,309 1,327 1,278 2,034Dock/marina. . . . . . . . . . . . . 737 863 1,258 1,203 894 1,028 930 916 1,481Dry dock/marine terminal . . . . 217 236 483 695 235 281 397 362 553

Power . . . . . . . . . . . . . . . . . . . . 5,686 5,501 5,267 3,771 6,785 7,044 8,320 7,804 9,782Electrical. . . . . . . . . . . . . . . . . 4,087 5,257 4,963 3,244 6,041 5,851 7,091 7,143 8,712

Distribution . . . . . . . . . . . . . 1,323 2,087 1,397 1,158 2,144 1,856 1,786 2,213 2,346Highway and street 1 . . . . . . . . . . 38,553 51,574 56,428 56,660 56,251 57,351 63,157 70,946 75,754

Pavement . . . . . . . . . . . . . . . . 29,883 37,929 41,125 40,962 39,294 40,274 45,177 46,018 47,818Lighting . . . . . . . . . . . . . . . . . 676 856 1,228 888 1,156 1,146 1,232 1,059 1,675Retaining wall . . . . . . . . . . . . . 192 1,099 624 742 565 552 675 1,542 1,045Tunnel . . . . . . . . . . . . . . . . . . 354 894 1,069 657 619 521 373 199 231Bridge . . . . . . . . . . . . . . . . . . 6,788 9,302 10,910 11,741 12,980 13,150 14,244 19,905 22,918Toll/weigh . . . . . . . . . . . . . . . . 156 325 104 217 180 233 320 660 420Maintenance building . . . . . . . . 54 293 407 297 244 170 96 213 104Rest facility/streetscape . . . . . . . 172 878 961 1,155 1,213 1,306 1,042 1,351 1,524

Sewage and waste disposal 1 . . . . 12,976 14,000 14,157 15,334 15,625 17,084 18,336 21,292 23,071Sewage/dry waste 1 . . . . . . . . . 7,452 9,338 9,038 9,956 9,812 10,836 11,717 13,244 13,818

Plant. . . . . . . . . . . . . . . . . . 2,527 2,765 2,404 2,680 2,735 3,095 3,369 3,355 3,691Line/pump station . . . . . . . . . 4,581 6,326 6,375 7,082 6,934 7,574 8,243 9,718 9,800

Waste water . . . . . . . . . . . . . . 5,413 4,663 5,120 5,378 5,813 6,248 6,620 8,048 9,253Plant. . . . . . . . . . . . . . . . . . 3,777 3,229 3,818 4,227 4,403 4,658 5,231 6,019 7,319Line/drain . . . . . . . . . . . . . . 1,636 1,434 1,302 1,151 1,410 1,591 1,389 2,029 1,934

Water supply 1 . . . . . . . . . . . . . . 7,270 9,528 11,447 11,674 11,711 11,977 13,483 14,227 14,896Plant . . . . . . . . . . . . . . . . . . . 1,846 3,067 4,070 3,824 4,309 4,418 4,943 5,010 5,548Well . . . . . . . . . . . . . . . . . . . . 331 378 394 555 365 318 360 622 655Line . . . . . . . . . . . . . . . . . . . . 3,889 4,644 5,300 5,195 4,944 5,307 6,234 5,840 6,086Pump station . . . . . . . . . . . . . . 444 625 684 852 767 705 776 1,293 1,179Reservoir . . . . . . . . . . . . . . . . 320 266 410 463 450 503 502 695 576Tank/tower . . . . . . . . . . . . . . . 376 548 588 785 876 727 668 767 834

Conservation and development 1 . . 1,068 933 1,077 1,012 1,020 1,466 1,752 2,021 2,328Dam/levee . . . . . . . . . . . . . . . 275 303 242 279 231 297 405 603 673Breakwater/jetty . . . . . . . . . . . . 300 270 490 397 514 654 726 811 658

1 Includes other types of construction, not shown separately.

Source: U.S. Census Bureau, ‘‘Construction Spending’’; <http://www.census.gov/const/www/c30index.html>.

590 Construction and Housing

U.S. Census Bureau, Statistical Abstract of the United States: 2009

Table 924. Construction Contracts—Value of Construction and Floor Space ofBuildings by Class of Construction: 1980 to 2007

[The complete publication including this copyright table is available for sale from the U.S. Government Printing Office and the NationalTechnical Information Service]

Table 925. Construction Contracts—Value by State: 2005 to 2007

[The complete publication including this copyright table is available for sale from the U.S. Government Printing Office and the NationalTechnical Information Service]

Construction and Housing 591

U.S. Census Bureau, Statistical Abstract of the United States: 2009

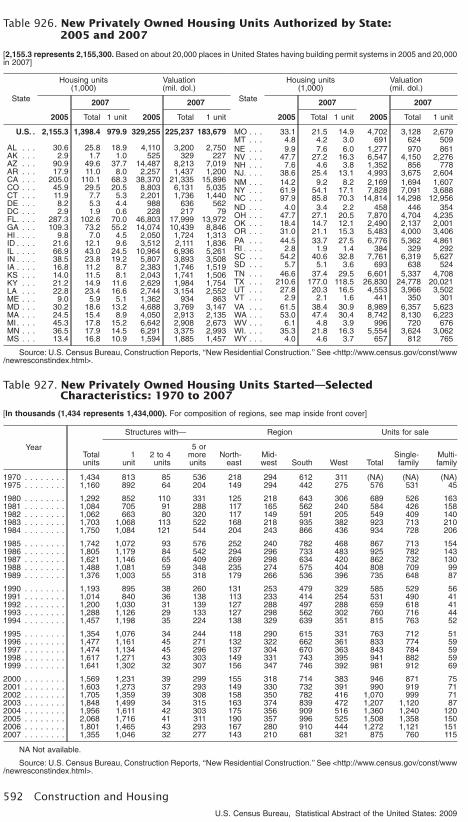
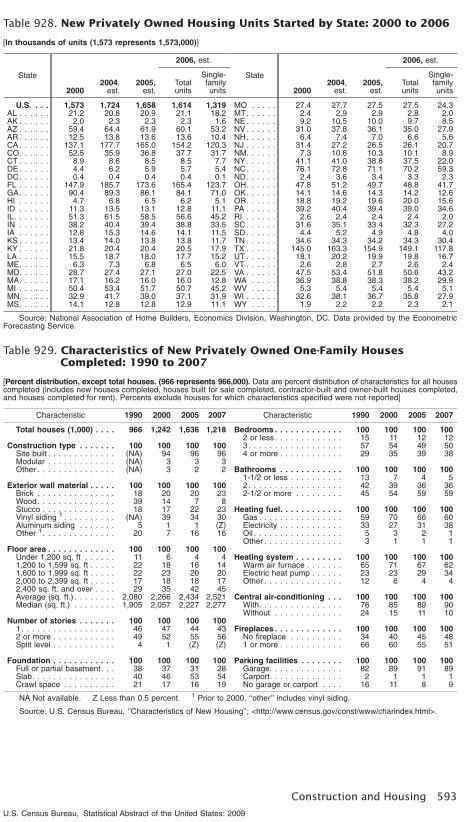
Table 926. New Privately Owned Housing Units Authorized by State:2005 and 2007

[2,155.3 represents 2,155,300. Based on about 20,000 places in United States having building permit systems in 2005 and 20,000in 2007]

State

Housing units(1,000)

Valuation(mil. dol.)

2005

2007

2005

2007

Total 1 unit Total 1 unit

U.S. . 2,155.3 1,398.4 979.9 329,255 225,237 183,679

AL . . . 30.6 25.8 18.9 4,110 3,200 2,750AK . . . 2.9 1.7 1.0 525 329 227AZ . . . 90.9 49.6 37.7 14,487 8,213 7,019AR . . . 17.9 11.0 8.0 2,257 1,437 1,200CA . . . 205.0 110.1 68.3 38,370 21,335 15,896CO . . . 45.9 29.5 20.5 8,803 6,131 5,035CT . . . 11.9 7.7 5.3 2,201 1,736 1,440DE . . . 8.2 5.3 4.4 988 636 562DC . . . 2.9 1.9 0.6 228 217 79FL. . . . 287.3 102.6 70.0 46,803 17,999 13,972GA . . . 109.3 73.2 55.2 14,074 10,439 8,846HI . . . . 9.8 7.0 4.5 2,050 1,724 1,313ID . . . . 21.6 12.1 9.6 3,512 2,111 1,836IL . . . . 66.9 43.0 24.5 10,964 6,936 5,261IN . . . . 38.5 23.8 19.2 5,807 3,893 3,508IA . . . . 16.8 11.2 8.7 2,383 1,746 1,519KS . . . 14.0 11.5 8.1 2,043 1,741 1,506KY . . . 21.2 14.9 11.6 2,629 1,984 1,754LA . . . 22.8 23.4 16.6 2,744 3,154 2,552ME . . . 9.0 5.9 5.1 1,362 934 863MD . . . 30.2 18.6 13.2 4,688 3,769 3,147MA . . . 24.5 15.4 8.9 4,050 2,913 2,135MI. . . . 45.3 17.8 15.2 6,642 2,908 2,673MN . . . 36.5 17.9 14.5 6,291 3,375 2,993MS . . . 13.4 16.8 10.9 1,594 1,885 1,457

State

Housing units(1,000)

Valuation(mil. dol.)

2005

2007

2005

2007

Total 1 unit Total 1 unit

MO . . . 33.1 21.5 14.9 4,702 3,128 2,679MT . . . 4.8 4.2 3.0 691 624 509NE . . . 9.9 7.6 6.0 1,277 970 861NV . . . 47.7 27.2 16.3 6,547 4,150 2,276NH . . . 7.6 4.6 3.8 1,352 856 778NJ. . . . 38.6 25.4 13.1 4,993 3,675 2,604NM . . . 14.2 9.2 8.2 2,169 1,694 1,607NY . . . 61.9 54.1 17.1 7,828 7,091 3,688NC . . . 97.9 85.8 70.3 14,814 14,298 12,956ND . . . 4.0 3.4 2.2 458 446 354OH . . . 47.7 27.1 20.5 7,870 4,704 4,235OK . . . 18.4 14.7 12.1 2,490 2,137 2,001OR . . . 31.0 21.1 15.3 5,483 4,000 3,406PA . . . 44.5 33.7 27.5 6,776 5,362 4,861RI . . . . 2.8 1.9 1.4 384 329 292SC . . . 54.2 40.6 32.8 7,761 6,319 5,627SD . . . 5.7 5.1 3.6 693 638 524TN . . . 46.6 37.4 29.5 6,601 5,337 4,708TX . . . 210.6 177.0 118.5 26,830 24,778 20,021UT . . . 27.8 20.3 16.5 4,553 3,966 3,502VT . . . 2.9 2.1 1.6 441 350 301VA . . . 61.5 38.4 30.9 8,989 6,357 5,623WA . . . 53.0 47.4 30.4 8,742 8,130 6,223WV . . . 6.1 4.8 3.9 996 720 676WI. . . . 35.3 21.8 16.3 5,554 3,624 3,062WY . . . 4.0 4.6 3.7 657 812 765

Source: U.S. Census Bureau, Construction Reports, ‘‘New Residential Construction.’’ See <http://www.census.gov/const/www/newresconstindex.html>.

Table 927. New Privately Owned Housing Units Started—SelectedCharacteristics: 1970 to 2007

[In thousands (1,434 represents 1,434,000). For composition of regions, see map inside front cover]

YearTotalunits

Structures with— Region Units for sale

1unit

2 to 4units

5 ormoreunits

North-east

Mid-west South West Total

Single-family

Multi-family

1970 . . . . . . . . 1,434 813 85 536 218 294 612 311 (NA) (NA) (NA)1975 . . . . . . . . 1,160 892 64 204 149 294 442 275 576 531 45

1980 . . . . . . . . 1,292 852 110 331 125 218 643 306 689 526 1631981 . . . . . . . . 1,084 705 91 288 117 165 562 240 584 426 1581982 . . . . . . . . 1,062 663 80 320 117 149 591 205 549 409 1401983 . . . . . . . . 1,703 1,068 113 522 168 218 935 382 923 713 2101984 . . . . . . . . 1,750 1,084 121 544 204 243 866 436 934 728 206

1985 . . . . . . . . 1,742 1,072 93 576 252 240 782 468 867 713 1541986 . . . . . . . . 1,805 1,179 84 542 294 296 733 483 925 782 1431987 . . . . . . . . 1,621 1,146 65 409 269 298 634 420 862 732 1301988 . . . . . . . . 1,488 1,081 59 348 235 274 575 404 808 709 991989 . . . . . . . . 1,376 1,003 55 318 179 266 536 396 735 648 87

1990 . . . . . . . . 1,193 895 38 260 131 253 479 329 585 529 561991 . . . . . . . . 1,014 840 36 138 113 233 414 254 531 490 411992 . . . . . . . . 1,200 1,030 31 139 127 288 497 288 659 618 411993 . . . . . . . . 1,288 1,126 29 133 127 298 562 302 760 716 441994 . . . . . . . . 1,457 1,198 35 224 138 329 639 351 815 763 52

1995 . . . . . . . . 1,354 1,076 34 244 118 290 615 331 763 712 511996 . . . . . . . . 1,477 1,161 45 271 132 322 662 361 833 774 591997 . . . . . . . . 1,474 1,134 45 296 137 304 670 363 843 784 591998 . . . . . . . . 1,617 1,271 43 303 149 331 743 395 941 882 591999 . . . . . . . . 1,641 1,302 32 307 156 347 746 392 981 912 69

2000 . . . . . . . . 1,569 1,231 39 299 155 318 714 383 946 871 752001 . . . . . . . . 1,603 1,273 37 293 149 330 732 391 990 919 712002 . . . . . . . . 1,705 1,359 39 308 158 350 782 416 1,070 999 712003 . . . . . . . . 1,848 1,499 34 315 163 374 839 472 1,207 1,120 872004 . . . . . . . . 1,956 1,611 42 303 175 356 909 516 1,360 1,240 1202005 . . . . . . . . 2,068 1,716 41 311 190 357 996 525 1,508 1,358 1502006 . . . . . . . . 1,801 1,465 43 293 167 280 910 444 1,272 1,121 1512007 . . . . . . . . 1,355 1,046 32 277 143 210 681 321 875 760 115

NA Not available.

Source: U.S. Census Bureau, Construction Reports, ‘‘New Residential Construction.’’ See <http://www.census.gov/const/www/newresconstindex.html>.

592 Construction and Housing

U.S. Census Bureau, Statistical Abstract of the United States: 2009

Table 928. New Privately Owned Housing Units Started by State: 2000 to 2006

[In thousands of units (1,573 represents 1,573,000)]

State

20002004,

est.2005,

est.

2006, est.

Totalunits

Single-familyunits

U.S. . . . 1,573 1,724 1,658 1,614 1,319AL . . . . . . 21.2 20.8 20.9 21.1 18.2AK . . . . . . 2.0 2.3 2.3 2.3 1.6AZ . . . . . . 59.4 64.4 61.9 60.1 53.2AR . . . . . . 12.5 13.8 13.6 13.6 10.4CA . . . . . . 137.1 177.7 165.0 154.2 120.3CO. . . . . . 52.5 35.9 36.8 37.7 31.7CT . . . . . . 8.9 8.6 8.5 8.5 7.7DE . . . . . . 4.4 6.2 5.9 5.7 5.4DC. . . . . . 0.4 0.4 0.4 0.4 0.1FL . . . . . . 147.9 185.7 173.6 165.4 123.7GA. . . . . . 90.4 89.3 86.1 84.1 71.0HI . . . . . . 4.7 6.8 6.5 6.2 5.1ID . . . . . . 11.3 13.5 13.1 12.8 11.1IL. . . . . . . 51.3 61.5 58.5 56.6 45.2IN . . . . . . 38.2 40.4 39.4 38.8 33.5IA . . . . . . 12.8 15.3 14.6 14.1 11.5KS . . . . . . 13.4 14.0 13.8 13.8 11.7KY . . . . . . 21.8 20.4 20.4 20.5 17.9LA . . . . . . 15.5 18.7 18.0 17.7 15.2ME. . . . . . 6.3 7.3 6.8 6.5 6.0MD. . . . . . 28.7 27.4 27.1 27.0 22.5MA. . . . . . 17.1 16.2 16.0 16.0 12.8MI . . . . . . 50.4 53.4 51.7 50.7 45.2MN. . . . . . 32.9 41.7 39.0 37.1 31.9MS. . . . . . 14.1 12.8 12.8 12.9 11.1

State

20002004,

est.2005,

est.

2006, est.

Totalunits

Single-familyunits

MO . . . . . 27.4 27.7 27.5 27.5 24.3MT. . . . . . 2.4 2.9 2.9 2.8 2.0NE . . . . . . 9.2 10.5 10.0 9.7 8.5NV . . . . . . 31.0 37.8 36.1 35.0 27.9NH. . . . . . 6.4 7.4 7.0 6.6 5.6NJ . . . . . . 31.4 27.2 26.5 26.1 20.7NM. . . . . . 7.3 10.6 10.3 10.1 8.9NY . . . . . . 41.1 41.0 38.8 37.5 22.0NC. . . . . . 76.1 72.8 71.1 70.2 59.3ND. . . . . . 2.4 3.6 3.4 3.3 2.3OH. . . . . . 47.8 51.2 49.7 48.8 41.7OK. . . . . . 14.1 14.6 14.3 14.2 12.6OR. . . . . . 18.8 19.2 19.6 20.0 15.6PA . . . . . . 39.2 40.4 39.4 39.0 34.6RI . . . . . . 2.6 2.4 2.4 2.4 2.0SC . . . . . . 31.6 35.1 33.4 32.3 27.2SD . . . . . . 4.4 5.2 4.9 4.8 4.0TN . . . . . . 34.6 34.3 34.2 34.3 30.4TX . . . . . . 145.0 163.3 154.9 149.1 117.8UT . . . . . . 18.1 20.2 19.9 19.8 16.7VT . . . . . . 2.6 2.8 2.7 2.6 2.4VA . . . . . . 47.5 53.4 51.8 50.6 43.2WA . . . . . 36.9 38.8 38.3 38.2 29.9WV . . . . . 5.3 5.4 5.4 5.4 5.1WI . . . . . . 32.6 38.1 36.7 35.8 27.9WY . . . . . 1.9 2.2 2.2 2.3 2.1

Source: National Association of Home Builders, Economics Division, Washington, DC. Data provided by the EconometricForecasting Service.

Table 929. Characteristics of New Privately Owned One-Family HousesCompleted: 1990 to 2007

[Percent distribution, except total houses. (966 represents 966,000). Data are percent distribution of characteristics for all housescompleted (includes new houses completed, houses built for sale completed, contractor-built and owner-built houses completed,and houses completed for rent). Percents exclude houses for which characteristics specified were not reported]

Characteristic 1990 2000 2005 2007

Total houses (1,000) . . . . 966 1,242 1,636 1,218

Construction type . . . . . . . 100 100 100 100Site built . . . . . . . . . . . . . (NA) 94 96 96Modular . . . . . . . . . . . . . (NA) 3 3 3Other . . . . . . . . . . . . . . . (NA) 3 2 2

Exterior wall material . . . . . 100 100 100 100Brick . . . . . . . . . . . . . . . 18 20 20 23Wood. . . . . . . . . . . . . . . 39 14 7 8Stucco . . . . . . . . . . . . . . 18 17 22 23Vinyl siding 1 . . . . . . . . . . (NA) 39 34 30Aluminum siding . . . . . . . 5 1 1 (Z)Other 1 . . . . . . . . . . . . . . 20 7 16 16

Floor area . . . . . . . . . . . . . 100 100 100 100Under 1,200 sq. ft . . . . . . 11 6 4 41,200 to 1,599 sq. ft . . . . . 22 18 16 141,600 to 1,999 sq. ft . . . . . 22 23 20 202,000 to 2,399 sq. ft . . . . . 17 18 18 172,400 sq. ft. and over . . . . 29 35 42 45Average (sq. ft.) . . . . . . . . 2,080 2,266 2,434 2,521Median (sq. ft.) . . . . . . . . 1,905 2,057 2,227 2,277

Number of stories . . . . . . . 100 100 100 1001 . . . . . . . . . . . . . . . . . . 46 47 44 432 or more . . . . . . . . . . . . 49 52 55 56Split level . . . . . . . . . . . . 4 1 (Z) (Z)

Foundation . . . . . . . . . . . . 100 100 100 100Full or partial basement. . . 38 37 31 28Slab. . . . . . . . . . . . . . . . 40 46 53 54Crawl space . . . . . . . . . . 21 17 16 19

Characteristic 1990 2000 2005 2007

Bedrooms . . . . . . . . . . . . . 100 100 100 1002 or less . . . . . . . . . . . . . 15 11 12 123 . . . . . . . . . . . . . . . . . . 57 54 49 504 or more . . . . . . . . . . . . 29 35 39 38

Bathrooms . . . . . . . . . . . . 100 100 100 1001-1/2 or less . . . . . . . . . . 13 7 4 52 . . . . . . . . . . . . . . . . . . 42 39 36 362-1/2 or more . . . . . . . . . 45 54 59 59

Heating fuel. . . . . . . . . . . . 100 100 100 100Gas . . . . . . . . . . . . . . . . 59 70 66 60Electricity . . . . . . . . . . . . 33 27 31 38Oil . . . . . . . . . . . . . . . . . 5 3 2 1Other . . . . . . . . . . . . . . . 3 1 1 1

Heating system . . . . . . . . . 100 100 100 100Warm air furnace . . . . . . . 65 71 67 62Electric heat pump . . . . . . 23 23 29 34Other . . . . . . . . . . . . . . . 12 6 4 4

Central air-conditioning . . . 100 100 100 100With. . . . . . . . . . . . . . . . 76 85 89 90Without . . . . . . . . . . . . . 24 15 11 10

Fireplaces . . . . . . . . . . . . . 100 100 100 100No fireplace . . . . . . . . . . 34 40 45 481 or more . . . . . . . . . . . . 66 60 55 51

Parking facilities . . . . . . . . 100 100 100 100Garage. . . . . . . . . . . . . . 82 89 91 89Carport. . . . . . . . . . . . . . 2 1 1 1No garage or carport . . . . 16 11 8 9

NA Not available. Z Less than 0.5 percent. 1 Prior to 2000, ‘‘other’’ includes vinyl siding.

Source: U.S. Census Bureau, ‘‘Characteristics of New Housing’’; <http://www.census.gov/const/www/charindex.html>.

Construction and Housing 593

U.S. Census Bureau, Statistical Abstract of the United States: 2009

Table 930. Housing Starts and Average Length of Time from Start toCompletion of New Privately Owned One-Unit Residential Buildings:1980 to 2007

[852 represents 852,000. For buildings started in permit-issuing places]

YearTotal 1

Purpose of construction Region 2

Built forsale

Contractorbuilt

Ownerbuilt

North-east Midwest South West

STARTS (1,000)1980 . . . . . . . . . . . . . . 852 526 149 164 87 142 428 1961985 . . . . . . . . . . . . . . 1,072 713 177 157 182 148 504 2391990 . . . . . . . . . . . . . . 895 529 196 147 104 193 371 2261995 . . . . . . . . . . . . . . 1,076 712 199 133 102 234 485 2561997 . . . . . . . . . . . . . . 1,134 784 189 131 111 238 507 2781998 . . . . . . . . . . . . . . 1,271 882 209 144 122 273 574 3031999 . . . . . . . . . . . . . . 1,302 912 208 142 126 289 580 308

2000 . . . . . . . . . . . . . . 1,231 871 195 128 118 260 556 2972001 . . . . . . . . . . . . . . 1,273 919 186 129 111 269 590 3032002 . . . . . . . . . . . . . . 1,359 999 198 125 118 277 628 3362003 . . . . . . . . . . . . . . 1,499 1,120 205 127 116 309 686 3882004 . . . . . . . . . . . . . . 1,611 1,240 198 130 128 306 743 4332005 . . . . . . . . . . . . . . 1,716 1,358 197 129 138 306 831 4412006 . . . . . . . . . . . . . . 1,465 1,121 189 119 118 235 757 3562007 . . . . . . . . . . . . . . 1,046 760 151 104 93 171 540 242

COMPLETION (months)1980 . . . . . . . . . . . . . . 6.9 6.2 5.5 10.1 7.7 8.0 6.1 7.41985 . . . . . . . . . . . . . . 6.2 5.4 4.9 10.6 7.2 6.0 5.7 6.71990 . . . . . . . . . . . . . . 6.4 5.9 5.3 10.3 9.3 5.6 5.7 6.91995 . . . . . . . . . . . . . . 5.9 5.2 5.8 9.5 7.4 6.0 5.4 6.01997 . . . . . . . . . . . . . . 6.0 5.2 5.9 9.8 7.3 6.2 5.6 5.81998 . . . . . . . . . . . . . . 6.0 5.4 6.0 9.5 7.1 6.2 5.5 6.11999 . . . . . . . . . . . . . . 6.1 5.5 6.4 9.2 7.0 6.4 5.7 6.3

2000 . . . . . . . . . . . . . . 6.2 5.6 6.5 9.2 7.5 6.4 5.9 6.02001 . . . . . . . . . . . . . . 6.2 5.6 7.0 9.2 7.6 6.5 5.8 6.32002 . . . . . . . . . . . . . . 6.1 5.5 6.6 9.6 7.3 6.4 5.6 6.22003 . . . . . . . . . . . . . . 6.2 5.5 6.8 9.9 7.5 6.7 5.7 6.22004 . . . . . . . . . . . . . . 6.2 5.7 7.0 9.1 7.3 6.7 5.8 6.32005 . . . . . . . . . . . . . . 6.4 5.9 7.6 9.8 7.7 6.6 6.0 6.82006 . . . . . . . . . . . . . . 6.9 6.3 7.8 10.7 8.3 7.1 6.3 7.42007 . . . . . . . . . . . . . . 7.1 6.5 7.9 10.2 8.5 7.4 6.5 8.0

1 Includes units built for rent not shown separately. 2 For composition of regions, see map inside front cover.

Source: U.S. Census Bureau, ‘‘New Residential Construction.’’ See <http://www.census.gov/const/www/newresconstindex.html>.

Table 931. Price Indexes of New One-Family Houses Sold, by Region:1980 to 2007

[1996 = 100. Based on kinds of homes sold in 1996. Includes value of the lot. For composition of regions, see map, inside frontcover]

Year Total Northeast Midwest South West

1980 . . . . . . . . . . . . . . 38.9 30.2 41.2 44.4 31.91982 . . . . . . . . . . . . . . 43.0 34.0 46.4 49.8 34.31983 . . . . . . . . . . . . . . 43.9 36.1 46.2 51.2 34.91984 . . . . . . . . . . . . . . 45.7 39.2 49.0 52.8 36.21985 . . . . . . . . . . . . . . 46.2 43.1 48.2 53.9 36.4

1986 . . . . . . . . . . . . . . 48.0 49.5 51.0 55.5 37.31987 . . . . . . . . . . . . . . 50.6 56.2 54.4 57.6 39.31988 . . . . . . . . . . . . . . 52.5 57.6 56.8 58.8 41.41989 . . . . . . . . . . . . . . 54.6 59.2 58.1 60.5 44.01990 . . . . . . . . . . . . . . 55.7 58.0 58.6 60.6 46.2

1991 . . . . . . . . . . . . . . 56.4 56.2 60.1 61.8 46.41992 . . . . . . . . . . . . . . 57.2 60.5 61.2 62.4 46.71993 . . . . . . . . . . . . . . 59.4 57.4 65.2 65.5 47.81994 . . . . . . . . . . . . . . 62.9 62.0 69.4 68.1 51.91995 . . . . . . . . . . . . . . 64.3 62.3 70.9 70.1 52.7

1996 . . . . . . . . . . . . . . 66.0 63.2 72.5 71.2 55.31997 . . . . . . . . . . . . . . 67.5 65.9 74.3 72.7 56.51998 . . . . . . . . . . . . . . 69.2 66.1 76.0 74.4 58.41999 . . . . . . . . . . . . . . 72.8 69.1 79.5 78.1 62.02000 . . . . . . . . . . . . . . 75.6 73.0 83.5 80.6 64.4

2001 . . . . . . . . . . . . . . 77.9 76.7 84.4 82.8 67.12002 . . . . . . . . . . . . . . 81.4 80.2 86.1 86.3 71.52003 . . . . . . . . . . . . . . 86.0 84.3 90.6 89.4 78.22004 . . . . . . . . . . . . . . 92.8 91.6 96.7 94.4 88.22005 . . . . . . . . . . . . . . 100.0 100.0 100.0 100.0 100.02006 . . . . . . . . . . . . . . 104.7 102.6 102.9 105.4 105.22007 . . . . . . . . . . . . . . 104.9 101.5 102.8 107.4 102.6

Source: U.S. Census Bureau, ‘‘Construction Price Indexes.’’ See <http://www.census.gov/const/www/constpriceindex.html>.

594 Construction and Housing

U.S. Census Bureau, Statistical Abstract of the United States: 2009

Table 932. New Privately Owned One-Family Houses Sold by Region and Typeof Financing, 1980 to 2007, and by Sales-Price Group, 2007

[In thousands (545 represents 545,000). Based on a national probability sample of monthly interviews with builders or ownersof one-family houses for which building permits have been issued or, for nonpermit areas on which construction has started. Fordetails, see source and Appendix III. For composition of regions, see map inside front cover]

Year andsales-price group Total

sales

Region Financing type

Northeast Midwest South WestConven-

tional 1

FHAandVA

RuralHousing

Service 2 Cash

1980 . . . . . . . . . . . . . . 545 50 81 267 145 302 196 14 321985 . . . . . . . . . . . . . . 688 112 82 323 170 403 208 11 641990 . . . . . . . . . . . . . . 534 71 89 225 149 337 138 10 50

1995 . . . . . . . . . . . . . . 667 55 125 300 187 490 129 9 392000 . . . . . . . . . . . . . . 877 71 155 406 244 695 138 4 40

2001 . . . . . . . . . . . . . . 908 66 164 439 239 726 141 2 392002 . . . . . . . . . . . . . . 973 65 185 450 273 788 140 4 422003 . . . . . . . . . . . . . . 1,086 79 189 511 307 911 130 4 412004 . . . . . . . . . . . . . . 1,203 83 210 562 348 1,047 105 6 462005 . . . . . . . . . . . . . . 1,283 81 205 638 358 1,150 79 1 522006 . . . . . . . . . . . . . . 1,051 63 161 559 267 948 63 1 38

2007. . . . . . . . . . . . . 776 65 118 411 181 693 52 2 30Under $200,000 . . . . . . . 268 13 55 179 22 (NA) (NA) (NA) (NA)$200,000 to $299,999 . . . 227 16 37 120 54 (NA) (NA) (NA) (NA)$300,000 to $499,999 . . . 186 21 18 83 64 (NA) (NA) (NA) (NA)$500,000 and over . . . . . 94 15 8 30 41 (NA) (NA) (NA) (NA)

NA Not available. 1 Includes houses reporting other types of financing 2 Prior to 2000, the Farmers Home Administration.

Source: U.S. Census Bureau and U.S. Department of Housing and Urban Development, Current Construction Reports, SeriesC25, Characteristics of New Housing, annual; and New One-Family Houses Sold, monthly; publications discontinued in 2001. See‘‘New Residential Sales’’ at <http://www.census.gov/const/www/newressalesindex.html>.

Table 933. Median Sales Price of New Privately Owned One-Family Houses Soldby Region: 1980 to 2007

[In dollars. For definition of median, see Guide to Tabular Presentation. For composition of regions, see map inside front cover.See Appendix III. See also headnote, Table 932]

Year U.S.North-

eastMid-west South West

1980 . . . . 64,600 69,500 63,400 59,600 72,3001985 . . . . 84,300 103,300 80,300 75,000 92,6001990 . . . . 122,900 159,000 107,900 99,000 147,5001995 . . . . 133,900 180,000 134,000 124,500 141,4002000 . . . . 169,000 227,400 169,700 148,000 196,4002001 . . . . 175,200 246,400 172,600 155,400 213,600

Year U.S.North-

eastMid-west South West

2002 . . . . 187,600 264,300 178,000 163,400 238,5002003 . . . . 195,000 264,500 184,300 168,100 260,9002004 . . . . 221,000 315,800 205,000 181,100 283,1002005 . . . . 240,900 343,800 216,900 197,300 332,6002006 . . . . 246,500 346,000 213,500 208,200 337,7002007 . . . . 247,900 320,200 208,600 217,700 330,900

Source: U.S. Census Bureau and U.S. Department of Housing and Urban Development, Current Construction Reports, SeriesC25, Characteristics of New Housing, annual; and New One-Family Houses Sold, monthly; publications discontinued in 2001. SeeNew Residential Sales at <http://www.census.gov/const/www/newressalesindex.html>.

Table 934. New Manufactured (Mobile) Homes Placed for Residential Use andAverage Sales Price by Region: 1980 to 2007

[233.7 represents 233,700. A mobile home is a moveable dwelling, 8 feet or more wide and 40 feet or more long, designed to betowed on its own chassis, with transportation gear integral to the unit when it leaves the factory, and without need of permanentfoundation. Excluded are travel trailers, motor homes, and modular housing. Data are based on a probability sample and subjectto sampling variability; see source. For composition of regions, see map inside front cover]

YearUnits placed (1,000) Average sales price (dol.)

TotalNorth-

eastMid-west South West U.S.

North-east

Mid-west South West

1980 . . . . . 233.7 12.3 32.3 140.3 48.7 19,800 18,500 18,600 18,200 25,4001985 . . . . . 283.4 20.2 38.6 187.6 36.9 21,800 22,700 21,500 20,400 28,7001990 . . . . . 195.4 18.8 37.7 108.4 30.6 27,800 30,000 27,000 24,500 39,3001995 . . . . . 319.4 15.0 57.5 203.2 43.7 35,300 35,800 35,700 33,300 44,1001997 . . . . . 336.3 14.3 55.3 219.4 47.3 39,800 41,300 40,300 38,000 47,3001998 . . . . . 373.7 14.7 58.3 250.3 50.4 41,600 42,200 42,400 40,100 48,4001999 . . . . . 338.3 14.1 53.6 227.2 43.5 43,300 44,000 44,400 41,900 49,600

2000 . . . . . 280.9 14.9 48.7 178.7 38.6 46,400 47,000 47,900 44,300 54,1002002 . . . . . 174.3 11.8 34.2 101.0 27.2 51,300 53,200 51,700 48,000 62,6002003 . . . . . 139.8 11.2 25.2 77.2 26.1 54,900 57,300 55,100 50,500 67,7002004 . . . . . 124.4 11.0 20.6 67.4 25.5 58,200 60,200 58,800 52,300 73,2002005 . . . . . 122.9 9.2 17.1 68.1 28.5 62,600 67,000 60,600 55,700 79,9002006 . . . . . 112.4 7.9 14.5 66.1 23.9 64,300 65,300 59,100 58,900 83,4002007 . . . . . 94.8 7.1 10.5 59.2 18.0 65,100 64,100 64,600 59,900 84,300

Source: U.S. Census Bureau, ‘‘Manufactured Housing’’; <http://www.census.gov/const/www/mhsindex.html>.

Construction and Housing 595

U.S. Census Bureau, Statistical Abstract of the United States: 2009

Table 935. Existing One-Family Homes Sold and Price by Region: 1990 to 2007

[2,914 represents 2,914,000. Includes existing detached single-family homes and townhomes; excludes condos and co-ops. Basedon data (adjusted and aggregated to regional and national totals) reported by participating real estate multiple listing services. Fordefinition of median, see Guide to Tabular Presentation. See Table 938 for data on condos and co-ops. For composition of regions,see map inside front cover]

YearHomes sold (1,000) Median sales price (dol.)

TotalNorth-

eastMid-west South West Total

North-east

Mid-west South West

1990 . . . . . . . . 2,914 510 806 1,010 587 97,300 146,200 76,700 86,300 141,2001991 . . . . . . . . 2,885 515 808 992 569 102,700 149,300 81,000 89,800 147,4001992 . . . . . . . . 3,150 578 906 1,049 618 105,500 149,000 84,600 92,900 143,3001993 . . . . . . . . 3,427 611 961 1,173 681 109,100 149,300 87,600 95,800 144,4001994 . . . . . . . . 3,544 615 963 1,220 746 113,500 149,300 90,900 97,200 151,900

1995 . . . . . . . . 3,519 609 944 1,219 747 117,000 146,500 96,500 99,200 153,6001996 . . . . . . . . 3,797 652 988 1,289 868 122,600 147,800 102,800 105,000 160,2001997 . . . . . . . . 3,964 678 1,009 1,363 914 129,000 152,400 108,900 111,300 169,0001998 . . . . . . . . 4,495 741 1,136 1,598 1,020 136,000 157,100 116,300 118,000 179,5001999 . . . . . . . . 4,649 728 1,144 1,705 1,072 141,200 160,700 121,600 122,100 189,400

2000 . . . . . . . . 4,603 714 1,116 1,706 1,066 147,300 161,200 125,600 130,300 199,2002001 . . . . . . . . 4,734 709 1,155 1,793 1,076 156,600 169,400 132,300 139,600 211,7002002 . . . . . . . . 4,975 731 1,217 1,871 1,155 167,600 190,100 138,300 149,700 234,3002003 . . . . . . . . 5,443 769 1,322 2,072 1,280 180,200 220,300 143,700 159,700 254,7002004 . . . . . . . . 5,958 821 1,389 2,310 1,438 195,200 254,400 151,500 171,800 289,100

2005 . . . . . . . . 6,180 838 1,411 2,457 1,474 219,000 281,600 168,300 181,100 340,3002006 . . . . . . . . 5,677 787 1,314 2,352 1,224 221,900 280,300 164,800 183,700 350,5002007 . . . . . . . . 4,939 723 1,181 2,053 982 217,900 288,100 161,400 178,800 342,500

Source: NATIONAL ASSOCIATION OF REALTORS, Washington, DC, Real Estate Outlook; Market Trends & Insights,monthly, (copyright). See <http://www.realtor.org/research>.

Table 936. Median Sales Price of Existing One-Family Homes by SelectedMetropolitan Area: 2005 and 2007

[In thousands of dollars (219.0 represents $219,000). Includes existing detached single-family homes and townhouses. Areasare metropolitan statistical areas defined by Office of Management and Budget as of 2004, except as noted]

Metropolitan area 2005 2007

United States, total . . . . . . . . . . . . 219.0 217.8Allentown-Bethlehem-Easton, PA-NJ . . . . 243.4 260.5Anaheim-Santa Ana-Irvine, CA 1 . . . . . . . 691.9 699.6Atlantic City, NJ . . . . . . . . . . . . . . . . . . 256.1 269.7Baltimore-Towson, MD. . . . . . . . . . . . . . 265.3 286.1Barnstable Town, MA. . . . . . . . . . . . . . . 398.3 384.7Boston-Cambridge-Quincy, MA-NH 2 . . . . 413.2 395.6Boulder, CO. . . . . . . . . . . . . . . . . . . . . 348.4 376.2Bridgeport-Stamford-Norwalk, CT. . . . . . . 482.4 486.6Cape Coral-Fort Myers, FL . . . . . . . . . . . 269.2 252.1Charleston-North Charleston, SC. . . . . . . 197.0 215.4Chicago-Naperville-Joliet, IL . . . . . . . . . . 264.2 276.6Colorado Springs, CO . . . . . . . . . . . . . . 205.9 217.5Deltona-Daytona Beach-Ormond Beach, FL . . . . . . . . . . . . . . . 192.5 192.3

Denver-Aurora, CO . . . . . . . . . . . . . . . . 247.1 245.4Dover, DE . . . . . . . . . . . . . . . . . . . . . . 180.4 207.5Eugene-Springfield, OR . . . . . . . . . . . . . 197.6 239.6Gainesville, FL . . . . . . . . . . . . . . . . . . . 184.0 211.1Hagerstown-Martinsburg, MD-WV . . . . . . 208.7 208.5Hartford-West Hartford-East Hartford, CT . . . . . . . . . . . . . . . . 253.3 263.2

Honolulu, HI. . . . . . . . . . . . . . . . . . . . . 590.0 643.5Kingston, NY . . . . . . . . . . . . . . . . . . . . 251.0 258.4Las Vegas-Paradise, NV . . . . . . . . . . . . 304.7 297.7Los Angeles-Long Beach-Santa Ana, CA 1 . . . . . . . . . . . . . . . . . 529.0 589.2

Madison, WI . . . . . . . . . . . . . . . . . . . . 218.3 226.5Miami-Fort Lauderdale-Miami Beach, FL. . . . . . . . . . . . . . . . . 370.1 365.5

Milwaukee-Waukesha-West Allis, WI . . . . 215.7 223.4Minneapolis-St. Paul-Bloomington, MN-WI . . . . . . . . . . . . . . 234.8 225.2

New Haven-Milford, CT . . . . . . . . . . . . . 279.1 286.5New York-Northern New Jersey-Long Island, NY-NJ-PA. . . . . . . . . . . . . 445.2 469.7

Metropolitan area 2005 2007

New York-Wayne-White Plains, NY-NJ. . 495.2 540.3NY: Edison, NJ . . . . . . . . . . . . . . . . . 375.5 380.3NY: Nassau-Suffolk, NY . . . . . . . . . . . 465.2 477.2NY: Newark-Union, NJ-PA. . . . . . . . . . 416.8 443.7

Norwich-New London, CT. . . . . . . . . . . . 255.9 267.7Orlando, FL . . . . . . . . . . . . . . . . . . . . . 243.6 261.3Palm Bay-Melbourne-Titusville, FL . . . . . . 209.7 183.6Philadelphia-Camden-Wilmington,PA-NJ-DE-MD . . . . . . . . . . . . . . . . . . 215.3 234.6

Phoenix-Mesa-Scottsdale, AZ . . . . . . . . . 247.4 257.4Pittsfield, MA . . . . . . . . . . . . . . . . . . . . 207.3 217.4Portland-South Portland-Biddeford, ME. . . 246.6 242.7Portland-Vancouver-Beaverton, OR-WA . . 244.9 295.2Providence-New Bedford-Fall River, RI-MA. . . . . . . . . . . . . . . . . 293.4 286.6

Raleigh-Cary, NC . . . . . . . . . . . . . . . . . 194.9 224.2Reno-Sparks, NV . . . . . . . . . . . . . . . . . 349.9 321.4Richmond, VA . . . . . . . . . . . . . . . . . . . 201.9 233.7Riverside-San Bernardino-Ontario, CA 1 . . 374.2 381.4Sacramento-Arden-Arcade-Roseville, CA 1 . . . . . . . . . . . . . . . . . . 375.9 342.7

Salem, OR . . . . . . . . . . . . . . . . . . . . . 177.7 228.3San Diego-Carlsbad-San Marcos, CA 1. . . 604.3 588.7San Francisco-Oakland-Fremont, CA 1 . . . 715.7 805.4San Jose-Sunnyvale-Santa Clara, CA 1 . . 744.5 836.8Sarasota-Bradenton-Venice, FL . . . . . . . . 354.2 310.9Seattle-Tacoma-Bellevue, WA . . . . . . . . . 316.8 386.9Springfield, MA. . . . . . . . . . . . . . . . . . . 201.8 211.9Tampa-St.Petersburg-Clearwater, FL . . . . 205.3 214.9Trenton-Ewing, NJ . . . . . . . . . . . . . . . . 261.1 307.1Tucson, AZ . . . . . . . . . . . . . . . . . . . . . 231.6 244.8Virginia Beach-Norfolk-Newport News, VA-NC. . . . . . . . . . . . . 197.2 245.0

Washington-Arlington-Alexandria, DC-VA-MD-WV. . . . . . . . . . 425.8 430.8

Worcester, MA . . . . . . . . . . . . . . . . . . . 290.7 274.61 California data supplied by the California Association of REALTORS. 2 Excludes areas in New Hampshire.

Source: NATIONAL ASSOCIATION OF REALTORS, Washington, DC, Real Estate Outlook: Market Trends & Insights,monthly, (copyright). See <http://www.realtor.org/research>.

596 Construction and Housing

U.S. Census Bureau, Statistical Abstract of the United States: 2009

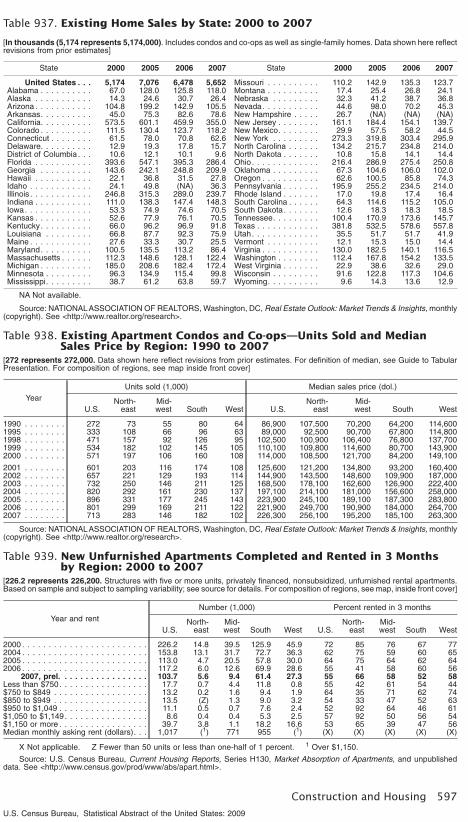
Table 937. Existing Home Sales by State: 2000 to 2007

[In thousands (5,174 represents 5,174,000). Includes condos and co-ops as well as single-family homes. Data shown here reflectrevisions from prior estimates]

State 2000 2005 2006 2007

United States . . . 5,174 7,076 6,478 5,652Alabama . . . . . . . . . . 67.0 128.0 125.8 118.0Alaska . . . . . . . . . . . 14.3 24.6 30.7 26.4Arizona . . . . . . . . . . . 104.8 199.2 142.9 105.5Arkansas. . . . . . . . . . 45.0 75.3 82.6 78.6California. . . . . . . . . . 573.5 601.1 459.9 355.0Colorado . . . . . . . . . . 111.5 130.4 123.7 118.2Connecticut . . . . . . . . 61.5 78.0 70.8 62.6Delaware. . . . . . . . . . 12.9 19.3 17.8 15.7District of Columbia . . . 10.6 12.1 10.1 9.6Florida . . . . . . . . . . . 393.6 547.1 395.3 286.4Georgia . . . . . . . . . . 143.6 242.1 248.8 209.9Hawaii . . . . . . . . . . . 22.1 36.8 31.5 27.8Idaho . . . . . . . . . . . . 24.1 49.8 (NA) 36.3Illinois . . . . . . . . . . . . 246.8 315.3 289.0 239.7Indiana . . . . . . . . . . . 111.0 138.3 147.4 148.3Iowa. . . . . . . . . . . . . 53.3 74.9 74.6 70.5Kansas . . . . . . . . . . . 52.6 77.9 76.1 70.5Kentucky. . . . . . . . . . 66.0 96.2 96.9 91.8Louisiana . . . . . . . . . 66.8 87.7 92.3 75.9Maine . . . . . . . . . . . . 27.6 33.3 30.7 25.5Maryland. . . . . . . . . . 100.5 135.5 113.2 86.4Massachusetts . . . . . . 112.3 148.6 128.1 122.4Michigan . . . . . . . . . . 185.0 208.6 182.4 172.4Minnesota . . . . . . . . . 96.3 134.9 115.4 99.8Mississippi. . . . . . . . . 38.7 61.2 63.8 59.7

State 2000 2005 2006 2007

Missouri . . . . . . . . . . 110.2 142.9 135.3 123.7Montana . . . . . . . . . . 17.4 25.4 26.8 24.1Nebraska . . . . . . . . . 32.3 41.2 38.7 36.8Nevada. . . . . . . . . . . 44.6 98.0 70.2 45.3New Hampshire . . . . . 26.7 (NA) (NA) (NA)New Jersey . . . . . . . . 161.1 184.4 154.1 139.7New Mexico. . . . . . . . 29.9 57.5 58.2 44.5New York . . . . . . . . . 273.3 319.8 303.4 295.9North Carolina . . . . . . 134.2 215.7 234.8 214.0North Dakota . . . . . . . 10.8 15.8 14.1 14.4Ohio. . . . . . . . . . . . . 216.4 286.9 275.4 250.8Oklahoma . . . . . . . . . 67.3 104.6 106.0 102.0Oregon . . . . . . . . . . . 62.6 100.5 85.8 74.3Pennsylvania . . . . . . . 195.9 255.2 234.5 214.0Rhode Island . . . . . . . 17.0 19.8 17.4 16.4South Carolina . . . . . . 64.3 114.6 115.2 105.0South Dakota. . . . . . . 12.6 18.3 18.3 18.5Tennessee. . . . . . . . . 100.4 170.9 173.6 145.7Texas . . . . . . . . . . . . 381.8 532.5 578.6 557.8Utah. . . . . . . . . . . . . 35.5 51.7 51.7 41.9Vermont . . . . . . . . . . 12.1 15.3 15.0 14.4Virginia . . . . . . . . . . . 130.0 182.5 140.1 116.5Washington . . . . . . . . 112.4 167.8 154.2 133.5West Virginia . . . . . . . 22.9 38.6 32.6 29.0Wisconsin . . . . . . . . . 91.6 122.8 117.3 104.6Wyoming. . . . . . . . . . 9.6 14.3 13.6 12.9

NA Not available.

Source: NATIONALASSOCIATION OF REALTORS, Washington, DC, Real Estate Outlook: Market Trends & Insights, monthly(copyright). See <http://www.realtor.org/research>.

Table 938. Existing Apartment Condos and Co-ops—Units Sold and MedianSales Price by Region: 1990 to 2007

[272 represents 272,000. Data shown here reflect revisions from prior estimates. For definition of median, see Guide to TabularPresentation. For composition of regions, see map inside front cover]

YearUnits sold (1,000) Median sales price (dol.)

U.S.North-

eastMid-west South West U.S.

North-east

Mid-west South West

1990 . . . . . . . . 272 73 55 80 64 86,900 107,500 70,200 64,200 114,6001995 . . . . . . . . 333 108 66 96 63 89,000 92,500 90,700 67,800 114,8001998 . . . . . . . . 471 157 92 126 95 102,500 100,900 106,400 76,800 137,7001999 . . . . . . . . 534 182 102 145 105 110,100 109,800 114,600 80,700 143,9002000 . . . . . . . . 571 197 106 160 108 114,000 108,500 121,700 84,200 149,100

2001 . . . . . . . . 601 203 116 174 108 125,600 121,200 134,800 93,200 160,4002002 . . . . . . . . 657 221 129 193 114 144,900 143,500 148,600 109,900 187,0002003 . . . . . . . . 732 250 146 211 125 168,500 178,100 162,600 126,900 222,4002004 . . . . . . . . 820 292 161 230 137 197,100 214,100 181,000 156,600 258,0002005 . . . . . . . . 896 331 177 245 143 223,900 245,100 189,100 187,300 283,8002006 . . . . . . . . 801 299 169 211 122 221,900 249,700 190,900 184,000 264,7002007 . . . . . . . . 713 283 146 182 102 226,300 256,100 195,200 185,100 263,300

Source: NATIONALASSOCIATION OF REALTORS, Washington, DC, Real Estate Outlook: Market Trends & Insights, monthly(copyright). See <http://www.realtor.org/research>.

Table 939. New Unfurnished Apartments Completed and Rented in 3 Monthsby Region: 2000 to 2007

[226.2 represents 226,200. Structures with five or more units, privately financed, nonsubsidized, unfurnished rental apartments.Based on sample and subject to sampling variability; see source for details. For composition of regions, see map, inside front cover]

Year and rentNumber (1,000) Percent rented in 3 months

U.S.North-

eastMid-west South West U.S.

North-east

Mid-west South West

2000 . . . . . . . . . . . . . . . . . . . . . . . . 226.2 14.8 39.5 125.9 45.9 72 85 76 67 772004 . . . . . . . . . . . . . . . . . . . . . . . . 153.8 13.1 31.7 72.7 36.3 62 75 59 60 652005 . . . . . . . . . . . . . . . . . . . . . . . . 113.0 4.7 20.5 57.8 30.0 64 75 64 62 642006 . . . . . . . . . . . . . . . . . . . . . . . . 117.2 6.0 12.6 69.9 28.6 55 41 58 60 56

2007, prel. . . . . . . . . . . . . . . . . 103.7 5.6 9.4 61.4 27.3 55 66 58 52 58Less than $750. . . . . . . . . . . . . . . . . 17.7 0.7 4.4 11.8 0.8 55 42 61 54 44$750 to $849 . . . . . . . . . . . . . . . . . . 13.2 0.2 1.6 9.4 1.9 64 35 71 62 74$850 to $949 . . . . . . . . . . . . . . . . . . 13.5 (Z) 1.3 9.0 3.2 54 33 47 52 63$950 to $1,049 . . . . . . . . . . . . . . . . . 11.1 0.5 0.7 7.6 2.4 52 92 64 46 61$1,050 to $1,149. . . . . . . . . . . . . . . . 8.6 0.4 0.4 5.3 2.5 57 92 50 56 54$1,150 or more . . . . . . . . . . . . . . . . . 39.7 3.8 1.1 18.2 16.6 53 65 39 47 56Median monthly asking rent (dollars). . . 1,017 (1) 771 955 (1) (X) (X) (X) (X) (X)

X Not applicable. Z Fewer than 50 units or less than one-half of 1 percent. 1 Over $1,150.

Source: U.S. Census Bureau, Current Housing Reports, Series H130, Market Absorption of Apartments, and unpublisheddata. See <http://www.census.gov/prod/www/abs/apart.html>.

Construction and Housing 597

U.S. Census Bureau, Statistical Abstract of the United States: 2009

Table 940. Total Housing Inventory for the United States: 1980 to 2007

[In thousands (87,739 represents 87,739,000), except percent. Based on the Current Population Survey and the Housing VacancySurvey and subject to sampling error; see source and Appendix III for details]

Item 1980 1990 1995 2000 2002 1 2003 2004 2005 2006 2007

All housing units . . . . . 87,739 106,283 112,655 119,628 119,297 120,834 122,187 123,925 126,012 127,958

Vacant . . . . . . . . . . . . . . . . 8,101 12,059 12,669 13,908 14,332 15,274 15,599 15,694 16,437 17,652Year-round vacant. . . . . . . 5,996 9,128 9,570 10,439 10,771 11,631 11,884 11,916 12,459 13,276

For rent . . . . . . . . . . . . 1,575 2,662 2,946 3,024 3,347 3,676 3,802 3,721 3,737 3,848For sale only. . . . . . . . . 734 1,064 1,022 1,148 1,220 1,308 1,307 1,451 1,836 2,117Rented or sold . . . . . . . 623 660 810 856 842 976 991 1,060 1,108 1,130Held off market . . . . . . . 3,064 4,742 4,793 5,411 5,362 5,671 5,784 5,684 5,778 6,181

Occasional use . . . . . 814 1,485 1,667 1,892 1,819 1,989 1,967 1,884 1,858 1,993Usual residenceelsewhere . . . . . . . . 568 1,068 801 1,037 995 994 1,068 1,128 1,198 1,139

Other . . . . . . . . . . . . 1,683 2,189 2,325 2,482 2,548 2,688 2,749 2,672 2,722 3,049Seasonal 2. . . . . . . . . . . . 2,106 2,931 3,099 3,469 3,561 3,643 3,715 3,778 3,978 4,376

Total occupied . . . . . . . . . . . 79,638 94,224 99,985 105,720 104,965 105,560 106,588 108,231 109,575 110,306Owner . . . . . . . . . . . . . . 52,223 60,248 64,739 71,250 71,278 72,054 73,575 74,553 75,380 75,159Renter . . . . . . . . . . . . . . 27,415 33,976 35,246 34,470 33,687 33,506 33,013 33,678 34,195 35,147

PERCENT DISTRIBUTIONAll housing units . . . . . . 100.0 100.0 100.0 100.0 100.0 100.0 100.0 100.0 100.0 100.0

Vacant . . . . . . . . . . . . . . . . 9.2 11.3 11.2 11.6 12.0 12.6 12.8 12.7 13.0 13.8Total occupied . . . . . . . . . . . 90.8 88.7 88.8 88.4 88.0 87.4 87.2 87.3 87.0 86.2

Owner . . . . . . . . . . . . . . 59.5 56.7 57.5 59.6 59.7 59.6 60.2 60.2 60.3 58.7Renter . . . . . . . . . . . . . . 31.2 32.0 31.3 28.8 28.2 27.7 27.0 27.2 27.5 27.5

1 Revised. Based on 2000 census controls. 2 Beginning 1990, includes vacant seasonal mobile homes. For years shown,seasonal vacant housing units were underreported prior to 1990.

Source: U.S. Census Bureau, ‘‘Housing Vacancies and Home Ownership’’; <http://www.census.gov/hhes/www/housing/hvs/hvs.html>.

Table 941. Occupied Housing Inventory by Age of Householder: 1990 to 2007

[In thousands (94,224 represents 94,224,000). Based on the Current Population Survey/Housing Vacancy Survey; See sourcefor details]

Age of householder 1990 1995 2000 2001 2002 1 2003 2004 2005 2006 2007

Total . . . . . . . . . . . 94,224 99,986 105,719 107,009 104,965 105,560 106,588 108,231 109,576 110,306

Under 25 years old . . . . . 5,143 5,502 6,221 6,460 6,372 6,441 6,538 6,536 6,578 6,49425 to 29 years old . . . . . 9,508 8,662 8,482 8,358 8,231 8,213 8,491 8,790 8,975 9,17030 to 34 years old . . . . . 11,213 11,206 10,219 10,301 10,176 10,084 9,865 9,583 9,423 9,349

35 to 39 years old . . . . . 10,914 11,993 11,834 11,587 10,924 10,777 10,438 10,526 10,520 10,49940 to 44 years old . . . . . 9,893 11,151 12,377 12,504 11,839 11,748 11,768 11,722 11,484 11,12545 to 49 years old . . . . . 8,038 10,080 11,164 11,529 11,204 11,341 11,583 11,780 11,988 12,007

50 to 54 years old . . . . . 6,532 7,882 9,834 10,288 10,123 10,194 10,316 10,595 10,896 11,08255 to 59 years old . . . . . 6,182 6,355 7,602 7,827 8,261 8,550 8,928 9,504 9,919 10,01360 to 64 years old . . . . . 6,446 5,860 6,215 6,345 6,422 6,776 7,112 7,336 7,604 8,108

65 to 69 years old . . . . . 6,407 6,088 5,816 5,749 5,644 5,570 5,656 5,900 6,074 6,33070 to 74 years old . . . . . 5,397 5,693 5,567 5,496 5,137 5,163 5,065 5,016 5,057 5,06375 years old and over . . . 8,546 9,514 10,388 10,565 10,632 10,703 10,827 10,943 11,058 11,065

1 Revised. Based on 2000 census controls.

Source: U.S. Census Bureau, ‘‘Housing Vacancies and Home Ownership’’; <http://www.census.gov/hhes/www/housing/hvs/hvs.html>.

Table 942. Vacancy Rates for Housing Units—Characteristics: 2000 to 2007

[In percent. Rate is relationship between vacant housing for rent or for sale and the total rental and homeowner supply, whichcomprises occupied units, units rented or sold and awaiting occupancy, and vacant units available for rent or sale. Based on theCurrent Population/Housing Vacancy Survey; see source for details. For composition of regions, see map, inside front cover]

CharacteristicRental units Homeowner units

2000 2005 2006 2007 2000 2005 2006 2007

Total units . . . . . . . 8.0 9.8 9.7 9.7 1.6 1.9 2.4 2.7

Northeast . . . . . . . . . . . . 5.6 6.5 7.1 7.0 1.2 1.5 1.7 2.0Midwest . . . . . . . . . . . . . 8.8 12.6 12.4 11.5 1.3 2.2 2.6 2.8South . . . . . . . . . . . . . . 10.5 11.8 11.6 12.3 1.9 2.1 2.7 3.1West . . . . . . . . . . . . . . . 5.8 7.3 6.8 6.7 1.5 1.4 2.1 2.5

Units in structure:1 unit . . . . . . . . . . . . . 7.0 9.9 10.0 9.6 1.5 1.7 2.1 2.42 units or more . . . . . . 8.7 10.0 9.8 10.0 4.7 6.2 7.9 8.35 units or more . . . . . . 9.2 10.4 9.9 10.3 5.8 6.6 8.5 8.5

Units with—3 rooms or less . . . . . . 10.3 12.1 11.8 11.9 10.4 12.0 13.1 14.94 rooms . . . . . . . . . . . 8.2 9.6 10.0 10.0 2.9 3.3 4.6 4.95 rooms . . . . . . . . . . . 6.9 9.3 8.8 8.6 2.0 2.2 2.6 3.06 rooms or more . . . . . 5.2 8.1 7.8 7.9 1.1 1.4 1.7 2.0

Source: U.S. Census Bureau, ‘‘Housing Vacancies and Home Ownership’’; <http://www.census.gov/hhes/www/housing/hvs/hvs.html>.

598 Construction and Housing

U.S. Census Bureau, Statistical Abstract of the United States: 2009

Table 943. Housing Units and Tenure—States: 2006

[126,312 represents 126,312,000. The American Community Survey universe includes the household population and the popu-lation living in institutions, college dormitories, and other group quarters. Based on a sample and subject to sampling variability;see Appendix III]

State

Housing units Housing tenure

Total(1,000)

Occu-pied

(1,000)

Vacant (1,000) Vacancy rate Owner-occupiedunits

Renter-occupiedunits

Total

Forsea-

sonaluse 1

Home-owner 2 Renter 3

Total(1,000)

Averagehouse-

holdsize

Total(1,000)

Averagehouse-

holdsize

United States . . . 126,312 111,617 14,694 4,214 2.3 8.0 75,086 2.66 36,531 2.31

Alabama . . . . . . . . . . 2,110 1,796 314 66 2.2 8.9 1,289 2.57 507 2.31Alaska. . . . . . . . . . . . 277 230 47 23 1.6 7.6 148 2.93 82 2.60Arizona . . . . . . . . . . . 2,605 2,225 380 161 3.0 8.4 1,523 2.75 702 2.67Arkansas . . . . . . . . . . 1,273 1,103 170 39 2.7 8.1 753 2.54 350 2.33California . . . . . . . . . . 13,175 12,151 1,024 276 1.9 4.7 7,102 3.02 5,049 2.80

Colorado . . . . . . . . . . 2,095 1,847 248 96 2.7 8.5 1,269 2.62 578 2.30Connecticut . . . . . . . . 1,432 1,325 107 22 1.2 6.2 921 2.71 404 2.21Delaware . . . . . . . . . . 383 320 63 31 2.9 10.2 238 2.65 82 2.42District of Columbia . . . 283 250 32 1 2.6 6.1 115 2.27 136 2.11Florida. . . . . . . . . . . . 8,532 7,106 1,426 656 3.7 8.5 4,994 2.52 2,112 2.42

Georgia . . . . . . . . . . . 3,873 3,377 497 76 3.1 10.5 2,285 2.75 1,092 2.58Hawaii. . . . . . . . . . . . 500 433 67 33 1.1 6.1 258 3.04 175 2.65Idaho . . . . . . . . . . . . 616 549 67 32 1.7 5.3 391 2.68 158 2.44Illinois . . . . . . . . . . . . 5,200 4,724 475 36 2.3 8.8 3,301 2.77 1,423 2.36Indiana . . . . . . . . . . . 2,757 2,435 321 38 3.3 11.4 1,756 2.62 679 2.25

Iowa . . . . . . . . . . . . . 1,320 1,209 111 18 2.0 6.4 886 2.50 323 2.05Kansas . . . . . . . . . . . 1,207 1,088 119 12 2.2 7.3 761 2.56 327 2.23Kentucky . . . . . . . . . . 1,888 1,652 236 31 2.3 9.9 1,167 2.57 485 2.25Louisiana. . . . . . . . . . 1,830 1,565 265 42 1.6 6.5 1,072 2.74 493 2.50Maine . . . . . . . . . . . . 691 548 143 99 2.4 6.0 399 2.46 149 2.04

Maryland . . . . . . . . . . 2,301 2,089 212 50 1.4 7.7 1,450 2.74 639 2.34Massachusetts . . . . . . 2,709 2,446 263 104 1.5 5.6 1,588 2.75 858 2.16Michigan . . . . . . . . . . 4,514 3,869 644 247 3.1 10.6 2,908 2.65 961 2.22Minnesota . . . . . . . . . 2,283 2,042 241 110 1.7 8.2 1,558 2.59 484 2.03Mississippi . . . . . . . . . 1,241 1,076 166 29 1.8 9.5 760 2.67 315 2.50

Missouri. . . . . . . . . . . 2,623 2,305 318 70 2.3 8.6 1,629 2.58 676 2.18Montana . . . . . . . . . . 432 372 60 28 1.4 6.3 260 2.55 112 2.28Nebraska. . . . . . . . . . 775 701 74 15 2.2 7.7 476 2.60 225 2.13Nevada . . . . . . . . . . . 1,065 937 128 31 3.3 9.2 581 2.69 356 2.53New Hampshire . . . . . 590 505 85 57 1.7 5.3 364 2.69 141 2.12

New Jersey . . . . . . . . 3,473 3,135 337 120 1.7 6.5 2,110 2.86 1,025 2.43New Mexico . . . . . . . . 850 726 124 42 1.5 8.6 506 2.74 220 2.40New York. . . . . . . . . . 7,908 7,088 819 256 1.7 5.0 3,941 2.81 3,147 2.42North Carolina . . . . . . 4,027 3,454 572 167 2.3 10.1 2,351 2.54 1,103 2.36North Dakota . . . . . . . 307 272 35 12 1.3 5.9 182 2.44 91 1.81

Ohio . . . . . . . . . . . . . 5,045 4,500 546 47 2.7 10.9 3,150 2.61 1,349 2.19Oklahoma . . . . . . . . . 1,607 1,385 222 34 2.2 10.3 950 2.56 435 2.37Oregon . . . . . . . . . . . 1,587 1,450 137 48 1.6 5.7 939 2.60 511 2.31Pennsylvania . . . . . . . 5,454 4,846 608 161 1.9 8.2 3,475 2.62 1,370 2.11Rhode Island . . . . . . . 450 406 44 15 1.3 7.3 255 2.72 150 2.20

South Carolina . . . . . . 1,976 1,657 319 93 2.7 11.6 1,165 2.57 492 2.40South Dakota . . . . . . . 352 312 40 12 0.9 7.4 216 2.54 96 2.10Tennessee . . . . . . . . . 2,681 2,375 306 53 2.2 9.8 1,660 2.55 715 2.31Texas . . . . . . . . . . . . 9,225 8,109 1,116 194 2.3 10.4 5,291 2.95 2,818 2.58Utah . . . . . . . . . . . . . 901 814 87 37 1.4 6.3 586 3.21 228 2.74

Vermont . . . . . . . . . . 310 254 56 44 1.1 4.1 182 2.53 71 1.98Virginia . . . . . . . . . . . 3,231 2,905 326 74 2.0 7.1 2,030 2.63 875 2.35Washington . . . . . . . . 2,700 2,472 228 68 1.6 6.2 1,620 2.66 852 2.28West Virginia . . . . . . . 878 743 135 42 2.2 6.3 555 2.46 188 2.16Wisconsin . . . . . . . . . 2,533 2,230 303 152 1.7 7.4 1,571 2.57 659 2.06Wyoming . . . . . . . . . . 239 207 32 14 1.5 6.2 144 2.50 63 2.22

1 For seasonal, recreational, or occasional use. 2 Proportion of the homeowner housing inventory which is vacant for sale.3 Proportion of the rental inventory which is vacant for rent.

Source: U.S. Census Bureau, 2006 American Community Survey Tables B25002. Occupancy Status; B25003. Tenure;B25004. Vacancy Status; and B25010. Average Household Size of Units by Tenure; using American FactFinder®. See <http://factfinder.census.gov/>; (accessed March 2008).

Construction and Housing 599

U.S. Census Bureau, Statistical Abstract of the United States: 2009

Table 944. Homeownership and Rental Vacancy Rates by State: 2007

[The American Community Survey universe is limited to the household population and excludes the population living in institutions,college dormitories, and other group quarters. Based on a sample and subject to sampling variability; see Appendix III. FIPS meansFederal Information Processing Standards]

State

Home-owner-

shipvacancy

rate

Rentalvacancy

rate

U.S. . . . . . 2.7 9.7

AL . . . . . . 2.9 15.3AK . . . . . . 2.6 7.7AZ . . . . . . 3.8 9.6AR . . . . . . 2.2 11.8CA . . . . . . 2.3 6.1CO. . . . . . 3.1 10.1CT . . . . . . 2.3 8.0DE . . . . . . 2.8 15.0DC. . . . . . 3.2 9.6FL . . . . . . 5.1 13.7GA. . . . . . 3.8 13.1HI . . . . . . 1.7 6.3ID . . . . . . 2.9 8.1IL. . . . . . . 2.6 10.4IN . . . . . . 3.2 13.3IA . . . . . . 2.9 10.9

State

Home-owner-

shipvacancy

rate

Rentalvacancy

rate

KS . . . . . . 1.9 11.1KY . . . . . . 2.8 10.4LA . . . . . . 2.5 8.8ME. . . . . . 2.5 6.4MD. . . . . . 2.7 11.4MA. . . . . . 1.7 5.7MI . . . . . . 3.8 17.0MN. . . . . . 2.8 7.6MS. . . . . . 1.5 9.4MO . . . . . 2.1 11.7MT. . . . . . 1.4 6.0NE . . . . . . 2.5 10.2NV . . . . . . 4.6 9.8NH. . . . . . 1.9 5.7NJ . . . . . . 1.6 6.8NM. . . . . . 2.8 9.3NY . . . . . . 2.2 6.1NC. . . . . . 2.4 12.4

State

Home-owner-

shipvacancy

rate

Rentalvacancy

rate

ND. . . . . . 1.1 7.6OH. . . . . . 3.2 11.9OK. . . . . . 2.4 9.8OR. . . . . . 2.1 5.9PA . . . . . . 2.1 10.0RI . . . . . . 1.5 9.5SC . . . . . . 3.1 10.6SD . . . . . . 1.7 8.9TN . . . . . . 2.1 9.2TX . . . . . . 2.5 13.8UT . . . . . . 2.0 5.5VT . . . . . . 1.0 4.9VA . . . . . . 2.6 9.7WA . . . . . 1.5 4.5WV . . . . . 1.5 9.6WI . . . . . . 1.7 7.9WY . . . . . 1.7 5.4

Source: U.S. Census Bureau, ‘‘Housing Vacancies and Home Ownership’’; <http://www.census.gov/hhes/www/housing/hvs/annual07/ann07ind.html>.

Table 945. Homeownership and Rental Vacancy Rates by Metropolitan Area:2007

[Based on the Current Population Survey and the Housing Vacancy Survey and subject to sampling error; see source and Appen-dix III for details]

Metropolitan area

Home-owner-

shipvacancy

rates

Rentalvacancy

rates

Inside Metropolitan Areas . . . . . . . 2.8 9.8

Akron, OH . . . . . . . . . . . . . . . . . . . . . . 4.5 8.4Albany-Schenectady-Troy, NY . . . . . . . . . 2.1 4.9Albuquerque, NM . . . . . . . . . . . . . . . . . 2.6 8.8Allentown-Bethleham-Easton, PA-NJ . . . . 1.2 8.1Atlanta-Sandy Springs-Marietta, GA . . . . . 4.7 14.7Austin-Round Rock, TX . . . . . . . . . . . . . 1.5 6.8Bakersfield, CA . . . . . . . . . . . . . . . . . . 1.3 11.2Baltimore-Towson, MD. . . . . . . . . . . . . . 2.7 11.3Baton Rouge, LA . . . . . . . . . . . . . . . . . 1.6 4.4Birmingham-Hoover, AL . . . . . . . . . . . . . 2.5 17.5Boston-Cambridge-Quincy, MA-NH . . . . . 1.9 5.0Bridgeport-Stamford-Norwalk, CT. . . . . . . 4.3 6.7Buffalo-Cheektowaga-Tonawanda, NY . . . 1.4 8.6Charlotte-Gastonia-Concord, NC-SC . . . . 3.1 11.0Chicago-Naperville-Joliet, IL . . . . . . . . . . 2.7 11.0Cincinnati-Middletown, OH-KY-IN. . . . . . . 4.0 12.0Cleveland-Elyria-Mentor, OH. . . . . . . . . . 4.5 13.9Columbia, SC. . . . . . . . . . . . . . . . . . . . 2.1 8.3Columbus, OH . . . . . . . . . . . . . . . . . . . 2.8 13.3Dallas-Ft. Worth-Arlington, TX . . . . . . . . . 2.5 11.0Dayton, OH . . . . . . . . . . . . . . . . . . . . . 1.2 16.6Denver-Aurora, CO . . . . . . . . . . . . . . . . 3.0 10.1Detroit-Warren-Livonia, MI . . . . . . . . . . . 4.1 19.4El Paso, TX . . . . . . . . . . . . . . . . . . . . . 2.2 6.3Fresno, CA . . . . . . . . . . . . . . . . . . . . . 0.3 5.6Grand Rapids-Wyoming, MI . . . . . . . . . . 1.7 12.7Greensboro-High Point, NC . . . . . . . . . . 2.4 8.2Hartford-West Hartford-East Hartford, CT . 0.8 7.4Honolulu, HI. . . . . . . . . . . . . . . . . . . . . 1.2 5.1Houston-Baytown-Sugar Land, TX . . . . . . 3.1 17.3Indianapolis, IN . . . . . . . . . . . . . . . . . . 4.3 14.9Jacksonville, FL . . . . . . . . . . . . . . . . . . 4.6 14.5Kansas City, MO-KS . . . . . . . . . . . . . . . 2.5 15.8Las Vegas-Paradise, NV . . . . . . . . . . . . 4.9 10.9Los Angeles-Long Beach-Santa Ana, CA . 1.6 4.7Louisville, KY-IN . . . . . . . . . . . . . . . . . . 3.8 11.7Memphis, TN-AR-MS. . . . . . . . . . . . . . . 2.8 12.8Miami-Fort Lauderdale-Miami Beach, FL . . 4.4 10.4

Metropolitan area

Home-owner-

shipvacancy

rates

Rentalvacancy

rates

Milwaukee-Waukesha-West Allis, WI . . . . 1.4 8.3Minneapolis-St. Paul-Bloomington, MN-WI. 3.2 6.9Nashville-Davidson−Murfreesboro, TN . . . 2.4 7.6New Haven-Milford, CT . . . . . . . . . . . . . 2.2 8.6New Orleans-Metairie-Kenner, LA . . . . . . 4.0 9.1New York-Northern New Jersey-LongIsland, NY . . . . . . . . . . . . . . . . . . . . . 2.1 5.7

Oklahoma City, OK . . . . . . . . . . . . . . . . 2.5 7.4Omaha-Council Bluffs, NE-IA . . . . . . . . . 2.5 11.9Orlando, FL . . . . . . . . . . . . . . . . . . . . . 7.4 11.3Oxnard-Thousand Oaks-Ventura, CA . . . . 1.9 5.4Philadelphia-Camden-Wilmington, PA . . . . 1.9 12.6Phoenix-Mesa-Scottsdale, AZ . . . . . . . . . 3.7 9.2Pittsburgh, PA . . . . . . . . . . . . . . . . . . . 3.0 9.3Portland-Vancouver-Beaverton, OR-WA . . 2.3 4.8Poughkeepsie-Newburg-Middletown, NJ . . 0.1 9.8Providence-New Bedford-Fall RiverRI-MA . . . . . . . . . . . . . . . . . . . . . . . . 1.6 9.2

Raleigh-Cary, NC . . . . . . . . . . . . . . . . . 1.6 11.2Richmond, VA . . . . . . . . . . . . . . . . . . . 2.9 16.3Riverside-San Bernardino-Ontario, CA . . . 3.8 8.9Rochester, NY . . . . . . . . . . . . . . . . . . . 1.4 6.4Sacramento−Arden-Arade−Roseville, CA . 4.2 9.5St. Louis, MO-IL . . . . . . . . . . . . . . . . . . 1.7 10.7Salt Lake City, UT. . . . . . . . . . . . . . . . . 2.2 5.3San Antonio, TX . . . . . . . . . . . . . . . . . . 2.4 16.3San Diego-Carlsbad-San Marcos, CA. . . . 3.0 7.1San Francisco-Oakland-Freemont, CA . . . 1.3 6.2San Jose-Sunnyvale-Santa Clara, CA. . . . 0.8 3.8Seattle-Bellevue-Everett, WA . . . . . . . . . 1.8 4.9Springfield, MA. . . . . . . . . . . . . . . . . . . 1.4 6.7Syracuse, NY. . . . . . . . . . . . . . . . . . . . 3.1 13.6Tampa-St. Petersburg-Clearwater, FL . . . . 5.1 12.8Toledo, OH . . . . . . . . . . . . . . . . . . . . . 2.4 8.5Tucson, AZ . . . . . . . . . . . . . . . . . . . . . 2.2 7.9Tulsa, OK . . . . . . . . . . . . . . . . . . . . . . 3.3 13.5Virginia Beach-Norfolk-Newport News, VA . 3.5 7.7Washington-Arlington-Alexandria,DC-VA-MD-WV. . . . . . . . . . . . . . . . . . 2.4 10.4

Worchester, MA . . . . . . . . . . . . . . . . . . 0.5 7.0

Source: U.S. Census Bureau, ‘‘Housing Vacancies and Home Ownership’’; <http://www.census.gov/hhes/www/housing/hvs/annual07/ann07ind.html>.

600 Construction and Housing

U.S. Census Bureau, Statistical Abstract of the United States: 2009

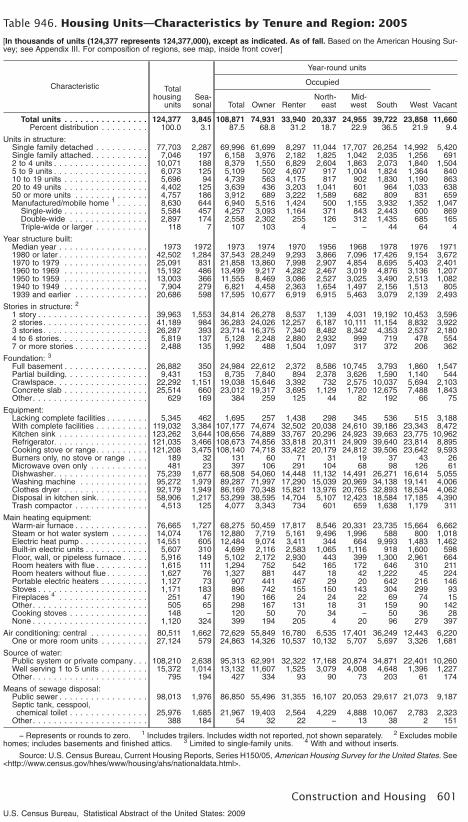
Table 946. Housing Units—Characteristics by Tenure and Region: 2005

[In thousands of units (124,377 represents 124,377,000), except as indicated. As of fall. Based on the American Housing Sur-vey; see Appendix III. For composition of regions, see map, inside front cover]

Characteristic Totalhousing

unitsSea-sonal

Year-round units

Occupied

VacantTotal Owner RenterNorth-

eastMid-west South West

Total units . . . . . . . . . . . . . . . . 124,377 3,845 108,871 74,931 33,940 20,337 24,955 39,722 23,858 11,660Percent distribution . . . . . . . . . 100.0 3.1 87.5 68.8 31.2 18.7 22.9 36.5 21.9 9.4

Units in structure:Single family detached . . . . . . . . . . 77,703 2,287 69,996 61,699 8,297 11,044 17,707 26,254 14,992 5,420Single family attached. . . . . . . . . . . 7,046 197 6,158 3,976 2,182 1,825 1,042 2,035 1,256 6912 to 4 units . . . . . . . . . . . . . . . . . . 10,071 188 8,379 1,550 6,829 2,604 1,863 2,073 1,840 1,5045 to 9 units . . . . . . . . . . . . . . . . . . 6,073 125 5,109 502 4,607 917 1,004 1,824 1,364 84010 to 19 units . . . . . . . . . . . . . . . . 5,696 94 4,739 563 4,175 817 902 1,830 1,190 86320 to 49 units . . . . . . . . . . . . . . . . 4,402 125 3,639 436 3,203 1,041 601 964 1,033 63850 or more units . . . . . . . . . . . . . . 4,757 186 3,912 689 3,222 1,589 682 809 831 659Manufactured/mobile home 1 . . . . . . 8,630 644 6,940 5,516 1,424 500 1,155 3,932 1,352 1,047

Single-wide . . . . . . . . . . . . . . . . 5,584 457 4,257 3,093 1,164 371 843 2,443 600 869Double-wide . . . . . . . . . . . . . . . 2,897 174 2,558 2,302 255 126 312 1,435 685 165Triple-wide or larger . . . . . . . . . . 118 7 107 103 4 − − 44 64 4

Year structure built:Median year . . . . . . . . . . . . . . . . . 1973 1972 1973 1974 1970 1956 1968 1978 1976 19711980 or later . . . . . . . . . . . . . . . . . 42,502 1,284 37,543 28,249 9,293 3,866 7,096 17,426 9,154 3,6721970 to 1979 . . . . . . . . . . . . . . . . 25,091 831 21,858 13,860 7,998 2,907 4,854 8,695 5,403 2,4011960 to 1969 . . . . . . . . . . . . . . . . 15,192 486 13,499 9,217 4,282 2,467 3,019 4,876 3,136 1,2071950 to 1959 . . . . . . . . . . . . . . . . 13,003 366 11,555 8,469 3,086 2,527 3,025 3,490 2,513 1,0821940 to 1949 . . . . . . . . . . . . . . . . 7,904 279 6,821 4,458 2,363 1,654 1,497 2,156 1,513 8051939 and earlier . . . . . . . . . . . . . . 20,686 598 17,595 10,677 6,919 6,915 5,463 3,079 2,139 2,493

Stories in structure: 2

1 story . . . . . . . . . . . . . . . . . . . . . 39,963 1,553 34,814 26,278 8,537 1,139 4,031 19,192 10,453 3,5962 stories. . . . . . . . . . . . . . . . . . . . 41,189 984 36,283 24,026 12,257 6,187 10,111 11,154 8,832 3,9223 stories. . . . . . . . . . . . . . . . . . . . 26,287 393 23,714 16,375 7,340 8,482 8,342 4,353 2,537 2,1804 to 6 stories. . . . . . . . . . . . . . . . . 5,819 137 5,128 2,248 2,880 2,932 999 719 478 5547 or more stories . . . . . . . . . . . . . . 2,488 135 1,992 488 1,504 1,097 317 372 206 362

Foundation: 3

Full basement . . . . . . . . . . . . . . . . 26,882 350 24,984 22,612 2,372 8,586 10,745 3,793 1,860 1,547Partial building. . . . . . . . . . . . . . . . 9,431 153 8,735 7,840 894 2,378 3,626 1,590 1,140 544Crawlspace. . . . . . . . . . . . . . . . . . 22,292 1,151 19,038 15,646 3,392 732 2,575 10,037 5,694 2,103Concrete slab . . . . . . . . . . . . . . . . 25,514 660 23,012 19,317 3,695 1,129 1,720 12,675 7,488 1,843Other . . . . . . . . . . . . . . . . . . . . . . 629 169 384 259 125 44 82 192 66 75

Equipment:Lacking complete facilities . . . . . . . . 5,345 462 1,695 257 1,438 298 345 536 515 3,188With complete facilities . . . . . . . . . . 119,032 3,384 107,177 74,674 32,502 20,038 24,610 39,186 23,343 8,472Kitchen sink . . . . . . . . . . . . . . . . . 123,262 3,644 108,656 74,889 33,767 20,296 24,923 39,663 23,775 10,962Refrigerator. . . . . . . . . . . . . . . . . . 121,035 3,466 108,673 74,856 33,818 20,311 24,909 39,640 23,814 8,895Cooking stove or range. . . . . . . . . . 121,208 3,475 108,140 74,718 33,422 20,179 24,812 39,506 23,642 9,593Burners only, no stove or range . . . . 189 32 131 60 71 31 19 37 43 26Microwave oven only . . . . . . . . . . . 481 23 397 106 291 104 68 98 126 61Dishwasher. . . . . . . . . . . . . . . . . . 75,239 1,677 68,508 54,060 14,448 11,132 14,491 26,271 16,614 5,055Washing machine . . . . . . . . . . . . . 95,272 1,979 89,287 71,997 17,290 15,039 20,969 34,138 19,141 4,006Clothes dryer . . . . . . . . . . . . . . . . 92,179 1,949 86,169 70,348 15,821 13,976 20,765 32,893 18,534 4,062Disposal in kitchen sink. . . . . . . . . . 58,906 1,217 53,299 38,595 14,704 5,107 12,423 18,584 17,185 4,390Trash compactor . . . . . . . . . . . . . . 4,513 125 4,077 3,343 734 601 659 1,638 1,179 311

Main heating equipment:Warm-air furnace . . . . . . . . . . . . . . 76,665 1,727 68,275 50,459 17,817 8,546 20,331 23,735 15,664 6,662Steam or hot water system . . . . . . . 14,074 176 12,880 7,719 5,161 9,496 1,996 588 800 1,018Electric heat pump . . . . . . . . . . . . . 14,551 605 12,484 9,074 3,411 344 664 9,993 1,483 1,462Built-in electric units . . . . . . . . . . . . 5,607 310 4,699 2,116 2,583 1,065 1,116 918 1,600 598Floor, wall, or pipeless furnace . . . . . 5,916 149 5,102 2,172 2,930 443 399 1,300 2,961 664Room heaters with flue . . . . . . . . . . 1,615 111 1,294 752 542 165 172 646 310 211Room heaters without flue . . . . . . . . 1,627 76 1,327 881 447 18 42 1,222 45 224Portable electric heaters . . . . . . . . . 1,127 73 907 441 467 29 20 642 216 146Stoves . . . . . . . . . . . . . . . . . . . . . 1,171 183 896 742 155 150 143 304 299 93Fireplaces 4 . . . . . . . . . . . . . . . . . 251 47 190 166 24 24 22 69 74 15Other . . . . . . . . . . . . . . . . . . . . . . 505 65 298 167 131 18 31 159 90 142Cooking stoves . . . . . . . . . . . . . . . 148 − 120 50 70 34 − 50 36 28None . . . . . . . . . . . . . . . . . . . . . . 1,120 324 399 194 205 4 20 96 279 397

Air conditioning: central . . . . . . . . . . . 80,511 1,662 72,629 55,849 16,780 6,535 17,401 36,249 12,443 6,220One or more room units . . . . . . . . . 27,124 579 24,863 14,326 10,537 10,132 5,707 5,697 3,326 1,681

Source of water:Public system or private company. . . 108,210 2,638 95,313 62,991 32,322 17,168 20,874 34,871 22,401 10,260Well serving 1 to 5 units . . . . . . . . . 15,372 1,014 13,132 11,607 1,525 3,079 4,008 4,648 1,396 1,227Other . . . . . . . . . . . . . . . . . . . . . . 795 194 427 334 93 90 73 203 61 174

Means of sewage disposal:Public sewer . . . . . . . . . . . . . . . . . 98,013 1,976 86,850 55,496 31,355 16,107 20,053 29,617 21,073 9,187Septic tank, cesspool,chemical toilet . . . . . . . . . . . . . . . 25,976 1,685 21,967 19,403 2,564 4,229 4,888 10,067 2,783 2,323

Other . . . . . . . . . . . . . . . . . . . . . . 388 184 54 32 22 − 13 38 2 151

− Represents or rounds to zero. 1 Includes trailers. Includes width not reported, not shown separately. 2 Excludes mobilehomes; includes basements and finished attics. 3 Limited to single-family units. 4 With and without inserts.

Source: U.S. Census Bureau, Current Housing Reports, Series H150/05, American Housing Survey for the United States. See<http://www.census.gov/hhes/www/housing/ahs/nationaldata.html>.

Construction and Housing 601

U.S. Census Bureau, Statistical Abstract of the United States: 2009

Table 947. Housing Units by Units in Structure and State: 2006

[In percent, except as indicated (126,312 represents 126,312,000). The American Community Survey universe includes the house-hold population and the population living in institutions, college dormitories, and other group quarters. Based on a sample and sub-ject to sampling variability; see Appendix III]

StateTotal

housingunits

(1,000)

Percent of units by units in structure—

1-unitdetached

1-unitattached 2 units

3 or 4units

5 to 9units

10 to 19units

20 ormoreunits

Mobilehomes

Boat,RV,

van,etc.

U.S. . . . 126,312 61.4 5.7 4.0 4.6 4.9 4.5 7.9 6.9 0.1

AL . . . . . . . 2,110 67.6 2.0 2.3 3.0 4.2 2.9 2.9 15.0 (Z)AK . . . . . . . 277 59.6 7.9 5.2 7.7 5.3 3.3 5.0 5.9 0.1AZ . . . . . . . 2,605 62.2 5.2 1.6 3.4 4.4 4.9 6.4 11.5 0.5AR . . . . . . . 1,273 70.3 1.8 3.1 3.1 3.1 3.1 2.1 13.4 (Z)CA . . . . . . . 13,175 58.1 7.0 2.6 5.7 6.3 5.2 10.9 4.1 0.1

CO . . . . . . . 2,095 63.5 6.8 2.0 3.3 4.4 6.2 9.0 4.6 (Z)CT . . . . . . . 1,432 59.4 5.1 8.3 9.3 5.2 3.6 8.1 1.0 (Z)DE . . . . . . . 383 57.1 13.4 1.7 2.9 4.0 5.8 3.9 11.2 (Z)DC . . . . . . . 283 13.8 26.5 3.0 7.4 6.3 11.1 31.9 (Z) 0.1FL. . . . . . . . 8,532 53.8 5.9 2.3 3.9 5.2 6.1 12.4 10.4 0.1

GA . . . . . . . 3,873 66.0 3.4 2.4 3.2 5.6 4.6 4.3 10.4 (Z)HI . . . . . . . . 500 53.7 6.8 2.9 5.2 6.4 4.9 19.9 0.2 (Z)ID . . . . . . . . 616 72.3 2.9 2.8 4.8 2.6 1.9 2.4 10.1 (Z)IL . . . . . . . . 5,200 58.4 5.6 6.2 7.0 6.3 4.2 9.5 2.8 (Z)IN . . . . . . . . 2,757 71.8 3.6 3.0 3.6 4.9 3.6 3.7 5.8 (Z)

IA . . . . . . . . 1,320 73.9 3.3 2.8 3.9 3.7 3.5 4.5 4.4 (Z)KS . . . . . . . 1,207 73.2 4.1 2.6 3.6 3.4 3.4 4.0 5.6 (Z)KY . . . . . . . 1,888 67.3 2.1 3.3 4.0 4.4 3.2 3.0 12.6 (Z)LA . . . . . . . 1,830 65.9 2.7 3.2 3.8 3.3 2.5 3.9 14.4 (Z)ME . . . . . . . 691 68.2 2.2 5.5 5.9 4.5 1.9 2.5 9.3 (Z)

MD . . . . . . . 2,301 51.8 21.1 1.8 2.5 5.6 8.2 7.3 1.7 (Z)MA . . . . . . . 2,709 52.8 4.8 11.0 11.0 6.0 4.0 9.6 0.9 (Z)MI . . . . . . . . 4,514 71.2 4.6 2.9 2.9 4.1 3.6 4.8 6.0 (Z)MN . . . . . . . 2,283 68.3 7.0 2.3 2.1 2.4 3.4 10.6 3.9 (Z)MS . . . . . . . 1,241 69.2 1.4 2.2 3.1 4.2 2.1 1.7 15.7 0.5

MO . . . . . . . 2,623 70.1 3.1 3.8 4.6 4.0 3.3 3.8 7.3 (Z)MT . . . . . . . 432 69.0 2.4 3.6 3.9 3.0 2.2 3.3 12.4 0.1NE . . . . . . . 775 72.9 3.5 2.0 2.8 3.8 4.8 6.1 4.1 (Z)NV . . . . . . . 1,065 58.6 5.1 1.6 6.6 9.3 6.0 5.9 6.7 0.2NH . . . . . . . 590 62.8 4.8 6.1 6.2 5.1 3.2 5.9 5.8 (Z)

NJ. . . . . . . . 3,473 54.0 9.2 9.5 6.6 5.1 5.1 9.5 1.0 (Z)NM . . . . . . . 850 63.6 4.0 1.8 3.9 2.8 2.3 4.2 17.2 0.2NY . . . . . . . 7,908 41.7 4.9 11.3 7.2 5.3 4.1 22.9 2.5 (Z)NC . . . . . . . 4,027 64.9 3.3 2.4 3.2 4.4 4.0 2.9 14.9 (Z)ND . . . . . . . 307 63.4 4.1 2.2 4.9 3.7 5.1 8.8 7.9 (Z)

OH . . . . . . . 5,045 68.2 4.4 5.0 4.6 4.8 4.0 4.9 4.1 (Z)OK . . . . . . . 1,607 72.8 2.2 2.0 2.6 4.0 3.5 3.3 9.4 (Z)OR . . . . . . . 1,587 63.3 4.1 2.9 4.4 4.8 3.7 7.3 9.0 0.4PA . . . . . . . 5,454 56.6 18.4 5.1 4.5 3.3 2.5 5.1 4.5 (Z)RI . . . . . . . . 450 55.5 3.5 11.8 13.0 4.4 3.7 6.8 1.2 (Z)

SC . . . . . . . 1,976 62.0 2.3 2.1 3.1 5.0 3.0 3.2 19.1 (Z)SD . . . . . . . 352 68.6 2.5 2.4 3.0 4.2 3.3 6.6 9.5 0.1TN . . . . . . . 2,681 68.0 2.9 3.2 2.9 4.5 4.0 3.6 10.7 (Z)TX . . . . . . . 9,225 65.0 2.6 2.2 3.4 5.1 6.5 7.0 8.1 0.2UT . . . . . . . 901 68.3 5.1 3.5 4.8 3.5 4.4 5.9 4.4 0.1

VT . . . . . . . 310 66.9 3.5 5.8 6.5 5.3 1.9 3.1 6.9 (Z)VA . . . . . . . 3,231 62.9 10.1 1.8 2.6 4.9 6.0 5.8 5.9 (Z)WA . . . . . . . 2,700 62.7 3.4 2.8 3.8 4.9 5.9 8.7 7.7 0.2WV . . . . . . . 878 71.3 1.7 2.4 3.2 2.6 1.8 2.1 14.8 (Z)WI. . . . . . . . 2,533 66.5 4.2 7.4 3.6 4.8 3.2 6.3 4.0 (Z)WY . . . . . . . 239 66.2 3.4 3.1 5.0 3.5 1.6 2.8 14.2 0.2

Z Less than .05 percent.

Source: U.S. Census Bureau, 2006 American Community Survey Table B25024. Units in Structure; using AmericanFactFinder®. See <http://factfinder.census.gov/>; (accessed March 2008).

602 Construction and Housing

U.S. Census Bureau, Statistical Abstract of the United States: 2009

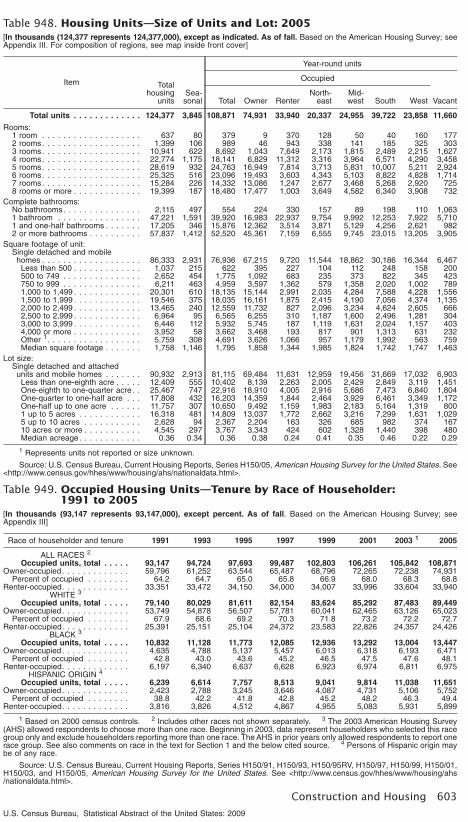
Table 948. Housing Units—Size of Units and Lot: 2005[In thousands (124,377 represents 124,377,000), except as indicated. As of fall. Based on the American Housing Survey; seeAppendix III. For composition of regions, see map inside front cover]

Item Totalhousing

unitsSea-sonal

Year-round units

Occupied

VacantTotal Owner RenterNorth-

eastMid-west South West

Total units . . . . . . . . . . . . . 124,377 3,845 108,871 74,931 33,940 20,337 24,955 39,722 23,858 11,660

Rooms:1 room . . . . . . . . . . . . . . . . . . . 637 80 379 9 370 128 50 40 160 1772 rooms. . . . . . . . . . . . . . . . . . . 1,399 106 989 46 943 338 141 185 325 3033 rooms. . . . . . . . . . . . . . . . . . . 10,941 622 8,692 1,043 7,649 2,173 1,815 2,489 2,215 1,6274 rooms. . . . . . . . . . . . . . . . . . . 22,774 1,175 18,141 6,829 11,312 3,316 3,964 6,571 4,290 3,4585 rooms. . . . . . . . . . . . . . . . . . . 28,619 932 24,763 16,949 7,814 3,713 5,831 10,007 5,211 2,9246 rooms. . . . . . . . . . . . . . . . . . . 25,325 516 23,096 19,493 3,603 4,343 5,103 8,822 4,828 1,7147 rooms. . . . . . . . . . . . . . . . . . . 15,284 226 14,332 13,086 1,247 2,677 3,468 5,268 2,920 7258 rooms or more . . . . . . . . . . . . . 19,399 187 18,480 17,477 1,003 3,649 4,582 6,340 3,908 732

Complete bathrooms:No bathrooms. . . . . . . . . . . . . . . 2,115 497 554 224 330 157 89 198 110 1,0631 bathroom . . . . . . . . . . . . . . . . 47,221 1,591 39,920 16,983 22,937 9,754 9,992 12,253 7,922 5,7101 and one-half bathrooms . . . . . . . 17,205 346 15,876 12,362 3,514 3,871 5,129 4,256 2,621 9822 or more bathrooms . . . . . . . . . . 57,837 1,412 52,520 45,361 7,159 6,555 9,745 23,015 13,205 3,905

Square footage of unit:Single detached and mobilehomes . . . . . . . . . . . . . . . . . . . 86,333 2,931 76,936 67,215 9,720 11,544 18,862 30,186 16,344 6,467Less than 500 . . . . . . . . . . . . . 1,037 215 622 395 227 104 112 248 158 200500 to 749 . . . . . . . . . . . . . . . 2,652 454 1,775 1,092 683 235 373 822 345 423750 to 999 . . . . . . . . . . . . . . . 6,211 463 4,959 3,597 1,362 579 1,358 2,020 1,002 7891,000 to 1,499 . . . . . . . . . . . . . 20,301 610 18,135 15,144 2,991 2,035 4,284 7,588 4,228 1,5561,500 to 1,999 . . . . . . . . . . . . . 19,546 375 18,035 16,161 1,875 2,415 4,190 7,056 4,374 1,1352,000 to 2,499 . . . . . . . . . . . . . 13,465 240 12,559 11,732 827 2,096 3,234 4,624 2,605 6662,500 to 2,999 . . . . . . . . . . . . . 6,964 95 6,565 6,255 310 1,187 1,600 2,496 1,281 3043,000 to 3,999 . . . . . . . . . . . . . 6,446 112 5,932 5,745 187 1,119 1,631 2,024 1,157 4034,000 or more . . . . . . . . . . . . . 3,952 58 3,662 3,468 193 817 901 1,313 631 232Other 1. . . . . . . . . . . . . . . . . . 5,759 308 4,691 3,626 1,066 957 1,179 1,992 563 759Median square footage . . . . . . . 1,758 1,146 1,795 1,858 1,344 1,985 1,824 1,742 1,747 1,463

Lot size:Single detached and attachedunits and mobile homes . . . . . . . 90,932 2,913 81,115 69,484 11,631 12,959 19,456 31,669 17,032 6,903Less than one-eighth acre . . . . . 12,409 555 10,402 8,139 2,263 2,005 2,429 2,849 3,119 1,451One-eighth to one-quarter acre. . 25,467 747 22,916 18,910 4,005 2,916 5,686 7,473 6,840 1,804One-quarter to one-half acre . . . 17,808 432 16,203 14,359 1,844 2,464 3,929 6,461 3,349 1,172One-half up to one acre . . . . . . 11,757 307 10,650 9,492 1,159 1,983 2,183 5,164 1,319 8001 up to 5 acres . . . . . . . . . . . . 16,318 481 14,809 13,037 1,772 2,662 3,216 7,299 1,631 1,0295 up to 10 acres . . . . . . . . . . . 2,628 94 2,367 2,204 163 326 685 982 374 16710 acres or more . . . . . . . . . . . 4,545 297 3,767 3,343 424 602 1,328 1,440 398 480Median acreage. . . . . . . . . . . . 0.36 0.34 0.36 0.38 0.24 0.41 0.35 0.46 0.22 0.29

1 Represents units not reported or size unknown.

Source: U.S. Census Bureau, Current Housing Reports, Series H150/05, American Housing Survey for the United States. See<http://www.census.gov/hhes/www/housing/ahs/nationaldata.html>.

Table 949. Occupied Housing Units—Tenure by Race of Householder:1991 to 2005

[In thousands (93,147 represents 93,147,000), except percent. As of fall. Based on the American Housing Survey; seeAppendix III]

Race of householder and tenure 1991 1993 1995 1997 1999 2001 2003 1 2005

ALL RACES 2

Occupied units, total . . . . . 93,147 94,724 97,693 99,487 102,803 106,261 105,842 108,871Owner-occupied. . . . . . . . . . . . . 59,796 61,252 63,544 65,487 68,796 72,265 72,238 74,931

Percent of occupied . . . . . . . . 64.2 64.7 65.0 65.8 66.9 68.0 68.3 68.8Renter-occupied. . . . . . . . . . . . . 33,351 33,472 34,150 34,000 34,007 33,996 33,604 33,940

WHITE 3

Occupied units, total . . . . . 79,140 80,029 81,611 82,154 83,624 85,292 87,483 89,449Owner-occupied. . . . . . . . . . . . . 53,749 54,878 56,507 57,781 60,041 62,465 63,126 65,023

Percent of occupied . . . . . . . . 67.9 68.6 69.2 70.3 71.8 73.2 72.2 72.7Renter-occupied. . . . . . . . . . . . . 25,391 25,151 25,104 24,372 23,583 22,826 24,357 24,426

BLACK 3

Occupied units, total . . . . . 10,832 11,128 11,773 12,085 12,936 13,292 13,004 13,447Owner-occupied. . . . . . . . . . . . . 4,635 4,788 5,137 5,457 6,013 6,318 6,193 6,471

Percent of occupied . . . . . . . . 42.8 43.0 43.6 45.2 46.5 47.5 47.6 48.1Renter-occupied. . . . . . . . . . . . . 6,197 6,340 6,637 6,628 6,923 6,974 6,811 6,975

HISPANIC ORIGIN 4

Occupied units, total . . . . . 6,239 6,614 7,757 8,513 9,041 9,814 11,038 11,651Owner-occupied. . . . . . . . . . . . . 2,423 2,788 3,245 3,646 4,087 4,731 5,106 5,752

Percent of occupied . . . . . . . . 38.8 42.2 41.8 42.8 45.2 48.2 46.3 49.4Renter-occupied. . . . . . . . . . . . . 3,816 3,826 4,512 4,867 4,955 5,083 5,931 5,899

1 Based on 2000 census controls. 2 Includes other races not shown separately. 3 The 2003 American Housing Survey(AHS) allowed respondents to choose more than one race. Beginning in 2003, data represent householders who selected this racegroup only and exclude householders reporting more than one race. The AHS in prior years only allowed respondents to report onerace group. See also comments on race in the text for Section 1 and the below cited source. 4 Persons of Hispanic origin maybe of any race.

Source: U.S. Census Bureau, Current Housing Reports, Series H150/91, H150/93, H150/95RV, H150/97, H150/99, H150/01,H150/03, and H150/05, American Housing Survey for the United States. See <http://www.census.gov/hhes/www/housing/ahs/nationaldata.html>.

Construction and Housing 603

U.S. Census Bureau, Statistical Abstract of the United States: 2009

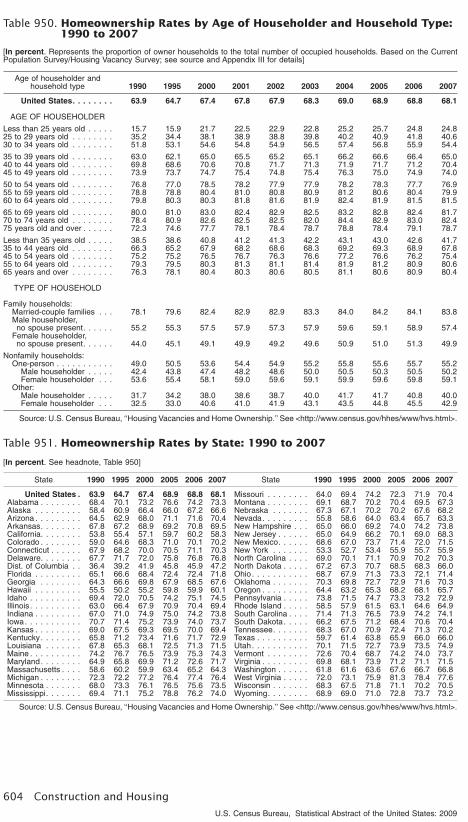
Table 950. Homeownership Rates by Age of Householder and Household Type:1990 to 2007

[In percent. Represents the proportion of owner households to the total number of occupied households. Based on the CurrentPopulation Survey/Housing Vacancy Survey; see source and Appendix III for details]

Age of householder andhousehold type 1990 1995 2000 2001 2002 2003 2004 2005 2006 2007

United States. . . . . . . . 63.9 64.7 67.4 67.8 67.9 68.3 69.0 68.9 68.8 68.1

AGE OF HOUSEHOLDER

Less than 25 years old . . . . . 15.7 15.9 21.7 22.5 22.9 22.8 25.2 25.7 24.8 24.825 to 29 years old . . . . . . . . 35.2 34.4 38.1 38.9 38.8 39.8 40.2 40.9 41.8 40.630 to 34 years old . . . . . . . . 51.8 53.1 54.6 54.8 54.9 56.5 57.4 56.8 55.9 54.4

35 to 39 years old . . . . . . . . 63.0 62.1 65.0 65.5 65.2 65.1 66.2 66.6 66.4 65.040 to 44 years old . . . . . . . . 69.8 68.6 70.6 70.8 71.7 71.3 71.9 71.7 71.2 70.445 to 49 years old . . . . . . . . 73.9 73.7 74.7 75.4 74.8 75.4 76.3 75.0 74.9 74.0

50 to 54 years old . . . . . . . . 76.8 77.0 78.5 78.2 77.9 77.9 78.2 78.3 77.7 76.955 to 59 years old . . . . . . . . 78.8 78.8 80.4 81.0 80.8 80.9 81.2 80.6 80.4 79.960 to 64 years old . . . . . . . . 79.8 80.3 80.3 81.8 81.6 81.9 82.4 81.9 81.5 81.5

65 to 69 years old . . . . . . . . 80.0 81.0 83.0 82.4 82.9 82.5 83.2 82.8 82.4 81.770 to 74 years old . . . . . . . . 78.4 80.9 82.6 82.5 82.5 82.0 84.4 82.9 83.0 82.475 years old and over . . . . . . 72.3 74.6 77.7 78.1 78.4 78.7 78.8 78.4 79.1 78.7

Less than 35 years old . . . . . 38.5 38.6 40.8 41.2 41.3 42.2 43.1 43.0 42.6 41.735 to 44 years old . . . . . . . . 66.3 65.2 67.9 68.2 68.6 68.3 69.2 69.3 68.9 67.845 to 54 years old . . . . . . . . 75.2 75.2 76.5 76.7 76.3 76.6 77.2 76.6 76.2 75.455 to 64 years old . . . . . . . . 79.3 79.5 80.3 81.3 81.1 81.4 81.9 81.2 80.9 80.665 years and over . . . . . . . . 76.3 78.1 80.4 80.3 80.6 80.5 81.1 80.6 80.9 80.4

TYPE OF HOUSEHOLD

Family households:Married-couple families . . . 78.1 79.6 82.4 82.9 82.9 83.3 84.0 84.2 84.1 83.8Male householder,no spouse present. . . . . . 55.2 55.3 57.5 57.9 57.3 57.9 59.6 59.1 58.9 57.4

Female householder,no spouse present. . . . . . 44.0 45.1 49.1 49.9 49.2 49.6 50.9 51.0 51.3 49.9

Nonfamily households:One-person . . . . . . . . . . . 49.0 50.5 53.6 54.4 54.9 55.2 55.8 55.6 55.7 55.2

Male householder . . . . . 42.4 43.8 47.4 48.2 48.6 50.0 50.5 50.3 50.5 50.2Female householder . . . 53.6 55.4 58.1 59.0 59.6 59.1 59.9 59.6 59.8 59.1

Other:Male householder . . . . . 31.7 34.2 38.0 38.6 38.7 40.0 41.7 41.7 40.8 40.0Female householder . . . 32.5 33.0 40.6 41.0 41.9 43.1 43.5 44.8 45.5 42.9

Source: U.S. Census Bureau, ‘‘Housing Vacancies and Home Ownership.’’ See <http://www.census.gov/hhes/www/hvs.html>.

Table 951. Homeownership Rates by State: 1990 to 2007

[In percent. See headnote, Table 950]

State 1990 1995 2000 2005 2006 2007

United States . 63.9 64.7 67.4 68.9 68.8 68.1Alabama . . . . . . . . 68.4 70.1 73.2 76.6 74.2 73.3Alaska . . . . . . . . . 58.4 60.9 66.4 66.0 67.2 66.6Arizona . . . . . . . . . 64.5 62.9 68.0 71.1 71.6 70.4Arkansas. . . . . . . . 67.8 67.2 68.9 69.2 70.8 69.5California. . . . . . . . 53.8 55.4 57.1 59.7 60.2 58.3Colorado . . . . . . . . 59.0 64.6 68.3 71.0 70.1 70.2Connecticut . . . . . . 67.9 68.2 70.0 70.5 71.1 70.3Delaware. . . . . . . . 67.7 71.7 72.0 75.8 76.8 76.8Dist. of Columbia . . 36.4 39.2 41.9 45.8 45.9 47.2Florida . . . . . . . . . 65.1 66.6 68.4 72.4 72.4 71.8Georgia . . . . . . . . 64.3 66.6 69.8 67.9 68.5 67.6Hawaii . . . . . . . . . 55.5 50.2 55.2 59.8 59.9 60.1Idaho . . . . . . . . . . 69.4 72.0 70.5 74.2 75.1 74.5Illinois . . . . . . . . . . 63.0 66.4 67.9 70.9 70.4 69.4Indiana . . . . . . . . . 67.0 71.0 74.9 75.0 74.2 73.8Iowa. . . . . . . . . . . 70.7 71.4 75.2 73.9 74.0 73.7Kansas . . . . . . . . . 69.0 67.5 69.3 69.5 70.0 69.4Kentucky. . . . . . . . 65.8 71.2 73.4 71.6 71.7 72.9Louisiana . . . . . . . 67.8 65.3 68.1 72.5 71.3 71.5Maine . . . . . . . . . . 74.2 76.7 76.5 73.9 75.3 74.3Maryland. . . . . . . . 64.9 65.8 69.9 71.2 72.6 71.7Massachusetts . . . . 58.6 60.2 59.9 63.4 65.2 64.3Michigan . . . . . . . . 72.3 72.2 77.2 76.4 77.4 76.4Minnesota . . . . . . . 68.0 73.3 76.1 76.5 75.6 73.5Mississippi. . . . . . . 69.4 71.1 75.2 78.8 76.2 74.0

State 1990 1995 2000 2005 2006 2007

Missouri . . . . . . . . 64.0 69.4 74.2 72.3 71.9 70.4Montana . . . . . . . . 69.1 68.7 70.2 70.4 69.5 67.3Nebraska . . . . . . . 67.3 67.1 70.2 70.2 67.6 68.2Nevada. . . . . . . . . 55.8 58.6 64.0 63.4 65.7 63.3New Hampshire . . . 65.0 66.0 69.2 74.0 74.2 73.8New Jersey . . . . . . 65.0 64.9 66.2 70.1 69.0 68.3New Mexico. . . . . . 68.6 67.0 73.7 71.4 72.0 71.5New York . . . . . . . 53.3 52.7 53.4 55.9 55.7 55.9North Carolina . . . . 69.0 70.1 71.1 70.9 70.2 70.3North Dakota . . . . . 67.2 67.3 70.7 68.5 68.3 66.0Ohio. . . . . . . . . . . 68.7 67.9 71.3 73.3 72.1 71.4Oklahoma . . . . . . . 70.3 69.8 72.7 72.9 71.6 70.3Oregon . . . . . . . . . 64.4 63.2 65.3 68.2 68.1 65.7Pennsylvania . . . . . 73.8 71.5 74.7 73.3 73.2 72.9Rhode Island . . . . . 58.5 57.9 61.5 63.1 64.6 64.9South Carolina . . . . 71.4 71.3 76.5 73.9 74.2 74.1South Dakota. . . . . 66.2 67.5 71.2 68.4 70.6 70.4Tennessee. . . . . . . 68.3 67.0 70.9 72.4 71.3 70.2Texas . . . . . . . . . . 59.7 61.4 63.8 65.9 66.0 66.0Utah. . . . . . . . . . . 70.1 71.5 72.7 73.9 73.5 74.9Vermont . . . . . . . . 72.6 70.4 68.7 74.2 74.0 73.7Virginia . . . . . . . . . 69.8 68.1 73.9 71.2 71.1 71.5Washington . . . . . . 61.8 61.6 63.6 67.6 66.7 66.8West Virginia . . . . . 72.0 73.1 75.9 81.3 78.4 77.6Wisconsin . . . . . . . 68.3 67.5 71.8 71.1 70.2 70.5Wyoming. . . . . . . . 68.9 69.0 71.0 72.8 73.7 73.2

Source: U.S. Census Bureau, ‘‘Housing Vacancies and Home Ownership.’’ See <http://www.census.gov/hhes/www/hvs.html>.

604 Construction and Housing

U.S. Census Bureau, Statistical Abstract of the United States: 2009

Table 952. Occupied Housing Units—Costs by Region: 2005

[74,931 represents 74,931,000. As of fall. See headnote, Table 953, for an explanation of housing costs. Based on the Ameri-can Housing Survey; see Appendix III. For composition of regions, see map inside front cover]

CategoryNumber (1,000) Percent distribution

Totalunits

North-east

Mid-west South West

Totalunits

North-east

Mid-west South West

OWNER-OCCUPIED UNITS

Total . . . . . . . . . . . . . . . . . 74,931 13,217 18,360 28,003 15,350 100.0 100.0 100.0 100.0 100.0Monthly housing costs:

Less than $300 . . . . . . . . . . . . 12,426 1,027 2,652 6,942 1,804 16.6 7.8 14.4 24.8 11.8$300 to $399 . . . . . . . . . . . . . 6,763 997 2,008 2,538 1,220 9.0 7.5 10.9 9.1 7.9$400 to $499 . . . . . . . . . . . . . 5,096 977 1,456 1,844 819 6.8 7.4 7.9 6.6 5.3$500 to $599 . . . . . . . . . . . . . 4,704 1,059 1,235 1,756 654 6.3 8.0 6.7 6.3 4.3$600 to $699 . . . . . . . . . . . . . 4,192 847 1,118 1,636 591 5.6 6.4 6.1 5.8 3.9$700 to $799 . . . . . . . . . . . . . 3,933 763 1,105 1,436 629 5.2 5.8 6.0 5.1 4.1$800 to $999 . . . . . . . . . . . . . 7,632 1,336 2,089 2,885 1,322 10.2 10.1 11.4 10.3 8.6$1,000 to $1,249 . . . . . . . . . . . 8,031 1,249 2,272 2,821 1,689 10.7 9.4 12.4 10.1 11.0$1,250 to $1,499 . . . . . . . . . . . 6,184 1,213 1,595 1,884 1,492 8.3 9.2 8.7 6.7 9.7$1,500 or more . . . . . . . . . . . . 15,971 3,749 2,830 4,261 5,130 21.3 28.4 15.4 15.2 33.4Median (dol.) 1 . . . . . . . . . . . . 809 941 764 656 1,094 (X) (X) (X) (X) (X)

RENTER-OCCUPIED UNITS

Total . . . . . . . . . . . . . . . . . 33,940 7,120 6,595 11,719 8,507 100.0 100.0 100.0 100.0 100.0Monthly housing costs:

Less than $300 . . . . . . . . . . . . 2,922 736 637 1,036 514 8.6 10.3 9.7 8.8 6.0$300 to $399 . . . . . . . . . . . . . 1,859 316 493 765 285 5.5 4.4 7.5 6.5 3.4$400 to $499 . . . . . . . . . . . . . 3,353 515 890 1,380 568 9.9 7.2 13.5 11.8 6.7$500 to $599 . . . . . . . . . . . . . 3,897 625 927 1,648 698 11.5 8.8 14.1 14.1 8.2$600 to $699 . . . . . . . . . . . . . 4,099 723 952 1,488 936 12.1 10.2 14.4 12.7 11.0$700 to $799 . . . . . . . . . . . . . 3,694 703 721 1,317 953 10.9 9.9 10.9 11.2 11.2$800 to $999 . . . . . . . . . . . . . 5,273 1,274 817 1,643 1,540 15.5 17.9 12.4 14.0 18.1$1,000 to $1,249 . . . . . . . . . . . 3,178 816 360 847 1,154 9.4 11.5 5.5 7.2 13.6$1,250 to $1,499 . . . . . . . . . . . 1,644 421 146 343 733 4.8 5.9 2.2 2.9 8.6$1,500 or more . . . . . . . . . . . . 1,886 576 201 350 760 5.6 8.1 3.0 3.0 8.9No cash rent . . . . . . . . . . . . . . 2,134 415 449 904 366 6.3 5.8 6.8 7.7 4.3Median (dol.) 1 . . . . . . . . . . . . 694 762 613 639 915 (X) (X) (X) (X) (X)

X Not applicable. 1 For explanation of median, see Guide to Tabular Presentation.

Source: U.S. Census Bureau, Current Housing Reports, Series H150/05, American Housing Survey for the United States. See<http://www.census.gov/hhes/www/housing/ahs/nationaldata.html>.

Table 953. Occupied Housing Units—Financial Summary by SelectedCharacteristics of the Householder: 2005

[In thousands of units (108,871 represents 108,871,000), except as indicated. As of fall. Housing costs include real estatetaxes, property insurance, utilities, fuel, water, garbage collection, homeowner association fees, mobile home fees, and mortgage.Based on the American Housing Survey; see Appendix III]

CharacteristicTotal

occu-piedunits

Tenure Black 1 Hispanicorigin 2 Elderly 3

Householdsbelow poverty

level

Owner Renter Owner Renter Owner Renter Owner Renter Owner Renter

Total units 4. . . . . . . . . . 108,871 74,931 33,940 6,471 6,975 5,752 5,899 17,818 4,379 6,450 8,674

Monthly housing costs:Less than $300 . . . . . . . . . 15,348 12,426 2,922 1,272 879 861 343 5,695 818 2,412 1,844$300 to $399 . . . . . . . . . . . 8,622 6,763 1,859 613 426 399 225 3,008 366 850 736$400 to $499 . . . . . . . . . . . 8,449 5,096 3,353 466 760 292 509 1,963 427 614 1,037$500 to $599 . . . . . . . . . . . 8,601 4,704 3,897 474 880 284 735 1,562 386 480 1,052$600 to $699 . . . . . . . . . . . 8,291 4,192 4,099 402 768 306 797 1,069 400 367 864$700 to $799 . . . . . . . . . . . 7,627 3,933 3,694 404 899 309 687 735 340 282 708$800 to $999 . . . . . . . . . . . 12,905 7,632 5,273 733 1,067 674 1,115 1,125 498 414 802$1,000 or more. . . . . . . . . . 36,893 30,186 6,708 2,107 916 2,627 1,271 2,661 666 1,032 828Median amount (dol.) 5 . . . . 753 809 694 702 646 926 734 409 588 395 530

Monthly housing costs aspercent of income: 6

Less than 5 percent . . . . . . 4,304 4,051 253 300 42 217 35 732 10 20 125 to 9 percent . . . . . . . . . . 11,687 10,761 925 790 178 626 87 2,858 57 69 4810 to 14 percent . . . . . . . . . 13,771 11,412 2,359 873 373 625 338 2,989 140 172 6815 to 19 percent . . . . . . . . . 14,960 11,499 3,462 898 620 716 507 2,294 172 243 14020 to 24 percent . . . . . . . . . 12,605 8,947 3,658 746 725 627 565 1,693 297 269 21525 to 29 percent . . . . . . . . . 10,394 6,788 3,607 586 678 570 692 1,265 459 267 45330 to 34 percent . . . . . . . . . 7,652 4,658 2,994 367 613 484 659 922 355 238 44935 to 39 percent . . . . . . . . . 5,561 3,344 2,217 334 495 376 368 773 266 355 31240 percent or more . . . . . . . 23,967 12,628 11,339 1,469 2,617 1,463 2,288 4,182 2,062 4,041 5,278Median amount (percent) 5 . . 23 20 32 22 35 25 34 20 44 75 77

1 For persons who selected this race group only. See footnote 3, Table 949. 2 Persons of Hispanic origin may be of anyrace. 3 Householders 65 years old and over. 4 Includes units with no cash rent not shown separately. 5 For explanation ofmedian, see Guide to Tabular Presentation. 6 Money income before taxes.

Source: U.S. Census Bureau, Current Housing Reports, Series H150/05, American Housing Survey for the United States. See<http://www.census.gov/hhes/www/housing/ahs/nationaldata.html>.

Construction and Housing 605

U.S. Census Bureau, Statistical Abstract of the United States: 2009

Table 954. Owner-Occupied Housing Units—Value and Costs by State: 2006

[In percent, except as indicated (75,086 represents 75,086,000). The American Community Survey universe includes the house-hold population and the population living in institutions, college dormitories, and other group quarters. Based on a sample and sub-ject to sampling variability; see Appendix III. For definition of median, see Guide to Tabular Presentation]

State

Total(1,000)

Percent of unitswith value of—

Medianvalue(dol.)

Medianselectedmonthly

ownercosts 1

(dol.)

Selected monthly owner costsas a percent of household income

in the past 12 months 1

$99,999or less

$100,000to

$199,999$200,000

or more

Less than15

percent

15.0 to24.9

percent

25.0 to29.9

percent

30percentor more

U.S. . . 75,086 24.1 29.4 46.5 185,200 1,040 16.8 33.3 12.6 36.9

AL . . . . . . . 1,289 47.0 33.4 19.7 107,000 685 24.2 35.6 10.8 28.8AK. . . . . . . 148 14.3 30.9 54.8 213,200 1,233 19.1 33.5 13.1 34.2AZ. . . . . . . 1,523 15.1 23.4 61.5 236,500 1,062 16.8 32.0 13.2 37.4AR. . . . . . . 753 53.4 32.0 14.6 93,900 611 26.2 36.4 10.1 26.9CA. . . . . . . 7,102 4.9 4.7 90.3 535,700 1,737 11.0 24.7 12.0 51.8

CO . . . . . . 1,269 8.6 28.7 62.7 232,900 1,317 14.5 33.1 13.6 38.5CT. . . . . . . 921 3.4 20.4 76.3 298,900 1,527 14.3 32.1 13.8 39.6DE. . . . . . . 238 13.0 27.7 59.3 227,100 1,003 19.8 36.5 12.3 31.3DC . . . . . . 115 1.9 8.1 90.1 437,700 1,558 17.5 32.0 11.8 37.8FL . . . . . . . 4,994 15.0 26.2 58.8 230,600 1,045 13.5 28.6 12.4 44.9

GA . . . . . . 2,285 24.9 41.3 33.7 156,800 1,033 18.9 34.5 12.4 33.6HI . . . . . . . 258 2.4 5.8 91.8 529,700 1,465 13.9 26.9 13.1 45.7ID . . . . . . . 391 22.1 41.8 36.1 163,900 870 17.1 36.1 12.7 33.9IL . . . . . . . 3,301 21.1 28.9 50.1 200,200 1,184 15.1 32.7 13.2 38.7IN . . . . . . . 1,756 37.7 44.7 17.6 120,700 874 21.3 39.8 11.9 26.7

IA . . . . . . . 886 43.1 40.1 16.7 112,600 780 21.5 40.7 12.6 25.1KS. . . . . . . 761 43.6 36.6 19.8 114,400 827 21.0 40.8 12.2 25.8KY. . . . . . . 1,167 44.5 37.2 18.3 111,000 692 23.2 38.1 10.7 27.7LA . . . . . . . 1,072 43.8 35.7 20.5 114,700 648 25.8 34.6 10.4 28.7ME . . . . . . 399 24.5 35.3 40.1 170,500 852 18.0 36.3 12.2 33.4

MD . . . . . . 1,450 7.6 15.3 77.1 334,700 1,446 17.1 34.2 13.3 35.0MA . . . . . . 1,588 2.3 10.8 86.9 370,400 1,546 13.7 30.5 13.7 41.8MI . . . . . . . 2,908 24.4 44.3 31.2 153,300 1,010 16.2 34.9 13.2 35.2MN . . . . . . 1,558 14.2 32.6 53.2 208,200 1,139 16.3 35.6 14.0 33.9MS . . . . . . 760 56.1 30.1 13.9 88,600 615 21.1 34.7 10.5 33.1

MO . . . . . . 1,629 34.6 40.7 24.7 131,900 816 21.2 37.5 12.3 28.7MT . . . . . . 260 28.8 37.2 34.0 155,500 746 18.7 34.1 12.3 34.7NE. . . . . . . 476 38.4 43.7 17.9 119,200 862 19.9 39.9 12.4 27.5NV. . . . . . . 581 7.4 12.8 79.8 315,200 1,377 12.1 28.6 13.4 45.4NH . . . . . . 364 8.4 21.4 70.2 253,200 1,369 12.7 33.8 14.3 39.0

NJ . . . . . . . 2,110 4.4 12.9 82.7 366,600 1,695 12.9 28.9 13.3 44.7NM . . . . . . 506 34.3 34.5 31.3 141,200 736 20.7 36.4 11.5 31.0NY. . . . . . . 3,941 20.3 19.2 60.5 303,400 1,257 16.4 29.9 12.5 40.9NC . . . . . . 2,351 32.1 40.3 27.6 137,200 866 19.8 36.3 12.2 31.3ND . . . . . . 182 50.2 37.4 12.4 99,700 652 24.2 39.7 12.8 23.0

OH . . . . . . 3,150 30.2 46.5 23.3 135,200 956 17.5 37.3 13.0 31.8OK . . . . . . 950 53.8 33.4 12.7 94,500 673 24.6 36.9 11.1 26.8OR . . . . . . 939 10.7 26.5 62.8 236,600 1,121 14.7 32.1 13.8 39.1PA. . . . . . . 3,475 32.4 34.5 33.1 145,200 892 18.6 35.8 12.7 32.6RI . . . . . . . 255 2.2 13.3 84.5 295,700 1,391 13.3 29.6 13.3 43.5

SC. . . . . . . 1,165 39.6 35.9 24.5 122,400 772 21.0 35.4 11.2 31.8SD. . . . . . . 216 43.2 39.2 17.6 112,600 708 19.6 41.3 12.0 26.8TN. . . . . . . 1,660 38.3 39.4 22.3 123,100 773 19.4 36.7 11.8 31.5TX. . . . . . . 5,291 43.0 37.5 19.5 114,000 956 17.4 36.2 12.7 33.3UT. . . . . . . 586 10.3 44.5 45.2 188,500 1,093 16.1 36.6 13.9 33.1

VT. . . . . . . 182 14.9 37.6 47.5 193,000 1,055 13.6 35.0 14.7 36.5VA. . . . . . . 2,030 16.4 24.4 59.3 244,200 1,175 17.8 35.0 12.5 34.2WA . . . . . . 1,620 9.4 22.6 68.0 267,600 1,277 13.7 32.0 14.2 39.8WV . . . . . . 555 56.8 28.3 15.0 89,700 462 28.3 36.5 10.3 24.5WI . . . . . . . 1,571 19.3 45.9 34.8 163,500 1,052 14.2 37.0 15.0 33.4WY . . . . . . 144 26.7 44.1 29.2 148,900 749 22.4 38.0 12.5 26.9

1 For homes with a mortgage. Includes all forms of debt where the property is pledged as security for repayment of the debt,including deeds of trust, land contracts, home equity loans. Also includes cost of property insurance, utilities, real estate taxes, etc.

Source: U.S. Census Bureau, 2006 American Community Survey Tables B25075. Value for Owner-Occupied Housing Units;B25077. Median Value for Owner-Occupied Housing Units; B25088. Median Selected Monthly Owner Costs by Mortgage Status;B25091. Mortgage Status by Selected Monthly Owner Cost as a Percentage of Household Income; using American FactFinder®.See <http://factfinder.census.gov/>; (accessed May 17, 2008).

606 Construction and Housing

U.S. Census Bureau, Statistical Abstract of the United States: 2009

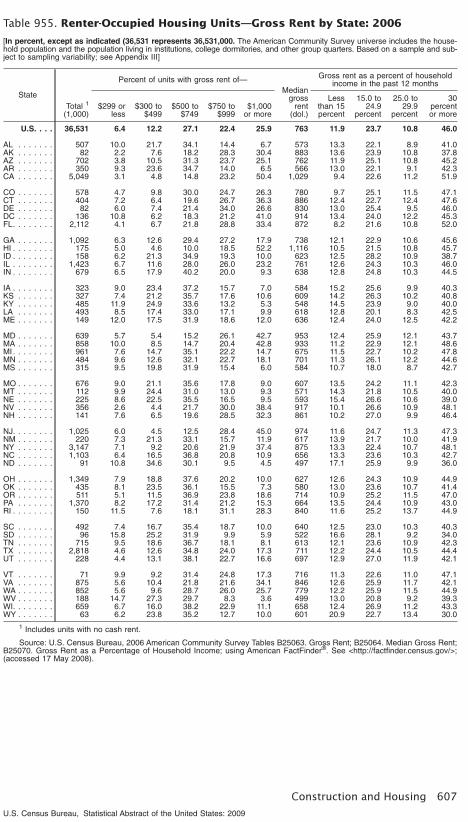
Table 955. Renter-Occupied Housing Units—Gross Rent by State: 2006

[In percent, except as indicated (36,531 represents 36,531,000. The American Community Survey universe includes the house-hold population and the population living in institutions, college dormitories, and other group quarters. Based on a sample and sub-ject to sampling variability; see Appendix III]

StateTotal 1

(1,000)

Percent of units with gross rent of—Median

grossrent

(dol.)

Gross rent as a percent of householdincome in the past 12 months

$299 orless

$300 to$499

$500 to$749

$750 to$999

$1,000or more

Lessthan 15percent

15.0 to24.9

percent

25.0 to29.9

percent

30percentor more

U.S. . . . 36,531 6.4 12.2 27.1 22.4 25.9 763 11.9 23.7 10.8 46.0

AL . . . . . . . 507 10.0 21.7 34.1 14.4 6.7 573 13.3 22.1 8.9 41.0AK . . . . . . . 82 2.2 7.6 18.2 28.3 30.4 883 13.6 23.9 10.8 37.8AZ . . . . . . . 702 3.8 10.5 31.3 23.7 25.1 762 11.9 25.1 10.8 45.2AR . . . . . . . 350 9.3 23.6 34.7 14.0 6.5 566 13.0 22.1 9.1 42.3CA . . . . . . . 5,049 3.1 4.8 14.8 23.2 50.4 1,029 9.4 22.6 11.2 51.9

CO . . . . . . . 578 4.7 9.8 30.0 24.7 26.3 780 9.7 25.1 11.5 47.1CT . . . . . . . 404 7.2 6.4 19.6 26.7 36.3 886 12.4 22.7 12.4 47.6DE . . . . . . . 82 6.0 7.4 21.4 34.0 26.6 830 13.0 25.4 9.5 46.0DC . . . . . . . 136 10.8 6.2 18.3 21.2 41.0 914 13.4 24.0 12.2 45.3FL. . . . . . . . 2,112 4.1 6.7 21.8 28.8 33.4 872 8.2 21.6 10.8 52.0

GA . . . . . . . 1,092 6.3 12.6 29.4 27.2 17.9 738 12.1 22.9 10.6 45.6HI . . . . . . . . 175 5.0 4.6 10.0 18.5 52.2 1,116 10.5 21.5 10.8 45.7ID . . . . . . . . 158 6.2 21.3 34.9 19.3 10.0 623 12.5 28.2 10.9 38.7IL . . . . . . . . 1,423 6.7 11.6 28.0 26.0 23.2 761 12.6 24.3 10.3 46.0IN . . . . . . . . 679 6.5 17.9 40.2 20.0 9.3 638 12.8 24.8 10.3 44.5

IA . . . . . . . . 323 9.0 23.4 37.2 15.7 7.0 584 15.2 25.6 9.9 40.3KS . . . . . . . 327 7.4 21.2 35.7 17.6 10.6 609 14.2 26.3 10.2 40.8KY . . . . . . . 485 11.9 24.9 33.6 13.2 5.3 548 14.5 23.9 9.0 40.0LA . . . . . . . 493 8.5 17.4 33.0 17.1 9.9 618 12.8 20.1 8.3 42.5ME . . . . . . . 149 12.0 17.5 31.9 18.6 12.0 636 12.4 24.0 12.5 42.2

MD . . . . . . . 639 5.7 5.4 15.2 26.1 42.7 953 12.4 25.9 12.1 43.7MA . . . . . . . 858 10.0 8.5 14.7 20.4 42.8 933 11.2 22.9 12.1 48.6MI. . . . . . . . 961 7.6 14.7 35.1 22.2 14.7 675 11.5 22.7 10.2 47.8MN . . . . . . . 484 9.6 12.6 32.1 22.7 18.1 701 11.3 26.1 12.2 44.6MS . . . . . . . 315 9.5 19.8 31.9 15.4 6.0 584 10.7 18.0 8.7 42.7

MO . . . . . . . 676 9.0 21.1 35.6 17.8 9.0 607 13.5 24.2 11.1 42.3MT . . . . . . . 112 9.9 24.4 31.0 13.0 9.3 571 14.3 21.8 10.5 40.0NE . . . . . . . 225 8.6 22.5 35.5 16.5 9.5 593 15.4 26.6 10.6 39.0NV . . . . . . . 356 2.6 4.4 21.7 30.0 38.4 917 10.1 26.6 10.9 48.1NH . . . . . . . 141 7.6 6.5 19.6 28.5 32.3 861 10.2 27.0 9.9 46.4

NJ. . . . . . . . 1,025 6.0 4.5 12.5 28.4 45.0 974 11.6 24.7 11.3 47.3NM . . . . . . . 220 7.3 21.3 33.1 15.7 11.9 617 13.9 21.7 10.0 41.9NY . . . . . . . 3,147 7.1 9.2 20.6 21.9 37.4 875 13.3 22.4 10.7 48.1NC . . . . . . . 1,103 6.4 16.5 36.8 20.8 10.9 656 13.3 23.6 10.3 42.7ND . . . . . . . 91 10.8 34.6 30.1 9.5 4.5 497 17.1 25.9 9.9 36.0

OH . . . . . . . 1,349 7.9 18.8 37.6 20.2 10.0 627 12.6 24.3 10.9 44.9OK . . . . . . . 435 8.1 23.5 36.1 15.5 7.3 580 13.0 23.6 10.7 41.4OR . . . . . . . 511 5.1 11.5 36.9 23.8 18.6 714 10.9 25.2 11.5 47.0PA . . . . . . . 1,370 8.2 17.2 31.4 21.2 15.3 664 13.5 24.4 10.9 43.0RI . . . . . . . . 150 11.5 7.6 18.1 31.1 28.3 840 11.6 25.2 13.7 44.9

SC . . . . . . . 492 7.4 16.7 35.4 18.7 10.0 640 12.5 23.0 10.3 40.3SD . . . . . . . 96 15.8 25.2 31.9 9.9 5.9 522 16.6 28.1 9.2 34.0TN . . . . . . . 715 9.5 18.6 36.7 18.1 8.1 613 12.1 23.6 10.9 42.3TX . . . . . . . 2,818 4.6 12.6 34.8 24.0 17.3 711 12.2 24.4 10.5 44.4UT . . . . . . . 228 4.4 13.1 38.1 22.7 16.6 697 12.9 27.0 11.9 42.1

VT . . . . . . . 71 9.9 9.2 31.4 24.8 17.3 716 11.3 22.6 11.0 47.1VA . . . . . . . 875 5.6 10.4 21.8 21.6 34.1 846 12.6 25.9 11.7 42.1WA . . . . . . . 852 5.6 9.6 28.7 26.0 25.7 779 12.2 25.9 11.5 44.9WV . . . . . . . 188 14.7 27.3 29.7 8.3 3.6 499 13.0 20.8 9.2 39.3WI. . . . . . . . 659 6.7 16.0 38.2 22.9 11.1 658 12.4 26.9 11.2 43.3WY . . . . . . . 63 6.2 23.8 35.2 12.7 10.0 601 20.9 22.7 13.4 30.0

1 Includes units with no cash rent.

Source: U.S. Census Bureau, 2006 American Community Survey Tables B25063. Gross Rent; B25064. Median Gross Rent;B25070. Gross Rent as a Percentage of Household Income; using American FactFinder®. See <http://factfinder.census.gov/>;(accessed 17 May 2008).

Construction and Housing 607

U.S. Census Bureau, Statistical Abstract of the United States: 2009

Table 956. Mortgage Characteristics—Owner-Occupied Units: 2005[In thousands (74,931 represents 74,931,000). As of fall. Based on the American Housing Survey; see Appendix III]

Mortgage characteristicTotal

owner-occu-piedunits

Housing unitcharacteristics Household characteristics

Newcon-

struc-tion 1

Mobilehomes Black 2

His-panic 3 Elderly 4

Movedin past

year

Belowpoverty

level

ALL OWNERSTotal. . . . . . . . . . . . . . . . . . . . . . 74,931 4,919 5,516 6,471 5,752 17,818 6,591 6,450

Mortgages currently on property:None, owned free and clear . . . . . . . . . . 24,776 839 3,066 2,078 1,539 12,139 1,258 3,690Regular and home equity mortgages . . . . 48,394 3,987 2,352 4,190 4,098 5,224 5,192 2,512

Regular mortgage. . . . . . . . . . . . . . . 44,652 3,843 2,233 3,971 3,964 4,115 5,064 2,338Home equity lump sum mortage . . . . . 4,385 269 87 264 253 527 269 164Home equity line of credit. . . . . . . . . . 10,044 712 132 438 476 1,320 652 297

Not reported . . . . . . . . . . . . . . . . . . . . 1,694 87 96 201 115 391 139 243Number of regular and home equitymortgages: 5

1 mortgage . . . . . . . . . . . . . . . . . . . . . 33,409 2,815 2,053 3,208 3,085 3,878 3,634 1,8242 mortgages . . . . . . . . . . . . . . . . . . . . 10,877 921 108 558 719 688 1,149 2593 mortgages or more . . . . . . . . . . . . . . 1,164 100 5 56 90 77 146 40

Type of mortgage:Regular and home equity lump sum 5 . . . 2,958 224 15 157 183 162 208 96

With home equity line of credit . . . . . . 587 38 − 23 44 45 54 27No home equity line of credit . . . . . . . 2,348 183 15 131 137 115 151 69

Regular no home equity lump sum 5 . . . . 41,694 3,619 2,218 3,814 3,781 3,953 4,855 2,242With home equity line of credit . . . . . . 6,835 572 70 290 366 455 509 144No home equity line of credit . . . . . . . 31,992 2,899 1,962 3,162 3,223 2,936 4,089 1,714

Home equity lump sum no regular 5 . . . . 1,427 45 73 107 70 365 61 68With home equity line of credit . . . . . . 307 3 15 14 3 76 22 19No home equity line of credit . . . . . . . 1,099 42 57 91 66 280 40 46

No regular or home equity lump sum 5. . . 28,851 1,031 3,210 2,393 1,718 13,338 1,466 4,045With home equity line of credit . . . . . . 2,315 99 46 112 64 744 67 107No home equity line of credit . . . . . . . 24,842 845 3,068 2,081 1,539 12,203 1,260 3,695OWNERS WITH ONE OR MORE

REGULAR OR LUMP SUMHOME EQUITY MORTGAGESTotal 5 . . . . . . . . . . . . . . . . . . . . 46,079 3,888 2,306 4,078 4,034 4,480 5,125 2,405

Type of primary mortgage:FHA . . . . . . . . . . . . . . . . . . . . . . . . . 4,689 450 111 820 615 298 551 238VA. . . . . . . . . . . . . . . . . . . . . . . . . . . 1,809 160 37 231 115 150 203 66RHS/RD 6. . . . . . . . . . . . . . . . . . . . . . 364 41 13 44 31 23 50 29Other types. . . . . . . . . . . . . . . . . . . . . 35,908 3,087 1,894 2,561 3,049 3,332 4,059 1,621

Mortgage origination:Placed new mortgage(s) . . . . . . . . . . . . 45,798 3,879 2,264 4,032 3,977 4,448 5,077 2,371

Primary obtained when propertyacquired . . . . . . . . . . . . . . . . . . . . 27,592 3,401 1,872 2,844 2,771 2,304 4,940 1,718

Obtained later . . . . . . . . . . . . . . . . . 18,206 478 392 1,188 1,206 2,144 138 653Assumed . . . . . . . . . . . . . . . . . . . . . . 231 3 40 41 47 27 43 32Wrap-around . . . . . . . . . . . . . . . . . . . . 11 6 2 − 3 3 5 −Combination of the above . . . . . . . . . . . 40 − − 5 8 2 − 2

Payment plan of primary mortgage:Fixed payment, self amortizing . . . . . . . . 37,392 3,187 1,853 3,227 3,284 3,297 3,955 1,677Adjustable rate mortgage . . . . . . . . . . . 2,441 235 92 194 253 178 404 98Adjustable term mortgage . . . . . . . . . . . 160 − 15 13 7 43 7 14Graduated payment mortgage . . . . . . . . 517 71 19 49 47 36 133 26Balloon . . . . . . . . . . . . . . . . . . . . . . . 518 76 45 22 51 37 102 32Combination of the above . . . . . . . . . . . 474 67 5 26 28 59 91 14

Payment plan of secondary mortgage:Units with two or more mortgages 5. . . . . 5,286 494 27 339 478 260 834 143

Fixed payment, self amortizing . . . . . . 3,897 334 25 287 344 171 571 108Adjustable rate mortgage . . . . . . . . . . 460 67 − 11 37 21 110 3Adjustable term mortgage . . . . . . . . . 156 13 − 3 27 29 13 5Graduated payment mortgage. . . . . . . 70 13 − 5 16 − 35 2Balloon . . . . . . . . . . . . . . . . . . . . . . 106 11 3 5 11 3 15 5Other . . . . . . . . . . . . . . . . . . . . . . . 5 − − − − − − −Combination of the above . . . . . . . . . 174 31 − 2 5 4 29 4

Reason primary refinanced:Units with a refinanced primarymortgage 7 . . . . . . . . . . . . . . . . . . . . 17,685 535 302 1,102 1,192 1,502 133 513To get a lower interest rate. . . . . . . . . 15,322 453 195 851 978 1,186 80 369To increase payment period . . . . . . . . 568 10 13 31 57 45 10 12To reduce payment period . . . . . . . . . 2,007 29 13 68 126 111 2 128To renew or extend a loan that hasfallen due . . . . . . . . . . . . . . . . . . . 178 − 3 20 12 17 − 12

To receive cash . . . . . . . . . . . . . . . . 2,375 60 36 169 230 261 25 70Other reason . . . . . . . . . . . . . . . . . . 1,646 42 95 137 116 185 23 67

Cash received in primary mortgagerefinance:Units receiving refinance cash . . . . . . . . 2,375 60 36 169 230 261 25 70Median amount received (dol.) . . . . . . . . 28,084 (NA) (NA) 19,690 31,701 33,553 (NA) 21,390

− Represents or rounds to zero. NA Not available. 1 Constructed in the past 4 years. 2 For persons who selected thisrace group only. See footnite 3, Table 949. 3 Persons of Hispanic origin may be of any race. 4 65 years old and over.5 Includes ‘‘don’t know’’ and ‘‘not reported.’’ 6 Rural Housing Service/Rural Development Mortgage, formerly Farmers HomeAdministration. 7 Persons reporting more than one reason are counted once in the total.

Source: U.S. Census Bureau, Current Housing Reports, Series H150/05, American Housing Survey for the United States. See<http://www.census.gov/hhes/www/housing/ahs/nationaldata.html> and <http://www.census.gov/hhes/www/housing/ahs/nationaldata.html>.

608 Construction and Housing

U.S. Census Bureau, Statistical Abstract of the United States: 2009

Table 957. Occupied Housing Units—Neighborhood Indicators by SelectedCharacteristics of the Householder: 2005

[In thousands (108,871 represents 108,871,000). As of fall. Based on the American Housing Survey; see Appendix III]

CharacteristicTotal

occu-piedunits

Tenure Black 1 Hispanicorigin 2 Elderly 3

Householdsbelow poverty

level

Owner Renter Owner Renter Owner Renter Owner Renter Owner Renter

Total units . . . . . . . . . . . . . 108,871 74,931 33,940 6,471 6,975 5,752 5,899 17,818 4,379 6,450 8,674

Street noise or traffic present 4 . . . 28,436 16,918 11,519 1,797 2,565 1,363 1,757 4,188 1,221 1,609 2,978Condition not bothersome. . . . . 16,866 9,988 6,878 1,078 1,510 731 973 2,869 880 942 1,720Condition bothersome . . . . . . . 11,522 6,906 4,616 719 1,048 633 782 1,314 340 664 1,252

So bothersome they wantto move . . . . . . . . . . . . . . 4,370 2,314 2,056 274 596 230 365 311 126 241 658

Neighborhood crime present 4 . . . 16,419 9,203 7,215 1,340 1,968 885 1,351 1,825 566 920 2,115Condition not bothersome. . . . . 6,944 4,025 2,920 587 777 339 439 936 312 359 808Condition bothersome . . . . . . . 9,447 5,166 4,280 748 1,179 546 912 881 255 558 1,302

So bothersome they wantto move . . . . . . . . . . . . . . 4,003 1,646 2,357 288 724 253 562 216 80 191 806

Odors present 4 . . . . . . . . . . . . . 5,991 3,445 2,546 362 685 330 495 644 207 366 797Condition not bothersome. . . . . 2,279 1,397 882 160 211 113 119 293 76 131 246Condition bothersome . . . . . . . 3,708 2,048 1,660 202 474 217 374 351 129 235 550

So bothersome they wantto move . . . . . . . . . . . . . . 1,415 617 799 87 283 72 196 95 49 69 312

Other problems:Noise . . . . . . . . . . . . . . . . . . 2,552 1,458 1,094 155 260 137 224 314 91 144 318Litter or housing deterioration . . 1,918 1,226 691 168 237 130 138 289 37 80 209Poor city or county services . . . 844 513 330 102 128 84 59 106 18 41 85People . . . . . . . . . . . . . . . . . 4,057 2,530 1,527 283 381 249 272 456 67 247 505

With public transportation 4 . . . . . 58,623 35,092 23,531 3,888 5,455 3,584 4,542 8,315 3,063 2,768 6,000Household uses it at leastweekly . . . . . . . . . . . . . . . . 11,219 4,148 7,071 902 2,218 616 1,838 771 859 454 2,285

Household uses it less thanweekly . . . . . . . . . . . . . . . . 8,641 5,095 3,545 592 803 430 642 1,007 483 321 999

Household does not use . . . . . 37,978 25,425 12,553 2,329 2,362 2,498 2,019 6,440 1,679 1,958 2,627No public transportation. . . . . . . . 46,499 37,361 9,138 2,392 1,268 1,958 1,196 8,956 1,188 3,422 2,393Not reported . . . . . . . . . . . . . . . 3,750 2,478 1,271 192 251 210 161 548 128 261 280

Police protection:Satisfactory . . . . . . . . . . . . . . 96,834 66,895 29,939 5,543 5,923 4,948 5,149 16,024 4,000 5,449 7,390Unsatisfacory . . . . . . . . . . . . . 8,391 5,714 2,676 693 781 633 572 1,195 183 726 923

Secured communities 5:Community access securedwith walls or fences . . . . . . . . 6,925 3,150 3,775 223 846 357 893 974 543 221 844

Community access notsecured . . . . . . . . . . . . . . . . 101,136 71,201 29,935 6,163 6,069 5,353 4,977 16,690 3,803 6,137 7,754

Secured multiunits: 5

Multiunit access secured . . . . . 5,841 1,061 4,781 81 1,029 99 694 389 1,306 154 1,308Multiunit access not secured . . . 19,792 2,645 17,147 269 3,824 277 3,339 774 1,926 252 4,416

Senior citizen communities:Households with persons 55years old and over . . . . . . . . 42,934 34,557 8,377 2,865 1,533 1,945 1,086 17,818 4,379 3,902 2,537Community age restricted 6 . . 2,834 1,435 1,399 47 198 45 106 1,118 1,228 222 536

Access to structure:Enter building from outside 4, 7 . 25,778 3,740 22,038 349 4,882 380 4,053 1,179 3,248 411 5,757

Use of steps not required . . . 10,049 1,498 8,550 97 1,738 165 1,634 556 1,777 165 2,517Use of steps required . . . . . . 15,692 2,229 13,463 252 3,139 214 2,412 621 1,460 241 3,238

Enter home from outside 4, 8 . . . 83,093 71,191 11,903 6,122 2,093 5,372 1,845 16,639 1,131 6,039 2,916Use of steps not required . . . 39,953 34,712 5,241 2,869 903 3,197 945 8,271 527 2,689 1,228Use of steps required . . . . . . 43,043 36,393 6,650 3,247 1,187 2,167 900 8,340 604 3,341 1,688

Community quality:Some or all activities present . . 38,786 25,667 13,119 2,219 2,632 1,783 1,836 6,522 2,210 1,815 3,281

Community center orclubhouse. . . . . . . . . . . . . 23,287 14,379 8,908 1,243 1,782 961 1,172 4,111 1,696 982 2,094

Golf in the community. . . . . . 6,236 4,678 1,558 306 200 233 184 1,159 209 255 338Trails in the community. . . . . 18,641 13,581 5,061 1,012 733 801 630 2,955 767 738 1,091Shuttle bus. . . . . . . . . . . . . 9,565 5,831 3,734 429 542 411 500 2,084 1,142 474 1,145Daycare. . . . . . . . . . . . . . . 14,531 9,883 4,648 1,111 1,209 691 722 2,212 533 736 1,319Private or restricted beach,park, or shoreline. . . . . . . . 6,556 4,937 1,620 244 278 267 194 1,190 193 316 368

Trash, litter, or junk on street: 9

None . . . . . . . . . . . . . . . . . . 96,984 68,345 28,639 5,503 5,451 5,077 4,824 16,494 4,011 5,601 6,969Minor accumulation . . . . . . . . . 6,578 3,273 3,305 479 889 373 637 617 225 406 1,036Major accumulation . . . . . . . . . 2,757 1,450 1,308 216 414 148 322 336 70 198 467

1 For persons who selected this race group only. See footnote 3, Table 949. 2 Persons of Hispanic origin may be of anyrace. 3 Householders 65 years old and over. 4 Includes those not reporting. 5 Public access is restricted (walls, gates, privatesecurity). Includes high rise apartments, retirement communities, resorts, etc. 6 At least one family member must be aged 55years old or older. 7 Restricted to multiunits. 8 Restricted to single units. 9 Or on any properties within 300 feet.

Source: U.S. Census Bureau, Current Housing Reports, Series H150/05, American Housing Survey for the United States. See<http://www.census.gov/hhes/www/housing/ahs/nationaldata.html>.

Construction and Housing 609

U.S. Census Bureau, Statistical Abstract of the United States: 2009

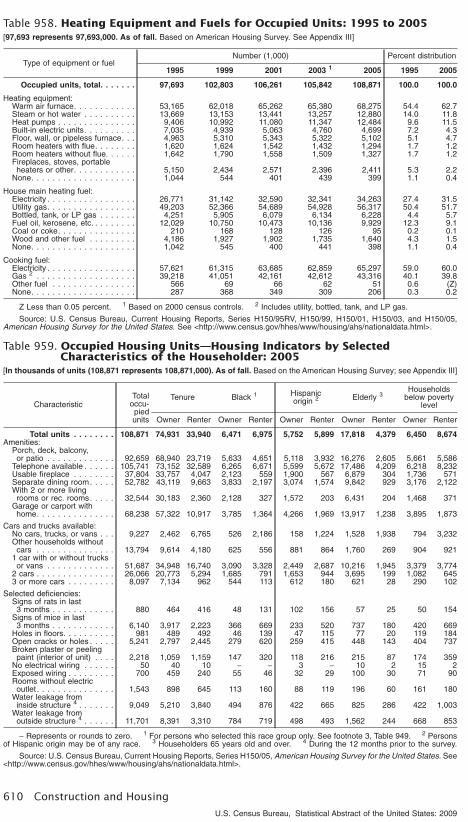
Table 958. Heating Equipment and Fuels for Occupied Units: 1995 to 2005[97,693 represents 97,693,000. As of fall. Based on American Housing Survey. See Appendix III]

Type of equipment or fuelNumber (1,000) Percent distribution

1995 1999 2001 2003 1 2005 1995 2005

Occupied units, total. . . . . . . 97,693 102,803 106,261 105,842 108,871 100.0 100.0

Heating equipment:Warm air furnace. . . . . . . . . . . . 53,165 62,018 65,262 65,380 68,275 54.4 62.7Steam or hot water . . . . . . . . . . 13,669 13,153 13,441 13,257 12,880 14.0 11.8Heat pumps . . . . . . . . . . . . . . . 9,406 10,992 11,080 11,347 12,484 9.6 11.5Built-in electric units . . . . . . . . . . 7,035 4,939 5,063 4,760 4,699 7.2 4.3Floor, wall, or pipeless furnace. . . 4,963 5,310 5,343 5,322 5,102 5.1 4.7Room heaters with flue. . . . . . . . 1,620 1,624 1,542 1,432 1,294 1.7 1.2Room heaters without flue. . . . . . 1,642 1,790 1,558 1,509 1,327 1.7 1.2Fireplaces, stoves, portableheaters or other. . . . . . . . . . . . 5,150 2,434 2,571 2,396 2,411 5.3 2.2

None. . . . . . . . . . . . . . . . . . . . 1,044 544 401 439 399 1.1 0.4

House main heating fuel:Electricity . . . . . . . . . . . . . . . . . 26,771 31,142 32,590 32,341 34,263 27.4 31.5Utility gas. . . . . . . . . . . . . . . . . 49,203 52,366 54,689 54,928 56,317 50.4 51.7Bottled, tank, or LP gas . . . . . . . 4,251 5,905 6,079 6,134 6,228 4.4 5.7Fuel oil, kerosene, etc. . . . . . . . . 12,029 10,750 10,473 10,136 9,929 12.3 9.1Coal or coke. . . . . . . . . . . . . . . 210 168 128 126 95 0.2 0.1Wood and other fuel . . . . . . . . . 4,186 1,927 1,902 1,735 1,640 4.3 1.5None. . . . . . . . . . . . . . . . . . . . 1,042 545 400 441 398 1.1 0.4

Cooking fuel:Electricity . . . . . . . . . . . . . . . . . 57,621 61,315 63,685 62,859 65,297 59.0 60.0Gas 2 . . . . . . . . . . . . . . . . . . . 39,218 41,051 42,161 42,612 43,316 40.1 39.8Other fuel . . . . . . . . . . . . . . . . 566 69 66 62 51 0.6 (Z)None. . . . . . . . . . . . . . . . . . . . 287 368 349 309 206 0.3 0.2

Z Less than 0.05 percent. 1 Based on 2000 census controls. 2 Includes utility, bottled, tank, and LP gas.

Source: U.S. Census Bureau, Current Housing Reports, Series H150/95RV, H150/99, H150/01, H150/03, and H150/05,American Housing Survey for the United States. See <http://www.census.gov/hhes/www/housing/ahs/nationaldata.html>.

Table 959. Occupied Housing Units—Housing Indicators by SelectedCharacteristics of the Householder: 2005

[In thousands of units (108,871 represents 108,871,000). As of fall. Based on the American Housing Survey; see Appendix III]

CharacteristicTotal

occu-piedunits

Tenure Black 1 Hispanicorigin 2 Elderly 3

Householdsbelow poverty

level

Owner Renter Owner Renter Owner Renter Owner Renter Owner Renter

Total units . . . . . . . . 108,871 74,931 33,940 6,471 6,975 5,752 5,899 17,818 4,379 6,450 8,674Amenities:

Porch, deck, balcony,or patio . . . . . . . . . . . . . 92,659 68,940 23,719 5,633 4,651 5,118 3,932 16,276 2,605 5,661 5,586

Telephone available . . . . . . 105,741 73,152 32,589 6,265 6,671 5,599 5,672 17,486 4,209 6,218 8,232Usable fireplace . . . . . . . . 37,804 33,757 4,047 2,123 559 1,900 567 6,879 304 1,736 571Separate dining room. . . . . 52,782 43,119 9,663 3,833 2,197 3,074 1,574 9,842 929 3,176 2,122With 2 or more livingrooms or rec. rooms. . . . . 32,544 30,183 2,360 2,128 327 1,572 203 6,431 204 1,468 371

Garage or carport withhome. . . . . . . . . . . . . . . 68,238 57,322 10,917 3,785 1,364 4,266 1,969 13,917 1,238 3,895 1,873

Cars and trucks available:No cars, trucks, or vans . . . 9,227 2,462 6,765 526 2,186 158 1,224 1,528 1,938 794 3,232Other households withoutcars . . . . . . . . . . . . . . . 13,794 9,614 4,180 625 556 881 864 1,760 269 904 921

1 car with or without trucksor vans . . . . . . . . . . . . . 51,687 34,948 16,740 3,090 3,328 2,449 2,687 10,216 1,945 3,379 3,774

2 cars . . . . . . . . . . . . . . . 26,066 20,773 5,294 1,685 791 1,653 944 3,695 199 1,082 6453 or more cars . . . . . . . . . 8,097 7,134 962 544 113 612 180 621 28 290 102

Selected deficiencies:Signs of rats in last3 months . . . . . . . . . . . . 880 464 416 48 131 102 156 57 25 50 154

Signs of mice in last3 months . . . . . . . . . . . . 6,140 3,917 2,223 366 669 233 520 737 180 420 669

Holes in floors. . . . . . . . . . 981 489 492 46 139 47 115 77 20 119 184Open cracks or holes . . . . . 5,241 2,797 2,445 279 620 259 415 448 143 404 737Broken plaster or peelingpaint (interior of unit) . . . . 2,218 1,059 1,159 147 320 118 216 215 87 174 359

No electrical wiring . . . . . . 50 40 10 − − 3 − 10 2 15 2Exposed wiring . . . . . . . . . 700 459 240 55 46 32 29 100 30 71 90Rooms without electricoutlet . . . . . . . . . . . . . . . 1,543 898 645 113 160 88 119 196 60 161 180

Water leakage frominside structure 4 . . . . . . . 9,049 5,210 3,840 494 876 422 665 825 286 422 1,003

Water leakage fromoutside structure 4 . . . . . . 11,701 8,391 3,310 784 719 498 493 1,562 244 668 853

− Represents or rounds to zero. 1 For persons who selected this race group only. See footnote 3, Table 949. 2 Personsof Hispanic origin may be of any race. 3 Householders 65 years old and over. 4 During the 12 months prior to the survey.

Source: U.S. Census Bureau, Current Housing Reports, Series H150/05, American Housing Survey for the United States. See<http://www.census.gov/hhes/www/housing/ahs/nationaldata.html>.

610 Construction and Housing

U.S. Census Bureau, Statistical Abstract of the United States: 2009

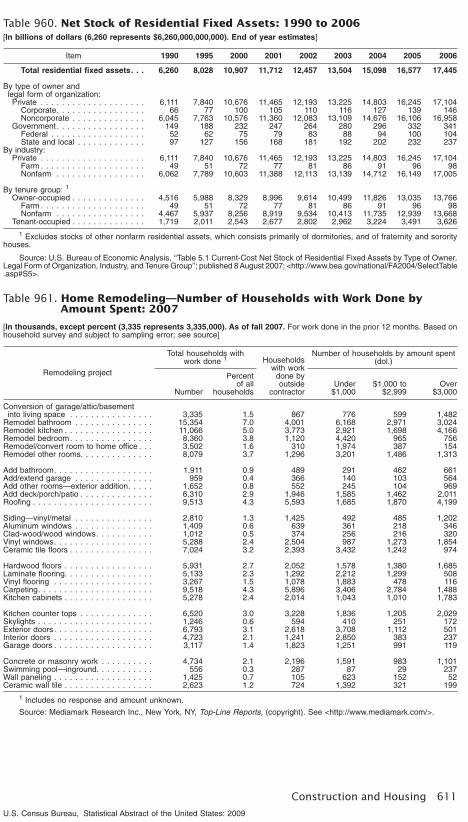
Table 960. Net Stock of Residential Fixed Assets: 1990 to 2006[In billions of dollars (6,260 represents $6,260,000,000,000). End of year estimates]

Item 1990 1995 2000 2001 2002 2003 2004 2005 2006

Total residential fixed assets. . . 6,260 8,028 10,907 11,712 12,457 13,504 15,098 16,577 17,445

By type of owner andlegal form of organization:Private . . . . . . . . . . . . . . . . . . . . 6,111 7,840 10,676 11,465 12,193 13,225 14,803 16,245 17,104

Corporate. . . . . . . . . . . . . . . . . 66 77 100 105 110 116 127 139 146Noncorporate . . . . . . . . . . . . . . 6,045 7,763 10,576 11,360 12,083 13,109 14,676 16,106 16,958

Government . . . . . . . . . . . . . . . . . 149 188 232 247 264 280 296 332 341Federal . . . . . . . . . . . . . . . . . . 52 62 75 79 83 88 94 100 104State and local . . . . . . . . . . . . . 97 127 156 168 181 192 202 232 237

By industry:Private . . . . . . . . . . . . . . . . . . . . 6,111 7,840 10,676 11,465 12,193 13,225 14,803 16,245 17,104

Farm . . . . . . . . . . . . . . . . . . . . 49 51 72 77 81 86 91 96 98Nonfarm . . . . . . . . . . . . . . . . . 6,062 7,789 10,603 11,388 12,113 13,139 14,712 16,149 17,005

By tenure group: 1

Owner-occupied . . . . . . . . . . . . . . 4,516 5,988 8,329 8,996 9,614 10,499 11,826 13,035 13,766Farm . . . . . . . . . . . . . . . . . . . . 49 51 72 77 81 86 91 96 98Nonfarm . . . . . . . . . . . . . . . . . 4,467 5,937 8,256 8,919 9,534 10,413 11,735 12,939 13,668

Tenant-occupied . . . . . . . . . . . . . . 1,719 2,011 2,543 2,677 2,802 2,962 3,224 3,491 3,626

1 Excludes stocks of other nonfarm residential assets, which consists primarily of dormitories, and of fraternity and sororityhouses.

Source: U.S. Bureau of Economic Analysis, ‘‘Table 5.1 Current-Cost Net Stock of Residential Fixed Assets by Type of Owner,Legal Form of Organization, Industry, and Tenure Group’’; published 8 August 2007; <http://www.bea.gov/national/FA2004/SelectTable.asp#S5>.

Table 961. Home Remodeling—Number of Households with Work Done byAmount Spent: 2007

[In thousands, except percent (3,335 represents 3,335,000). As of fall 2007. For work done in the prior 12 months. Based onhousehold survey and subject to sampling error; see source]

Remodeling project

Total households withwork done 1 Households

with workdone byoutside

contractor

Number of households by amount spent(dol.)

Number

Percentof all

householdsUnder

$1,000$1,000 to

$2,999Over

$3,000

Conversion of garage/attic/basementinto living space . . . . . . . . . . . . . . . . 3,335 1.5 867 776 599 1,482

Remodel bathroom . . . . . . . . . . . . . . . 15,354 7.0 4,001 6,168 2,971 3,024Remodel kitchen . . . . . . . . . . . . . . . . . 11,066 5.0 3,773 2,921 1,698 4,166Remodel bedroom. . . . . . . . . . . . . . . . 8,360 3.8 1,120 4,420 965 756Remodel/convert room to home office . . . 3,502 1.6 310 1,974 387 154Remodel other rooms. . . . . . . . . . . . . . 8,079 3.7 1,296 3,201 1,486 1,313

Add bathroom. . . . . . . . . . . . . . . . . . . 1,911 0.9 489 291 462 661Add/extend garage . . . . . . . . . . . . . . . 959 0.4 366 140 103 564Add other rooms—exterior addition. . . . . 1,652 0.8 552 245 104 969Add deck/porch/patio . . . . . . . . . . . . . . 6,310 2.9 1,946 1,585 1,462 2,011Roofing . . . . . . . . . . . . . . . . . . . . . . . 9,513 4.3 5,593 1,685 1,870 4,199

Siding—vinyl/metal . . . . . . . . . . . . . . . 2,810 1.3 1,425 492 485 1,202Aluminum windows . . . . . . . . . . . . . . . 1,409 0.6 639 361 218 346Clad-wood/wood windows. . . . . . . . . . . 1,012 0.5 374 256 216 320Vinyl windows. . . . . . . . . . . . . . . . . . . 5,288 2.4 2,504 987 1,273 1,854Ceramic tile floors . . . . . . . . . . . . . . . . 7,024 3.2 2,393 3,432 1,242 974

Hardwood floors . . . . . . . . . . . . . . . . . 5,931 2.7 2,052 1,578 1,380 1,685Laminate flooring. . . . . . . . . . . . . . . . . 5,133 2.3 1,292 2,212 1,299 508Vinyl flooring . . . . . . . . . . . . . . . . . . . 3,267 1.5 1,078 1,883 478 116Carpeting. . . . . . . . . . . . . . . . . . . . . . 9,518 4.3 5,896 3,406 2,784 1,488Kitchen cabinets . . . . . . . . . . . . . . . . . 5,278 2.4 2,014 1,043 1,010 1,783

Kitchen counter tops . . . . . . . . . . . . . . 6,520 3.0 3,228 1,836 1,205 2,029Skylights . . . . . . . . . . . . . . . . . . . . . . 1,246 0.6 594 410 251 172Exterior doors. . . . . . . . . . . . . . . . . . . 6,793 3.1 2,618 3,708 1,112 501Interior doors . . . . . . . . . . . . . . . . . . . 4,723 2.1 1,241 2,850 383 237Garage doors . . . . . . . . . . . . . . . . . . . 3,117 1.4 1,823 1,251 991 119

Concrete or masonry work . . . . . . . . . . 4,734 2.1 2,196 1,591 983 1,101Swimming pool—inground. . . . . . . . . . . 556 0.3 287 87 29 237Wall paneling . . . . . . . . . . . . . . . . . . . 1,425 0.7 105 623 152 52Ceramic wall tile . . . . . . . . . . . . . . . . . 2,623 1.2 724 1,392 321 199

1 Includes no response and amount unknown.

Source: Mediamark Research Inc., New York, NY, Top-Line Reports, (copyright). See <http://www.mediamark.com/>.

Construction and Housing 611

U.S. Census Bureau, Statistical Abstract of the United States: 2009

Table 962. Expenditures by Residential Property Owners for Improvementsand Maintenance and Repairs by Type of Payment andYear Structure Built: 1995 to 2007

[In millions of dollars (124,971 represents $124,971,000,000). Based on personal interviews and mail surveys; see source fordetails]

Type of expenditure Allresiden-

tialproper-

ties

Owner-occupied one-unit properties

Total 1

Pay-ments tocontrac-

tors

Materials purchasedby owners Year structure built

Total

For jobsdone byowners

For jobsdone

undercontract

Before1960

1960 to1979

1980 to2003

Total:1995 . . . . . . . . . . . . . . 124,971 79,003 63,017 15,987 12,305 3,682 30,080 28,157 14,7182000 . . . . . . . . . . . . . . 152,975 100,161 84,778 15,382 11,682 3,700 30,451 27,872 32,7172003 . . . . . . . . . . . . . . 176,899 115,876 101,207 14,669 11,750 2,920 40,497 29,498 45,8812004 . . . . . . . . . . . . . . 198,556 136,080 114,197 21,883 17,213 4,670 39,452 36,035 60,5942005 . . . . . . . . . . . . . . 215,030 159,458 133,684 25,774 20,365 5,409 40,821 45,505 73,1322006 . . . . . . . . . . . . . . 228,208 167,154 141,439 25,715 21,615 4,100 43,582 39,196 84,3762007 . . . . . . . . . . . . . . 226,359 168,428 141,571 26,857 22,445 4,412 44,001 49,831 74,597Maintenance and repairs:

1995. . . . . . . . . . . . . 47,032 25,460 19,487 5,973 5,498 476 9,979 8,388 5,5112000. . . . . . . . . . . . . 42,236 22,411 18,260 4,151 3,384 767 8,074 5,226 6,7882003. . . . . . . . . . . . . 44,094 18,381 15,714 2,667 2,387 279 5,583 4,545 8,2532004. . . . . . . . . . . . . 50,611 26,575 20,655 5,920 5,356 564 8,197 6,401 11,9772005. . . . . . . . . . . . . 53,293 32,888 24,574 8,314 7,869 444 9,315 8,022 15,5512006. . . . . . . . . . . . . 53,389 31,078 23,299 7,778 7,133 645 8,633 8,405 14,0402007. . . . . . . . . . . . . 54,738 33,567 24,480 9,087 8,491 597 10,353 9,089 14,126

Improvements:1995. . . . . . . . . . . . . 77,940 53,543 43,530 10,013 6,807 3,206 20,101 19,768 9,2082000. . . . . . . . . . . . . 110,739 77,750 66,517 11,232 8,298 2,934 22,377 22,646 25,9292003. . . . . . . . . . . . . 132,805 97,495 85,494 12,003 9,362 2,640 34,914 24,953 37,6282004. . . . . . . . . . . . . 147,945 109,506 93,542 15,962 11,857 4,106 31,254 29,634 48,6172005. . . . . . . . . . . . . 161,737 126,570 109,110 17,460 12,496 4,964 31,507 37,483 57,5812006. . . . . . . . . . . . . 174,819 136,076 118,140 17,936 14,481 3,455 34,950 30,790 70,3362007. . . . . . . . . . . . . 171,621 134,861 117,091 17,769 13,954 3,816 33,648 40,744 60,470

1 Includes year built not reported, not shown separately.Source: U.S. Census Bureau, ‘‘Residential Improvement and Repair Statistics.’’ See <http://www.census.gov/const/www/c50index

.html>.

Table 963. Commercial Buildings—Summary: 2003[4,645 represents 4,645,000. Excludes mall buildings. Building type based on predominant activity in which the occupants wereengaged. Based on a sample survey of building representatives conducted in 2003, therefore subject to sampling variability. Forcommercial building energy expenditures, see Table 887, Section 19]

Characteristic All buildings(1,000)

Total floor-space

(mil. sq. ft.)

Total workersin all build-

ings (1,000)

Mean squarefoot per

building 1

(1,000)

Mean squarefoot per

worker 1

Mean operat-ing hours per

week 1

All buildings . . . . . . . . . . . 4,645 64,783 72,807 13.9 890 61Building floorspace (sq. ft.):

1,001 to 5,000 . . . . . . . . . . . . 2,552 6,789 9,936 2.7 683 575,001 to 10,000 . . . . . . . . . . . 889 6,585 7,512 7.4 877 6110,001 to 25,000 . . . . . . . . . . 738 11,535 10,787 15.6 1,069 6725,001 to 50,000 . . . . . . . . . . 241 8,668 8,881 35.9 976 7250,001 to 100,000. . . . . . . . . . 129 9,057 8,432 70.4 1,074 80100,001 to 200,000 . . . . . . . . . 65 9,064 11,632 138.8 779 89200,001 to 500,000 . . . . . . . . . 25 7,176 6,883 289.0 1,043 100Over 500,000 . . . . . . . . . . . . . 7 5,908 8,744 896.1 676 115

Principal activity within building:Education . . . . . . . . . . . . . . . 386 9,874 12,489 25.6 791 50Food sales . . . . . . . . . . . . . . 226 1,255 1,430 5.6 877 107Food service . . . . . . . . . . . . . 297 1,654 3,129 5.6 528 86Health care . . . . . . . . . . . . . . 129 3,163 6,317 24.6 501 59

Inpatient . . . . . . . . . . . . . . 8 1,905 3,716 241.4 513 168Outpatient . . . . . . . . . . . . . 121 1,258 2,600 10.4 484 52

Lodging. . . . . . . . . . . . . . . . . 142 5,096 2,457 35.8 2,074 167Retail (other than mall). . . . . . . 443 4,317 3,463 9.7 1,246 59Office . . . . . . . . . . . . . . . . . . 824 12,208 28,154 14.8 434 55Public assembly . . . . . . . . . . . 277 3,939 2,395 14.2 1,645 50Public order and safety . . . . . . 71 1,090 1,347 15.5 809 103Religious worship . . . . . . . . . . 370 3,754 1,706 10.1 2,200 32Service . . . . . . . . . . . . . . . . . 622 4,050 3,667 6.5 1,105 55Warehouse and storage . . . . . . 597 10,078 4,369 16.9 2,306 66Other . . . . . . . . . . . . . . . . . . 79 1,738 1,819 21.9 956 63Vacant . . . . . . . . . . . . . . . . . 182 2,567 (NA) 14.1 (NA) (NA)

Energy sources: 2

Electricity. . . . . . . . . . . . . . . . 4,404 63,307 72,708 14.4 871 62Natural gas . . . . . . . . . . . . . . 2,391 43,468 51,956 18.2 837 65Fuel oil . . . . . . . . . . . . . . . . . 451 15,157 19,625 33.6 772 68District heat . . . . . . . . . . . . . . 67 5,443 10,190 81.4 534 79District chilled water . . . . . . . . 33 2,853 7,189 86.7 397 79Propane . . . . . . . . . . . . . . . . 502 7,076 5,858 14.1 1,208 60Wood . . . . . . . . . . . . . . . . . . 62 289 262 4.6 1,105 46

NA Not available. 1 For explanation of mean, see Guide to Tabular Presentation. 2 More than one type may apply.Source: U.S. Energy Information Administration, ‘‘2003 Commercial Buildings Energy Consumption Buildings (CBECS)

Detailed Tables’’; Table B1. See <http://www.eia.doe.gov/emeu/cbecs/cbecs2003/detailed_tables_2003/detailed_tables_2003.html>; (accessed 11 July 2007).

612 Construction and Housing

U.S. Census Bureau, Statistical Abstract of the United States: 2009


Recommended