21
Section 3 : Prospects for the UK financial system
| Date post: | 19-Dec-2015 |
| Category: |
Documents |
| View: | 215 times |
| Download: | 2 times |

Section 3 : Prospects for the UK financial system
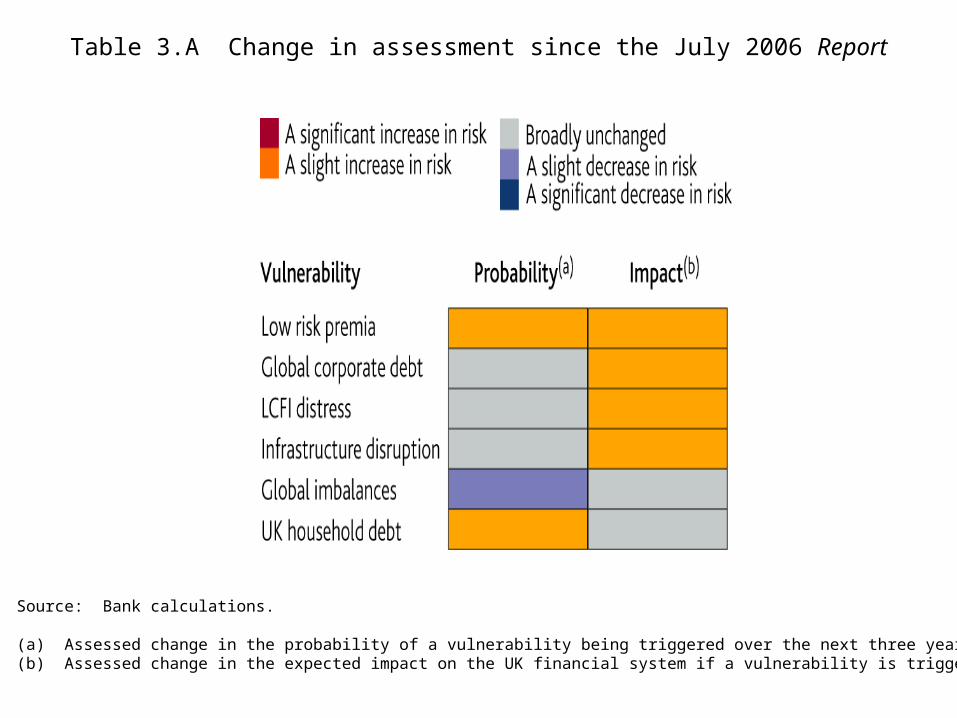
Table 3.A Change in assessment since the July 2006 Report
Source: Bank calculations.
(a) Assessed change in the probability of a vulnerability being triggered over the next three years.(b) Assessed change in the expected impact on the UK financial system if a vulnerability is triggered.

Chart 3.1 Spreads on bond indices
Source: Bloomberg, JPMorgan Chase & Co and Merrill Lynch.
(a) July 2006 Report.(b) Option-adjusted asset swap spreads.
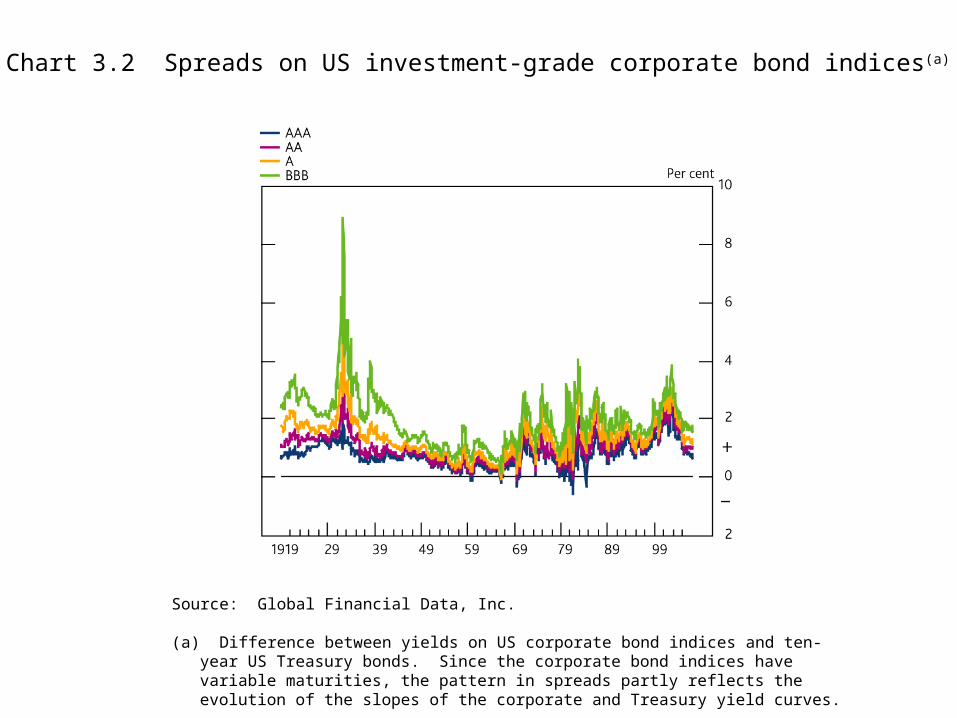
Chart 3.2 Spreads on US investment-grade corporate bond indices(a)
Source: Global Financial Data, Inc.
(a) Difference between yields on US corporate bond indices and ten-year US Treasury bonds. Since the corporate bond indices have variable maturities, the pattern in spreads partly reflects the evolution of the slopes of the corporate and Treasury yield curves.

Chart 3.3 Debt multiples in S&P-rated European LBO deals
Source: Standard & Poor’s.
(a) Data for 2007 are Q1 data only.(b) EBITDA = earnings before interest, tax, depreciation and amortisation.

Chart 3.4 UK PNFCs’(a) capital gearing(b)
Sources: ONS and Bank calculations.
(a) Private non-financial corporations.(b) Gearing is calculated as the ratio of debt, net of liquid assets, to the market value or
replacement cost of capital.

Chart 3.5 Corporate write-offs and insolvency rates(a)(b)(c)
Sources: Bank of England and Insolvency Service.
(a) Insolvency data are for England and Wales. Data are company and creditors’ voluntary liquidation rates.(b) Annual rates, by value.(c) Solid line shows write-off rate for UK-owned banks, dashed line for all UK-resident banks (interpolated annual data).
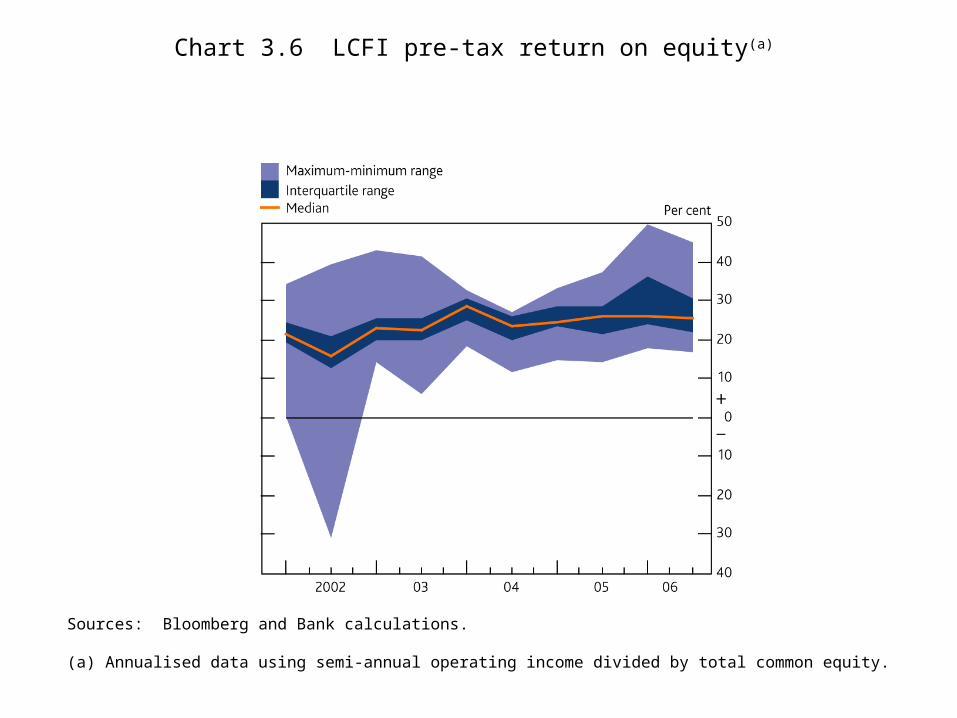
Chart 3.6 LCFI pre-tax return on equity(a)
Sources: Bloomberg and Bank calculations.
(a) Annualised data using semi-annual operating income divided by total common equity.

Chart 3.7 Simplified representation of dependencies in UK payment systems(a)(b)
(a) See glossary for description of terms.(b) In some cases, alternative network providers to SWIFT are also used. BACS, C&CC and LINK
depend on RTGS once a day to effect multilateral interbank settlement.
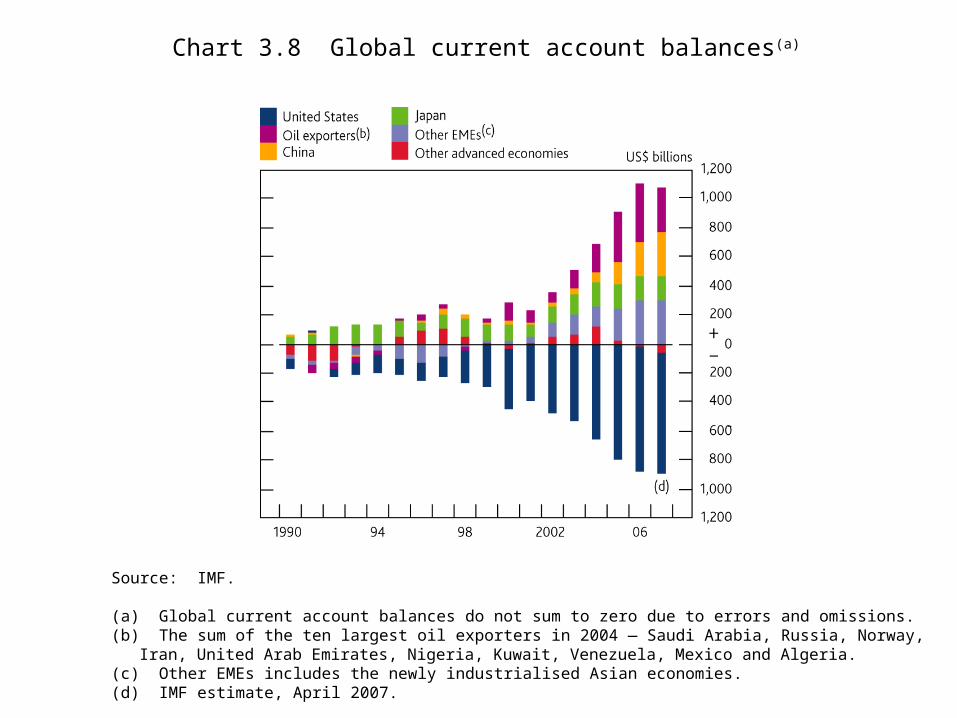
Chart 3.8 Global current account balances(a)
Source: IMF.
(a) Global current account balances do not sum to zero due to errors and omissions.(b) The sum of the ten largest oil exporters in 2004 — Saudi Arabia, Russia, Norway, Iran, United Arab Emirates,
Nigeria, Kuwait, Venezuela, Mexico and Algeria.(c) Other EMEs includes the newly industrialised Asian economies.(d) IMF estimate, April 2007.

Chart 3.9 Distressed debt resolutions(a)
Sources: Debt Free Direct, Insolvency Service and Bank of England calculations.
(a) Excluding informal bilateral agreements.(b) No formal statistics on debt management plans are available. Estimates are
derived from partial data released by consumer credit organisations.(c) Bankruptcies include Sequestrations in Scotland.(d) IVAs include Protected Trust Deeds in Scotland.

Table 3.B Summary of broad severe stress scenarios
Severe global A combined supply shock to both the UK and overseas markets
macroeconomic leads to a macroeconomic slowdown and rising inflation. Over
slowdown three years, UK GDP growth falls to -1.5% and asset prices fall
sharply.
A severe flu pandemic A pandemic spread over two waves. 25% of the UK population
falls ill in line with Department of Health contingency planning
assumptions.(a) Asset prices fall sharply and UK GDP falls by
over 7% relative to base in the first year before recovering.
Source: Bank calculations.
(a) See UK Health Departments’ influenza pandemic contingency plan (October 2005), available on their website: www.dh.gov.uk.
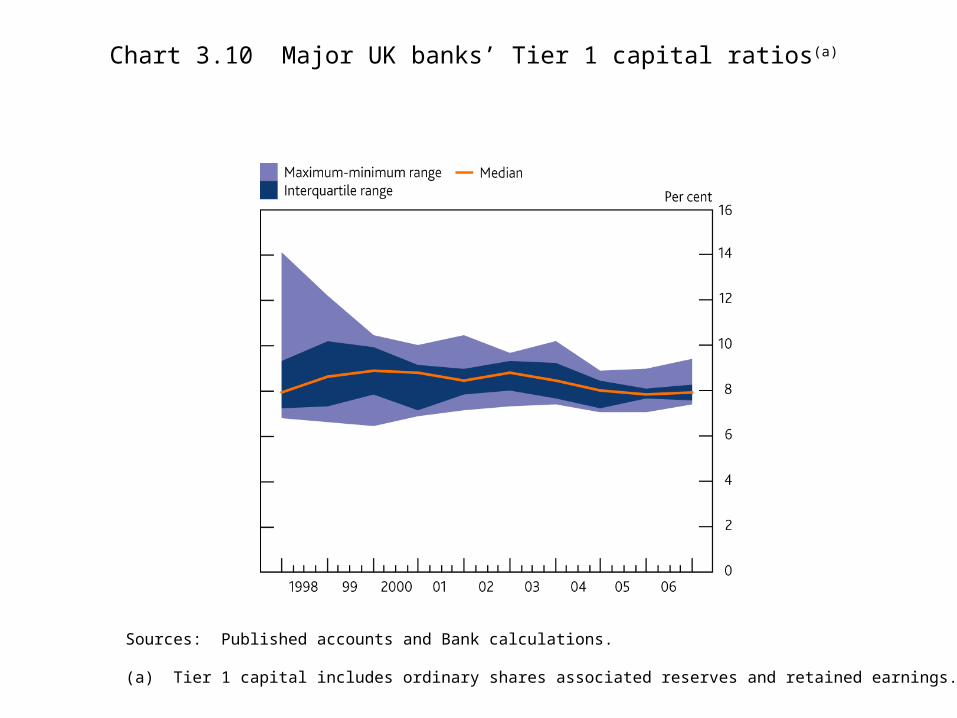
Chart 3.10 Major UK banks’ Tier 1 capital ratios(a)
Sources: Published accounts and Bank calculations.
(a) Tier 1 capital includes ordinary shares associated reserves and retained earnings.
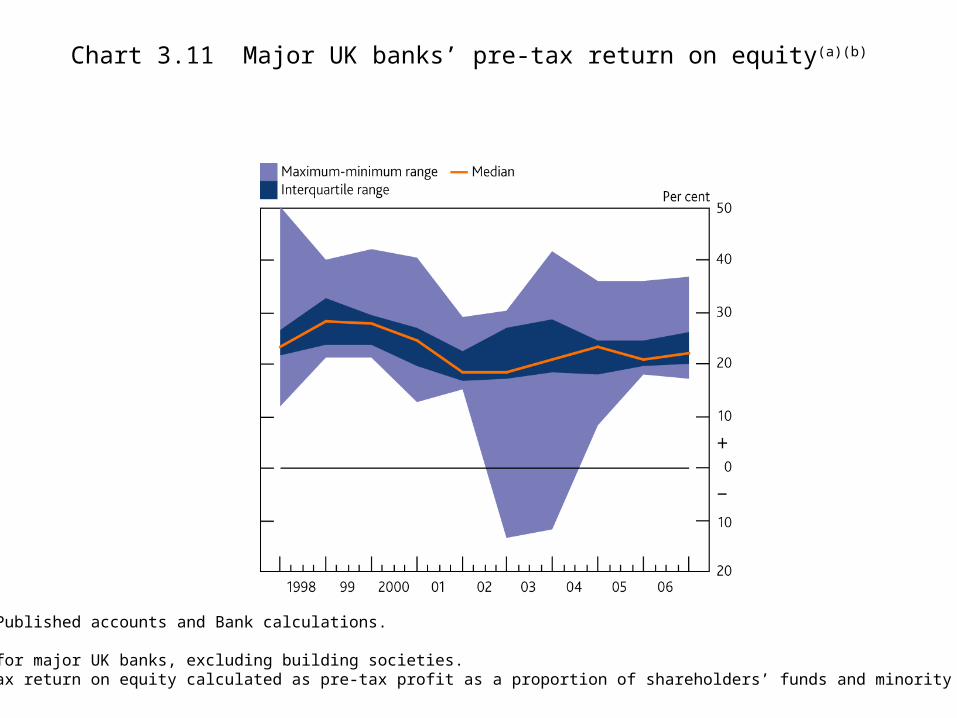
Chart 3.11 Major UK banks’ pre-tax return on equity(a)(b)
Sources: Published accounts and Bank calculations.
(a) Data for major UK banks, excluding building societies.(b) Pre-tax return on equity calculated as pre-tax profit as a proportion of shareholders’ funds and minority interests.
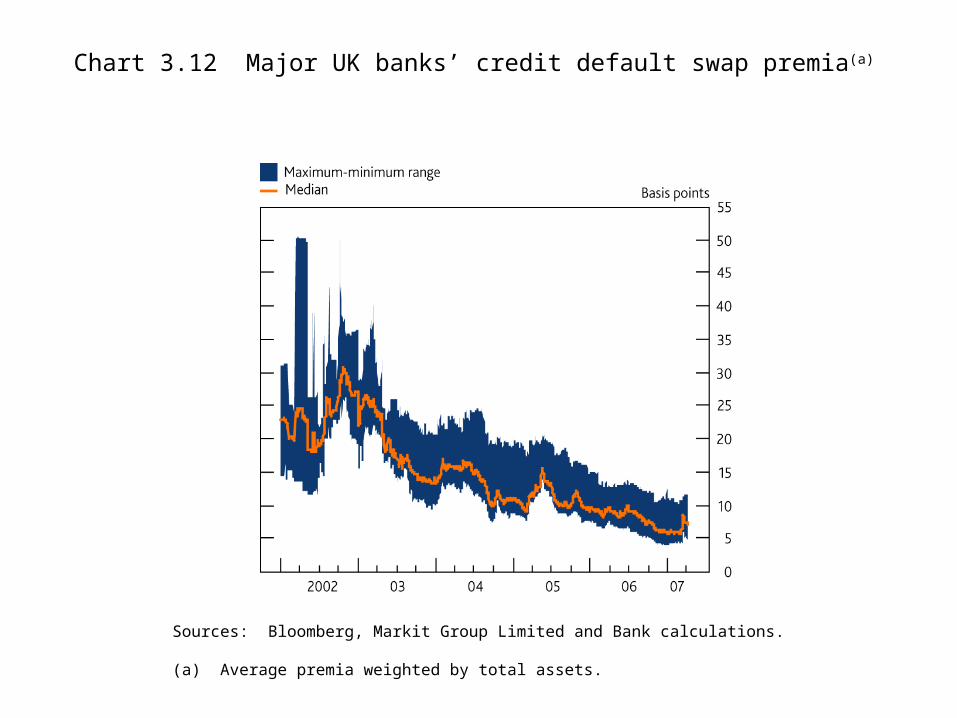
Chart 3.12 Major UK banks’ credit default swap premia(a)
Sources: Bloomberg, Markit Group Limited and Bank calculations.
(a) Average premia weighted by total assets.

Table 3.C Spread-for-rating comparison(a)
Source: JPMorgan Chase & Co.
(a) From JPMorgan Chase & Co. (2006), Understanding CPDOs and Credit Derivatives Handbook, December.
(b) Under typical assumptions. iTraxx is the name of a family of credit default swap index products covering regions of Europe, Japan and non-Japan Asia. The constituents of the indices are changed every six months. The series referred to in this table is the European investment-grade series.
Ratings Underlying Indicative spread(basis points)
AAA Corporate bonds <5
AAA UK credit card asset-backed security (ABS) 15
AAA iTraxx series 6, 6% to 9% standard tranche(b) 22
AAA Commercial mortgage-backed security 25
AAA Cash-flow collateralised debt obligation of mezzanine ABS (average life seven to nine years)
32
AAA Constant proportion debt obligation (CPDO) 200
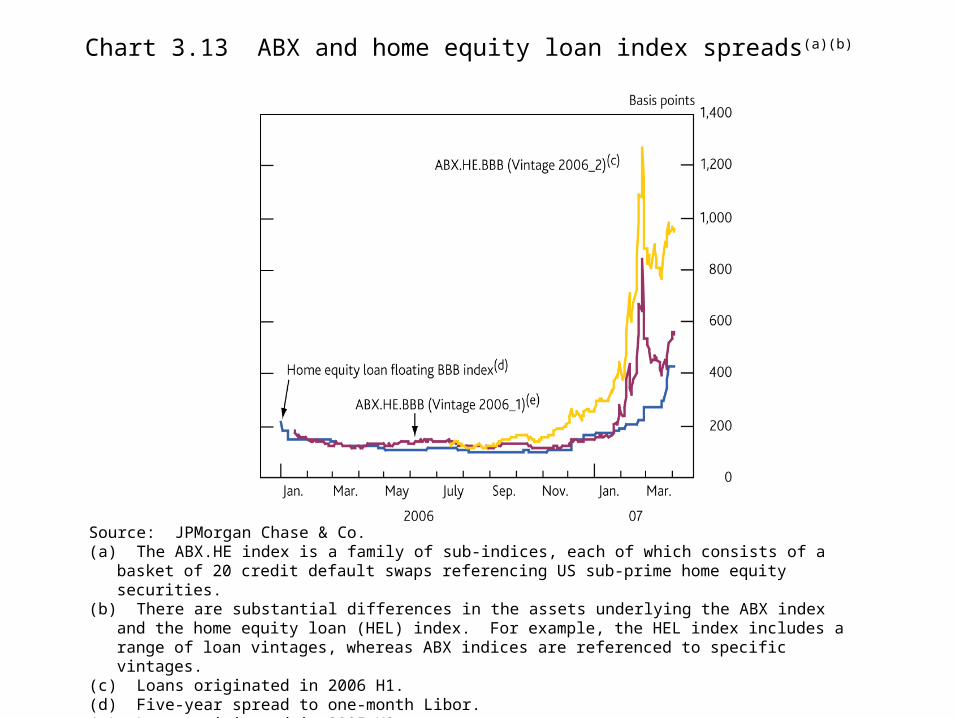
Chart 3.13 ABX and home equity loan index spreads(a)(b)
Source: JPMorgan Chase & Co.(a) The ABX.HE index is a family of sub-indices, each of which consists of a basket of 20 credit default
swaps referencing US sub-prime home equity securities.(b) There are substantial differences in the assets underlying the ABX index and the home equity loan
(HEL) index. For example, the HEL index includes a range of loan vintages, whereas ABX indices are referenced to specific vintages.
(c) Loans originated in 2006 H1.(d) Five-year spread to one-month Libor.(e) Loans originated in 2005 H2.

Chart 3.14 Concentration in natural gas futures(a)
Source: Commodity Futures Trading Commission.
(a) Top four or less large traders’ share of total open interest in New York Mercantile Exchange Henry Hub gas swap contracts.

Section 3 : Box 6

Chart A Impact of ‘severe stress scenarios’ affecting vulnerabilities(a)
Sources: Published accounts and Bank calculations.
(a) Total impact for major UK banks of individual scenarios over a three-year horizon, expressed as a percentage of current Tier 1 capital. Central bands show quantified estimates of the scale of loss under each scenario, wider bands calibrate some uncertainties around these estimates. The top bar presents the latest results and the bottom bar the July 2006 Report results.

Chart B Sensitivity analysis around severe stress scenarios(a)
Sources: Published accounts and Bank calculations.(a) The black bars show the central estimate of impact and the grey ones the range around it under the severe
scenarios as suggested by sensitivity analysis.(b) Unsecured write-offs at US 2001 Q3–2004 Q2 average levels.(c) Unsecured write-offs at Hong Kong 2001 Q3–2004 Q2 average levels.(d) Interest rates in the United States remaining flat.(e) Sterling depreciating in trade-weighted terms. (f) Property price shock in the United Kingdom and Europe.


