68 Section 4: Home Mortgage Disclosure Act (HMDA) Data Analysis Introduction The Federal Financial Institutions Examination Council (FFIEC) gathers data on home mortgage activity from the federal agencies that regulate the home mortgage industry. The data contain variables that facilitate analysis of mortgage lending activity, such as race, income, census tract, loan type, and loan purpose. The FFIEC provides the Home Mortgage Disclosure Act (HMDA) databases and retrieval software on compact disc. Data can be summarized within the software package or downloaded in its raw form for analysis. For this analysis, the FFIEC databases were utilized for 1997 through 2005. The data reported here are summarized using tables, charts, and maps provided at the end of the section. Table 4.1 and 4.2, on pages 75 and 76 compare the loan activity in Waco with McLennan County as a whole. Tables 4.3 and 4.4, on pages 77 and 78, and Charts 4.1 through 4.4, on pages 79 and 80, provide information for the county. The maps, provided at the end of this section, present data by census tract for the county. The analysis will focus on the tracts within Waco and provides a description of the mortgage industry specific to the city. 4.1. Analysis Table 4.1 examines home loan activities in Waco and McLennan County. The data are presented by loan type, ethnicity, income, and loan purpose. In the county, White applicants represented the largest number of loan applicants at 68,651. Origination rates (the percentage of applications that result in loans being made) for Whites were over 55 percent. African-Americans were the next largest applicant group with 7,975 applications submitted and an origination rate of over 36 percent. Hispanics had 6,199 applications and an origination rate of about 49 percent. Asian origination rates were at about 51 percent, but there were only 784 applications reported. High- income applicants showed both the highest number of applications, at 67,240, and the highest origination rate, at 54 percent. Both the number of applications and the origination rates drop significantly for all other income groups, with 10,310 applications from middle-income applicants and an origination rate of over 34 percent. Conventional loans account for the largest number of
Transcript
68
Section 4: Home Mortgage Disclosure Act (HMDA) Data Analysis
Introduction The Federal Financial Institutions Examination Council (FFIEC) gathers data on home mortgage activity from the federal agencies that regulate the home mortgage industry. The data contain variables that facilitate analysis of mortgage lending activity, such as race, income, census tract, loan type, and loan purpose. The FFIEC provides the Home Mortgage Disclosure Act (HMDA) databases and retrieval software on compact disc. Data can be summarized within the software package or downloaded in its raw form for analysis. For this analysis, the FFIEC databases were utilized for 1997 through 2005. The data reported here are summarized using tables, charts, and maps provided at the end of the section. Table 4.1 and 4.2, on pages 75 and 76 compare the loan activity in Waco with McLennan County as a whole. Tables 4.3 and 4.4, on pages 77 and 78, and Charts 4.1 through 4.4, on pages 79 and 80, provide information for the county. The maps, provided at the end of this section, present data by census tract for the county. The analysis will focus on the tracts within Waco and provides a description of the mortgage industry specific to the city.
4.1. Analysis Table 4.1 examines home loan activities in Waco and McLennan County. The data are presented by loan type, ethnicity, income, and loan purpose. In the county, White applicants represented the largest number of loan applicants at 68,651. Origination rates (the percentage of applications that result in loans being made) for Whites were over 55 percent. African-Americans were the next largest applicant group with 7,975 applications submitted and an origination rate of over 36 percent. Hispanics had 6,199 applications and an origination rate of about 49 percent. Asian origination rates were at about 51 percent, but there were only 784 applications reported. High-income applicants showed both the highest number of applications, at 67,240, and the highest origination rate, at 54 percent. Both the number of applications and the origination rates drop significantly for all other income groups, with 10,310 applications from middle-income applicants and an origination rate of over 34 percent. Conventional loans account for the largest number of
69
applications for loan type, at 92,556, with an origination rate of over 45 percent. Home purchase loans show the highest number of applications for loan purpose, at 56,450, and the highest origination rate of about 48 percent. Home improvement loans had the second highest origination rate at over 46 percent with 10,270 loan applications. Refinance loans show 42,945 applications and an origination rate of over 42 percent. Isolating the tracts within Waco for Loan Type, “Conventional” shows the highest number of loan applications at 40,908 and the highest percentage of loan originations at about 47 percent of all applications. FHA loans show an origination rate of about 46 percent and VA and other loans origination rates of over 56 percent. For loan purpose, about 48 percent of home purchase loans were originated out of 29,552 applications. The origination rates for home improvement and refinance loans were over 46 percent. In Waco, White applicants had the highest origination rate of nearly 60 percent and the highest number of loan applications at 28,662. The origination rate for Hispanics was over 49 percent with 4,284 applications. The origination rate for African-Americans was over 39 percent with 3,662 applications. The origination rate for the very low-income group was over 26 percent, compared to over 56 percent in high-income group. Table 4.2 displays the HMDA data for the same data categories (Loan Type, Ethnicity, Income, and Loan Purpose). On this table, however, percentages are taken within category, rather than demonstrating the percentage of applications that result in loan originations. For example, the first percentage in the “% of Originations” column indicates that 84.0 percent of originations in the county were for conventional loans compared to a 45.2 percent origination rate in Table 4.1. For comparison, ethnic percentages were included under the “%Pop.” column to compare the percentage of originations by ethnic group to their percentage in the population. Within the “Loan Type” category, “Conventional” shows the highest percentage at 84 percent of all originations in McLennan County. FHA loans, which are government insured and have more stringent lending criteria, were about 11 percent of all originations. For Ethnicity, “White” shows the highest percentage of originations at nearly 77 percent of the total originations in the county. The percentage of Whites in the population was about 72 percent.
70
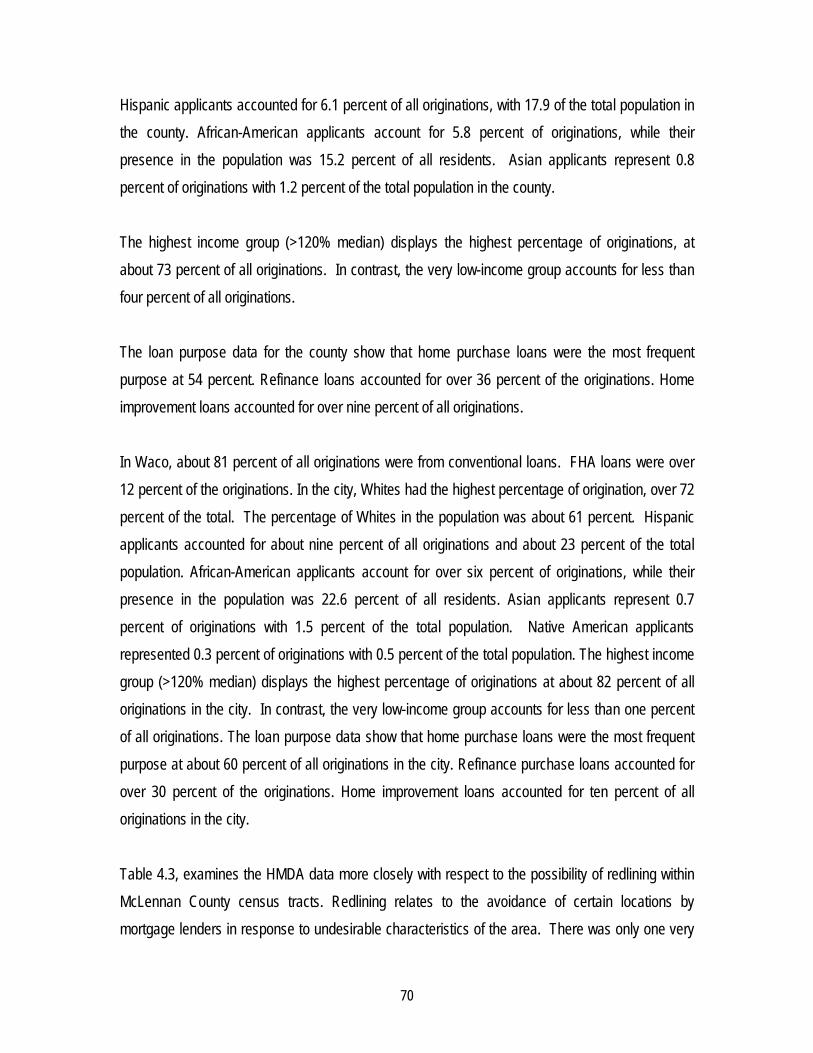
Hispanic applicants accounted for 6.1 percent of all originations, with 17.9 of the total population in the county. African-American applicants account for 5.8 percent of originations, while their presence in the population was 15.2 percent of all residents. Asian applicants represent 0.8 percent of originations with 1.2 percent of the total population in the county. The highest income group (>120% median) displays the highest percentage of originations, at about 73 percent of all originations. In contrast, the very low-income group accounts for less than four percent of all originations. The loan purpose data for the county show that home purchase loans were the most frequent purpose at 54 percent. Refinance loans accounted for over 36 percent of the originations. Home improvement loans accounted for over nine percent of all originations. In Waco, about 81 percent of all originations were from conventional loans. FHA loans were over 12 percent of the originations. In the city, Whites had the highest percentage of origination, over 72 percent of the total. The percentage of Whites in the population was about 61 percent. Hispanic applicants accounted for about nine percent of all originations and about 23 percent of the total population. African-American applicants account for over six percent of originations, while their presence in the population was 22.6 percent of all residents. Asian applicants represent 0.7 percent of originations with 1.5 percent of the total population. Native American applicants represented 0.3 percent of originations with 0.5 percent of the total population. The highest income group (>120% median) displays the highest percentage of originations at about 82 percent of all originations in the city. In contrast, the very low-income group accounts for less than one percent of all originations. The loan purpose data show that home purchase loans were the most frequent purpose at about 60 percent of all originations in the city. Refinance purchase loans accounted for over 30 percent of the originations. Home improvement loans accounted for ten percent of all originations in the city. Table 4.3, examines the HMDA data more closely with respect to the possibility of redlining within McLennan County census tracts. Redlining relates to the avoidance of certain locations by mortgage lenders in response to undesirable characteristics of the area. There was only one very
71
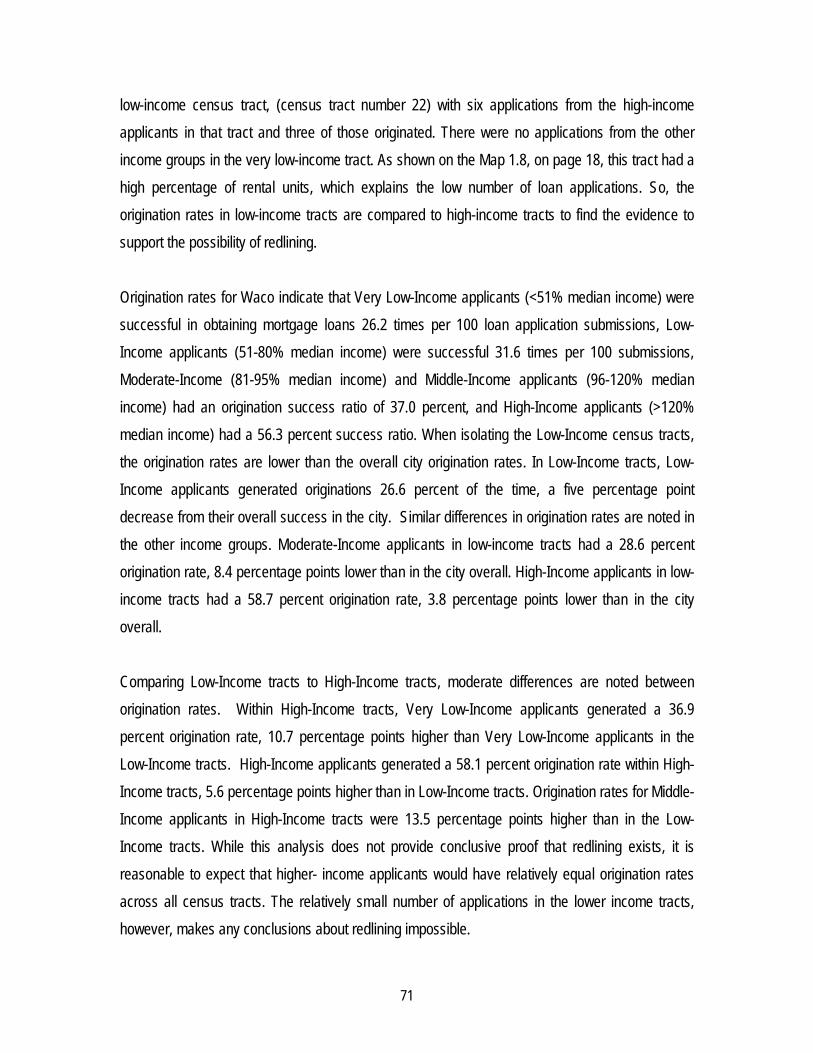
low-income census tract, (census tract number 22) with six applications from the high-income applicants in that tract and three of those originated. There were no applications from the other income groups in the very low-income tract. As shown on the Map 1.8, on page 18, this tract had a high percentage of rental units, which explains the low number of loan applications. So, the origination rates in low-income tracts are compared to high-income tracts to find the evidence to support the possibility of redlining. Origination rates for Waco indicate that Very Low-Income applicants (<51% median income) were successful in obtaining mortgage loans 26.2 times per 100 loan application submissions, Low-Income applicants (51-80% median income) were successful 31.6 times per 100 submissions, Moderate-Income (81-95% median income) and Middle-Income applicants (96-120% median income) had an origination success ratio of 37.0 percent, and High-Income applicants (>120% median income) had a 56.3 percent success ratio. When isolating the Low-Income census tracts, the origination rates are lower than the overall city origination rates. In Low-Income tracts, Low-Income applicants generated originations 26.6 percent of the time, a five percentage point decrease from their overall success in the city. Similar differences in origination rates are noted in the other income groups. Moderate-Income applicants in low-income tracts had a 28.6 percent origination rate, 8.4 percentage points lower than in the city overall. High-Income applicants in low-income tracts had a 58.7 percent origination rate, 3.8 percentage points lower than in the city overall. Comparing Low-Income tracts to High-Income tracts, moderate differences are noted between origination rates. Within High-Income tracts, Very Low-Income applicants generated a 36.9 percent origination rate, 10.7 percentage points higher than Very Low-Income applicants in the Low-Income tracts. High-Income applicants generated a 58.1 percent origination rate within High-Income tracts, 5.6 percentage points higher than in Low-Income tracts. Origination rates for Middle-Income applicants in High-Income tracts were 13.5 percentage points higher than in the Low-Income tracts. While this analysis does not provide conclusive proof that redlining exists, it is reasonable to expect that higher- income applicants would have relatively equal origination rates across all census tracts. The relatively small number of applications in the lower income tracts, however, makes any conclusions about redlining impossible.
72
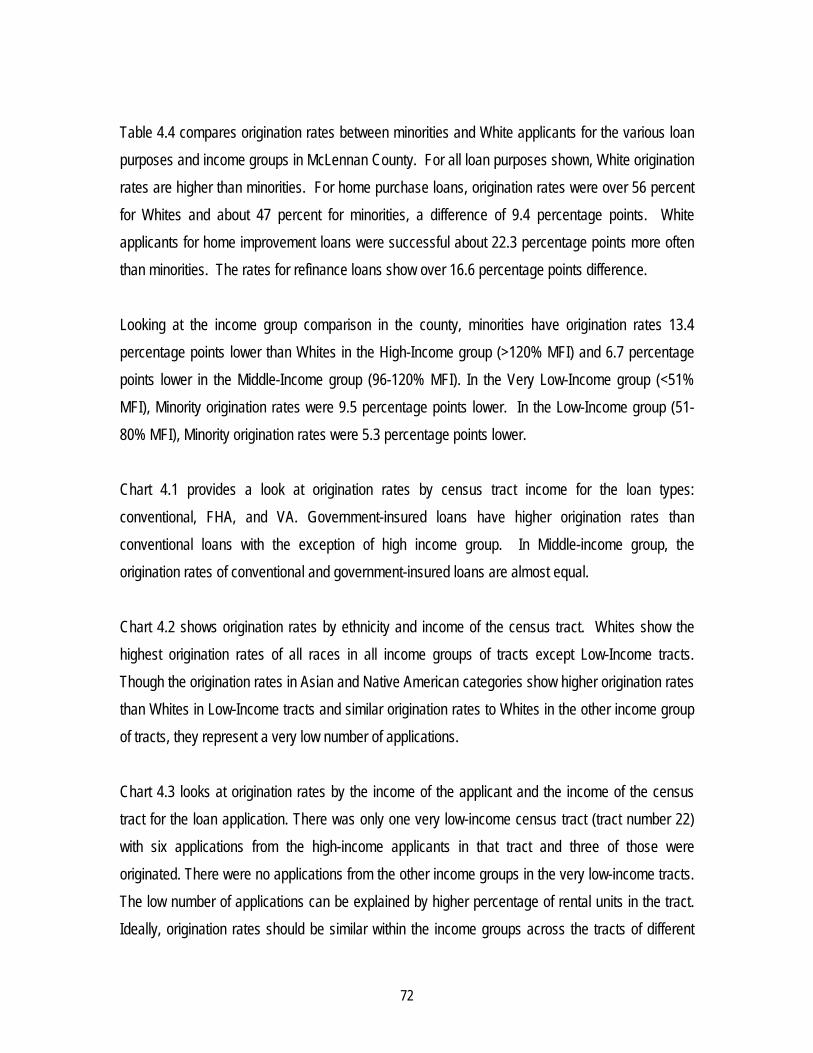
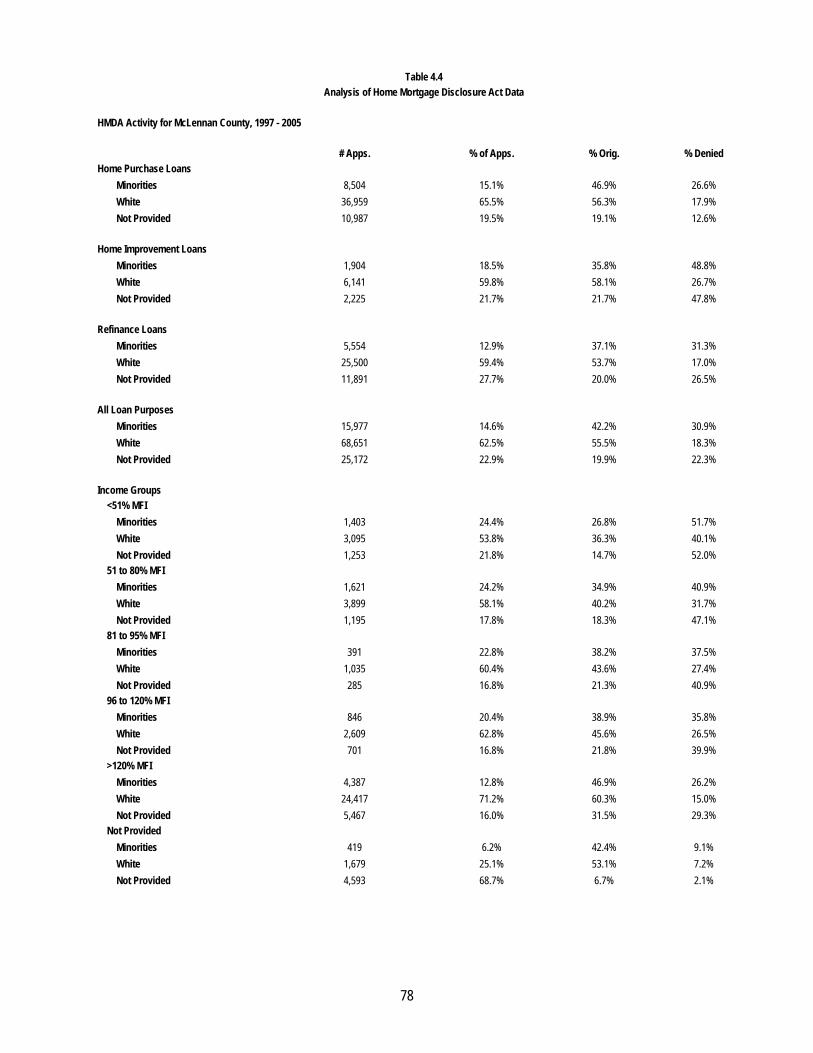
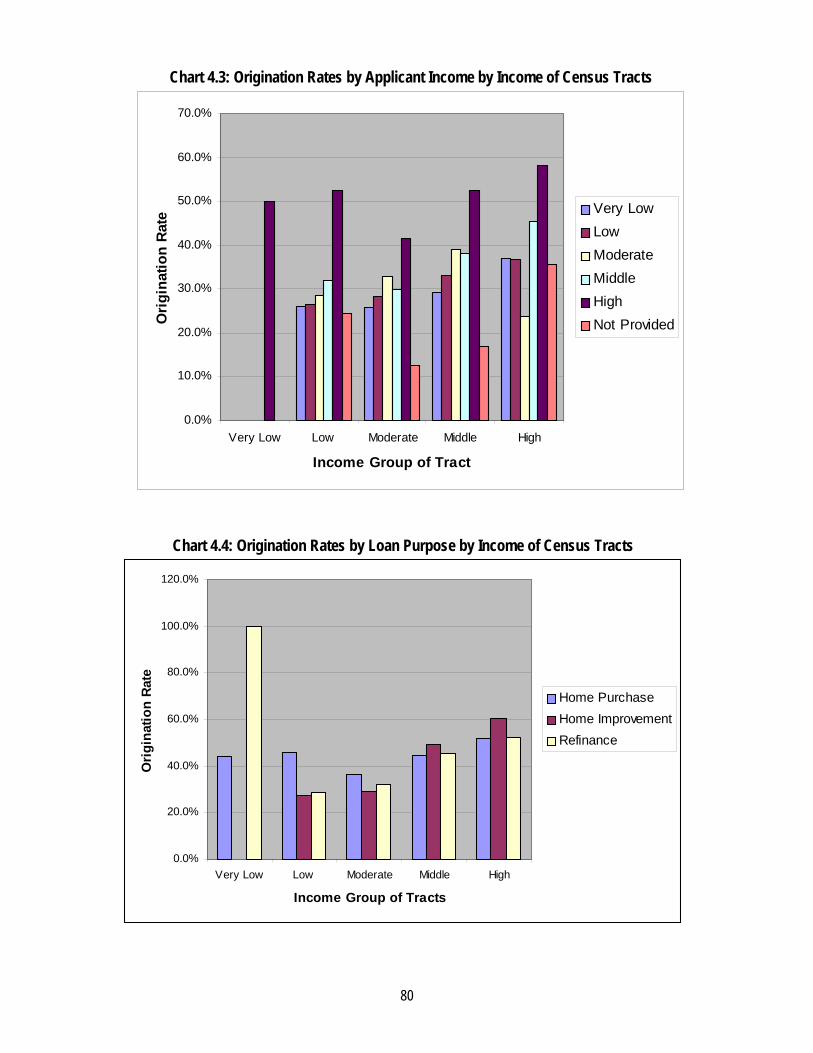
Table 4.4 compares origination rates between minorities and White applicants for the various loan purposes and income groups in McLennan County. For all loan purposes shown, White origination rates are higher than minorities. For home purchase loans, origination rates were over 56 percent for Whites and about 47 percent for minorities, a difference of 9.4 percentage points. White applicants for home improvement loans were successful about 22.3 percentage points more often than minorities. The rates for refinance loans show over 16.6 percentage points difference. Looking at the income group comparison in the county, minorities have origination rates 13.4 percentage points lower than Whites in the High-Income group (>120% MFI) and 6.7 percentage points lower in the Middle-Income group (96-120% MFI). In the Very Low-Income group (<51% MFI), Minority origination rates were 9.5 percentage points lower. In the Low-Income group (51-80% MFI), Minority origination rates were 5.3 percentage points lower. Chart 4.1 provides a look at origination rates by census tract income for the loan types: conventional, FHA, and VA. Government-insured loans have higher origination rates than conventional loans with the exception of high income group. In Middle-income group, the origination rates of conventional and government-insured loans are almost equal. Chart 4.2 shows origination rates by ethnicity and income of the census tract. Whites show the highest origination rates of all races in all income groups of tracts except Low-Income tracts. Though the origination rates in Asian and Native American categories show higher origination rates than Whites in Low-Income tracts and similar origination rates to Whites in the other income group of tracts, they represent a very low number of applications. Chart 4.3 looks at origination rates by the income of the applicant and the income of the census tract for the loan application. There was only one very low-income census tract (tract number 22) with six applications from the high-income applicants in that tract and three of those were originated. There were no applications from the other income groups in the very low-income tracts. The low number of applications can be explained by higher percentage of rental units in the tract. Ideally, origination rates should be similar within the income groups across the tracts of different
73
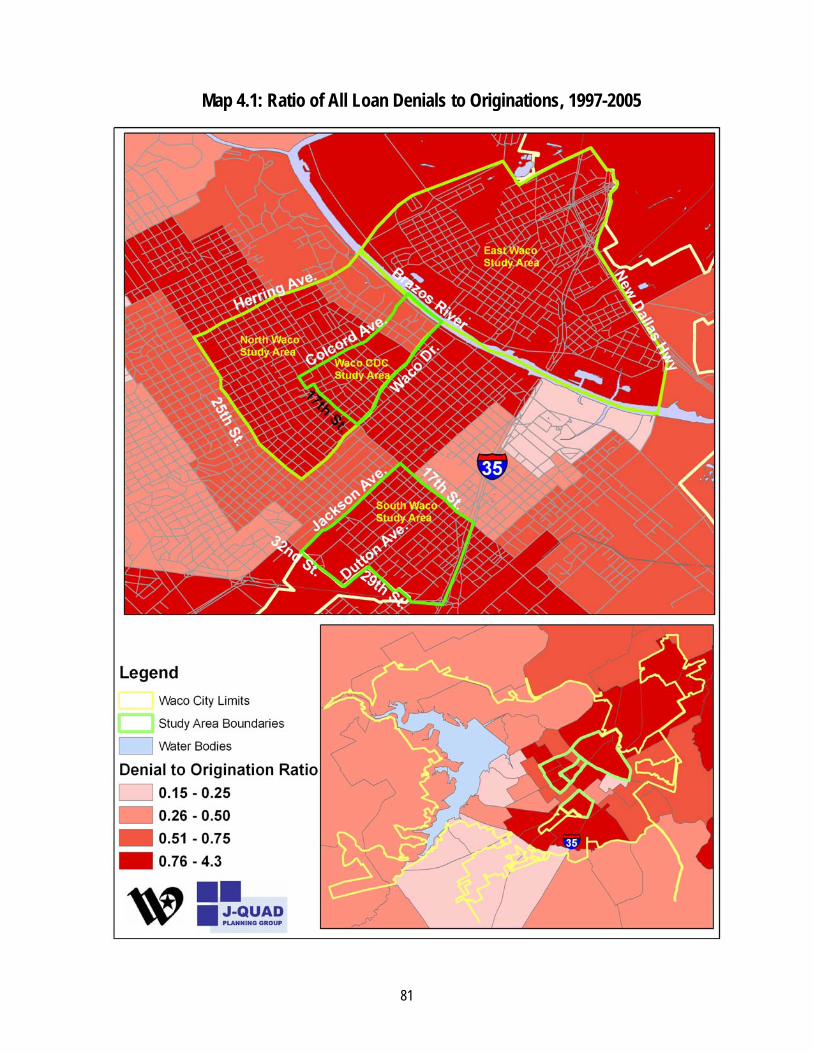
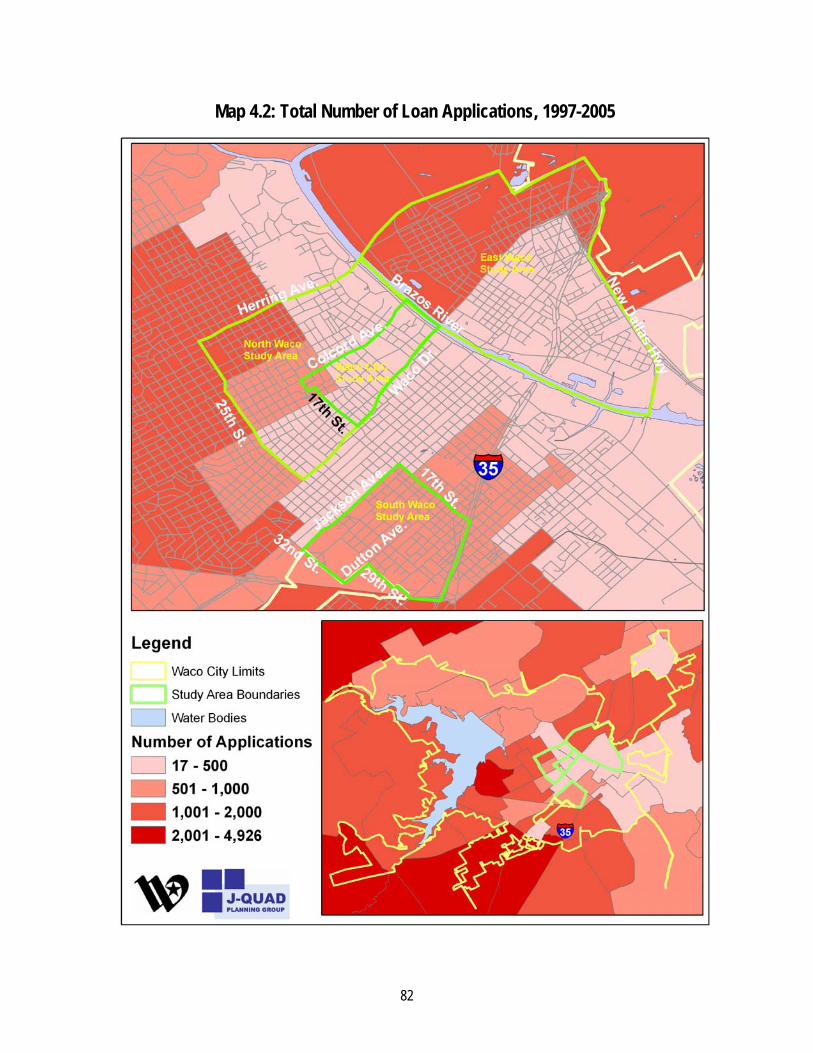
incomes. The origination rates of all the income groups increase as the tract income increases. This indicates that families with similar income are more likely to be successful if they are buying in a higher income census tract, which suggests redlining may be occurring in lower income tracts in the community. The relatively small number of applications in the lower income tracts, however, makes any conclusions about redlining impossible. Chart 4.4 looks at origination rates by loan purpose and the income of the census tract. Applications for all loan types have a higher success rate as the tract income increases, as do home improvement loans, peaking at 60 percent for the High-Income tracts. The origination rate of refinance loans in Very Low-income tracts at 100 percent represents only three applications. Home purchase and refinance loans have similar origination rates in Middle- and High-income tracts and in Low- and Moderate-income tracts home purchase loans have higher origination rates than refinance loans. Home improvement loans show the highest origination rates in Middle- and High-income categories and the lowest origination rates in the Low- and Moderate-income tracts. Maps 4.1 and 4.3 through 4.6 look at loan activity by census tract. The ratio of denials to originations was calculated for each loan purpose and loan type. Tracts shown in the darkest red indicate those areas where 75 or more applications are denied for every 100 applications that are originated. The red areas show 50 to 75 applications denied for every 100 applications originated. The mauve areas show 25 to 50 applications denied for every 100 applications originated. The pink areas show 0 to 25 applications denied for every 100 applications originated. Map 4.2 shows the total number of loan originations by census tract. Less active areas are shown in the lighter colors, with the most active areas in dark red. Unlike the other maps, the light areas are meant to indicate areas of concern, either for a lack of loan activity or for their low rate of application originations in relation to denials. Maps 4.3 and 4.4 compare the ratio of loan denials to originations for Conventional loans and Government Backed loans. Maps 4.5 and 4.6 compare the ratio for home purchase loans and home improvement loans. A look at reasons for denial showed that the majority are related to the applicants’ credit history, debt-to-income ratio, and collateral. In Waco, about 3,630 denials (51.0%) were related to the
74
applicants’ credit history in the eight years of the study. Nearly 1,140 (16.1%) denials were related to the applicants’ debt-to-income ratio, and 808 denials (11.4%) were blamed on collateral. Other possible reasons for not originating a loan included incomplete applications, employment history, mortgage insurance denied, unverifiable information, and insufficient cash for downpayment and/or closing costs.
4.2. Conclusions In Waco, the least success in loan origination was found in the refinance loan sector and the highest success was in the home purchase loan sector. These results are similar to the results in McLennan County overall. During the period between 1997 and 2005, the majority of loan denials were related to the applicants’ credit history. Overall, the origination rates among Whites were higher than that of minorities in all loan types home purchase, home improvement and refinance loans. Home purchase loans were the most frequent loan type in the city and the county. Though, the Hispanics accounted for the second highest number of applications after Whites, the percentage of loan applications and originations were lower compared to their percentage in population in the city. Similarly, lower number of applications and origination rates are noted among African-Americans. Though there is a disparity in the origination rates between Hispanics and Whites, the difference is not as high as the difference in loan applications in comparison to the population size of Hispanics. This indicates that the issue is more with the lack of applications from Hispanics than with the loan denials. The possible reasons for lower number of applications from Hispanics could be due to language and cultural barriers that impede them in understanding the loan applications and mortgage process. Among African-Americans the issue is both the lack of applications and the lower origination rates.
Overall, the mortgage markets seems to have peaked in 2000 and 2001 Opportunities still exist for borrowers to buy housing or refinance existing higher interest loans. Rising interest rates appear to be having an impact on lending activity in the city, with the number of applications slowing in recent years.
75
Table 4.1
Home Mortgage Disclosure Act (HMDA) Analysis Comparison of Number of Loan Applications and Origination Rates
Waco and McLennan County 1997 - 2005
Waco McLennan County Number Origin. Number Origin. of App.s Rate of App.s Rate Loan Type: Conventional 40,908 46.6% 92,556 45.2% FHA 6,340 45.8% 12,104 43.7% VA & Other 2,895 56.4% 5,140 52.7% Ethnicity: Native 145 51.7% 536 47.0% Asian 313 56.2% 784 50.8% Black 3,662 39.2% 7,975 36.1% Hispanic 4,284 49.3% 6,199 48.7% White 28,662 59.8% 68,651 55.5% Other 300 46.7% 483 39.3% Not Provided 8,212 28.5% 16,479 27.4% Unknown 4,565 4.4% 8,693 5.4% Income: <51% median (very low) 652 26.2% 5,751 34.1% 51-80% median (low) 2,662 31.6% 6,714 33.0% 81-95% median (moderate) 1,712 37.0% 7,184 40.5% 96-120% median (middle) 4,155 37.0% 10,310 34.3% >120% median (high) 34,271 56.3% 67,240 54.0% Unknown 6,691 17.1% 12,601 23.1% Loan Purpose: Home Purchase 29,552 47.5% 56,450 47.6% Home Improvement 5,104 46.4% 10,270 46.1% Refinance 15,377 46.3% 42,945 42.2% Multifamily Dwelling 110 72.7% 135 73.3% Totals 50,143 47.1% 109,800 45.4%
76
Table 4.2
Home Mortgage Disclosure Act (HMDA) Analysis Comparison of Originations Within Categories
City of Waco and and McLennan County 1997- 2005
Waco McLennan County
# of % of %Pop. # of % of %Pop. Originations Originations Originations Originations
Loan Type: Conventional 19,083 80.8% 41,846 84.0% FHA 2,903 12.3% 5,290 10.6% VA & Other 1,633 6.9% 2,679 5.4% Ethnicity: Native 75 0.3% 0.5% 252 0.5% 0.5% Asian 176 0.7% 1.5% 398 0.8% 1.2% Black 1,435 6.1% 22.6% 2,881 5.8% 15.2% Hispanic 2,112 8.9% 23.6% 3,017 6.1% 17.9% White 17,139 72.6% 60.8% 38,102 76.5% 72.2% Other 140 0.6% 12.4% 190 0.4% 9.2% Not Provided 2,341 9.9% 4,509 9.1% Unknown 201 0.9% 498 1.0% Income: <51% median 171 0.7% 1,962 3.9% 51-80% median 841 3.6% 2,216 4.4% 81-95% median 634 2.7% 2,910 5.8% 96-120% median 1,538 6.5% 3,537 7.1% >120% median 19,293 81.7% 36,317 72.9% Unknown 1,142 4.8% 2,905 5.8% Loan Purpose: Home Purchase 14,048 59.5% 26,887 53.9% Home Improvement 2,369 10.0% 4,734 9.5% Refinance 7,122 30.2% 18,127 36.4% Multifamily 80 0.3% 99 0.2% Totals 23,619 100.0% 49,847 100.0%
77
Table 4.3
Analysis of Home Mortgage Disclosure Act Data, 1997-2005 Analysis of Redlining in Low-Income Census Tracts
McLennan County Number of Origination
Applications Rate Low-Income Tracts <51% median 375 26.1% 51-80% median 447 26.6% 81-95% median 269 28.6% 96-120% median 335 31.9% >120% median 1,745 52.5% Unknown 341 24.6% High-Income Tracts <51% median 1,427 36.9% 51-80% median 1,513 36.7% 81-95% median 6,185 23.7% 96-120% median 2,652 45.5% >120% median 34,307 58.1% Unknown 3,833 35.7% Difference Between High and Low Tracts (percentage point difference) <51% median 10.7% 51-80% median 10.1% 81-95% median -4.9% 96-120% median 13.5% >120% median 5.6% Origination Rates for Waco <51% median 26.2% 51-80% median 31.6% 81-95% median 37.0% 96-120% median 37.0% >120% median 56.3% Unknown 17.1%
78
Table 4.4 Analysis of Home Mortgage Disclosure Act Data
HMDA Activity for McLennan County, 1997 - 2005 # Apps. % of Apps. % Orig. % Denied Home Purchase Loans Minorities 8,504 15.1% 46.9% 26.6% White 36,959 65.5% 56.3% 17.9% Not Provided 10,987 19.5% 19.1% 12.6% Home Improvement Loans Minorities 1,904 18.5% 35.8% 48.8% White 6,141 59.8% 58.1% 26.7% Not Provided 2,225 21.7% 21.7% 47.8% Refinance Loans Minorities 5,554 12.9% 37.1% 31.3% White 25,500 59.4% 53.7% 17.0% Not Provided 11,891 27.7% 20.0% 26.5% All Loan Purposes Minorities 15,977 14.6% 42.2% 30.9% White 68,651 62.5% 55.5% 18.3% Not Provided 25,172 22.9% 19.9% 22.3% Income Groups <51% MFI Minorities 1,403 24.4% 26.8% 51.7% White 3,095 53.8% 36.3% 40.1% Not Provided 1,253 21.8% 14.7% 52.0% 51 to 80% MFI Minorities 1,621 24.2% 34.9% 40.9% White 3,899 58.1% 40.2% 31.7% Not Provided 1,195 17.8% 18.3% 47.1% 81 to 95% MFI Minorities 391 22.8% 38.2% 37.5% White 1,035 60.4% 43.6% 27.4% Not Provided 285 16.8% 21.3% 40.9% 96 to 120% MFI Minorities 846 20.4% 38.9% 35.8% White 2,609 62.8% 45.6% 26.5% Not Provided 701 16.8% 21.8% 39.9% >120% MFI Minorities 4,387 12.8% 46.9% 26.2% White 24,417 71.2% 60.3% 15.0% Not Provided 5,467 16.0% 31.5% 29.3% Not Provided Minorities 419 6.2% 42.4% 9.1% White 1,679 25.1% 53.1% 7.2% Not Provided 4,593 68.7% 6.7% 2.1%
79
Chart 4.1: Origination Rates by Loan Types by Income of Census Tracts
0.0%
10.0%
20.0%
30.0%
40.0%
50.0%
60.0%
Very Low Low Moderate Middle High
Income Group of Tracts
Orig
inat
ion
Rate
Conventional
FHA
VA
Chart 4.2: Origination Rates by Ethnicity by Income of Census Tracts
0.0%
20.0%
40.0%
60.0%
80.0%
100.0%
120.0%
Very Low Low Moderate Middle High
Income Group of Tracts
Orig
inat
ion
Rate
Native
Asian
African-American
Hispanic
White
Other
Not Provided
Unknow n
80
Chart 4.3: Origination Rates by Applicant Income by Income of Census Tracts
0.0%
10.0%
20.0%
30.0%
40.0%
50.0%
60.0%
70.0%
Very Low Low Moderate Middle High
Income Group of Tract
Orig
inat
ion
Rate
Very LowLowModerateMiddleHighNot Provided
Chart 4.4: Origination Rates by Loan Purpose by Income of Census Tracts
0.0%
20.0%
40.0%
60.0%
80.0%
100.0%
120.0%
Very Low Low Moderate Middle High
Income Group of Tracts
Orig
inat
ion
Rate
Home PurchaseHome ImprovementRefinance
81
Map 4.1: Ratio of All Loan Denials to Originations, 1997-2005
82
Map 4.2: Total Number of Loan Applications, 1997-2005
83
Map 4.3: Ratio of Conventional Loan Denials to Originations, 1997-2005
84
Map 4.4: Ratio of Government Backed Loan Denials to Originations, 1997-2005
85
Map 4.5: Ratio of Home Purchase Loan Denials to Originations, 1997-2005
86
Map 4.6: Ratio of Home Improvement Loan Denials to Originations, 1997-2005