4–1 Nevada Division of Water Planning Nevada State Water Plan PART 1 — BACKGROUND AND RESOURCE ASSESSMENT Section 4 Water Resources Background Introduction An understanding of the state’s water resources is a necessary component to the planning and management process. It is the intent of this section to provide the reader with an overview of Nevada’s surface water and groundwater resources. Topography The topography of Nevada and the surrounding areas makes for a unique and diversified climate. Nearly all of Nevada is in the Basin and Range Province of the Intermountain Plateaus, a rugged elevated area between the Rocky Mountains and the Pacific mountain system. The topography of the Basin and Range province is characterized by isolated, long and narrow, roughly north-south trending, parallel mountain ranges and broad, intervening valleys as shown in Figure 4-1. Internal drainage is a significant feature of the hydrology of much of Nevada. About 84 percent of the State is within the Great Basin in which drainage is to low areas in enclosed basins rather than to the sea. Hydrographic Areas The topography and related geology of the State has resulted in complex surface and ground water systems, complicating the management of these resources. In the 1960s, the Nevada State Engineer’s Office and the U.S. Geological Survey (USGS) recognized the need for a systematic identification of the valleys or hydrographic areas throughout Nevada. Such a system was needed in the study, research, development, management and administration of the water resources, both ground-water and surface water. A hydrographic areas map was subsequently developed in 1968 by the USGS and the State Engineer’s Office. This was the first known effort to identify completely and systematically the hydrographic regions and areas of the Nevada. While the 1968 map has undergone some minor revisions, it continues to provide the basis for water planning, management and administration. The current hydrographic area map delineates 256 hydrographic areas within 14 major hydrographic regions and basins (Figure 4-2, Table 4-1). Of the 14 hydrographic regions and basins, only the Snake River Basin and the Colorado River Basin drain to the sea.
Transcript
4–1
Nevada Division of Water Planning
Nevada State Water PlanPART 1 — BACKGROUND AND RESOURCE ASSESSMENT
Section 4Water Resources Background
Introduction
An understanding of the state’s water resources is a necessary component to the planning andmanagement process. It is the intent of this section to provide the reader with an overview ofNevada’s surface water and groundwater resources.
Topography
The topography of Nevada and the surrounding areas makes for a unique and diversified climate.Nearly all of Nevada is in the Basin and Range Province of the Intermountain Plateaus, a ruggedelevated area between the Rocky Mountains and the Pacific mountain system. The topography ofthe Basin and Range province is characterized by isolated, long and narrow, roughly north-southtrending, parallel mountain ranges and broad, intervening valleys as shown in Figure 4-1.
Internal drainage is a significant feature of the hydrology of much of Nevada. About 84 percent ofthe State is within the Great Basin in which drainage is to low areas in enclosed basins rather thanto the sea.
Hydrographic Areas
The topography and related geology of the State has resulted in complex surface and ground watersystems, complicating the management of these resources. In the 1960s, the Nevada State Engineer’sOffice and the U.S. Geological Survey (USGS) recognized the need for a systematic identificationof the valleys or hydrographic areas throughout Nevada. Such a system was needed in the study,research, development, management and administration of the water resources, both ground-waterand surface water. A hydrographic areas map was subsequently developed in 1968 by the USGS andthe State Engineer’s Office. This was the first known effort to identify completely and systematicallythe hydrographic regions and areas of the Nevada. While the 1968 map has undergone some minorrevisions, it continues to provide the basis for water planning, management and administration. Thecurrent hydrographic area map delineates 256 hydrographic areas within 14 major hydrographicregions and basins (Figure 4-2, Table 4-1). Of the 14 hydrographic regions and basins, only theSnake River Basin and the Colorado River Basin drain to the sea.
Nevada State Water Plan
4–2
Figure 4-1 - shaded relief map
Part 1. Section 4 – Water Resources Background
4–3
Figure 4-2 - Hydrographic Regions and Basins
Nevada State Water Plan
4–4
Table 4-1. List of Hydrographic Areas
1. NORTHWEST REGION1. Pueblo Valley2. Continental Lake Valley3. Gridley Lake Valley4. Virgin Valley5. Sage Hen Valley6. Guano Valley7. Swan Lake Valley8. Massacre Lake Valley9. Long Valley10. Macy Flat11. Coleman Valley12. Mosquito Valley13. Warner Valley14. Surprise Valley15. Boulder Valley16. Duck Lake Valley
2. BLACK ROCK DESERT REGION17. Pilgrim Flat18. Painter Flat19. Dry Valley20. Sano Valley21. Smoke Creek Desert22. San Emidio Desert23. Granite Basin24. Hualapai Flat25. High Rock Lake Valley26. Mud Meadow27. Summit Lake Valley28. Black Rock Desert29. Pine Forest Valley30. Kings River Valley
(A) Rio King Subarea(B) Sod House Subarea
31. Desert Valley32. Silver State Valley33. Quinn River Valley
(A) Orovada Subarea(B) McDermitt Subarea
3. SNAKE RIVER BASIN34. Little Owyhee River Area35. South Fork Owyhee River Area36. Independence Valley37. Owyhee River Area38. Bruneau River Area39. Jarbidge River Area40. Salmon Falls Creek Area41. Goose Creek Area
4. HUMBOLDT RIVER BASIN42. Marys River Area43. Starr Valley Area44. North Fork Area45. Lamoille Valley46. South Fork Area47. Huntington Valley48. Dixie Creek - Tenmile Creek Area49. Elko Segment50. Susie Creek Area51. Maggie Creek Area52. Marys Creek Area53. Pine Valley54. Crescent Valley55. Carico Lake Valley56. Upper Reese River Valley57. Antelope Valley58. Middle Reese River Valley59. Lower Reese River Valley60. Whirlwind Valley61. Boulder Flat62. Rock Creek Valley63. Willow Creek Valley64. Clovers Area65. Pumpernickel Valley66. Kelly Creek Area67. Little Humboldt Valley68. Hardscrabble Area69. Paradise Valley70. Winnemucca Segment71. Grass Valley72. Imlay Area73. Lovelock Valley
(A) Oreana Subarea74. White Plains
5. WEST CENTRAL REGION75. Bradys Hot Springs Area76. Fernley Area77. Fireball Valley78. Granite Springs Valley79. Kumiva Valley
6. TRUCKEE RIVER BASIN80. Winnemucca Lake Valley81. Pyramid Lake Valley82. Dodge Flat83. Tracy Segment84. Warm Springs Valley85. Spanish Springs Valley86. Sun Valley87. Truckee Meadows88. Pleasant Valley89. Washoe Valley90. Lake Tahoe Basin91. Truckee Canyon Segment
7. WESTERN REGION92. Lemmon Valley
(A) Western Part(B) Eastern Part
93. Antelope Valley94. Bedell Flat95. Dry Valley96. Newcomb Lake Valley97. Honey Lake Valley98. Skedaddle Creek Valley99. Red Rock Valley100. Cold Spring Valley
9. WALKER RIVER BASIN106. Antelope Valley107. Smith Valley108. Mason Valley109. East Walker Area110. Walker Lake Valley
(A) Schurz Subarea(B) Lake Subarea(C) Whisky Flat - Hawthorne Subarea
10. CENTRAL REGION111. Alkali Valley (Mineral)
(A) Northern Part(B) Southern Part
112. Mono Valley113. Huntoon Valley114. Teels Marsh Valley115. Adobe Valley116. Queen Valley117. Fish Lake Valley118. Columbus Salt Marsh Valley119. Rhodes Salt Marsh Valley120. Garfield Flat121. Soda Spring Valley
(A) Eastern Part(B) Western Part
122. Gabbs Valley123. Rawhide Flats124. Fairview Valley125. Stingaree Valley126. Cowkick Valley127. Eastgate Valley Area128. Dixie Valley129. Buena Vista Valley130. Pleasant Valley131. Buffalo Valley132. Jersey Valley133. Edwards Creek Valley134. Smith Creek Valley135. Ione Valley136. Monte Cristo Valley137. Big Smoky Valley
(A) Tonopah Flat
(B) Northern Part138. Grass Valley139. Kobeh Valley140. Monitor Valley
(A) Northern Part(B) Southern Part
141. Ralston Valley142. Alkali Spring Valley (Esmeralda)143. Clayton Valley144. Lida Valley145. Stonewall Flat146. Sarcobatus Flat147. Gold Flat148. Cactus Flat149. Stone Cabin Flat150. Little Fish Lake Valley151. Antelope Valley (Eureka & Nye)152. Stevens Basin153. Diamond Valley154. Newark Valley155. Little Smoky Valley
(A) Northern Part(B) Central Part(C) Southern Part
156. Hot Creek Valley157. Kawich Valley158. Emigrant Valley
(A) Groom Lake Valley(B) Papoose Lake Valley
159. Yucca Flat160. Frenchman Flat161. Indian Springs Valley162. Pahrump Valley163. Mesquite Valley (Sandy Valley)164. Ivanpah Valley
(A) Northern Part(B) Southern Part
165. Jean Lake Valley166. Hidden Valley (South)167. Eldorado Valley168. Three Lakes Valley (Northern Part)169. Tikapoo Valley (Tickaboo Valley)
(A) Northern Part(B) Southern Part
170. Penoyer Valley (Sand Spring Valley)
171. Coal Valley172. Garden Valley173. Railroad Valley
(A) Southern Part(B) Northern Part
174. Jakes Valley175. Long Valley176. Ruby Valley177. Clover Valley178. Butte Valley
(A) Northern Part (Round Valley)(B) Southern Part
179. Steptoe Valley180. Cave Valley181. Dry Lake Valley182. Delamar Valley183. Lake Valley184. Spring Valley185. Tippett Valley186. Antelope Valley (White Pine &
Elko)(A) Southern Part(B) Northern Part
187. Goshute Valley188. Independence Valley (Pequop
Valley)
11. GREAT SALT LAKE BASIN189. Thousand Springs Valley
(A) Herrill Siding - Brush Creek Area(B) Toano - Rock Spring Area(C) Montello - Crittenden Creek Area
(Montello Valley)190. Grouse Creek Valley191. Pilot Creek Valley192. Great Salt Lake Desert193. Deep Creek Valley194. Pleasant Valley195. Snake Valley196. Hamlin Valley
12. ESCALANTE DESERT197. Escalante Desert
13. COLORADO RIVER BASIN198. Dry Valley199. Rose Valley200. Eagle Valley201. Spring Valley202. Patterson Valley203. Panaca Valley204. Clover Valley205. Lower Meadow Valley Wash206. Kane Springs Valley207. White River Valley208. Pahroc Valley209. Pahranagat Valley210. Coyote Spring Valley211. Three Lakes Valley (Southern Part)212. Las Vegas Valley213. Colorado Valley214. Piute Valley215. Black Mountains Area216. Garnet Valley (Dry Lake Valley)217. Hidden Valley (North)218. California Wash219. Muddy River Springs Area (Upper
Moapa Valley)220. Lower Moapa Valley221. Tule Desert222. Virgin River Valley223. Gold Butte Area224. Greasewood Basin
14. DEATH VALLEY BASIN225. Mercury Valley226. Rock Valley227. Fortymile Canyon
The climate of Nevada is characterized as semi-arid to arid with precipitation and climate varyingwidely throughout the State. With temperatures that fall below -40EF in the northeast, and rise over120EF in the south, and precipitation that ranges from only three to four inches in Southern Nevadato over 40 inches (and over 300 inches of snowfall) in the Carson Range portion of the Sierra NevadaMountains, Nevada is truly a land of constrasts. Three basic geographical characteristics areresponsible for Nevada’s unusual and diverse climate:
Latitude: Nevada spans approximately seven degrees of latitude, or about 500 miles, from thenorth boundary to the southern tip of the State. As a result, average temperatures are 15E to20EF cooler in the north than the south.
Elevation: The Basin and Range Province, with its wide elevation fluctuations from the valleyfloors to the mountain tops, is another factor responsible for our diverse climate. Elevations varyfrom under 1,000 feet to over 13,000 feet above sea level, with the higher elevations generallyexperiencing lower temperatures and more precipitation.
Continentality: Continentality is the most important factor affecting Nevada’s climate. Thecontinental effect results from the continuous barrier of the Pacific mountain system to the west.Moisture laden winds traveling east from the Pacific Ocean are forced to rise, cool and dropprecipitation as the Pacific mountain system is encountered. The resulting winds entering Nevadaare much drier and provide reduced precipitation. This rainshadow effect is the primary reasonfor Nevada’s dry climate.
Figure 4-3 shows the spatial variability of precipitation in Nevada. With total precipitation averagingapproximately nine inches per year, Nevada is the most arid state in the nation. Monthly and annualfluctuations in precipitation can be significant. Figure 4-4 displays monthly and annual precipitationvariations for three selected precipitation measurement sites in Nevada. Of the total annualprecipitation falling in Nevada, approximately 10 percent results in stream runoff and groundwaterrecharge (Water for Nevada, Nevada’s Water Resources - Report No. 3, State Engineer’s Office,October 1971). The remaining 90 percent is lost through evaporation and transpiration. Likeprecipitation, evaporation is also widely variable. Average lake surface evaporation rates range fromless than 36 inches per year in the west to over 80 inches per year in the south (Figure 4-5).
Nevada State Water Plan
4–6
Figure 4-3 Precipitation
Part 1. Section 4 – Water Resources Background
4–7
1940 1950 1960 1970 1980 1990 2000
Year
0
5
10
15
20
An
nu
al P
reci
pit
atio
n, i
nch
es
Average = 9.5"
Elko
1930 1940 1950 1960 1970 1980 1990 2000
Year
0
2
4
6
8
10
12
An
nu
al P
reci
pit
atio
n, i
nch
es
Average = 4.2"
Las Vegas
1930 1940 1950 1960 1970 1980 1990 2000
Year
0
5
10
15
20
25
30
An
nu
al P
reci
pit
atio
n, i
nch
es
Average = 11.1"
Carson City
J F M A M J J A S O N D
Month
0
0.5
1
1.5
2M
on
thly
Pre
cip
itat
ion
, in
ches
Carson City
J F M A M J J A S O N D
Month
0
0.1
0.2
0.3
0.4
0.5
0.6
Mo
nth
ly P
reci
pit
atio
n, i
nch
es
Las Vegas
J F M A M J J A S O N D
Month
0
0.2
0.4
0.6
0.8
1
1.2
Mo
nth
ly P
reci
pit
atio
n, i
nch
es
Elko
Annual Variations: The average of annualprecipitation is commonly used as an indicatorof the amount of precipitation that could beexpected in a given year. However, annualvariations in precipitation are significantand “average” years are rarely experienced.
Monthly Variations: Precipitation inNevada varies from month to month withmost moisture falling in the winter. Duringthe warmer and drier summer periods, theprecipitation that does occur is the result ofconvective summer thunderstorms whichcan produce brief, but intense rainfall.
Fig. 4-4. Precipitation Variability for 3 Selected Sites
Nevada State Water Plan
4–8
Figure 4-5 Evaporation
Part 1. Section 4 – Water Resources Background
4–9
Surface Water
Surface water is a limited and precious resource in Nevada providing about 70 percent of the totalwater supply used in the state. Spring and summer snowmelt supplies most of the streamflow inNevada. However, isolated summer convective storms probably cause a majority of the streamflowin southern Nevada’s low altitude basins.
Throughout the State, surface water flows can vary widely from year to year and from month tomonth, with maximum discharges generally in May and June as a result of snowmelt in the mountains.With the exception of the Humboldt Basin, most of the surface waters in Nevada’s rivers are theresult of snowmelt occurring in other states such as California, Wyoming, Colorado, and Utah.
Flows in the upper reaches of the larger rivers (Carson, Humboldt, Truckee, Walker) typicallyincrease as one moves downstream. The larger rivers typically follow the flow pattern of a gainingstream in the well-watered mountain reaches and a losing stream in the lower-altitude reaches.Reductions in flow occur due to irrigation, public use, infiltration, and evapotranspiration.
Major Rivers, Lakes and Reservoirs
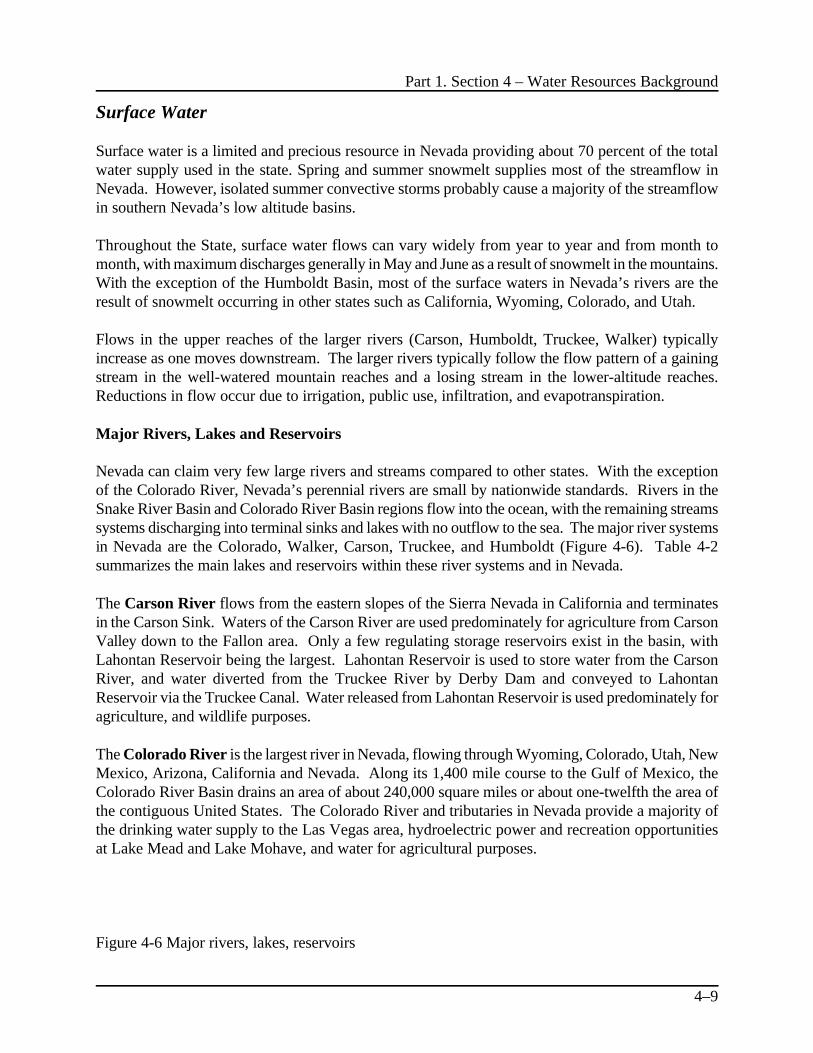
Nevada can claim very few large rivers and streams compared to other states. With the exceptionof the Colorado River, Nevada’s perennial rivers are small by nationwide standards. Rivers in theSnake River Basin and Colorado River Basin regions flow into the ocean, with the remaining streamssystems discharging into terminal sinks and lakes with no outflow to the sea. The major river systemsin Nevada are the Colorado, Walker, Carson, Truckee, and Humboldt (Figure 4-6). Table 4-2summarizes the main lakes and reservoirs within these river systems and in Nevada.
The Carson River flows from the eastern slopes of the Sierra Nevada in California and terminatesin the Carson Sink. Waters of the Carson River are used predominately for agriculture from CarsonValley down to the Fallon area. Only a few regulating storage reservoirs exist in the basin, withLahontan Reservoir being the largest. Lahontan Reservoir is used to store water from the CarsonRiver, and water diverted from the Truckee River by Derby Dam and conveyed to LahontanReservoir via the Truckee Canal. Water released from Lahontan Reservoir is used predominately foragriculture, and wildlife purposes.
The Colorado River is the largest river in Nevada, flowing through Wyoming, Colorado, Utah, NewMexico, Arizona, California and Nevada. Along its 1,400 mile course to the Gulf of Mexico, theColorado River Basin drains an area of about 240,000 square miles or about one-twelfth the area ofthe contiguous United States. The Colorado River and tributaries in Nevada provide a majority ofthe drinking water supply to the Las Vegas area, hydroelectric power and recreation opportunitiesat Lake Mead and Lake Mohave, and water for agricultural purposes.
Figure 4-6 Major rivers, lakes, reservoirs
Nevada State Water Plan
4–10
Table 4-2. Major Lakes and Reservoirs of Nevada and Portions of California
HydrographicRegion
Lake/Reservoir Surface Area,acres
Active StorageCapacity, acre-
feet
Total StorageCapacity, acre-
feet
Carson River Lahontan Reservoir 14,600 317,000 317,000
Snake River Wild Horse Reservoir 2,830 73,500 73,500
Truckee River
Big and Little WashoeLakes
5,800 14,000 38,000
Boca Reservoir 980 40,870 41,110
Donner Lake 800 9,500 Not reported
Independence Lake 700 17,500 Not reported
Lake Tahoe 124,000 744,600 125,000,000
Martis Creek Lake 770 20,400 21,200
Prosser Creek Reservoir 750 28,640 29,840
Pyramid Lake1 111,400(as of 9/30/96)
not applicable 21,760,000 (as of 9/30/96)
Stampede Reservoir 3,440 221,860 226,500
Walker River
Bridgeport Reservoir 2,914 40,500 40,500
Topaz Lake 2,410 61,000 126,000
Walker Lake1 33,500(as of 9/30/96)
notapplicable
2,153,000(as of 9/30/96)
Weber Reservoir 950 13,000 13,000
1Pyramid and Walker lakes are natural terminal lakes with no outlet.
Part 1. Section 4 – Water Resources Background
4–11
The Humboldt River is the longest river contained wholly within the State. The Humboldt Riveroriginates in the Ruby, East Humboldt, Independence and Jarbidge Mountains and flows westwardto terminate in the Humboldt Sink. A majority of the Humboldt River system water is used foragriculture. There are only a few flow regulating reservoirs in the basin, the largest (Rye PatchReservoir) being near the end of the system. As a result, late season irrigation water shortages arecommonplace throughout much of the area above Rye Patch Reservoir.
The Truckee River originates at the northern end of Lake Tahoe in California and terminates atPyramid Lake. Along its course, water is utilized to meet a variety of needs, such as municipal andindustrial, agriculture, hydroelectric power, and wildlife. A portion of the Truckee River flow isdiverted at Derby Dam and is conveyed via the Truckee Canal to Lahontan Reservoir in the CarsonRiver Basin. With numerous upstream reservoirs, mostly in California, the Truckee River is one ofthe most regulated river systems in Nevada.
The Walker River, with its headwaters in California, flows into Nevada and terminates at WalkerLake. Most of the flow of the Walker River system originates in California and is used predominatelyfor agricultural purposes in Nevada and California. The two largest reservoirs on the system (TopazLake located in Nevada and California, Bridgeport Reservoir located wholly in California) are ownedand operated by the Walker River Irrigation District and are predominately used to supply irrigationwater to district members.
Streamflow Forecasts and Data Collection
The collection and analysis of snowpack and streamflow data are essential for proper managementand planning of our surface water resources. A better understanding of each basin’s surface watersystem is made possible through snow depth and streamflow measurements.
Snowpack Measurments and Streamflow Forecasts. Natural Resources Conservation Service(NRCS) operates a series of snow depth measurement stations through the western United States,including Nevada. Utilizing the data collected at these stations, NRCS and National Weather Servicehydrologists develop streamflow and water supply forecasts for the major surface water systems.These forecasts are used to guide water management and emergency management decisions.
Gaging Stations. The USGS is the principal Federal agency which collects surface water data inNevada. The USGS began collecting streamflow data in 1889 with the establishment of a gagingstation on the Truckee River near the Nevada-California state line. During the next six years,additional gaging stations were established in the Humboldt, Carson, Walker and Truckee basins.As of 1996, the USGS surface water quantity monitoring network consists of water dischargemeasurements for 170 gaging stations on streams, canals and drains, 99 peak flow stations andmiscellaneous sites, and five springs; and water levels and contents for 22 lakes and reservoirs. Thegeneral objective of the stream-gaging program is to provide information on, or to develop estimatesof, flow characteristics at any point on any stream.
Other entities collect streamflow data for regional purposes. For example, the Clark County RegionalFlood Control District operates a network of meteorologic and water depth monitoring stations as
Nevada State Water Plan
4–12
part of the District’s Flood Threat Recognition Program..
Streamflow Characteristics. Most of the streamflow in Nevada is the result of runoff from meltingsnow. Runoff patterns in Nevada vary greatly both seasonally and geographically, and are mainlydetermined by precipitation patterns (location and timing) and other climate patterns, such astemperature. Other factors such as surface geology, vegetation, and land use affect the amount ofrunoff entering the rivers and streams. Streamflows are further affected by human-induced influencessuch as diversions and reservoir operations.
Table 4-3 summarizes some basic streamflow characteristics for selected USGS gaging stationsthroughout Nevada (see Figure 4-7 for station locations). As shown, average annual flows varywidely from river to river. Within a given river system, flows fluctuate year to year in response tochanges in precipitation amounts. Some of these annual variations can be dramatic. For instance,at the “Walker River near Wabuska, NV” gaging station, the highest flows for a year exceeded thelowest annual flows by over 50 times. Figure 4-8 depict monthly and annual streamflow variationsfor the Colorado, Humboldt and Truckee rivers.
Water Yields and Committed Resources
The estimated average annual yield from Nevada’s surface water systems is approximately 3.2 millionacre-feet per year (Table 4-4). Generally, Nevada’s surface water sources, such as lakes, streams andsprings, have been fully appropriated and used for many years. In some instances, water may beavailable from these sources during high water years, however storage facilities would be requiredto capture the surplus flows for later use.
Most priority rights for surface water in Nevada were established in the 1800s. Rights to use waterfor irrigation date back to the 1850s in streams draining the Sierra Nevada Mountains and to the1870s and 1880s in the Humboldt River Basin.
Droughts and Floods
Nevada is a land of extremes, with droughts and floods common in our highly variable climate. Yearsof average streamflows are rarely experienced. Periods of high flows followed by low flows are morethe norm in Nevada.
Droughts. Years of below average flows in rivers are not uncommon and many water users areprepared to cope with one year of low streamflows by resorting to supplemental sources such asreservoirs and groundwater. For most of Nevada’s water users, who depend mostly upon surfacewater, problems can begin to occur when below average flows are experienced for two or moreconsecutive years. Over time, reservoir and groundwater levels tend to decline due to increased usesand these supplemental sources may become depleted. Droughts can also create quality problemsfor both surface water and groundwater sources. The decreased flows experienced during a droughttend to result in diminished quality for the remaining water.
Table 4-3. Summary of Streamflow Data for Selected Gaging Stations
Part 1. Section 4 – Water Resources Background
4–13
HydrographicRegion
Gaging Station Name (Number)Period ofRecord
Annual Streamflow Statistics, acre-feet
AverageAnnual
LowestAnnual
HighestAnnual
Carson River
East Fork Carson River nearGardnerville, NV (10309000)
1890-1997 278,800 66,300 655,200
West Fork Carson River atWoodfords, CA (10310000)
1901-97 81,000 18,900 210, 000
Carson River near Carson City, NV(10311000)
1940-97 298,700 42,400 826,800
Carson River near Ft. Churchill,NV (10312000)
1911-97 272,900 26,300 804,400
Colorado River
Virgin River at Littlefield, AZ(09415000)
1930-97 175,600 72,400 504,600
Muddy River near Glendale, NV(09419000)
1913-97 30,600 23,500 35,900
Colorado River below Hoover Dam,AZ-NV (09421500)
1935-97 10,050,000 5,556,000 22,150,000
Humboldt River
Humboldt River at Palisade, NV(10322500)
1903-97 288,800 25,200 1,336,000
Humboldt River near Imlay, NV(10333000)
1935-97 201,000 18,800 1,460,000
Snake RiverOwyhee River above ChinaDiversion Dam near Owyhee, NV(13176000)
1939-84 107,600 33,500 230,800
Truckee River
Truckee River at Farad, CA(10346000)
1909-97 554,500 133,200 1,769,000
Truckee River at Reno, NV(10348000)
1907-96 492,500 76,700 1,701,000
Truckee River below Derby Damnear Wadsworth, NV (10351600)
1918-97 289,100 4,500 1,759,000
Walker River
East Walker River near Bridgeport,CA (10293000)
1922-97 105,800 27,100 320,700
West Walker near Coleville, CA(10296500)
1903-97 202,100 53,900 484,300
Walker River near Wabuska, NV(10301500)
1902-97 123,300 9,300 602,300
Note: Some years of data may be missing within each period of record.Source: U.S. Geological Survey
et Colorado River below Hoover Dam, AZ-NV (09421500)
Table 4-4.Fig. 4-8. Streamflow Variability for 3 Selected Sites
Annual Variations: Streamflows vary from yearto year in response to annual variations inprecipitation amounts upstream of the gagingstations
Monthly Variations: Streamflows in Nevadavary from month to month with most flowoccurring from March through June as a resultof snowmelt. Colorado River flows fluctuatemuch less from one month to the next due to theregulating effect of reservoirs on the system.
Nevada State Water Plan
4–16
Summary of Surface Water Runoff and Flows (excluding Colorado River)
Description Acre-feet per year
Average Annual Surface Runoff
From Watersheds within Nevada 1,900,000
Inflow from Other States 1,300,000
Total 3,200,000
Average Annual Surface Outflow to Other States 700,000
Source: “Water for Nevada, Report No. 3", State Engineer’s Office, 1971
Drought periods (consecutive years with streamflows much less than average) are frequent in Nevada.In many cases, Nevada’s river systems experience more “below average water years” than “aboveaverage water years” (Figure 4-9). The most significant documented droughts of the 20th centurywere during 1928-37, 1953-55, 1959-62, 1976-77 and 1987-94, with the 1928-37 period possiblythe most severe and longest of this century in northern Nevada.
Floods. Even though Nevada is the driest state with an average annual precipitation of nine inches,floods are common and have occurred in all parts of the state. The effects of floods in Nevada haveincreased steadily as population and development have increase since the mid-1900s. Developmenthas encroached upon natural floodplains, including alluvial fans, and thereby increasing flood damagerisks.
On the Truckee, Carson, and Walker rivers in west-central Nevada, the most severe floods haveresulted from winter rains on snow in the Sierra Nevada Mountains. In the large drainages insouthern Nevada, and small drainages and alluvial fans throughout Nevada, flash floods resulting fromintense rainfall over relatively small areas are the most common. Flooding from these intenserainstorms is typically sudden and life threatening. Flooding along the Humboldt, Truckee, Carson,and Walker rivers in northern Nevada is generally not as sudden and more time is available to preparefor the flooding. However, these floods are usually longer with longer periods of flood inundation.Table 4-5 summarizes the major flood events that have occurred this century in Nevada.
Number of below average years = 59Number of above average years = 38
Fig. 4-9. Examples of Annual Deviations from Average Annual Flows
Nevada State Water Plan
4–18
Table 4-5. Summary of Major Floods in Nevada, 1907-97
Date Area Affected RecurrenceInterval(years)
Remarks
Mar. 1907 Sierra Nevada drainages Unknown May rank with 1950 and 1955 floods inCarson Valley and along Truckee River
Feb. 1910 Upper Humboldt River basin >100 Similar to hydrologic conditions duringFeb. 1962 flood.
Nov.-Dec. 1950 Sierra Nevada drainages 50 Not as severe as Dec. 1955 flood inCarson River drainage.
Dec. 1955 Sierra Nevada drainages 40 to 100 Most severe flood from upper CarsonRiver drainage downstream to CarsonCity
Feb. 1962 Humboldt River drainage >50 in upperHumboldt
Rapid thawing and light rain onsnowpack
Feb. 1963 Sierra Nevada drainages 50 Severe in Carson and Truckee Riverdrainages
Dec. 1964 Sierra Nevada drainages 20
Sept. 14, 1974 Eldorado Canyon (dry tributary to theColorado River, 50 miles southeast ofLas Vegas)
>100 9 lives lost
July 1975 Las Vegas Valley Unknown 2 lives lost
Aug. 1981 Moapa Valley and vicinity Unknown Severe damage to agriculture andhighways.
Mar.-June 1983 Statewide except south <10 to 50 Greatest snowmelt floods known (exceptin Humboldt River basin - see Apr.-June1984).
July 1983 Las Vegas Valley, Muddy River Unknown
Apr.-June 1984 Centered in Humboldt River drainage >100 alongmiddle andlower HumboldtRiver
Greatest snowmelt floods known inHumboldt River basin.
July-Sept. 1984 Las Vegas Valley Unknown 5 lives lost
Feb. 1986 Sierra Nevada drainages 10 to 50 Greatest discharge in main rivers since1963
Jan. 1997 Sierra Nevada drainages 50 to >100 Heavy rainfall on snowpack
Source: National Water Summary 1988-89 - Floods and Droughts: Nevada, U.S. Geological Survey, Carson City, Nevada.; January1997 Flooding in Northern Nevada - Was This a “100-Year Flood”?, U.S.G.S. Fact Sheet FS-077-97, U.S. Geological Survey,Carson City, Nevada, May 1997.
Part 1. Section 4 – Water Resources Background
4–19
Water Quality
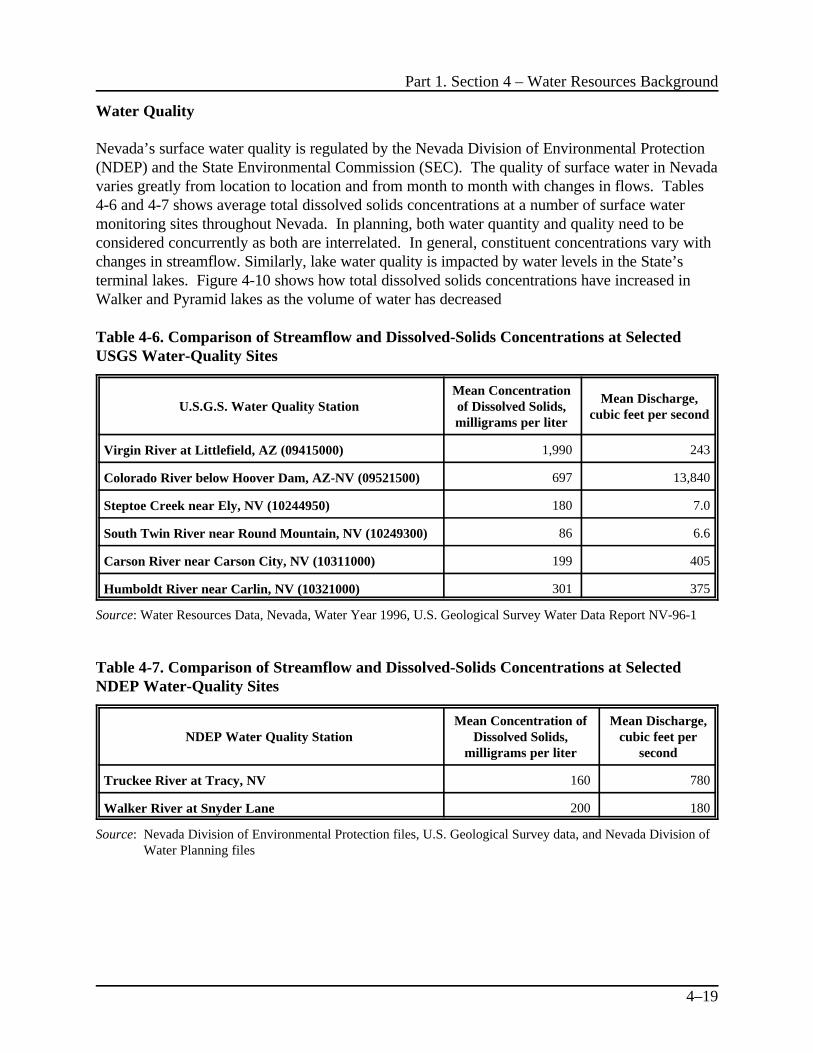
Nevada’s surface water quality is regulated by the Nevada Division of Environmental Protection(NDEP) and the State Environmental Commission (SEC). The quality of surface water in Nevadavaries greatly from location to location and from month to month with changes in flows. Tables4-6 and 4-7 shows average total dissolved solids concentrations at a number of surface watermonitoring sites throughout Nevada. In planning, both water quantity and quality need to beconsidered concurrently as both are interrelated. In general, constituent concentrations vary withchanges in streamflow. Similarly, lake water quality is impacted by water levels in the State’sterminal lakes. Figure 4-10 shows how total dissolved solids concentrations have increased inWalker and Pyramid lakes as the volume of water has decreased
Table 4-6. Comparison of Streamflow and Dissolved-Solids Concentrations at SelectedUSGS Water-Quality Sites
U.S.G.S. Water Quality StationMean Concentrationof Dissolved Solids,milligrams per liter
Mean Discharge,cubic feet per second
Virgin River at Littlefield, AZ (09415000) 1,990 243
Colorado River below Hoover Dam, AZ-NV (09521500) 697 13,840
Steptoe Creek near Ely, NV (10244950) 180 7.0
South Twin River near Round Mountain, NV (10249300) 86 6.6
Carson River near Carson City, NV (10311000) 199 405
Humboldt River near Carlin, NV (10321000) 301 375
Source: Water Resources Data, Nevada, Water Year 1996, U.S. Geological Survey Water Data Report NV-96-1
Table 4-7. Comparison of Streamflow and Dissolved-Solids Concentrations at SelectedNDEP Water-Quality Sites
NDEP Water Quality StationMean Concentration of
Dissolved Solids,milligrams per liter
Mean Discharge,cubic feet per
second
Truckee River at Tracy, NV 160 780
Walker River at Snyder Lane 200 180
Source: Nevada Division of Environmental Protection files, U.S. Geological Survey data, and Nevada Division ofWater Planning files
Nevada State Water Plan
4–20
1875 1900 1925 1950 1975 2000
Year
3900
3950
4000
4050
4100W
ater
Su
rfac
e E
leva
tio
n, f
eet
abo
ve s
ea le
vel
0
5,000
10,000
15,000
20,000
Dis
solv
ed S
olid
s, m
illig
ram
s p
er li
ter
Intermittent Water Level Measurements
Continuous Water Level Measurements
Intermittent Dissolved Solids Measurements
Walker LakeData Source: U.S. Geological Survey
1850 1900 1950 2000
Year
3775
3800
3825
3850
3875
3900
3925
Wat
er S
urf
ace
Ele
vati
on
, fee
t ab
ove
sea
leve
l
3,000
3,500
4,000
4,500
5,000
5,500
6,000
Med
ian
Dis
solv
ed S
olid
s, m
illig
ram
s p
er li
ter
Intermittent Water Level Measurements
Continuous Water Level Measurements
Intermittent Dissolved Solids Measurements
Pyramid LakeData Source: U.S. Geological Survey
Fig. 4-10. Water Surface Elevations and Dissolved Solids Concentrationsat Walker and Pyramid Lakes
Part 1. Section 4 – Water Resources Background
4–21
The impacts on water quality from the municipal and industrial discharges have been greatly reducedover the last few years, with most point source polluters eliminated from direct discharges orstringently controlled. Nonpoint source pollution due mainly to agriculture, urban runoff andhydrologic modifications impacts various waters of Nevada. Water quality parameters of concerninclude nutrients, suspended solids, turbidity and bacteria which are being targeted in the State’sNonpoint Source Program administered by NDEP. Water quality has been improving due to theremoval of point sources and the implementation of more stringent standards. The Nonpoint SourceProgram helps to further improve water quality by promoting public awareness, improved grazingand irrigation practices, erosion control measures and the implementation of best managementpractices.
Surface Water Quality Management and Data Collection. Nevada’s surface water quality isregulated by NDEP and the SEC. Certain aspects of the Federal Clean Water Act are implementedby NDEP for programs within Nevada. With assistance from federal grants, NDEP operates asurface water quality monitoring program of water bodies in Nevada, regularly monitoring over 100sampling points in the 14 hydrographic regions. Section 303(d) of the Clean Water Act requires theState to develop a list of water bodies that need additional measures beyond existing controls toachieve or maintain water quality standards. The Section 303(d) list, developed by NDEP, providesa comprehensive inventory of water bodies impaired by all pollution sources, including point sourcesand nonpoint sources. This inventory is the basis for targeting water bodies for watershed-basedsolutions. Nevada’s first priority in targeting water bodies is impairment of the beneficial usestandards. In general, a water body is included on the 303(d) list if the beneficial use standards wereexceeded more than 25% of the time. The current 303(d) list is available from NDEP upon request.For a more complete description of NDEP water quality programs, refer to Part 1, Section 3 of theState Water Plan.
As of 1996, the USGS collected water quality data for 96 stream, canal, spring and drain sitesthroughout Nevada as part of their systematic data-collection program. In addition to routinemonitoring, USGS is also conducting the National Water Quality Assessment Program (NAWQA)in Nevada and throughout the United States in response to the lack of long-term, consistentinformation on water quality nationwide. NAWQA Program goals are to describe the status andtrends in the quality of the Nation’s water resources and to provide scientific understanding of themajor factors which affect surface and ground water quality. The Nevada NAWQA Project beganin 1991 and includes the Las Vegas Valley area and the Carson and the Truckee River Basins.Project scientists are using multi-disciplinary approaches to compare and contrast the effects of urbanand agricultural activities on water quality.
Nevada State Water Plan
4–22
Groundwater
Groundwater in Nevada is an important water supply source. The surface water resources in ourstate have been virtually fully appropriated and future development must rely on either ground-watersources or the reallocation of surface water supplies. Groundwater provides about 40 percent of thetotal water supply used in Nevada and in some areas provides the entire supply. The extent to whichgroundwater is used may vary considerably from year to year. In many areas, groundwater is pumpedto supplement surface water sources. As a result, groundwater usage in these areas increases duringperiods of low streamflow and decreases during high runoff periods.
Proper planning and management of our ground-water resources cannot occur without knowledgeabout aquifer location, perennial yield, recharge, storage volume, committed resources (water rightedamounts), actual water usage, water levels, water quality, and projected trends. The followingsections provide available background information on Nevada’s groundwater resources.
Principal Ground-water Aquifers
Principal ground-water aquifers in Nevada are basin-fill aquifers, carbonate-rock aquifers, volcanic-rock aquifers, and volcanic- and sedimentary-rock aquifers (Figure 4-11). The basin-fill aquifers,composed primarily of alluvial, colluvial and lacustrine deposits, are the major aquifers in the State.Virtually all major ground-water development has been in the basin-fill aquifers with the withdrawalsfrom the upper 500 feet of these aquifers. In eastern and southern Nevada, thick sequences ofcarbonate rock underlie many of the alluvial basins forming a complex regional aquifer system orsystems that are largely undeveloped and not yet fully understood. The carbonate-rock aquifersupplies water to numerous springs which are used for irrigation. Volcanic-rock aquifers extend overhundreds of square miles but only one volcanic-rock aquifer in the Carson Desert (Churchill County)of west-central Nevada has been developed as a municipal water supply.
Within the Basin and Range Province, aquifers are generally not continuous, or regional, because ofthe complex faulting in the region. Of the aquifer types discussed above, any or all may be in, orunderlie, a particular basin and constitute separate sources of water. However in some instance,interconnection between the aquifers may exist.
Groundwater and Surface Water Interaction
Groundwater and surface water cannot be viewed as independent and separate sources in watermanagement decisions. In some areas, groundwater may discharge into streams and contributesignificantly to surface water flows. Groundwater usage may lessen surface flows in these instances.Conversely, surface water infiltrates into the groundwater systems through natural causes and/orhuman activities (such as irrigation). As a result, changes in surface water flows and usage mayimpact groundwater levels.
Figure 4-11 Aquifers
Part 1. Section 4 – Water Resources Background
4–23
Perennial Yield and Committed Resources
Perennial yield is the amount of usable water from a ground-water aquifer which can be economicallywithdrawn and consumed each year for an indefinite period of time without depleting the source.Estimates of perennial yield are necessary to provide the State Engineer with a guideline by whichto limit groundwater allocations (committed resources).
Recognizing the need for more detailed groundwater information, such as perennial yield estimates,the State Engineer and the U.S. Geological Survey (USGS) began a cooperative groundwater studyprogram in 1945 with funding from the State Legislature. A number of water resource bulletins havebeen produced from this program. However, the most statewide comprehensive groundwater studyefforts did not begin until the State Legislature in 1960 authorized a series of ground-waterreconnaissance studies be performed under the cooperative supervision of the Nevada Division ofWater Resources (NDWR) and the USGS. This program, which extended until 1974, resulted in 60reconnaissance reports covering the hydrology of 219 hydrographic areas. Based upon these reports,the water resources bulletins, and other more recent studies, estimates of perennial yield have beendeveloped for the 256 hydrographic areas. The total combined perennial yield of the basin-fillaquifers statewide is approximately 2.1 million acre-feet per year. The perennial yield figurescurrently available are estimates only and provide guidelines for water planning and management.In developing these estimates, the USGS utilized the Maxey-Eakin method which was developedbetween 1947 and 1951. While some of the perennial yield estimates have been updated with morecurrent methodologies, many of the yield estimates in use today were developed over 25 years ago.
In basins with significant groundwater discharge to streams, the USGS developed system yieldestimates in addition to the groundwater perennial yield estimates. System yield is the amount ofusable groundwater and surface water that can be economically withdrawn and consumed each yearfor an indefinite period of time without depleting the source. For these basins, the perennial yieldestimates may include groundwater discharges to surface streams. Development of thesegroundwater aquifers could potentially reduce surface flows and impact downstream surface waterusers.
Under the authority granted in Nevada Revised Statutes 534, the State Engineer issues groundwaterrights. The term “committed resource” represents the total volume of the permitted, certificated andvested groundwater rights which are recognized by the State Engineer and generally can bewithdrawn from a basin or area in any given year. When reviewing groundwater right applications,the State Engineer considers the individual and regional perennial yield estimates, system yieldestimates, and the committed resources amounts among other things in making determinations.
Nevada State Water Plan
4–24
To assist in the tracking of the committed groundwater resources, NDWR maintains a computerdatabase of state-issued water rights. Based upon this database, the total committed groundwaterresource amount in Nevada equals about 3 million acre-feet per year (as of March/April 1998). Theterm “committed” refers to those water rights that are either permitted or certificated. Table 4-8 andFigure 4-12 summarizes the committed resources by hydrographic region and by type of use.Committed resource values presented in the State Water Plan are time sensitive and subject to changefrom future actions on pending applications and other procedures. It must be noted that the 3 millionacre-feet figure is calculated from NDWR database output and represents the estimated amount ofthe groundwater resources committed (permitted or certificated) to a particular beneficial use. Thedatabase is still under development and all committed resource numbers presented in the State WaterPlan are approximate. Actual groundwater withdrawal and consumption amounts are far less thanthe committed resource value of 3 million acre-feet. In 1995, approximately 1.6 million acre-feet ofgroundwater was withdrawn with about 0.7 million acre-feet consumed. There are a number ofreasons for these differences:
• Some groundwater rights are supplemental to surface water rights. Supplementalgroundwater is generally pumped only as needed to augment low surface water supplies. Asa result, supplemental groundwater rights are not usually exercised to their fullest extent everyyear.
• Some groundwater rights are supplemental to other groundwater rights with one wellpumped to augment the supply from another well. When this supplemental relationship existsbetween rights, the State Engineer assigns a combined annual pumpage duty for both wellswhich is less than the sum of each well’s individual duty. The NDWR database does notautomatically account for these supplemental situations. NDWR staff must first makeadjustments to the database numbers to avoid double counting of these supplementalcommitments. These adjustments have been made to the database for about 35% of basins.In the other basins, committed resources values as taken from the NDWR may beoverestimated due to double counting of the supplemental water rights.
• Some groundwater rights may not be exercised to their fullest extent every year. Forexample, municipalities are allowed to hold water rights in reserve as needed for futuregrowth.
• Some groundwater rights are not currently being exercised as a water supply is beingprovided from another source. For example, groundwater being pumped as part of the minedewatering operations at Barrick’s Post/Betze-Meikle Mine is utilized for irrigation inBoulder Flat Valley (Humboldt River Basin). Both the irrigation and mine dewatering areseparately permitted with their permitted pumpage amounts included in Table 4-8. Howeverunder this situation, the irrigation operation is using the pit water rather than pumping theirrigation wells and exercising their groundwater rights. The NDWR database is not capableof adjusting for this type of substitution, and database printouts obtained for the State WaterPlan include both the irrigation rights and the dewatering rights in the committed resourcevalues.
Part 1. Section 4 – Water Resources Background
4–25
Table 4-8. Approximate Perennial Yield and Committed Groundwater Resources (as ofMarch/April 1998) by Use and Hydrographic Region
Hydrographic RegionCombinedPerennial
Yield, acre-feet per
year
Committed Groundwater Resources by Category, acre-feet per year (as ofMarch/April 1998)
Irrigation& Stock
Municipal& Quasi-municipal
Mining&
Milling1
Commercial& Industrial
Other2 Total
1. Northwest Region 55,500 28,625 6 132 5 64 28,832
2. Black Rock Desert Region 178,825 215,6583 608 58,9524 9205 1,6875 277,825
14. Death Valley Basin 24,550 22,325 2,154 6,086 638 333 31,536
TOTAL 2,097,315 1,803,106 388,702 342,221 266,004 162,629 2,962,662
General notes:A. Data on committed resources were obtained from the Nevada Division of Water Resources water rights database and represent estimated resources
committed as of March/April 1998. B. The committed resources values include permitted and certificated amounts only. C. These numbers are preliminary and intended to be used for planning purposes only. Totals may include water rights that have not been adjusted for
supplemental relationships with other groundwater rights. Also, totals do not include any adjustment for supplemental relationships with surface waterrights. Values are subject to change due to pending water right applications, and possible cancellations and forfeitures.
Other notes:1 Mining is considered a temporary use by the State Engineer’s Office and upon cessation of mining, many permits will expire. The “Mining & Milling”
category includes only those rights associated with the consumptive use needs of the mines. Permits associated with dewatering operations are includedin the “Other” category.
2 "Other” includes following uses: domestic, environmental, power generation, recreation, storage, wildlife, other/decreed. Includes environmental permitsissued for environmental cleanup projects. These environmental permits are temporary and expire upon cessation of cleanup activities.
3 Portions of rights are supplemental to surface water and are used only when surface water is not available.4 Majority of rights held for a mine operation that is no longer pumping.5 Portion of rights include geothermal pumpage for power generation, with majority of geothermal water reinjected into geothermal reservoir.6 Portion of rights not exercised as mine pit dewatering discharge is being used as a substituted water source. See Footnote 7.7 Includes rights associated with mine pit dewatering. Portion of withdrawals are used as a water source for irrigation. See Footnote 6.8 Actual annual pumpage limited to lower value by State Engineer restrictions.9 Portion of rights include geothermal pumpage for power generation, with some of geothermal water not reinjected.10 Includes permits that will be revoked when water right holders provided water from another source (Colorado River).11 Includes environmental permits issued for environmental cleanup projects. These environmental permits are temporary and expire upon cessation of
cleanup activities. Also includes permits granted for pumping of shallow poor quality groundwater in the Las Vegas area as needed to alleviate potentialhazards resulting from rising groundwater levels caused by secondary recharge.
Figure 4-12. Estimated Committed Groundwater Resources by Type of Use and HydrographicRegion.
Nevada State Water Plan
4–26
• The State Engineer has placed administrative limits on pumping in some areas. For example,the State Engineer has limited pumpage by Sierra Pacific Power Company from the TruckeeMeadows Basin to an amount less than Sierra’s water right duty. The NDWR database is notcapable of reflecting this pumpage limit in any calculation of committed resource amounts.Any committed resource values taken from the NDWR database reflect only thepermitted/certificated pumpage amounts, not any pumpage limits.
The committed resource figures derived from the NDWR database may not reflect long-termgroundwater commitments for the following reasons:
• Mining is considered a temporary use by the State Engineer’s Office. With some mines,existing water right permits will expire once the mining operations have ceased.
• Environmental permits issued for environmental cleanup projects are included in thecommitted resource figures in Table 4-7. The cleanup projects are considered temporary, andonce a cleanup operation is complete the associated water rights expire.
• The NDWR database includes committed resource amounts associated with revocablegroundwater permits issued in the Las Vegas area. These rights will be revoked when thewater right holders are provided water from another source, such as the Colorado River.
Management of Groundwater Rights Information
The total committed groundwater resource values presented in Table 4-8 and Figure 4-12 werederived directly from the NDWR database as of March and April 1998. At that time (March/April1998), approximately 85 percent of all state-issued water rights in Nevada had been entered into thisdatabase. However, the groundwater rights for 88 of the 256 basins have been completely enteredinto the database and adjusted for supplemental rights (Figure 4-13). As a result, the committedresource figures from the NDWR database for these 88 basins are more accurate than for the other168 basins, and the committed resource totals derived from the NDWR database maybe slightly lowerthan the actual amount. Committed resource values for the 168 basins should be consideredpreliminary estimates. Also, the committed resource values in some basins change daily. Currentestimates should be obtained from the Nevada Division of Water Resources.
Groundwater Availability
As the demand for groundwater has increased over the years, the State Engineer has had to increaseadministrative efforts in some of the groundwater basins. The State Engineer may designate agroundwater basin which is being depleted or is in need of additional administration. Basins aredesignated through orders issued by the State Engineer. By “designating” a basin, the State Engineeris granted additional authority in the administration of the groundwater resources within thedesignated basin. For example, the State Engineer may issue orders which define preferred uses, denycertain water uses, or curtail pumpage. Preferred uses may include domestic, municipal, quasi-municipal, industrial, irrigation, mining and stock-watering uses or any other beneficial use. Eachbasin is managed as a separate unit with the State Engineer issuing orders and rulings as needed for
Part 1. Section 4 – Water Resources Background
4–27
Figure 4-13 Basins with GW rights on NDWR database
Nevada State Water Plan
4–28
the management of the groundwater resources. Figure 4-14 displays the designation status for the256 groundwater basins in Nevada. This map is a useful tool to generally determine where thegreatest impediments to groundwater development may exist. However, the associated StateEngineer’s orders and rulings need to be examined for a complete understanding of the managementissues and water availability within a basin. The designation status of basins as defined by the StateEngineer’s orders have been divided into four general categories as shown in Table 4-9.
Designation Status General Description of Associated State Engineer’s Orders
Designated State Engineer’s order(s) do not define any administrative controls.
Designated - Irrigation Denied State Engineer’s order(s) state that irrigation is not a preferred use in thesebasins and applications for new irrigation appropriations will be denied.
Designated - Preferred Uses State Engineer’s order(s) list certain types of uses as preferred in thesebasins, and quantity restrictions may be placed on these preferred uses.
Designated - Preferred Uses;Irrigation Denied
State Engineer’s order(s) list certain types of uses as preferred in thesebasins. Quantity restrictions may be placed on these preferred uses. StateEngineer’s order(s) also state that irrigation is not a preferred use in thesebasins and applications for new irrigation appropriations will be denied. Other uses may also be listed as denied.
Whether or not a basin is designated dictates the procedures to be followed in obtaining agroundwater permit. In undesignated basins, a person can drill a well in these basins prior to filingan application for a groundwater permit. In designated basins, a groundwater permit must beobtained prior to drilling a well. Domestic wells are exempt from the permitting process, however,drillers are required to notify the State Engineer of their intent to drill a domestic well and submit awell log following completion.
In general for basins with preferred uses defined, applications for preferred uses are considered bythe State Engineer prior to applications for non-preferred uses. However, the State Engineer has theauthority to deny applications for non-preferred uses even though the designation orders do notexplicitly prohibit these uses. Regardless of the basin designation status, the State Engineer has theauthority to deny a water application if: 1) there is not unappropriated water; 2) the proposed use willimpair existing rights; 3) the proposed use will be detrimental to the public interest; and 4) the projectis not feasible and is filed for speculative purposes.
Figure 4-15 presents a general picture of the uncommitted groundwater resources in Nevada.“Uncommitted groundwater resources” are assumed equal to perennial yield estimates less permittedand certificated water right amounts as extracted from the NDWR water rights database as shownon Table 4-7. Approximately 60% of the 256 basins have committed resource volumes below theperennial yield estimates. The following qualifiers apply to the data upon which this map is based:
Part 1. Section 4 – Water Resources Background
4–29
Figure 4-14 - Designated basins
Nevada State Water Plan
4–30
Figure 4-15.uncommited gw
Part 1. Section 4 – Water Resources Background
4–31
• The perennial yield figures are estimates only and are subject to change following futurestudies.
• In some basins, groundwater aquifers discharge to streams thereby providing a portion of thesupply for downstream surface water users. In these basins, development of the entireperennial yield amount could potentially impact surface water uses.
• The committed resource numbers upon which this map is based are subject to change on adaily basis as a result of new actions, such as approval of pending applications or forfeitures.About 1/3 of the groundwater basins have pending applications. The most currentinformation can be obtained from NDWR.
Groundwater Data Collection
NDWR and USGS collect a majority of the groundwater usage and level data in Nevada as describedin the following discussion.
Pumpage and Crop Inventories. As part of their groundwater management duties, NDWRperforms annual estimates of pumpage or “pumpage inventories” for some of the groundwater basins.Generally, these pumpage inventories are based upon a mixture of both actual measurements andestimates. In other basins, NDWR performs crop inventories in which irrigated crop acreages andassociated water use are estimated. Figure 4-16 shows the basin locations for these inventories andtheir status. Some pumpage data are submitted to NDWR by the permit holders as a requirement ofwater right permit conditions, however these data do not represent all of the groundwater use withinthese basins. Figure 4-17 shows the basin for which groundwater pumpage data are submitted toNDWR as required by water right conditions.
Groundwater Level Data. The USGS and NDWR are the primary agencies collecting groundwaterlevel data on a statewide basis. In the report entitled “Water Resources Data, Nevada, Water Year1996” which is part of an annual series, the USGS presents water level data for 145 primaryobservation wells (measured monthly or more frequently) and 1041 secondary observation wells(measured one to four times per year) within 98 hydrographic basins. These water level data aremaintained in electronic databases. Some of the groundwater level data presented in USGS’s annualreport have been collected by other agencies and then compiled by the USGS. NDWR currentlycollects groundwater level data in 73 basins. Figure 4-18 shows the basins where the USGS andNDWR collect groundwater level data. Most of the NDWR data is collected once a year, typicallyin the spring. Only a portion of the NDWR data are maintained in the USGS database with theremaining data stored in paper files.
Groundwater levels fluctuate seasonally and annually in response to changes in pumpage and theclimate. Figure 4-19 shows long-term groundwater levels for six selected wells throughout Nevada.In some areas, groundwater levels during the late 1980s and early 1990s tended to decline due toheavier than average reliance upon groundwater during the drought of that period, but have beenrecovering with the return to normal and above-normal precipitation.
Nevada State Water Plan
4–32
Figure 4-16. Crop inventory
Part 1. Section 4 – Water Resources Background
4–33
Figure 4-17. Pumpage data
Nevada State Water Plan
4–34
Figure 4-18. Level collection
Part 1. Section 4 – Water Resources Background
4–35
Figure 4-19. Water levels
Nevada State Water Plan
4–36
1970 1975 1980 1985 1990 1995
Year
0
1,000
2,000
3,000
4,000
Nu
mb
er o
f W
ells
Dri
lled
Data Source: U.S. Geological Survey
Fig. 4-20. Number of New Wells Drilled from 1971-96
Domestic57.0%
Other35.0%
Public Supply/Industrial
7.0%
Irrigation1.0%
Note: "Other" represents mostly exploration wellsData Source: U.S. Geological Survey
Fig. 4-21. Distribution of Wells Drilled in 1996 by Use
As shown on Figure 4-19, significant groundwater level declines have occurred in Diamond Valley.In response, the State Engineer has designated the basin and has taken actions to reduce totalpumpage in the basin. Las Vegas Valley has also experienced significant groundwater level declines(Figure 4-19) due to overpumpage. Another result of overpumping groundwater is the reduction ofartesian pressures in the aquifer, which leads to the compaction of aquifer materials and to landsurface subsidence. Subsidence in the Las Vegas Valley has been monitored since 1935. Since thattime, the land surface has subsided over five feet in many areas of the valley. A number of actionshave been taken to address the basin overdraft and subsidence problems. Starting in 1987, the LasVegas Valley Water District began an artificial recharge program to temporarily store Colorado Riverwater in the principal aquifer during times of lower water use. The State Engineer has designated thebasin and has taken actions to reduce pumpage in the basin. In 1997 the Nevada State Legislaturecreated a Las Vegas Valley Groundwater Management Program for the oversight, protection andstabilization of the basin’s groundwater supply.
Well Logs. Since the 1940s, welllogs have been submitted to the StateEngineer’s Office. These well logsinclude a variety of information suchas: well location, drilling method,proposed use, well depth, and depthto water. Examination of these logsindicates that groundwaterdevelopment in Nevada has continuedto expand over the years. Figure 4-20displays the increase experienced inthe number of wells drilled annuallyfrom 1971 to 1996. In 1996, therewere approximately 2,632 new wellsdrilled in Nevada. Of this total, about1,500 wells were for domestic uses and about 900 were exploration wells (Figure 4-21). In 1996 thewell drilling was concentrated in the north-central, northwestern, and southern parts of the State.
In 1994, NDWR and USGScooperatively developed a computerdatabase for managing the well loginformation. Currently, the databasecontains information on approximately50,000 wells in Nevada. The databasedoes not contain any detailedinformation on the subsurfacegeology.
Part 1. Section 4 – Water Resources Background
4–37
Groundwater Quality
The quality of water from most aquifers in Nevada is suitable or marginally suitable for most uses.Most aquifers contain water with a majority of the constituent concentrations not exceeding State andnational drinking water standards. However, there are parts of some aquifers with constituentconcentrations exceeding these standards. It is important to realize that these excessiveconcentrations of certain constituents in groundwater may result from both natural processes and/orhuman activities.
The quality of groundwater in the unconsolidated deposits in the Basin and Range alluvial aquifersvaries from basin to basin. Dissolved-solids concentrations range from less than 500 parts permillions (ppm) to more than 10,000 ppm in some areas (Figure 4-22). By comparison, ocean waterhas dissolved-solids concentrations of about 35,000 ppm. Locally, saline water is present nearthermal springs and in areas where the basin-fill aquifers include large amounts of soluble salts. Indischarge or sink areas such as the Carson and Humboldt sinks, the dissolved-solid concentrationscan make the water economically unuseable. Although highly mineralized water is common inaquifers beneath playas, a deeper freshwater flow system may be present in some areas.
Groundwater Quality Management and Data Collection. Groundwater quality is regulated byNDEP and the SEC. Certain aspects of the Federal Clean Water Act and the Safe Drinking WaterAct are implemented by NDEP within Nevada. Groundwater quality is monitored by NDEP, andother State and Federal agencies. However, there is no ambient groundwater quality monitoringnetwork in Nevada as there is with the surface water resources. Most of the available groundwaterquality data are the result of special studies in specific areas, monitoring required by State permittingprograms and by drinking water regulations. For instance, NDEP may require groundwatermonitoring for groundwater discharge permits issued for industrial plants, land applications of treatedsewage effluent, and geothermal injection wells. Groundwater monitoring also may be required inresponse to suspected contamination, such as mining sites or leaking fuel tanks.
Other NDEP activities include the development of the Comprehensive State Ground Water ProtectionProgram (CSGWPP) and the Wellhead Protection Program (WHPP). NDEP initiated the CSGWPPto protect groundwater resources throughout Nevada and has received EPA endorsement on theprogram. The WHPP is intended to protect existing and future municipal groundwater resources.For a more complete description of NDEP water quality programs, refer to Part 1, Section 3 of theState Water Plan.
All community water systems are required to monitor water quality under the Federal Safe DrinkingWater Act and State law for both groundwater and surface water systems. The State Health Division,Bureau of Health Protection Services, uses these data to check for compliance with the drinkingwater standards.
Nevada State Water Plan
4–38
Figure 22 - tds
Part 1. Section 4 – Water Resources Background
4–39
Another significant source of groundwater quality data is the USGS. The USGS undertakes a widerange of special studies in specific basins which results in the collection and compilation ofgroundwater quality data. As of 1996, the USGS is collecting water quality data for 111 wells within11 of the 256 hydrographic basins. As stated above, most groundwater monitoring is short-term andsite specific in response to a particular problem. This lack of continuous, long-term groundwaterquality data makes any trend assessments a difficult proposition. In response to the lack of long-term,consistent information on water quality nationwide, the USGS developed the National Water-qualityAssessment (NAWQA) Program. NAWQA Program goals are to describe the status and trends inthe quality of the Nation’s water resources and to provide scientific understanding of the majorfactors that affect surface and ground water quality. The Nevada NAWQA Project began in 1991and includes the Las Vegas Valley area and the Carson and the Truckee River Basins. Projectscientists are using multi-disciplinary approaches to compare and contrast the effects of urban andagricultural activities on water quality.