Table of Contents Cityscape City of London 2019 Corporate Asset Management Plan 74 Replacement Value $5.048 Billion Condition Good 10 Year Gap $36.28 Million 1,434 kilometers of Sanitary Mains 6 Wastewater Treatment Plants 34 Pumping Stations Quick Facts 6.4% City-Wide Infrastructure Gap Contribution Section 5: Wastewater - Sanitary
Transcript
Table of Contents Cityscape
City of London 2019 Corporate Asset Management Plan 74
Replacement Value $5.048 Billion
Condition Good
10 Year Gap $36.28 Million
1,434 kilometers of Sanitary Mains
6 Wastewater Treatment Plants
34 Pumping Stations
Quick Facts
6.4% City-Wide
Infrastructure Gap Contribution
Section 5: Wastewater - Sanitary
Section 5: Wastewater – Sanitary
City of London 2019 Corporate Asset Management Plan 75
Table of Contents Cityscape
State of Local
Infrastructure
Levels of
Service
Asset Lifecycle
Management
Strategy
Forecasted
Infrastructure
Gap
Discussion Conclusions
Sanitary assets are managed and maintained to meet provincially issued system and facility
operating permits, as well as City of London technical targets for performance and reliability.
Valued at over $5.0 Billion, this extensive network of assets can be grouped into two categories:
collection and treatment; and, further divided into five categories ranging from local sewers to
wastewater treatment plants.
It is also noted that this replacement value is considered as if this service would be replaced on a
complete and standalone basis. In practice, the City’s core services (Transportation, Wastewater
Sanitary, Wastewater Storm, and Water) coordinate to ensure cost efficiencies to maintain the
current level of service at the lowest cost. While the Core chapters are presented separately, they
should be read and considered as whole when considering their infrastructure lifecycle needs.
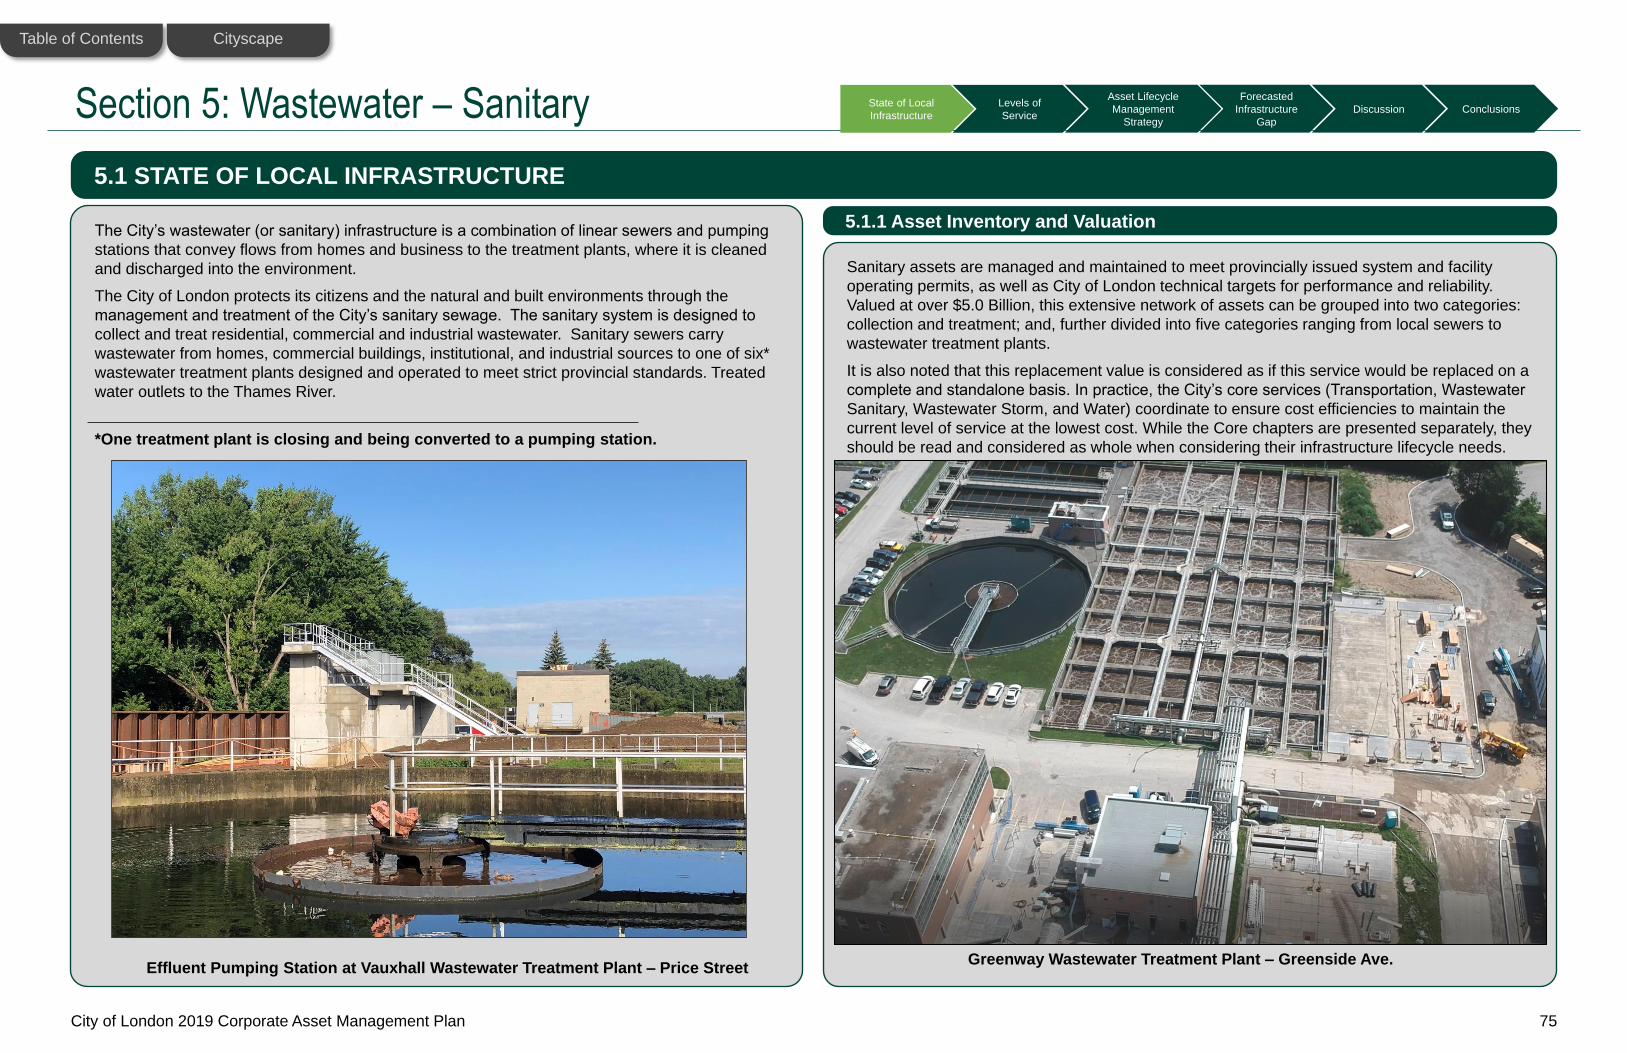
The City’s wastewater (or sanitary) infrastructure is a combination of linear sewers and pumping
stations that convey flows from homes and business to the treatment plants, where it is cleaned
and discharged into the environment.
The City of London protects its citizens and the natural and built environments through the
management and treatment of the City’s sanitary sewage. The sanitary system is designed to
collect and treat residential, commercial and industrial wastewater. Sanitary sewers carry
wastewater from homes, commercial buildings, institutional, and industrial sources to one of six*
wastewater treatment plants designed and operated to meet strict provincial standards. Treated
water outlets to the Thames River.
*One treatment plant is closing and being converted to a pumping station.
5.1 STATE OF LOCAL INFRASTRUCTURE
5.1.1 Asset Inventory and Valuation
Greenway Wastewater Treatment Plant – Greenside Ave. Effluent Pumping Station at Vauxhall Wastewater Treatment Plant – Price Street
Section 5: Wastewater – Sanitary
City of London 2019 Corporate Asset Management Plan 76
Table of Contents Cityscape
State of Local
Infrastructure
Levels of
Service
Asset Lifecycle
Management
Strategy
Forecasted
Infrastructure
Gap
Discussion Conclusions
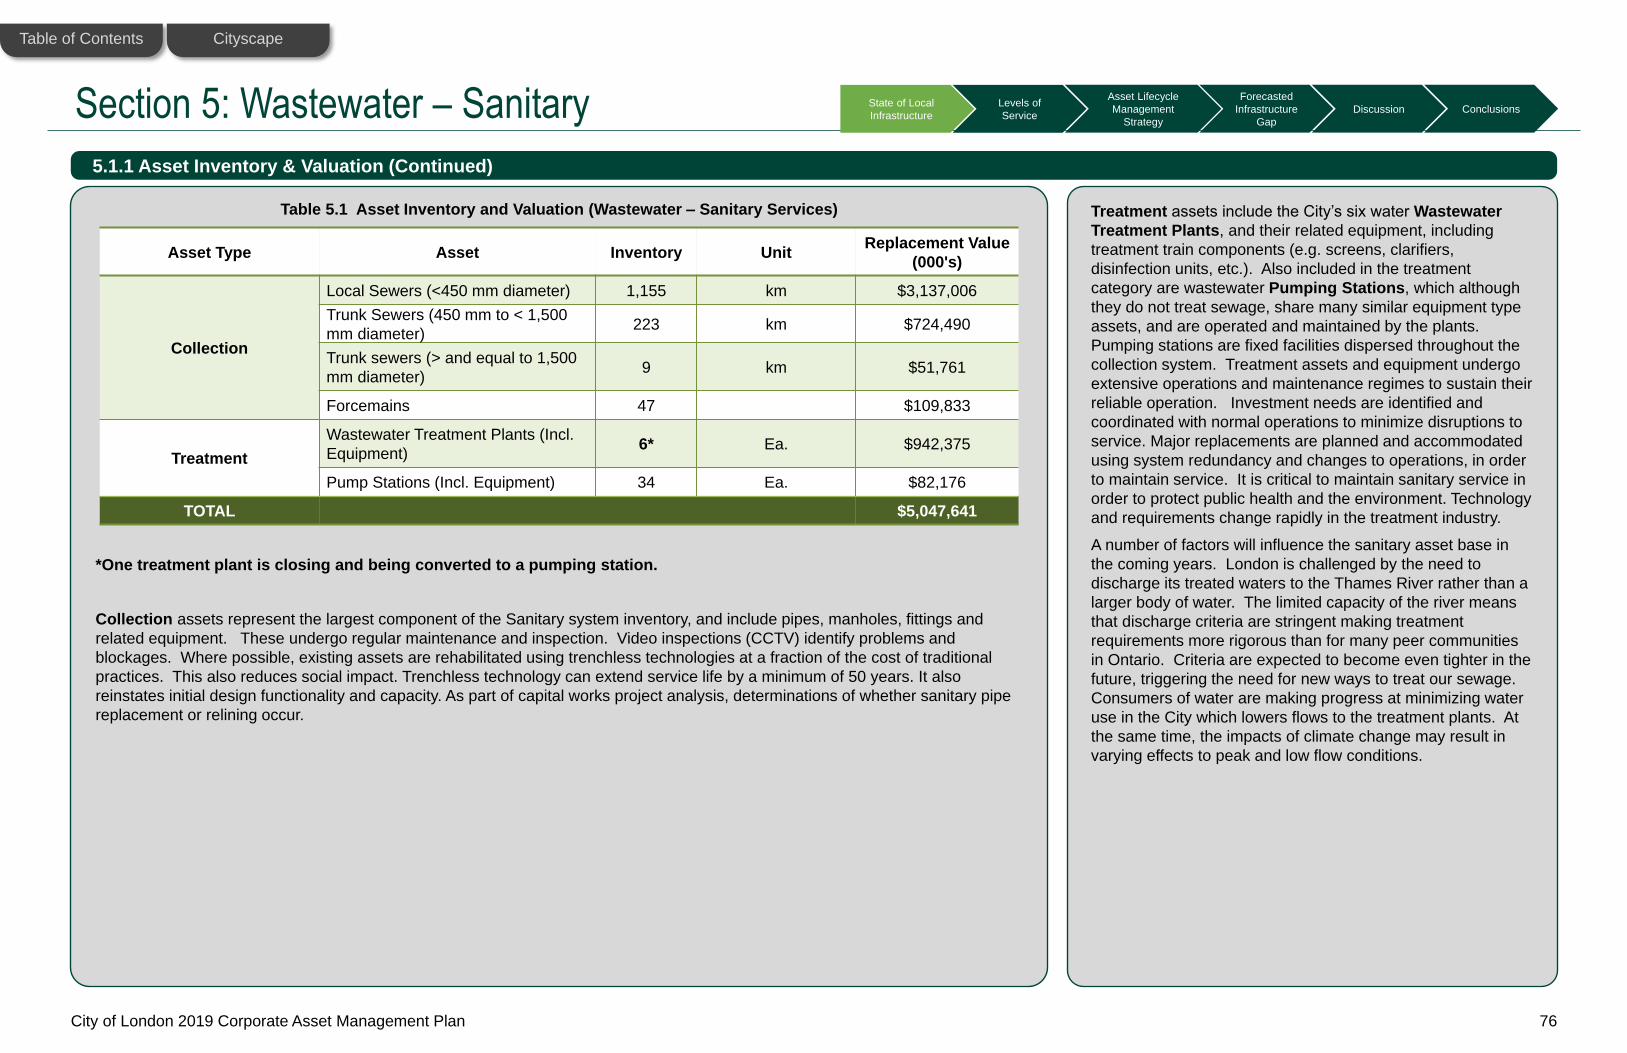
*One treatment plant is closing and being converted to a pumping station.
Collection assets represent the largest component of the Sanitary system inventory, and include pipes, manholes, fittings and
related equipment. These undergo regular maintenance and inspection. Video inspections (CCTV) identify problems and
blockages. Where possible, existing assets are rehabilitated using trenchless technologies at a fraction of the cost of traditional
practices. This also reduces social impact. Trenchless technology can extend service life by a minimum of 50 years. It also
reinstates initial design functionality and capacity. As part of capital works project analysis, determinations of whether sanitary pipe
replacement or relining occur.
76
5.1.1 Asset Inventory & Valuation (Continued)
Treatment assets include the City’s six water Wastewater
Treatment Plants, and their related equipment, including
City of London 2019 Corporate Asset Management Plan 81
Table of Contents Cityscape
State of Local
Infrastructure
Levels of
Service
Asset Lifecycle
Management
Strategy
Forecasted
Infrastructure
Gap
Discussion Conclusions
O. Reg. 588/17 requires legislated community levels of service (LOS) for core assets. Community levels of service use qualitative descriptions
to describe the scope or quality of service delivered by an asset category. Examples of legislated community levels of service include a map
showing areas of the municipality that are serviced by the water and wastewater system. In this example, a map provides an illustrative view of
the extent of the services provided through the infrastructure assets.
O. Reg. 588/17 also requires legislated technical levels of service for core assets. Technical levels of service use metrics to measure the scope
or quality of service being delivered by an asset category. Examples of technical levels of service include the percentage of urban properties
serviced by the municipal water and wastewater system. Technical levels of service for core assets are provided below.
The following are performance measures in the LOS Table that are O.Reg 588/17 requirements for wastewater (or sanitary) assets. References
are provided to show where O. Reg 588/17 requirement has been attained:
5.2 LEVELS OF SERVICE
OTHER LEVELS OF SERVICE
PERFORMANCE METRICS
Other LOS performance measures are related to
Corporate Values of Scope, Reliability, Cost
Efficiency, and Environmental Stewardship. The
metrics that go beyond the foundational or
regulation required metrics are considered
advanced. They indicate services that have
documented, planned approaches for operation
and maintenance of infrastructure, and have
considered trending indicators if the result is
planned to be decreased, increased, or be
approximately equal in future years.
CCTV sewermain screenshots that visualize the
CAM condition rating of Very Good (Condition 1)
to Very Poor (Condition 5) are provided in Figure
5.5. Foundational and advanced metrics are listed
in Table 5.5.
Customer Level of Service Technical Level of Service
Description, which may include maps, of the user groups or
areas of the municipality that are connected to the municipal
wastewater system. (Table 5.3)
Percentage of properties connected to the municipal wastewater
system. (94%, Table 5.3 and Figure 5.4)
Description of how combined sewers in the municipal wastewater
system are designed with overflow structures in place which
allow overflow during storm events to prevent backups into
homes. (Table 5.3)
# of events per year where combined sewer flow in the municipal
wastewater system exceeds system capacity compared to the
total number of properties connected to the municipal wastewater
system. (Table 5.3)
Description of the frequency and volume of overflows in
combined sewers in the municipal wastewater system that occur
in habitable areas or beaches. (Table 5.3)
The number of connection-days per year due to wastewater
backups compared to the total number of properties connected to
the municipal wastewater system. (Table 5.3)
Description of how stormwater can get into sanitary sewers in the
municipal wastewater system, causing sewage to overflow into
streets or backup into homes. (Table 5.3)
The number of effluent violations per year due to wastewater
discharge compared to the total number of properties connected to
the municipal wastewater system. (Table 5.3 and Table 5.4)
Description of how sanitary sewers in the municipal wastewater
system are designed to be resilient to avoid events described in
previous paragraph. (Table 5.3)
Description of the effluent that is discharged from sewage
treatment plants in the municipal wastewater system. (Table 5.3)
Table 5.2 O.Reg 588/17 Levels of Service Metrics for Wastewater – Sanitary Services
Wastewater Treatment Pumps - Adelaide
Section 5: Wastewater – Sanitary
City of London 2019 Corporate Asset Management Plan 82
Table of Contents Cityscape
State of Local
Infrastructure
Levels of
Service
Asset Lifecycle
Management
Strategy
Forecasted
Infrastructure
Gap
Discussion Conclusions
CUSTOMER VALUECORPORATE LOS
OBJECTIVECUSTOMER LOS MEASURE CUSTOMER LOS PERFORMANCE
CUSTOMER
LOS TARGET
ReliableProviding wastewater services
with minimal interruptions
1. Description of how combined sewers in
the municipal wastewater system are
designed with overflow structures in place
which allow overflow during storm events to
prevent backups into homes.
Of the approximate 1,388 km wastewater sewers, 17.1 km are combined with
stormwater. The City no longer constructs combined sewers. To avoid basement
flooding and backups into homes, existing combined sewers have a sewer
system overflow to provide system relief. Sewer overflows exist to prevent
sanitary sewer backup into basements by instead relieving overloaded sanitary
sewers into an adjacent storm sewer, or receiving water body. Sewer overflows
exist on both combined sewer locations and on otherwise separated sewer
locations. Many have be retroactively installed after basement flooding
experiences. The design varies greatly among the many overflow locations.
The frequency varies from site to site but are largely triggered by wet weather
(rainfall) events or snow melt. London has a Pollution Prevention and Control
Plan (PPCP) which details all of the overflow locations in London, along with
characterizing each overflow site and setting priorities/strategies for
remediation. The City currently has about 135 overflow locations.
2. Description of the frequency and volume
of overflows in combined sewers in the
municipal wastewater system that occur in
habitable areas or beaches.
Frequency and volume varies based on intensity and duration of the wet
weather event. Bypasses have to be reported on volume and duration of the
event. There are 14 modelled wet weather events on an average year, with
overflow volumes estimated at 83,818 cubic meters annually.
3. Description of how stormwater can get
into sanitary sewers in the municipal
wastewater system, causing sewage to
overflow into streets or backup into homes.
Infiltration and inflow into sanitary sewers in both groundwater and stormwater
which are not intended to be in sanitary system. Infiltration can enter through a
variety of sources (cracks in pipes, weeping tile connections, cross connection,
catchbasins, etc.).
4. Description of how sanitary sewers in
the municipal wastewater system are
designed to be resilient to avoid events
described in paragraph 3.
To minimize sewage overflow into streets or backup into homes, the City of
London has established design standards to convey flows under ultimate
conditions, design sheets for capacity needs that include infiltration inflow.
Table 5.3 O. Reg 588.17 Required Levels of Service Metrics (Wastewater – Sanitary Services)
Performance Measure Technical FocusedCustomer / Council Focused 1 2
No Change Positive Upward Positive Downward
Section 5: Wastewater – Sanitary
City of London 2019 Corporate Asset Management Plan 83
Table of Contents Cityscape
State of Local
Infrastructure
Levels of
Service
Asset Lifecycle
Management
Strategy
Forecasted
Infrastructure
Gap
Discussion Conclusions
CUSTOMER VALUECORPORATE LOS
OBJECTIVECUSTOMER LOS MEASURE CUSTOMER LOS PERFORMANCE
CUSTOMER
LOS TARGET
ReliableProviding wastewater services
with minimal interruptions
5. Description of the effluent that is
discharged from sewage treatment plants
in the municipal wastewater system
Effluent can be defined as water pollution, such as the outflow from a sewage
treatment facility. The effluent from the five active treatment facilities in London
have documented compliance limits, objectives, and actual performance. The
effluent criteria include effluent flow rates, and parameters for suspended solids,
Biochemical Oxygen Demand (BOD), phosphorous, ammonia, and E. coli. A
Table giving technical parameters is in page 7 of the Wastewater Service
Chapter.
Not Applicable
Scope
Providing adequate
wastewater services to the
community
Description, which may include maps, of
the user groups or areas of the municipality
that are connected to the municipal
wastewater system.
See Figure 5.4 map of Wastewater Service section
% of residents satisfied with the
wastewater system*74%
Table 5.3 (Continued) O. Reg 588.17 Required Levels of Service Metrics (Wastewater – Sanitary Services)
Performance Measure Technical FocusedCustomer / Council Focused 1 2
No Change Positive Upward Positive DownwardSouthwinds Pumping Station Instrumentation
*It is noted this metric is not Regulation-required but included in this list given is has the same Customer Value
as Regulation-required metrics.
Section 5: Wastewater – Sanitary
City of London 2019 Corporate Asset Management Plan 84
Table of Contents Cityscape
State of Local
Infrastructure
Levels of
Service
Asset Lifecycle
Management
Strategy
Forecasted
Infrastructure
Gap
Discussion Conclusions
Table 5.3 (Continued) O. Reg 588.17 Required Levels of Service Metrics (Wastewater – Sanitary Services)
Performance Measure
CUSTOMER VALUE CORPORATE LOS OBJECTIVE TECHNICAL LOS MEASURE TECHNICAL LOS PERFORMANCE TECHNICAL LOS TARGET
ReliableProviding wastewater services with
minimal interruptions
# of events per year where combined sewer
flow in the municipal wastewater system
exceeds system capacity compared to the
total number of properties connected to the
municipal wastewater system.
14 modelled wet weather events based on 2010 data
(consistent with analysis performed in Pollution
Pretention Control Plan and consistent with Ministry of
Environment and Climate Change Procedure F-5-5)
compared to 99,887 properties connected to the
municipal wastewater system.
14 wet weather events / average
year
The number of connection-days per year
due to wastewater backups compared to
the total number of properties connected to
the municipal wastewater system.
32 reported instances of private and public basement
flooding. 462 reported instances of sanitary/stormwater
issues compared to 99,987 connected properties
Target not assessed as reported
instances vary with annual
severity of annual rainfall and
wet weather events
The number of effluent violations per year
due to wastewater discharge compared to
the total number of properties connected to
the municipal wastewater system
3 violations compared to 99,887 properties connected
to the municipal wastewater system0
ScopeProviding adequate Sanitary
wastewater services to the community
% of properties connected to the municipal
wastewater system94%
Technical FocusedCustomer / Council Focused 1 2
No Change Positive Upward Positive Downward
Section 5: Wastewater – Sanitary
City of London 2019 Corporate Asset Management Plan 85
Table of Contents Cityscape
State of Local
Infrastructure
Levels of
Service
Asset Lifecycle
Management
Strategy
Forecasted
Infrastructure
Gap
Discussion Conclusions
Figure 5.4 Map Outlining the User Groups or Areas of the City that are Connected to the Municipal Wastewater System
Section 5: Wastewater – Sanitary
City of London 2019 Corporate Asset Management Plan 86
Table of Contents Cityscape
State of Local
Infrastructure
Levels of
Service
Asset Lifecycle
Management
Strategy
Forecasted
Infrastructure
Gap
Discussion Conclusions
*Biochemical Oxygen Demand is the quantity of oxygen utilized in biochemical oxidation of organic and inorganic matter in five (5) days at twenty (20) degrees Celsius, expressed in milligrams per litre.
**Ammonia is the effluent criteria, not unionized ammonia
As noted in the level of service chart, there were three (3) effluent violations in 2017, compared to 99,887 of properties connected to the municipal wastewater system.
Table 5.4 London Wastewater Plant Effluent Performance vs Objective and Compliance Limits
City of London 2019 Corporate Asset Management Plan 99
Table of Contents Cityscape
State of Local
Infrastructure
Levels of
Service
Asset Lifecycle
Management
Strategy
Forecasted
Infrastructure
Gap
Discussion Conclusions
The infrastructure gap is summarized below in Table 5.9. The analysis documented is related to the lifecycle rehabilitation or replacement lifecycle activities. Disposal is not identified separately as they are
inherent with asset renewal/rehab/replacement activities.
Current funding for capital budgets presented are the annual average of approved budgets (as of December 31, 2017) for the 2018-2027 fiscal years.
Certain capital budgets are intended and approved for both sanitary and stormwater sewer mains. The historical split as to how these capital budgets were used between sanitary and stormwater mains for
these single budget items were discussed with the each service and assumed would be applicable for future years. When combined the listed sanitary and stormwater lifecycle budgets match the 2018-
2027 budgets approved as of December 31, 2017.
* Total infrastructure gap is less than gap identified in Treatment as it is netting against Collection surplus amount
5.4 FORECASTED INFRASTRUCTURE GAP
Asset Type Budget Type Activity Type
Current Funding
(000’s)(Average Annual Activity
Currently Practiced)
Optimal Expenditure
(000’s)(Average Annual Activity to
Maintain Current LOS)
Additional Reserve
Fund Drawdown
Availability (000’s)
Funding Gap
(000’s)(Average Annual)
Wastewater
Collection
and
Treatment
Lifecycle Capital Budget
(renewal/rehab/replacement,
& disposal)
Collection $12,805 $8,140 Not Applicable Not Applicable
Treatment $2,991 $14,028 $2,744 $8,293
Total $15,796 $22,168 $2,744 $3,628*
Table 5.9 Comparison of Current to Optimal Capital Budgets, Reserve Fund Availability, and Funding Gap