SECTION 5.0 ENVIRONMENTAL INFORMATION 5.3-i TABLE OF CONTENTS 5.3 GEOLOGICAL HAZARDS AND RESOURCES ................................................. 5.3-1 5.3.1 Affected Environment ................................................................................. 5.3-1 5.3.2 Environmental Consequences ................................................................... 5.3-10 5.3.3 Cumulative Impacts .................................................................................. 5.3-10 5.3.4 Mitigation Measures and Conditions of Certification .............................. 5.3-11 5.3.5 Laws, Ordinances, Regulations, and Standards ........................................ 5.3-11 5.3.6 References ................................................................................................. 5.3-12 LIST OF TABLES Table 5.3-1 Magnitude 5.5 and Greater Earthquakes Occuring Between 1800 and April 2010 Within 62 Miles (100 KM) of the Project Site .................................................... 5.3-5 Table 5.3-2 Planning Level 2007 CBC Seismic Design Parameters Maximum Considered Earthquake, ASCE 7 Standard ...................................................................................... 5.3-7 Table 5.3-3 LORS Applicable to Geologic Hazards and Resources ...................................... 5.3-11 Table 5.3-4 Applicable Agencies and Agency Contacts ........................................................ 5.3-12 Table 5.3-5 Permits Required ................................................................................................. 5.3-12 LIST OF FIGURES Figure 5.3-1A Geology Figure 5.3-1B Geology Figure 5.3-2 Regional Faults and Earthquake Epicenters
Transcript
SECTION 5.0 ENVIRONMENTAL INFORMATION
5.3-i
TABLE OF CONTENTS
5.3 GEOLOGICAL HAZARDS AND RESOURCES ................................................. 5.3-1
5.3.1 Affected Environment................................................................................. 5.3-15.3.2 Environmental Consequences................................................................... 5.3-105.3.3 Cumulative Impacts .................................................................................. 5.3-105.3.4 Mitigation Measures and Conditions of Certification .............................. 5.3-115.3.5 Laws, Ordinances, Regulations, and Standards ........................................ 5.3-115.3.6 References ................................................................................................. 5.3-12
LIST OF TABLES
Table 5.3-1 Magnitude 5.5 and Greater Earthquakes Occuring Between 1800 and April2010 Within 62 Miles (100 KM) of the Project Site .................................................... 5.3-5
This section describes the affected environment and the environmental effects of the Pio PicoEnergy Center (PPEC) on geological hazards and resources in accordance with CaliforniaEnergy Commission (CEC) requirements. Impacts are assessed for the construction andoperation of the proposed new generating plant structures. Upon analysis, the project will haveno significant environmental impacts and will comply with all applicable laws, ordinances,regulations, and standards (LORS).
5.3.1 Affected Environment
PPEC consists of the project site, linears, and a temporary laydown area (Figure 3.3-1, FacilityPlot Plan and Figure 3.3-3, Potential Linears). The project site is located in an unincorporatedarea of San Diego County known as Otay Mesa. It is comprised of a 9.99 acre parcel located inthe southeast quadrant of the Alta Road and Calzada de la Fuente intersection. The proposedproject site comprises the entire parcel with Assessor’s Parcel Number (APN) 648-040-45, andthe laydown area is 6.00 acres of an adjacent parcel to the south (APN 648-040-46) (Figure 3.3-2, Project Location). The existing setting within one-mile of the project site and potentialtransmission line routes are presented on Figure 3.3-4. The project affects the following areas:
Plant site – 9.99 acres.
Temporary laydown and parking area – 6.00 acres, on an adjacent parcel that is contiguous tothe project site.
Natural Gas pipeline – There are two possible routes for the gas supply pipeline. Both routeswould connect to an existing SDG&E natural gas pipeline, but at different locations. Route Awould extend approximately 8,000 feet south along Alta Road to near the U.S.–Mexicoborder, at which point it would connect to the existing SDG&E natural gas pipeline. Route Bwould extend approximately 2,375 feet south along Alta Road, turn west on Otay MesaRoad, and continue approximately 7,920 feet to Harvest Road at which point it wouldconnect to the existing SDG&E natural gas pipeline (Figure 3.3-3, Potential Linears) for atotal of approximately 10,300 feet. The pipeline will be constructed, owned, and operated bySDG&E.
Sewer pipeline – A short connection will be made to an existing 12-inch sewer main alongCalzada de la Fuente along the north project site boundary or to an existing 15-inch sewermain along Alta Road, along the west project site boundary.
Stormwater pipeline – A short connection will be made from a detention pond located at thenorthwest corner of the project site to an existing 30-inch stormwater pipeline located alongCalzada de la Fuente, adjacent to the project site.
Power line – Two possible routes are provided for a 230kV transmission line that willconnect the project into the existing 230kV Otay Mesa switchyard. Route A would begin asan overhead power line along Calzada de la Fuente, extend approximately 1,700 feet eastwhere it would then be routed underground for approximately 400 feet into the Otay Mesa
SECTION 5.0 ENVIRONMENTAL INFORMATION
5.3-2
switchyard (total length of Route A would be approximately 2,100 feet). Route B wouldbegin as an overhead power line from the eastern edge of the project site, run southapproximately 550 feet, then turn east along the northern border of the parcels with APN648-040-48 and APN 648-040-43 for 1,400 feet, and finally turn north for approximately 700feet into the Otay Mesa switchyard (total length of Route B would be approximately 2,650feet). The power line will be owned and maintained by the Applicant.
Water supply pipelines – The project will make a short connection to the potable servicesystem, either at an existing 12-inch main along Calzada de la Fuente, or at an existing 24-inch main along Alta Road. Upon the Otay Water District (OWD)’s completion of theplanned Otay Mesa area recycled water system, the project will make a connection to anexisting 8-inch recycled water main along Calzada de la Fuente or a new recycled water mainto be constructed in Alta Road.
These features are illustrated on Figure 3.3-1, Facility Plot Plan and Figure 3.3-3, PotentialLinears.
5.3.1.1 Regional Geology
The PPEC site is located in the northern part of the Peninsular Ranges. Much of the PeninsularRanges’ geomorphic province lies outside of California, continuing south nearly 800 miles as thepeninsula of Baja California, producing one of the largest geologic units in western NorthAmerica. The province is bounded to the north by the Transverse Ranges and the Los AngelesBasin and on the east by the Colorado Desert and the Gulf of California. It varies in width from30 to 100 miles and extends offshore into the Pacific Ocean. Within California, the highestelevations are found in the San Jacinto-Santa Rosa Mountains of the easternmost block, with SanJacinto Peak reaching 10,805 feet above mean sea level (amsl). The Peninsular Ranges’ generalcross-section resembles the Sierra Nevada, with each range having a gentle westerly slope andnormally a steep eastern face. The western ranges slope progressively lower to the west alongbreaks produced by fault zones (Norris and Webb, 1990).
Although not exposed within a two-mile radius of the project site, the region is underlain byJurassic and Cretaceous plutonic rocks of the composite Peninsular Ranges Batholith, whichcontains screens (steeply dipping tabular bodies) of variably metamorphosed Mesozoicsupracrustal rocks.
Late Jurassic and Early Cretaceous volcanic and volcaniclastic rocks represent an older,superjacent part of the Peninsular Ranges’ magmatic arc. Early Cretaceous plutons intruded thisLate Jurassic and Early Cretanceous island-arc assemblage; isotopic ages of the Early CretaceousSantiago Peak Volcanics range from slightly older than to coeval with the intruded plutons.Unroofing of the westernmost part of the Peninsular Ranges Batholith had occurred by about84 million years (Ma), the age of nonconformably overlying fossiliferous marine strata. By lateCretaceous time, the westernmost part of the Peninsular Ranges Batholith had undergone uplift,erosion to a surface of low relief, and marine inundation forming the San Diego embayment.Upper Cretaceous and Eocene marine and nonmarine strata were deposited widely on the erodedbatholith, but no stratigraphic record is present for the Paleocene and early Eocene in the region.The upper Cretaceous strata were apparently uplifted and eroded prior to deposition of middle
SECTION 5.0 ENVIRONMENTAL INFORMATION
5.3-3
and upper Eocene rocks. Pliocene and Pleistocene coastal terrace deposits rest unconformablyupon Tertiary rocks (Oligocene and Miocene) in this area (Todd, 2004).
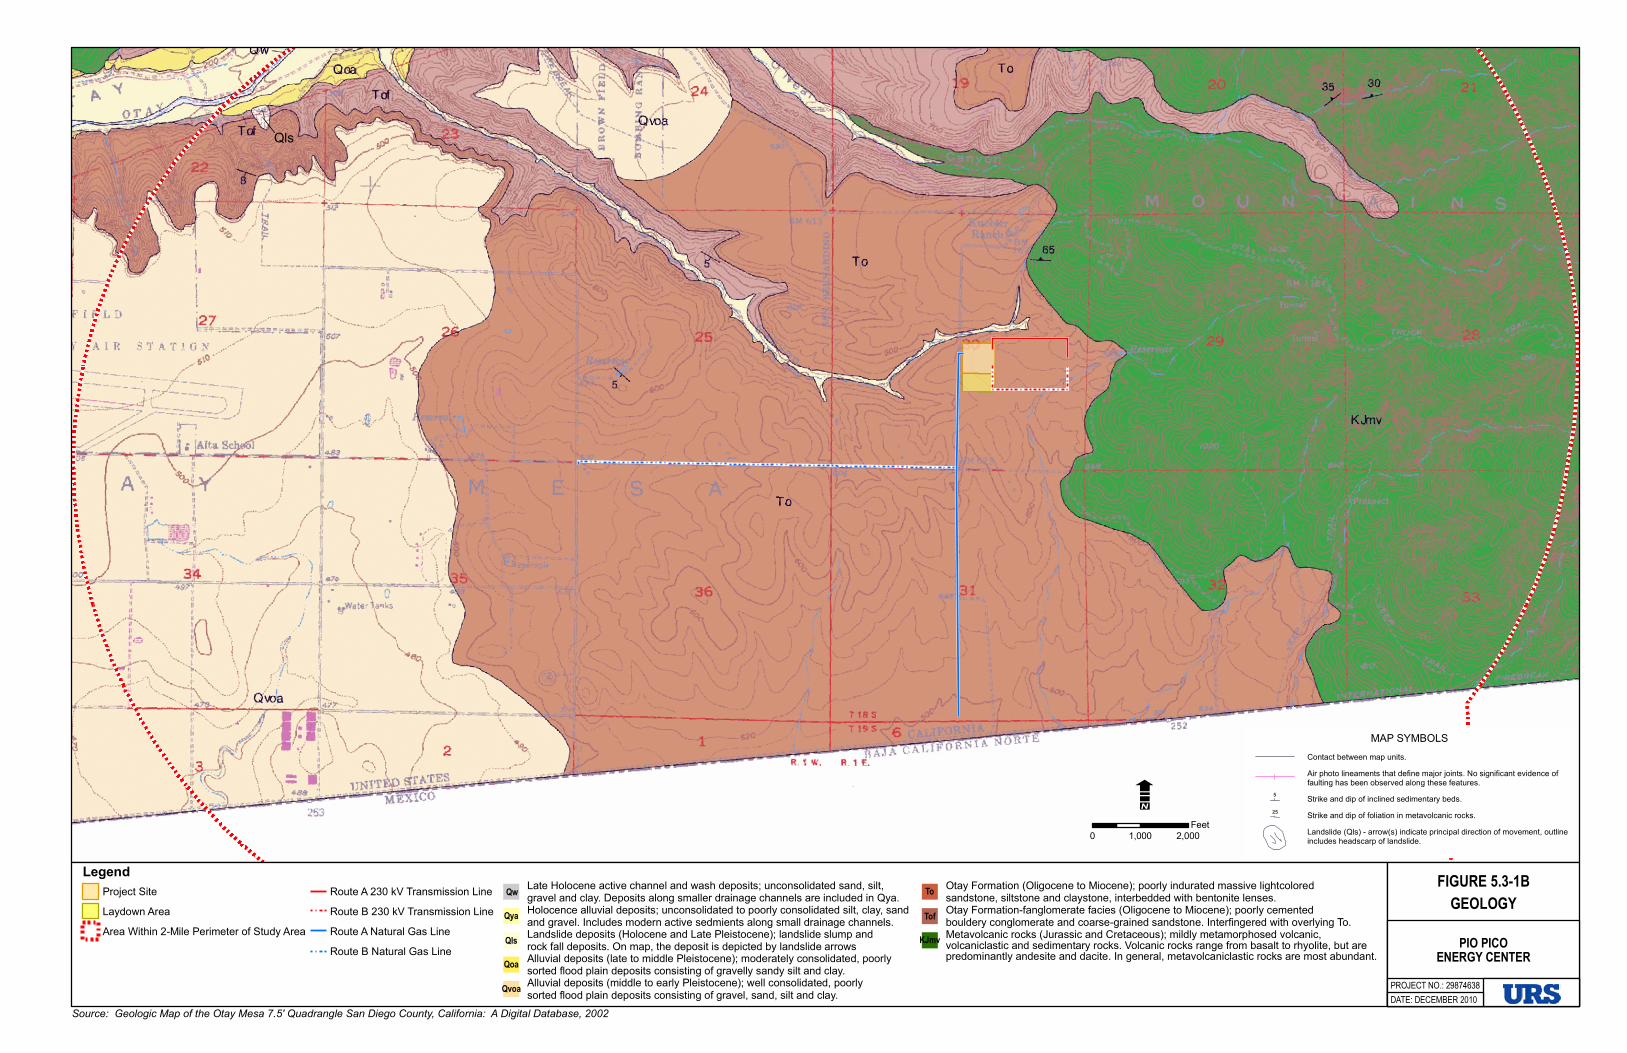
The Santiago Peak Volcanics are the oldest rocks exposed in the area of the PPEC site. They aremassive and complexly deformed, and their structure is not readily decipherable (Figures 5.3-1Aand 5.3-1B). They have undergone low-grade metamorphism and have been intruded by rocksof the mid-Cretaceous batholith. Regional uplift followed metamorphism and batholithicintrusion near the close of the Mesozoic Era, and deep-seated batholithic rocks were extensivelyexposed. The resulting erosion surface set the stage for deposition of sedimentary rocks in theLate Cretaceous and Tertiary periods (Kennedy and Peterson, 2001).
5.3.1.2 Local Geology – Stratigraphy
The PPEC study area, as illustrated on Figures 5.3-1A and 5.3-1B, comprises basement complexmetamorphic rocks, poorly to weakly cemented nonmarine rocks, and alluvial sediments.
Mesozoic Volcanic Rocks
The oldest rocks exposed within the study area are the Jurassic and Cretaceous metavolcanicrocks of the Santiago Peak Volcanics. They are mildly metamorphosed volcanic, volcaniclastic,and sedimentary rocks. Volcanic rocks range from basalt to rhyolite, but they are predominantlyandesite and dacite. In general, metavolcaniclastic rocks are most abundant (Tan and Kennedy,2002; Kennedy and Tan, 1977). These rocks are generally east of the project site, but a smallexposure comprises Rock Mountain to the west of the project site.
Tertiary Rocks
Sedimentary rocks deposited on the bedrock include two members of the Oligocene to Miocene-age Otay Formation and the younger San Diego Formation.
The PPEC site and adjacent laydown area are underlain by the Otay Formation consisting ofpoorly indurated massive light-colored sandstone, siltstone and claystone interbedded withbentonite lenses (Figure 5.3-1A and 5.3-1B). The unit trends in a northwest to southeastdirection and dips gently (about five degrees) toward the southwest in the immediate PPEC area.
The fanglomerate facies of the Otay Formation are poorly cemented bouldery conglomerate andcoarse-grained sandstone, which rests unconformably upon the low-grade metamorphic rocks ofthe basement complex. The clasts are angular and fresh and have compositions identical to themetamorphic and granitic rocks exposed locally. The fanglomerate interfingers with theoverlying poorly indurated massive light-colored sandstone, siltstone, and claystone interbeddedwith bentonite lenses. The sandstone is locally cemented, but generally it is weakly cemented.The claystone is waxy and composed almost exclusively of bentonite (Tan and Kennedy, 2002;Kennedy and Tan, 1977).
The Pliocene-age San Diego Formation is poorly indurated, fine- to medium-grained sandstonethat is typically yellowish light brown. It is locally cemented with limy cement. The potentialfor fossils within this formation is addressed in Section 5.8, Paleontological Resources. Thesestrata are characteristically weak and are susceptible to rapid erosion. These rocks are notexposed within the project area (Tan and Kennedy, 2002; Kennedy and Tan, 1977).
SECTION 5.0 ENVIRONMENTAL INFORMATION
5.3-4
Quaternary Rocks
Quaternary deposits include alluvial sediments, landslide deposits, and active channel and washsediments. The alluvial sediments consist of gravel, sand, silt, and clay ranging from older, well-consolidated material to younger, unconsolidated to poorly consolidated material. Landslides inthe area are typically rotational slumps that occur along valley walls in which rock of the SanDiego and Otay Formations crop out. The landslides are gravity slides resulting from basalerosion of oversteepened slopes, groundwater saturation, and surface-water erosion where poorlyconsolidated rock is present. Most of the slides have multiple slip surfaces, and expansive clay isusually present. The slides have consistently maintained internal homogeneity, and rotation ofthe slide masses are normally less than ten degrees. The active channel and wash sediments areunconsolidated sand, silt, gravel, and clay.
5.3.1.3 Local Geology – Groundwater
Groundwater in the project area is discussed in Section 5.5, Water Resources.
5.3.1.4 Local Geology – Structure
The basement rocks in the project area have acted as a rigid platform from Late Cretaceous timeto present, and the post-batholithic sedimentary rocks deposited on them are only slightlydeformed and mostly flat lying. Mapping of the rock units over a broad area has demonstratedthat inclinations locally associated with Tertiary and Quaternary faulting are rarely greater than afew degrees (Kennedy and Peterson, 2001).
An unnamed fault is shown in association with the Otay River Valley in some older, regional-scale geologic maps (i.e., Strand, 1962; Kahle, et al., 1984), but no faults are shown within ornear the project area on newer, more detailed mapping (Kennedy and Tan, 1977; Tan andKennedy, 2002, Todd, 2004).
5.3.1.5 Plate Tectonic Setting
The boundary between the North America and Pacific tectonic plates lies about 100 miles east-northeast of the project site. The project site is on the Pacific tectonic plate, which is separatedfrom the North American tectonic plate by the San Andreas fault. The relative motion betweenthese two plates has been determined from paleomagnetic lineations in the Gulf of California,global solutions to known slip rages along plate boundaries, geology, and geodesy (Minster andJordan, 1978; DeMets et al., 1987; Wallace, 1990) to be primarily horizontal at a rate of abouttwo inches per year (DeMets et al., 1987).
On a broad scale, the North American-Pacific tectonic plate boundary in California is atransform fault that extends from the Gulf of California to Cape Mendocino. The San Andreasfault and the transform plate boundary end to the north at the Mendocino Triple Junction innorthernmost California. North of Cape Mendocino, the spreading center and subduction zoneof the Juan de Fuca plate lie between the North American and Pacific tectonic plates. At thesouthern end, another spreading center lies in the Gulf of California, creating parts of the Pacificand Rivera tectonic plates. The transform faults of that spreading center merge into the SanAndreas fault system near the Imperial Valley and the Salton Sea (Hutton, et al., 1991).
SECTION 5.0 ENVIRONMENTAL INFORMATION
5.3-5
5.3.1.6 Seismicity and Seismotectonics
Figure 5.3-2 and Table 5.3-1 summarize the historical seismicity in the region between 1800 andApril 2010 based on the California Historical Earthquake Online Database and U.S. GeologicalSurvey data (USGS, 2010a). The project site latitude and longitude inputs were 32.574 degreesnorth and 116.918 degrees west, respectively. Fourteen earthquakes with magnitudes greaterthan or equal to 5.5 were identified within a 62-mile (100-km) search radius. The largest ofthese earthquakes was a magnitude 6.6 event that occurred about 62 miles northeast of theproject site) on April 9, 1968. The closest of these earthquakes were a magnitude 6.2 event,which occurred about 13 miles west of the project site, and a magnitude 5.8 and a magnitude 6.1event, which occurred within about 17 miles of the project site on June 25, 1863 and October 23,1894, respectively.
TABLE 5.3-1MAGNITUDE 5.5 AND GREATER EARTHQUAKES OCCURING BETWEEN 1800
AND APRIL 2010 WITHIN 62 MILES (100 KM) OF THE PROJECT SITE
July 13, 1986 32.97 117.87 5.8 61 NorthwestSource: Department of Conservation, California Geological Survey, Digital Database of Quaternary and Younger Faults from the FaultActivity Map of California, 2005. (MSGFM Database)
5.3.1.7 Significant Quaternary Faults
Although no known Alquist-Priolo Earthquake Fault Zones or active faults traverse the PPECsite or nearby area, traces of the potentially active La Nacion fault system are known to cross thenearby City of Chula Vista in a generally north-south direction within the city’s central portion.
An active fault is defined by the California Geological Survey (CGS) as one that has had surfacedisplacement within the last 11,000 years. Faults with no evidence of surface displacementwithin the last 11,000 years (i.e., Holocene age) are not necessarily inactive.
SECTION 5.0 ENVIRONMENTAL INFORMATION
5.3-6
Potentially active faults have shown displacement within the last 1.6 million years (Quaternaryage). Inactive faults show no evidence of movement in historical or recent geologic time,suggesting that that faults are dormant.
The Alquist-Priolo Earthquake Fault Zoning Act of 1994 (formerly known as the Alquist-PrioloSpecial Studies Zone Act of 1972) stipulates that no structure for human occupancy may be builtwithin an Earthquake Fault Zone until geologic investigations demonstrate that the site is free offault traces that are likely to rupture with surface displacement. The Rose Canyon fault zone andthe Coronado Bank fault zone are described because they are the closest significant designatedEarthquake Fault Zones to the project site. Local geologic maps show that most neighborhoodsof the City of San Diego are underlain by numerous smaller faults, some of which are consideredto be active and are mapped as Earthquake Fault Zones. The La Nacion fault system is alsodescribed because of its proximity to the project site and potential for activity. PPEC is notlocated within an Earthquake Fault Zone (CDMG, 2000).
The Rose Canyon fault zone exhibits right-lateral strike-slip movement and is about 19 mileslong. The most recent surface rupture of the fault zone occurred during Holocene time. The sliprate is about 0.04 inches per year, but it may be greater if unmeasured parallel segments carry asubstantial amount of slip (SCEC, 2010a). The Rose Canyon fault zone is about 12 miles westof the project site (City of San Diego, 2008).
The Coronado Bank fault zone exhibits right-lateral and normal faulting movement. The faultzone is at least 56 miles long and is essentially continuous with the Palos Verdes fault zone,resulting in an effective length of at least 112 miles. The most recent surface rupture of the faultzone occurred during Holocene time. The slip rate is roughly 0.08 inches per year (SCEC,2010b). The Coronado Bank fault zone is approximately 40 miles west of the project site.
The La Nacion fault system is a series of moderate- to high-angle normal faults striking northroughly parallel to the coastline and is traceable by surface features for more than 20 miles northof the U.S.-Mexico border. The fault system occurs in locally folded Tertiary and Quaternarysedimentary rocks. Vertical offset of Pleistocene sediments is as much as 280 feet on a givenfault branch and, for the fault system, it may be as much as 390 feet. Geophysical evidencesuggests the total offset for the fault system is 1,640 feet. Offset of alluvium has been proven attwo localities, and unexplained seismic activity may be associated with the La Nacion faultsystem (Artim and Pinckney, 1973). The La Nacion fault system is approximately five mileswest of the project site (City of San Diego, 2008).
5.3.1.8 Seismic Shaking
Ground shaking is the most substantial geologic hazard for PPEC. Preliminary estimates ofground motion based on probabilistic seismic hazard analyses are available for the project site byinterpolating from a grid of calculated values using latitude and longitude inputs of 32.574degrees north and 116.918 degrees west, respectively.
Ground motions with a ten percent probability of being exceeded in 50 years are expressed as afraction of the acceleration due to gravity (g). Estimated peak ground acceleration (Pga) rangesfrom 0.158 g for firm rock to 0.26 g for deep, stiff soil (Petersen, et al., 2008).
SECTION 5.0 ENVIRONMENTAL INFORMATION
5.3-7
Ground motion values are also modified by the local site soil conditions (CGS, 2010). Theseestimates are provided for planning purposes and will be updated as appropriate in a geotechnicalinvestigation report for the project site.
All of San Diego County is within Seismic Zone 4 (considered to be the highest seismic hazard)and, like most of Southern California, is subject to ground shaking (San Diego County, 2010a).Seismic design parameters appropriate for the 2007 California Building Code (CBC) werecalculated using the U.S. Geological Survey Earthquake Ground Motions Parameters applicationand are provided in Table 5.3-2 (USGS, 2009).
These parameters are project-specific based on latitude and longitude inputs of 32.574 degreesnorth and 116.918 degrees west, respectively. These parameters are provided for planningpurposes only pending the completion of a project-specific geotechnical investigation todetermine the appropriate site class.
The assumed site class is C, which is applicable to dense soil and soft rock. These parameterswill be updated as appropriate in a geotechnical investigation report for the site.
TABLE 5.3-2PLANNING LEVEL 2007 CBC SEISMIC DESIGN PARAMETERS MAXIMUM
CONSIDERED EARTHQUAKE, ASCE 7 STANDARD
Parameter ValueSS – Mapped Spectral Acceleration, Short (0.2 Second) Period 0.920 gS1 – Mapped Spectral Acceleration, Long (1.0 Second) Period 0.333 gAssumed Site Class CFa – Site Coefficient, Short (0.2 Second) Period 1.032Fv – Site Coefficient, Long (1.0 Second) Period 1.467SDS – Design Spectral Response Acceleration, Short (0.2 Second) Period 0.633 gSD1 – Design Spectral Response Acceleration, Long (1.0 Second) Period 0.326 gSMS – Spectral Response Acceleration, Short (0.2 Second) Period 0.950 gSM1 – Spectral Response Acceleration, Long (1.0 Second) Period 0.489 g
ASCE = American Society of Civil Engineers
5.3.1.9 Ground Rupture
No faults were identified within two miles of the project site (Tan and Kennedy, 2002; Tan,2002; City of Chula Vista, 2005). The nearest Earthquake Fault Zone, as defined by the Alquist-Priolo Earthquake Fault Zoning Act of 1994, is approximately 12 miles west of PPEC at itsclosest point. Earthquake Fault Zones include faults considered to have been active duringHolocene time and to have a relatively high potential for surface rupture (CDMG, 2000).Ground rupture is not likely at the project site or the surrounding area.
5.3.1.10 Liquefaction
Liquefaction is a phenomenon whereby loose, saturated, granular soils lose their inherent shearstrength because of excess pore water pressure build-up, such as that generated during repeated
SECTION 5.0 ENVIRONMENTAL INFORMATION
5.3-8
cyclic loading from an earthquake. A low relative density of the granular materials, shallowgroundwater table, long duration, and high acceleration of seismic shaking are some of thefactors favorable to cause liquefaction.
The presence of predominantly cohesive or fine-grained materials and/or absence of saturatedconditions can preclude liquefaction. Liquefaction hazards are usually manifested in the form ofbuoyancy forces during liquefaction, increase in lateral earth pressures due to liquefaction,horizontal and vertical movements resulting from lateral spreading, and post-earthquakesettlement of the liquefied materials.
Liquefaction is not known to have occurred historically in San Diego County. Historically,seismic shaking levels have not sufficed to trigger liquefaction, and ground failures or damage tostructures has not occurred as a consequence of liquefaction. Although paleoseismic indicatorshave been recognized locally, and past large earthquakes may have been severe enough to causeunrecognized liquefaction (San Diego County, 2010b), there is a low risk of liquefaction at theproject site and surrounding area.
5.3.1.11 Mass Wasting and Slope Stability
Landslides occur when masses of rock, earth, or debris move down a slope, including rock falls,deep failure of slopes, and shallow debris flows. Landslides are influenced by human activity(mining and construction of buildings, railroads, and highways) and natural factors (geology,precipitation, and topography). Frequently, they accompany other natural hazards. Althoughlandslides sometimes occur during earthquake activity, earthquakes are rarely their primarycause.
The most common cause of a landslide is an increase in the down slope gravitational stressapplied to slope materials (oversteepening). This may be produced either by natural processes orhuman activities. Undercutting of a valley wall by stream erosion is a common way in whichslopes may be naturally oversteepened. Other ways include excessive rainfall or irrigation on acliff or slope.
Another type of soil failure is slope wash, the erosion of slopes by surface-water runoff. Theintensity of slope wash depends on the discharge and velocity of surface runoff and on theresistance of surface materials to erosion. Surface runoff and velocity are increased in urban andsuburban areas due to the presence of roads, parking lots, and buildings, which have lowerinfiltration capacities and provide generally smooth surfaces that accelerate runoff.
Mudflows are another type of soil failure and are defined as flows or rivers of liquid mud down ahillside. They occur when water accumulates under the ground, usually following long andheavy rainfalls. If there is no brush, tree, or ground cover to hold the soil, mud can flow down-slope (San Diego County, 2010b).
Landslides tend to be more widespread in areas where the underlying sedimentary formationscontain weak claystone beds that are more susceptible to sliding. A small landslide within theOtay and San Diego Formations is mapped about 2 miles west of the project site on the southside of the Otay Valley (Tan and Kennedy, 2002). No other landslides have been identified
SECTION 5.0 ENVIRONMENTAL INFORMATION
5.3-9
within two miles of the project site. Cut slopes and fills constructed for the planned site facilitieswould add considerable stability against landslides.
5.3.1.12 Subsidence and Settlement
Subsidence occurs when a large portion of land is displaced vertically, usually due to thewithdrawal of groundwater, oil, or natural gas from certain types of rocks, such as fine-grainedsediments. The rock compacts because the water is partly responsible for holding the ground up.There is no record of this hazard in the region (San Diego County, 2010b).
Settlement can occur in poorly consolidated soils during ground shaking. Earthquake-inducedsettlement can cause distress to structures supposed on shallow foundations, damage to utilitiesthat serve pile-supported structures, and damage to utility lines that are commonly buried atshallow depths (Kramer, 1996). During settlement, the soil materials are physically rearrangedby the shaking to result in a less stable alignment of the individual minerals. Settlement ofsufficient magnitude to cause significant structural damage is normally associated with rapidlydeposited alluvial soils, or improperly founded or poorly compacted fill.
Soils in San Diego County are mostly granitic. Subsidence and settlement present minor threatsto limited parts of San Diego County and are not likely at the project site or surrounding area.
5.3.1.13 Expansive Soils
Expansive soils are those that greatly increase in volume when they absorb water and shrinkwhen they dry out. Expansion is measured by shrink-swell potential, which is relative volumechange in soil with a gain in moisture. Soils with a moderate to high shrink-swell potential maydamage buildings, roads, and other structures built on them.
Expansive soils present a minor threat to limited portions of San Diego County (San DiegoCounty, 2010b). Expansive soils are possible at the project site due to the localized interbeds ofbentonite in the Otay Formation, but, if present, will be addressed by recommendations of aproject-specific geotechnical report.
Soils are discussed more completely in Section 5.4.
5.3.1.14 Geologic Resources
As of 2001, there was no oil, gas, or geothermal production in San Diego County. No oil, gas, orgeothermal fields are located in the area surrounding the project site (DOGGR, 2001). TheCalifornia Department of Gas and Geothermal Resources wildcat map showing wells not on fieldmaps indicates that the closest exploration well to the project site is the Todd and Clark Number1 well. This well is shown as ‘drilling – idle” and is approximately four miles northwest of theproject site (DOGGR, 2010). There is no indication that oil, gas, or geothermal resourcesunderlie PPEC or the surrounding area.
Portions of the Otay River Valley are identified as an MRZ-2 area, which is an area that the Stateof California has determined adequate information exists to indicate that significant mineraldeposits are present or where it is judged that a high likelihood of their presence exists (City of
SECTION 5.0 ENVIRONMENTAL INFORMATION
5.3-10
Chula Vista, 2005). Many sand mines within major rivers of the western San Diego CountyProduction Consumption Region have ceased operation because they were unable to completenew permitting processes required for regulations associated with instream mining. Along theOtay River, companies such as Taylor Trucking and Materials Company and Nelson and SloanCompany operated several pit mines for alluvial fill in the Otay River Valley to a depth of about15 feet before they ceased mining in the 1980s (CDMG, 1982, CDMG, 1996).
Construction aggregate is the most valuable mineral resource in the area. Rock Mountain issituated immediately north of Otay River and about four miles northwest of the project site. Thequarry is being mined for boulders, which are processed into crushed rock.
Although the MRZ-2 zone within the Otay River Valley has experienced sand and gravel miningin the past, the majority of this area is not within preserved open space. In the long term, thelocal jurisdiction envisions that no mining, extraction, or processing facilities and/or activitieswill occur in this area. An alternative source of construction aggregate is available nearby. Inaddition, construction aggregate is imported into the San Diego area from foreign sources(USGS, 2010b).
An occurrence of limestone known as the Kuebler Ranch marl is just north of the project site(CDMG, 1973). That site is also known as the McCarthy Ranch deposit. Other than thisresource and construction aggregate, no collectable or marketable minerals or metals are knownto be present within two miles of the project site.
5.3.2 Environmental Consequences
PPEC will be designed and constructed to meet 2007 CBC industrial facility standards and willadhere to LORS related to geologic hazards, such as those pertaining to grading and slopestability. The project is expected to have no significant impact on geologic hazards or resources.
5.3.3 Cumulative Impacts
The purpose of this section is to identify past, present, and reasonably foreseeable actions in thePPEC project area that could affect the same resources as those of the project and provide thefollowing analysis:
Determine if the impacts of PPEC and the other actions would overlap in time or geographicextent.
Determine if the impacts of the proposed project would interact with, or intensify, theimpacts of the other actions.
Identify any potentially significant cumulative impacts.
Section 5.18 presents a list of potential projects that could result in cumulative impacts with theproposed project. PPEC is expected to have no significant impact on geologic hazards orresources and, as such, PPEC will not result in a cumulative impact in combination with otherprojects with respect to geologic hazards or resources.
SECTION 5.0 ENVIRONMENTAL INFORMATION
5.3-11
5.3.4 Mitigation Measures and Conditions of Certification
PPEC is expected to have no significant impacts in the area of geological hazards and resources.Therefore, no mitigation measures or conditions of certification are proposed.
5.3.5 Laws, Ordinances, Regulations, and Standards
Table 5.3-3 summarizes LORS that apply to the project.
TABLE 5.3-3LORS APPLICABLE TO GEOLOGIC HAZARDS AND RESOURCES
LORS ApplicabilityConformance
(Section)FederalNo federal LORS are applicable. See Section 3.12StateAlquist-Priolo Earthquake Fault Zoning Act of 1994 Not applicable. 5.3.1.7California Building Code, Volume 2, Section 1613 andAppendix J
Codes address excavation, grading, and earthworkconstruction, including construction applicable toearthquake safety and seismic activity hazards.
5.3.5
LocalCounty of San Diego, Code of Regulatory Ordinances,Title 8, Division 7
Codes address excavation, grading, and earthworkconstruction, including construction applicable toearthquake safety and seismic activity hazards.
5.3.5
5.3.5.1 Federal
No federal LORS are applicable.
5.3.5.2 State
The project site is not within an Earthquake Fault Zone, as defined by the Alquist-PrioloEarthquake Fault Zone Act.
2007 California Building Code (CBC), Volume 2, Section 1613. This element sets forth rulesand regulations that address potential seismic hazards.
Administering Agency. The administering agency for the above authority is the County of SanDiego, Department of Public Works.
2007 California Building Code (CBC), Appendix J. This element sets forth rules andregulations to control excavation and fills. It establishes basic policies to safeguard life, limb,property, and public welfare by regulating grading on private property. The geotechnicalengineer and engineering geologist will certify the placement of fills and adequacy of the projectsite for structural improvements in accordance with the CBC, Appendix J.
Administering Agency. The administering agency for the above authority is the County of SanDiego, Department of Public Works.
SECTION 5.0 ENVIRONMENTAL INFORMATION
5.3-12
5.3.5.3 Local
County of San Diego, Code of Regulatory Ordinances, Title 8, Division 7. This section of thecode establishes grading and excavation requirements during the project’s construction phase.
Administering Agency. The administering agency for the above authority is the County of SanDiego.
5.3.5.4 Agencies and Agency Contacts
Agencies with jurisdiction to issue applicable permits and/or enforce LORS related to geologichazards and resources and the applicable contact person are shown in Table 5.3-4.
TABLE 5.3-4APPLICABLE AGENCIES AND AGENCY CONTACTS
Agency Contact/Title TelephoneCalifornia Geological SurveyOffice of the State Geologist801 K Street, MS 12-30Sacramento, CA 95814
TBD (916) 455-1923
County of San DiegoDepartment of Planning and Land Use5201 Ruffin Road, Suite BSan Diego, CA 92123
Shelley Williams,Permit Process Coordinator (858) 694-3280
5.3.5.5 Applicable Permits
Grading permits are issued by the County of San Diego based on a review of the grading planand a project-specific geotechnical investigation report (See Table 5.3-5). These permits wouldbe required for this project prior to construction, but for the CEC jurisdiction over the project.
TABLE 5.3-5PERMITS REQUIRED
Issuing Agency Permit TypeCounty of San Diego Grading, Building, and Construction Permit Non-Discretionary
5.3.6 References
Artim, E.R. and C.J. Pinckney. 1973. La Nacion Fault System, San Diego, California.Geological Society of America Bulletin v. 84; No. 3.
California Building Code. 2007. California Code of Regulations, Title 24, Part 2, Volume 2of 2. California Building Standards Commission.
California Department of Conservation, Division of Mines and Geology. 1962. Geologic Mapof California, San Diego-El Centro Sheet.
SECTION 5.0 ENVIRONMENTAL INFORMATION
5.3-13
California Department of Conservation, Division of Mines and Geology. 1973. The MineralEconomics of the Carbonate Rocks, Limestone, and Dolomite Resources of California.CDMG Bulletin 194.
California Department of Conservation, Division of Mines and Geology. 1982. Mineral LandClassification: Aggregate Materials in the Western San Diego County Production-Consumption Region. CDMG Special Report 153.
California Department of Conservation, Division of Mines and Geology. 1996. Update ofMineral Land Classification: Aggregate Materials in the Western San Diego CountyProduction-Consumption Region. CDMG Open-File Report 96-04.
California Department of Conservation, Division of Mines and Geology. 2000. Digital Imagesof Official Maps of Alquist-Priolo Earthquake Fault Zones of California, Southern Region.CDMG CD 2000-003.
California Department of Conservation, Division of Oil and Gas. 2001. Oil, Gas, andGeothermal Fields in California, 2001.
California Department of Conservation, Division of Oil and Gas. 2010. Regional Wildcat MapW1-7. ftp://.consrv.ca.gov//oil//dist1/-7/Map1-7.pdf.
City of Chula Vista. 2005. City of Chula Vista General Plan.
City of San Diego. 2008. City of San Diego General Plan 2008. March 10.
DeMets, C., R.G. Gordon, S. Stein, and D.F. Argus. 1987. A Revised Estimate of pacific-northAmerica Motion and Implications for Western North America Plate Boundary ZoneTechtonics. Geophysical Research Letters. Volume 14: 911-914.
Federal Emergency Management Agency (FEMA). 1997. Flood Insurance Rate map, Panel2181 of 22375. Map number 06073C2181 F.
Hutton, L.K., L.M. Jones, E. Hauksson, and D.D. Given. 1991. Seismotectonics of SouthernCalifornia in D.B. Slemmons, E.R. Engdahl, M.D. Zoback, and D.D. Blackwell (eds.),Neotectonics of North America. Boulder, Colorado: Geological Society of America.Decade Map Vol. 1: 133-152.
Kennedy, M.P. and S.S. Tan. 1997. Geology of national City, Imperial Beach, and Otay MesaQuadrangles, Southern San Diego Metropolitan Area, California. CDMG Map Sheet 29.
Kennedy, M.P. and G.L. Peterson. 2001. Geology of the Eastern San Diego Metropolitan Area,California. CDMG Bulletin 200.
SECTION 5.0 ENVIRONMENTAL INFORMATION
5.3-14
Khale, J.E., P.A. Bodin, and J. Morgan. 1984. Preliminary Geologic Map of the Baja CaliforniaBorder Region. CDMG Open File Report 84-59.
Kramer, S.L. 1996. Geotechnical Earthquake Engineering. Prentice-Hall. New Jersey. 653 p.
Minster, J.B. and Jordan, T.H. 1978. Present-Day Plate Motions. Journal of GeophysicalResearch Vol. 83: 5331-5354.
Norris, R.M. and Webb, R.W. 1990. Geology of California, 2nd Edition. John Wiley and Sons,Inc. New York, 541 p.
Petersen, Mark D., Frankel, Arthur D., Harmsen, Stephen C., Mueller, Charles S., Haller,Kathleen M., Wheeler, Russell L., Wesson, Robert L., Zeng, Yuehua, Boyd, Oliver S.,Perkins, David M., Luco, Nicholas, Field, Edward H., Willis, Chris J., and Rukstales,Kenneth S., 2008. Documentation for the 2008 Update of the United States National SeismicHazard Maps: U.S. Geological Survey Open-File Report 2008-1128, 61 p. Website:http://.cr.usgs.gov///.htm.
San Diego County. 2010a. San Diego County Draft General Plan. April 2, 2010.
San Diego County. 2010b. San Diego County Multi-Jurisdictional Hazard Mitigation Plan.February 2010.
Southern California Earthquake Data Center (SCEC). 2010a. Rose Canyon Fault Zone.http://www.data.scec.org/fault_index/rosecany.html.
Southern California Earthquake Data Center (SCEC). 2010b. Coronado Bank Fault Zone andPalos Verdes – Coronado Bank Fault Zone: http://.data.scec.org/_index/.html.
Strand, R.G. 1962. Geologic Map of California, San Diego-El Centro Sheet. CaliforniaDepartment of Conservation, Division of Mines and Geology.
Tan, S.S. 2002. Geologic Map of the Jamul Mountains 7.5’ Quadrangle, San Diego County,California: A digital Database. CGS.
Tan, S.S. and M.P. Kennedy. 2002. Geologic Map of the Otay Mesa 7.5’ Quadrangle, SanDiego County, California: A Digital Database. California Geological Survey.
Todd, V.R. 2004. Preliminary Geologic Map of the El Cajon 30’ x 60’ Quadrangle, SouthernCalifornia. U.S. Geological Survey Open File Report 2004-1361.
U.S. Geological Survey. 1996. Otay Mesa. 1:24,000-Scale Topographic Map.
U.S. Geological Survey. 2009. Earthquake Ground Motion Parameters, Version 5.0.9a.October 21, 2009.
U.S. Geological Survey. 2010b. 2007 Minerals Yearbook, California (Advance Release).March 2010.
Wallace, R.E. 1990. The San Andreas Fault System, California. U.S. Geological Survey.Professional Paper 1515.
Qls
0 1,000 2,000Feet
V
PIO PICOENERGY CENTER
PROJECT NO.: 29874838DATE: DECEMBER 2010
FIGURE 5.3-1AGEOLOGY
LegendProject Site
Laydown Area
Area Within 2-Mile Perimeter of Study Area
Route A 230 kV Transmission Line
Route B 230 kV Transmission Line
Route A Natural Gas Line
Route B Natural Gas Line
Source: Geologic Map of the Otay Mesa 7.5' Quadrangle San Diego County, California: A Digital Database, 2002and Geologic Map of the Jamul Mountain 7.5' Quadrangle San Diego County, California: A Digital Database, 2002
Holocence alluvial deposits; unconsolidated to poorly consolidated silt, clay, sandand gravel. Includes modern active sedmients along small drainage channels.Qya
Landslide deposits (Holocene and Late Pleistocene); landslide slump androck fall deposits. On map, the deposit is depicted by landslide arrowsQls
Alluvial deposits (late to middle Pleistocene); moderately consolidated, poorlysorted flood plain deposits consisting of gravelly sandy silt and clay.Qoa
Alluvial deposits (middle to early Pleistocene); well consolidated, poorlysorted flood plain deposits consisting of gravel, sand, silt and clay.Qvoa
Late Holocene active channel and wash deposits; unconsolidated sand, silt,gravel and clay. Deposits along smaller drainage channels are included in Qya.Qw Otay Formation (Oligocene to Miocene); poorly indurated massive lightcolored
sandstone, siltstone and claystone, interbedded with bentonite lenses.To
Otay Formation-fanglomerate facies (Oligocene to Miocene); poorly cementedbouldery conglomerate and coarse-grained sandstone. Interfingered with overlying To.Tof
Metavolcanic rocks (Jurassic and Cretaceous); mildly metamorphosed volcanic,volcaniclastic and sedimentary rocks. Volcanic rocks range from basalt to rhyolite, but arepredominantly andesite and dacite. In general, metavolcaniclastic rocks are most abundant.
KJmv
MAP SYMBOLSContact between map units.
Air photo lineaments that define major joints. No significant evidence offaulting has been observed along these features.
Landslide (Qls) - arrow(s) indicate principal direction of movement, outlineincludes headscarp of landslide.
Strike and dip of foliation in metavolcanic rocks.25
Strike and dip of inclined sedimentary beds.5
Qls
0 1,000 2,000Feet
V
PIO PICOENERGY CENTER
PROJECT NO.: 29874638DATE: DECEMBER 2010
FIGURE 5.3-1BGEOLOGY
LegendProject Site
Laydown Area
Area Within 2-Mile Perimeter of Study Area
Route A 230 kV Transmission Line
Route B 230 kV Transmission Line
Route A Natural Gas Line
Route B Natural Gas Line
Source: Geologic Map of the Otay Mesa 7.5' Quadrangle San Diego County, California: A Digital Database, 2002
Holocence alluvial deposits; unconsolidated to poorly consolidated silt, clay, sandand gravel. Includes modern active sedmients along small drainage channels.Qya
Landslide deposits (Holocene and Late Pleistocene); landslide slump androck fall deposits. On map, the deposit is depicted by landslide arrowsQls
Alluvial deposits (late to middle Pleistocene); moderately consolidated, poorlysorted flood plain deposits consisting of gravelly sandy silt and clay.Qoa
Alluvial deposits (middle to early Pleistocene); well consolidated, poorlysorted flood plain deposits consisting of gravel, sand, silt and clay.Qvoa
Late Holocene active channel and wash deposits; unconsolidated sand, silt,gravel and clay. Deposits along smaller drainage channels are included in Qya.Qw Otay Formation (Oligocene to Miocene); poorly indurated massive lightcolored
sandstone, siltstone and claystone, interbedded with bentonite lenses.To
Otay Formation-fanglomerate facies (Oligocene to Miocene); poorly cementedbouldery conglomerate and coarse-grained sandstone. Interfingered with overlying To.Tof
Metavolcanic rocks (Jurassic and Cretaceous); mildly metamorphosed volcanic,volcaniclastic and sedimentary rocks. Volcanic rocks range from basalt to rhyolite, but arepredominantly andesite and dacite. In general, metavolcaniclastic rocks are most abundant.
KJmv
MAP SYMBOLS
Contact between map units.
Air photo lineaments that define major joints. No significant evidence offaulting has been observed along these features.
Landslide (Qls) - arrow(s) indicate principal direction of movement, outlineincludes headscarp of landslide.
Strike and dip of foliation in metavolcanic rocks.25
Source: Department of Conservation, California Geological Survey, Digital Database ofQuaternary and Younger Faults from the Fault Activity Map of California, 2005.
PIO PICOENERGY CENTER
PROJECT NO.: 29874838DATE: DECEMBER 2010
FIGURE 5.3-2REGIONAL FAULTS AND
EARTHQUAKE EPICENTERS
Faults not shown within southern portion of map due to limited availability of mapping.
California Energy Commission – EFSD Rev 3/07 1 Data Adequacy Worksheets
Adequacy Issue: Adequate Inadequate DATA ADEQUACY WORKSHEET Revision No. 0 Date
Technical Area: GEOLOGICAL HAZARDS Project: Pio Pico Energy Center Technical Staff:
Project Manager: Docket: Technical Senior:
SITINGREGULATIONS INFORMATION
AFC PAGE NUMBER ANDSECTION NUMBER
ADEQUATEYES OR NO
INFORMATION REQUIRED TO MAKE AFC CONFORMW ITH REGULATIONS
Appendix B(g) (1)
… provide a discussion of the existing siteconditions, the expected direct, indirect andcumulative impacts due to the construction,operation and maintenance of the project, themeasures proposed to mitigate adverseenvironmental impacts of the project, theeffectiveness of the proposed measures, and anymonitoring plans proposed to verify theeffectiveness of the mitigation.
Sections 5.3.1, 5.3.2,5.3.3, and 5.3.4
Appendix B(g) (17) (A)
A summary of the geology, seismicity, and geologicresources of the project site and related facilitiesincluding linear facilities.
Section 5.3.1
Appendix B(g) (17) (B)
A map at a scale of 1:24,000 and description of allrecognized stratigraphic units, geologic structures,and geomorphic features within two (2) miles of theproject site and along proposed facilities. Includean analysis of the likelihood of ground rupture,seismic shaking, mass wasting and slope stability,liquefaction, subsidence, tsunami runup, andexpansion or collapse of soil structures at the plantsite. Describe known geologic hazards along orcrossing linear facilities.
Figures 5.3-1A, 5.3-1B,and 5.3-2,Section 5.3.1
Appendix B(g) (17) (C)
A map and description of geologic resources ofrecreational, commercial, or scientific value whichmay be affected by the project. Include adiscussion of the techniques used to identify andevaluate these resources.
Figures 5.3-1A and5.3-1B, Section 5.3.1.14
California Energy Commission – EFSD Rev 3/07 2 Data Adequacy Worksheets
Adequacy Issue: Adequate Inadequate DATA ADEQUACY WORKSHEET Revision No. 0 Date
Technical Area: GEOLOGICAL HAZARDS Project: Pio Pico Energy Center Technical Staff:
Project Manager: Docket: Technical Senior:
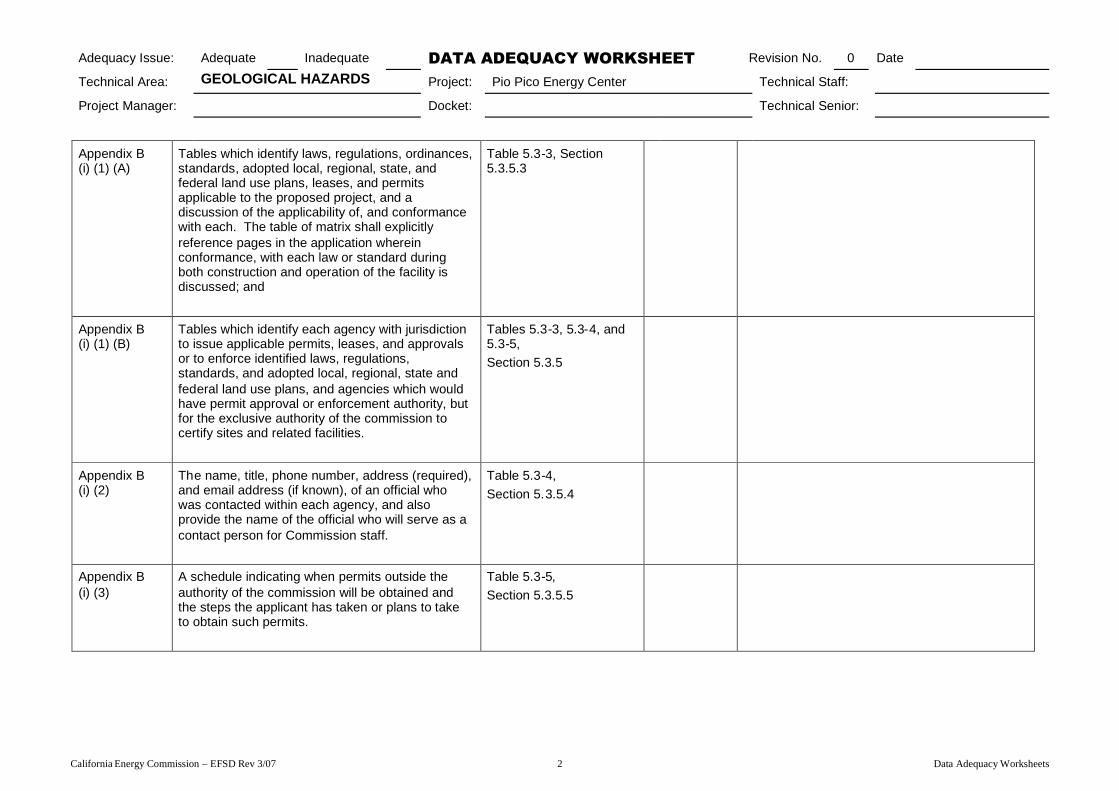
Appendix B(i) (1) (A)
Tables which identify laws, regulations, ordinances,standards, adopted local, regional, state, andfederal land use plans, leases, and permitsapplicable to the proposed project, and adiscussion of the applicability of, and conformancewith each. The table of matrix shall explicitlyreference pages in the application whereinconformance, with each law or standard duringboth construction and operation of the facility isdiscussed; and
Table 5.3-3, Section5.3.5.3
Appendix B(i) (1) (B)
Tables which identify each agency with jurisdictionto issue applicable permits, leases, and approvalsor to enforce identified laws, regulations,standards, and adopted local, regional, state andfederal land use plans, and agencies which wouldhave permit approval or enforcement authority, butfor the exclusive authority of the commission tocertify sites and related facilities.
Tables 5.3-3, 5.3-4, and5.3-5,Section 5.3.5
Appendix B(i) (2)
The name, title, phone number, address (required),and email address (if known), of an official whowas contacted within each agency, and alsoprovide the name of the official who will serve as acontact person for Commission staff.
Table 5.3-4,Section 5.3.5.4
Appendix B(i) (3)
A schedule indicating when permits outside theauthority of the commission will be obtained andthe steps the applicant has taken or plans to taketo obtain such permits.