+ All Categories
Home > Documents > SECTION -9 DAM BREAK ANALYSIS AND DISASTER...

SECTION -9 DAM BREAK ANALYSIS AND DISASTER...

Date post: 02-Apr-2020
Category:
Upload: others
View: 9 times
Download: 0 times
Share this document with a friend
40
Final EMP Report SECTION -9 DAM BREAK ANALYSIS AND DISASTER MANAGEMENT PLAN 9.0 INTRODUCTION Building a dam ensures a large number of benefits, but the failure of a dam is a potential hazard for downstream structures, property and the inhabitants. When a dam fails, the huge volume of water stored in the reservoir transforms into a flood wave, which can cause severe damages to the lives and properties situated downstream. The effect of such a flood disaster can be mitigated to a great extent, if the resultant magnitude of flood peak and its time of arrival at different locations downstream of the dam can be estimated, facilitating planning of the emergency action measures. This warrants dam break modelling, which assesses the flood hydrograph of discharge from the dam breach and maximum water level at different locations of the river downstream of the dam due to propagation of flood waves along with their time of occurrence. Dam break may be summarised as the partial or catastrophic failure of a dam leading to the uncontrolled release of water. Such an event can have a major impact on the land and communities downstream of the failed structure. A dam break may result in a flood wave up to tens of meters deep travelling along a valley at quite high speeds. The impact of such a wave on developed areas can be sufficient to completely destroy infrastructures, like roads, railways and bridges and also human habitats. With such destructive force comes an inevitable loss of life, if advance warning and evacuation is not possible. Additional features of such extreme flooding include movement of large amounts of sediment (mud) and debris along with the risk of distributing pollutants from any sources, such as, chemical works or mines in the flood risk area. Though, there have been great advances in the design methodologies, failures of dams and water retaining structures occur from time to time. Failure of the Malpasset concrete dam in France in 1959 led to 433 casualties and eventually prompted the introduction of dam safety legislation in France. In June 2005, there was a sudden breach in the lake. The flash floods Luhri HEP Stage-I, 210 MW 9.1
Transcript

Final EMP Report

SECTION -9

DAM BREAK ANALYSIS AND DISASTER MANAGEMENT

PLAN

9.0 INTRODUCTION

Building a dam ensures a large number of benefits, but the failure of a dam is a potential

hazard for downstream structures, property and the inhabitants. When a dam fails, the huge

volume of water stored in the reservoir transforms into a flood wave, which can cause severe

damages to the lives and properties situated downstream. The effect of such a flood disaster

can be mitigated to a great extent, if the resultant magnitude of flood peak and its time of

arrival at different locations downstream of the dam can be estimated, facilitating planning

of the emergency action measures. This warrants dam break modelling, which assesses the

flood hydrograph of discharge from the dam breach and maximum water level at different

locations of the river downstream of the dam due to propagation of flood waves along with

their time of occurrence.

Dam break may be summarised as the partial or catastrophic failure of a dam leading to the

uncontrolled release of water. Such an event can have a major impact on the land and

communities downstream of the failed structure. A dam break may result in a flood wave up

to tens of meters deep travelling along a valley at quite high speeds. The impact of such a

wave on developed areas can be sufficient to completely destroy infrastructures, like roads,

railways and bridges and also human habitats. With such destructive force comes an

inevitable loss of life, if advance warning and evacuation is not possible. Additional features

of such extreme flooding include movement of large amounts of sediment (mud) and debris

along with the risk of distributing pollutants from any sources, such as, chemical works or

mines in the flood risk area.

Though, there have been great advances in the design methodologies, failures of dams and

water retaining structures occur from time to time. Failure of the Malpasset concrete dam in

France in 1959 led to 433 casualties and eventually prompted the introduction of dam safety

legislation in France. In June 2005, there was a sudden breach in the lake. The flash floods

Luhri HEP Stage-I, 210 MW 9.1

Final EMP Report

caused extensive damage to roads, bridges, and agricultural crops along Satluj in the

downstream of Khab. The Naptha Jakhri HEP had to be temporarily shut down due to heavy

siltation caused by this flash flood. The discharge recorded was about 3000 cumecs.

Maximum discharge of 6,500 cumecs was also recorded during the August 2000 flash flood.

Such extreme events in Satluj valley alarm us for a future disaster, like dam failure, that is

likely to happen in case of large water discharge in the river channel following some natural

hazards like cloud bursts, landslide, dam breach etc.

In addition, it is to be noted that a number of dams have been constructed in the upstream of

Luhri HEP Stage-I i.e. Nathpa Jhakri, Baspa and Karcham Wangtu are under operational

stage. The downstream projects, Koldam and Bhakra dam are operational stage and Luhri

HEP Stage-II and Sunni Dam Project are under conceptualization stage and survey and

investigation stage respectively. It is necessary to have a dam break model considering the

upstream existing and proposed reservoirs however, with the limitation of available data the

present dam break model only considers the reservoir and design of Luhri HEP Stage-I.

The above instances of dam break establish that the hazard posed by dams, large and small

alike, is very real. As the public awareness on this potential hazard grows, managing and

minimizing the risk from these structures has become an essential requirement rather than a

management option to mitigate and manage disaster.HECRAS 2D model was considered to

prepare the disaster management plan.

9.1. NEED FOR DAM BREAK MODELLING

In India, risk assessment and disaster management plan has been made a mandatory

requirement, while carrying out EIA studies of the river valley projects. Preparation of

Emergency Action Plan after detailed dam break study has become a major component of

dam safety programme in India. The extreme nature of dam break floods means that flow

conditions will far exceed the magnitude of most natural flood events. Under these

conditions, flow will behave differently compared to the conditions assumed for Normal

River flow modelling. The discharge flood will inundate areas that are not normally

considered in a natural flood. This makes dam break modelling an independent and important

study for the risk management and emergency action plan.

The objective of dam break modelling or flood routing is to simulate the movement of a dam

break flood wave along a valley or indeed any area ‘downstream’ that would flood as a result

Luhri HEP Stage-I, 210 MW 9.2

Final EMP Report

of dam failure. The key information required at any point of interest within this flood zone is

generally:

• Time of first arrival of flood water

• Peak water level (extent of inundation)

• Time of peak water level

• Depth and velocity of flood water (allowing estimation of damage potential)

• Duration of flooding

The nature, accuracy and format of information produced from a dam break analysis will

beinfluenced by the end application of the data. For example:

i) Emergency Planning

To prepare an emergency plan reasonably well, it will be necessary for the dam break

analysis to provide:

• Inundation maps at a scale sufficient to determine the extent of flooding in relation to

people at risk, properties and access routes

• Identification of structures (bridges etc.) likely to be destroyed.

• Indication of main flow areas (damage potential of flow)

• Timing of the arrival and peak of the flood wave

• Identification of features likely to affect mobility/evacuation during and after the event

including impact on infrastructure and the deposition and scour of debris and sediment.

ii) Development Control

Development control will focus mainly on the extent of possible inundation resulting from

different failure scenarios. Consideration may also be given to the characteristics of the

population at risk.

iii) Insurance Companies

The aim of insurance companies will be to determine their exposure to risk through

identifying both the probability of failure and the financial impact of flooding. Modelling

and mapping will, therefore, need to be at accuracy sufficient to determine impact on

properties. An assessment of damage potential will also assist in impact assessment.

Luhri HEP Stage-I, 210 MW 9.3

Final EMP Report

Appreciating the need for evolving an effective and efficient disaster management plan to be

prepared in the unlikely event of failure of Luhri HEP Stage-I the present dam break

modelling study is aimed at:

• Prediction of outflow hydrograph due to dam breach.

• Routing of hydrograph through the downstream valley to get the maximum water

level.

• Flood discharge along with time of travel at different locations of the river

downstream of the dam.

9.2 DAM BREAK MODELLING PROCESS

Generally, dam break modelling can be carried out by either) scaled physical hydraulic

models, orii) computer aided mathematical simulations. A modern tool to deal with this

problem is the mathematical model, which is most cost effective and reasonably solves the

governing flow equations of continuity and momentum by computer simulation.

Mathematical modelling of dam breach floods can be carried out by either one dimensional or

two-dimensional analysis. In one dimensional analysis, the information about the magnitude

of flood, i.e., discharge and water levels and their variation with time and velocity of

flow through breach can be had in the direction of flow. In the case of two dimensional

analyses, the additional information about the inundated area, variation of surface elevation

and velocities in two dimensions can be assessed.

In the instant case of Luhri HEP Stage I, since Dam breach analysis has to be carried out, 2D

modelling was adopted, which can handle overtopping and breaching of dams in a more

precise and effective way.

9.2.1 Hydrodynamic Modelling

The essence of dam break modelling is hydrodynamic modelling, which involves finding

solution of two partial differential equations originally derived by Barre De Saint Venant in

1871. The equations are:

1) Conservation of mass (continuity) equation

(∂Q/∂X) + ∂(A+Ao) / ∂t – q = 0

2) Conservation of momentum equation

(∂Q/∂t) + { ∂(Q+ A2) / ∂X} + g A(( ∂h/∂X) = Sf + Sc) = 0

where,

Q = discharge, A = active flow area, A0 = inactive storage area, h = water surface Luhri HEP Stage-I, 210 MW 9.4

Final EMP Report

elevation,

q= lateral outflow, x = distance along waterway, t = time, Sf = friction slope, Sc =

expansion contraction slope and g = gravitational acceleration

The following three approaches simulate branches as well as looped systems.

Kinematic wave approach: The flow is calculated from the assumption of balance between

the friction and gravity forces. The simplification implies that the Kinematic wave approach

cannot simulate backwater effects.

Diffusive wave approach: In addition to the friction and gravity forces, the

Hydrostatic gradient is included in this description. This allows the user to take downstream

boundaries into account, and thus, simulate backwater effects.

Dynamic wave approach: Using the full momentum equation, including

acceleration forces, the user can simulate fast transients, tidal flows, etc., in the system.

Depending on the type of problem, model boundaries would be chosen at points, where either

water level or discharge measurements are available so that the model is used for predictive

purposes. It is important that the selected boundary locations lie outside the range of

influences of any anticipated changes in the hydraulic system.

9.2.2 Description of Reservoir and Appurtenant Structures
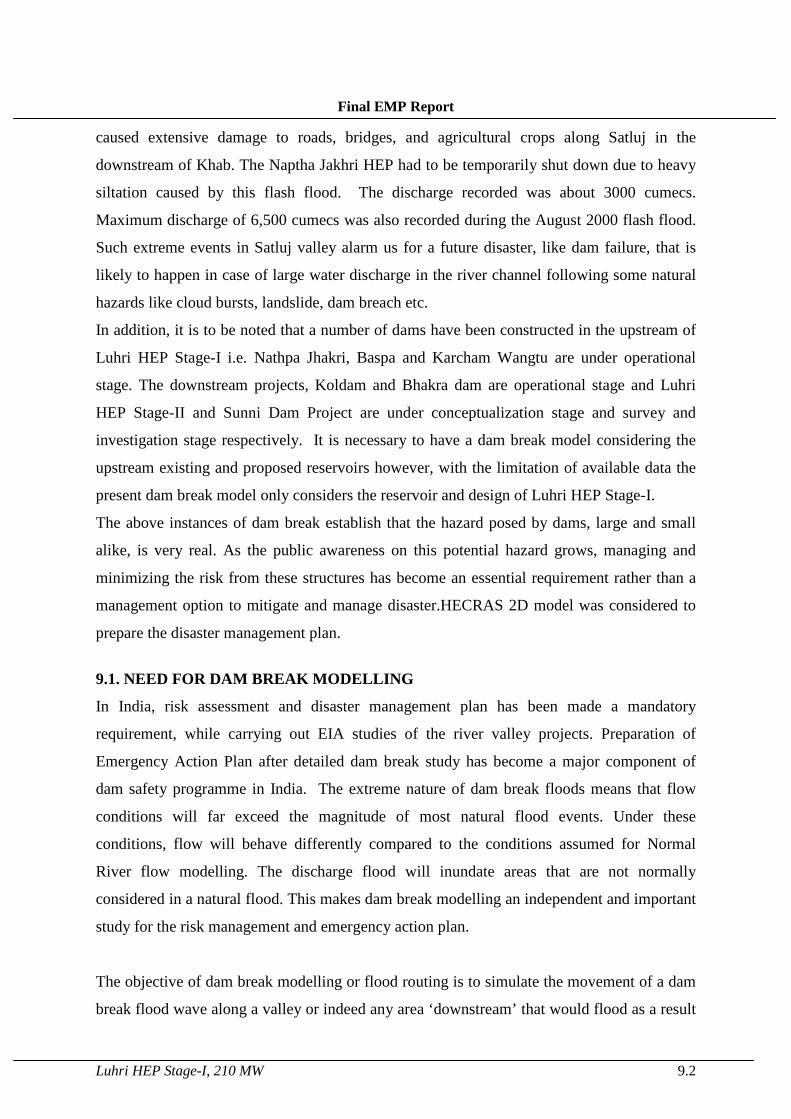
1) Study Area

Though the EIA project has been carried out for 10 Km radius above the dam site, as far as

dam break analysis is concerned, there is no impact on upstream of the dam area, rather the

downstream is going to be worst affected. Hence ~15km downstream of the dam location is

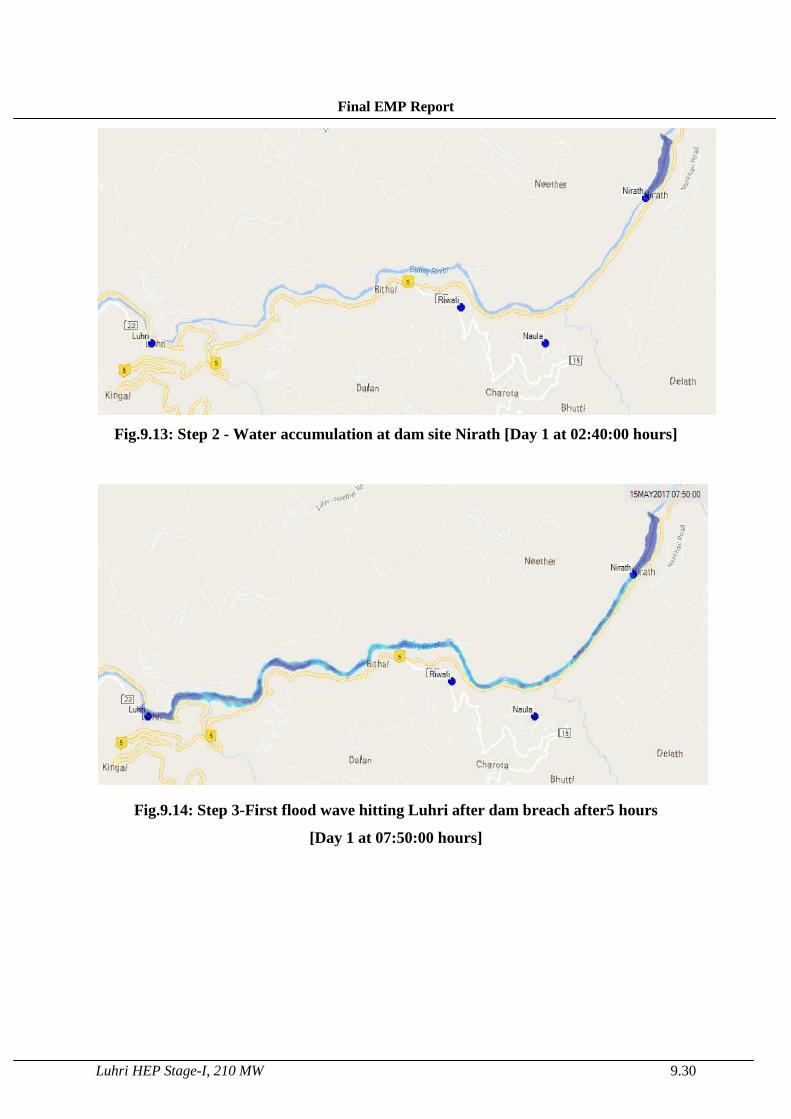
studied (Fig. 9.1). It includes villages such as Nirath, Naula, Bithal, Luhri, Riwali, Behna.

Dam is proposed to be constructed in Nirath village hence is the inlet boundary condition of

the study area domain.

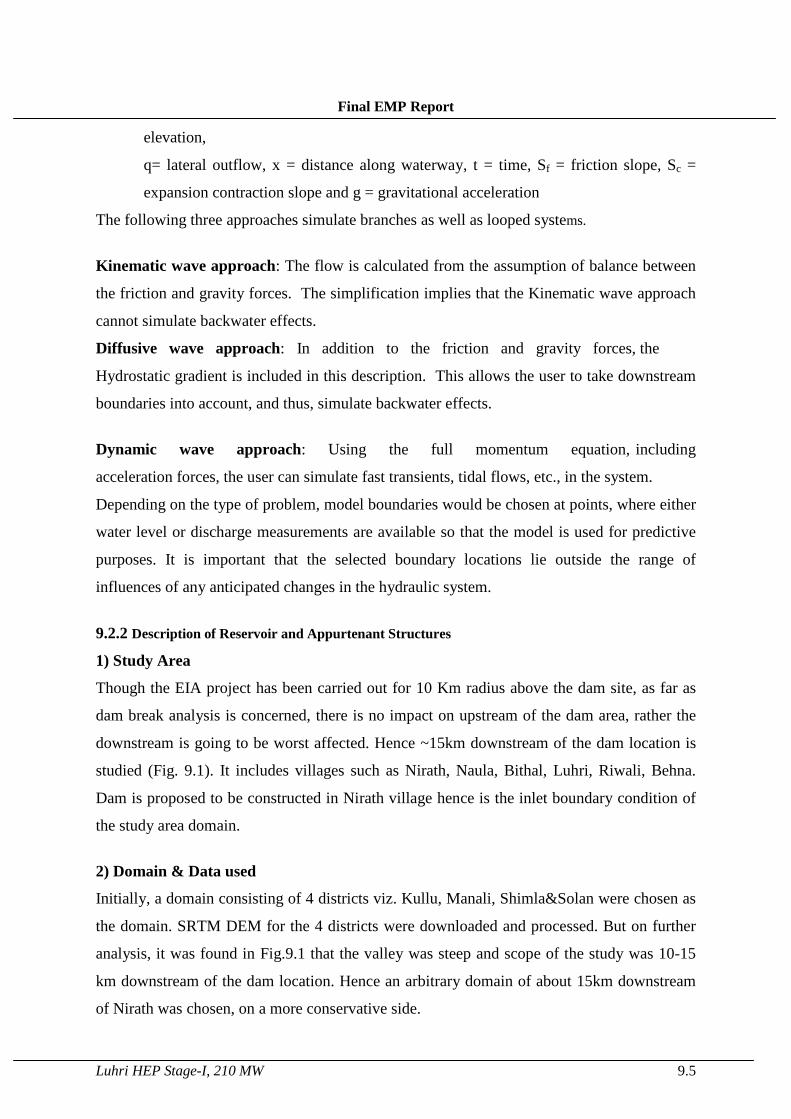
2) Domain & Data used

Initially, a domain consisting of 4 districts viz. Kullu, Manali, Shimla&Solan were chosen as

the domain. SRTM DEM for the 4 districts were downloaded and processed. But on further

analysis, it was found in Fig.9.1 that the valley was steep and scope of the study was 10-15

km downstream of the dam location. Hence an arbitrary domain of about 15km downstream

of Nirath was chosen, on a more conservative side.

Luhri HEP Stage-I, 210 MW 9.5

Final EMP Report

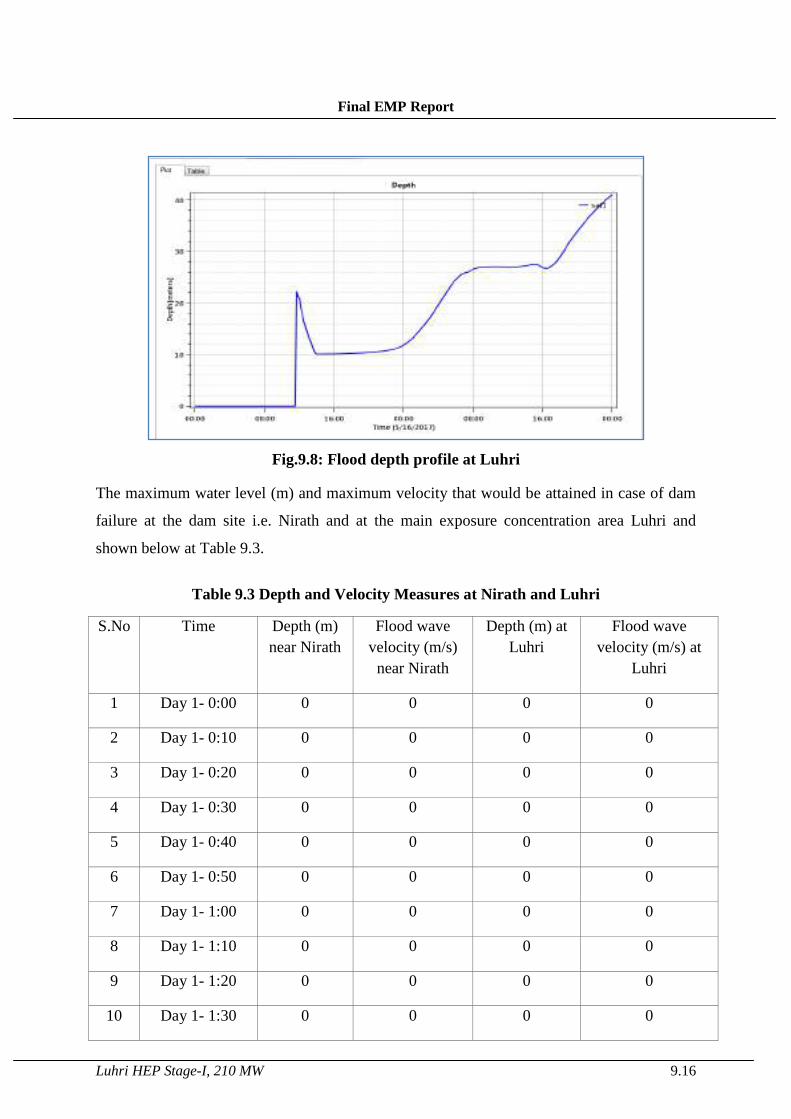
Fig.9.1: Area of Study for Dam Break Analysis

Full domain was divided into 50 m mesh for 2D computation. 48,000 cells were generated on

a mesh. Fig. 9.2(a) &(b) shows the model setup overview.

Fig.9.2(a):Computation domain

Luhri HEP Stage-I, 210 MW 9.6

Final EMP Report

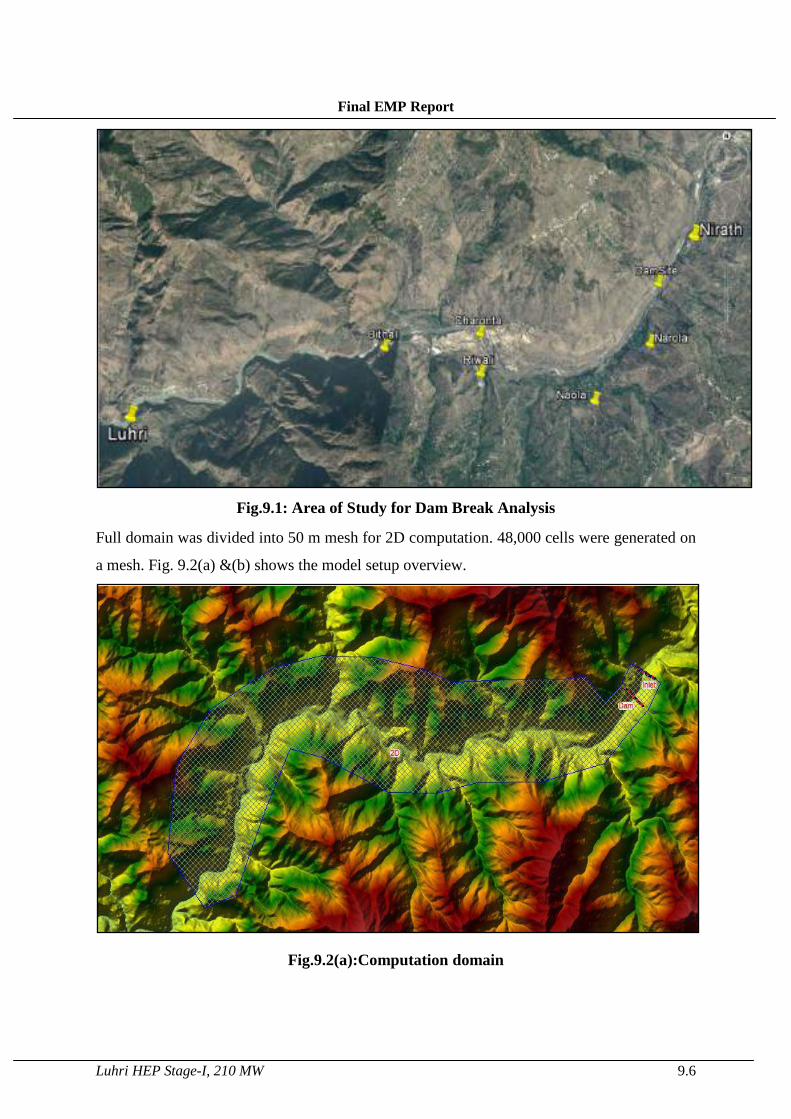
Fig. 9.2(b): Zoomed view of Dam location

2) Reservoir& Dam

To obtain an accurate description of the reservoir storage characteristics, the reservoir is

normally modelled as a single h-point in the model. This will usually correspond near to the

upstream boundary of the model where the inflow hydrograph is also specified.

Specifications of dam are obtained from the cross-sectional profiles drawings of the dam.

Fig.9.3& 9.4 shows the placement of dam and the inlet boundary condition setup in the

HECRAS 2D model. As per the design, Dam of 8m thickness and top level at 860 m from

MSL and width of 200m was considered.

Luhri HEP Stage-I, 210 MW 9.7

Final EMP Report

Fig.9.3: CS view of Dam in HECRAS 2D 9.2.3 Boundary conditions for dam break modelling

The boundary conditions are to be specified for both upstream and downstream limits of the

model. The upstream boundary will generally be an inflow into the reservoir which is shown

in Fig. 9.2 (a) & (b). The downstream boundary will generally be a stage-discharge

relationship at the tail of the domain.

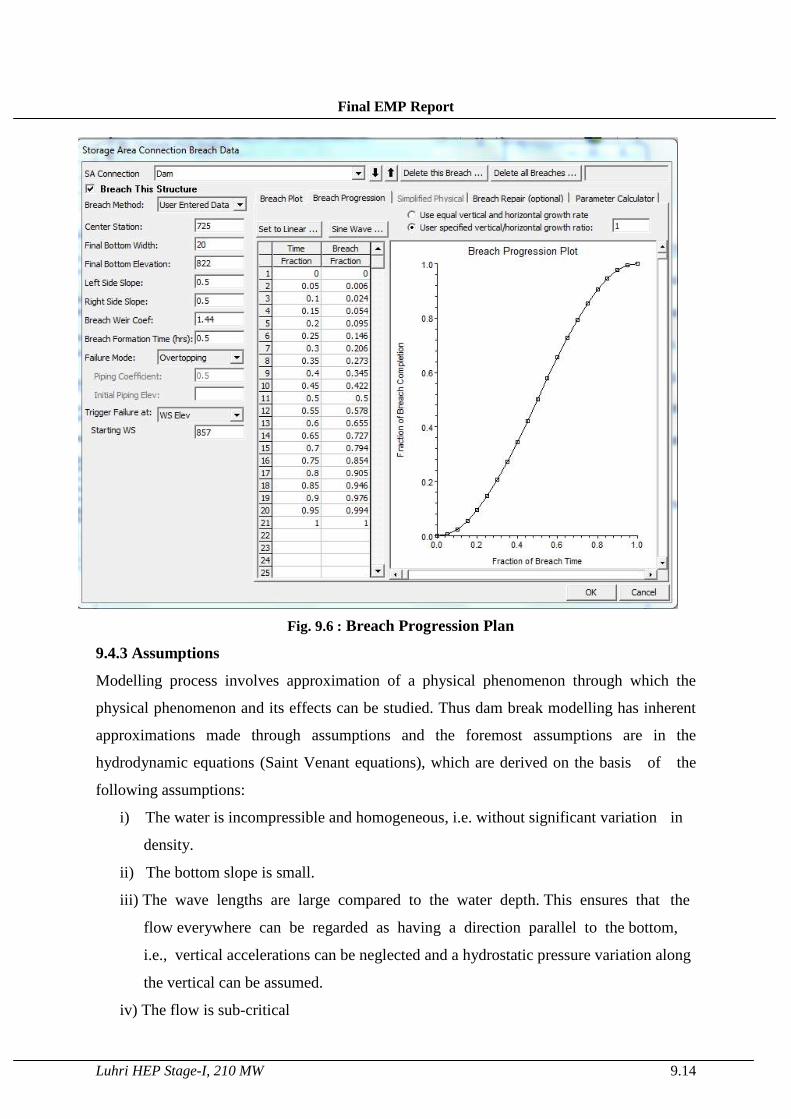
9.2.4 Specifications of dam break structures The information relating to dam break structures need to be specified are geometrical

specifications, breach characteristics, failure moment, and failure mode.

a) Geometrical Specifications

The geometrical specifications for the dam break structure are taken from the longitudinal

cross sections of the dam.

b) Breach Characteristics

Breach characteristics, viz. breach development period, breach section profile, etc., are vital

for the dam break modelling, but at the same time are difficult to predict. Past experience

provides clues for reasonable assessment of breach characteristics. Concrete dams breach in

a short period, say 10-15 minutes. But, Earth and Rock-fill dams usually do not collapse

instantaneously, but develop breaches, which increase gradually. The breach development

period may vary between a few minutes up to a few hours, depending on, among other, the

dam geometry and the construction material. The development of the breach determines the

Luhri HEP Stage-I, 210 MW 9.8

Final EMP Report

breach outflow hydrograph and an accurate description of the breach development is,

therefore, required in "near field" dam breach studies. In the "far-field" studies, an accurate

flood routing procedure is of more importance because the outflow variation is rapidly

damped as the flood propagates downstream.

c) Failure moment

Like breach characteristics, prediction of failure moment is also very difficult. The time of

occurrence of failure depends on stress concentration due to structural inconsistency, material

properties, water level in the reservoir, etc. Since, no information is generally available about

stress concentration, it is quite reasonable to assume that failure of the dam will be initiated

when water level in the reservoir is at maximum.

9.3 INPUT DATA AND MODEL SETUP

9.3.1 Input data Requirement

Dam break flood analysis requires a range of data, to depict accurately, to the extent possible,

the topography and hydraulic conditions of the river course and dam break phenomenon. The

important data required are: i) DEM of the river flood plain from the dam site up to

location downstream of the dam up to which the study is required, ii) Elevation-surface area

relationship of the reservoir, iii) Rating curve of spillway and sluices, iv) Salient

features of all the hydraulic structures at the dam site and also in the study reach of the

river, v) Design flood hydrograph, vi) Manning's roughness coefficient (n) for different

reaches of the river under study, vii) Rating curve of all the hydraulic structures in the

study reach of the river. Where the dam break analysis includes an assessment of potential

impact and is combined with the development of an emergency action plan additional data

relating to the social and economic development of the area will also be required. Some of

the parameters considered in this study are given in Table 9.1.

Table 9.1: Basic data considered in the dam break Analysis

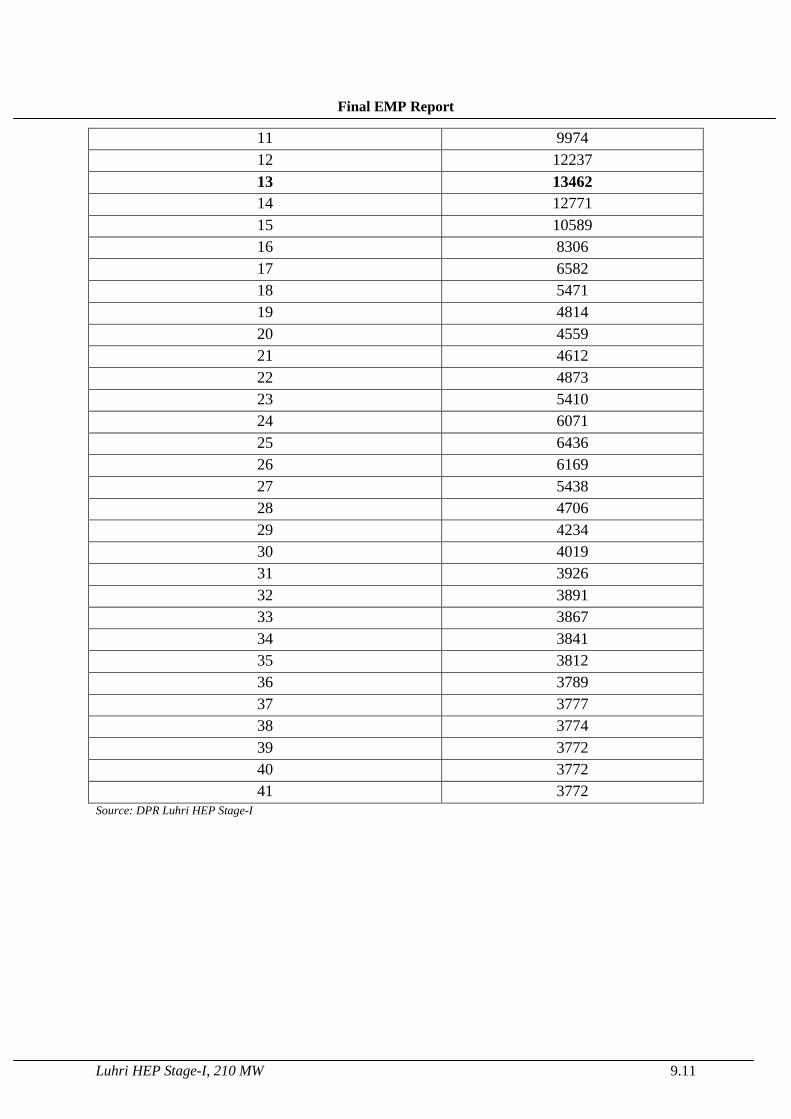
HYDROLOGY Minimum River bed level 811.20 m Manning's "n" 0.06 Probable Maximum Flood (PMF) 13462.00 m3/sec Gross Storage at FRL 25.2 X 10^6 m3

RESERVOIR FRL EL 857.00 m

Luhri HEP Stage-I, 210 MW 9.9

Final EMP Report

Source: DPR Luhri HEP Stage-I

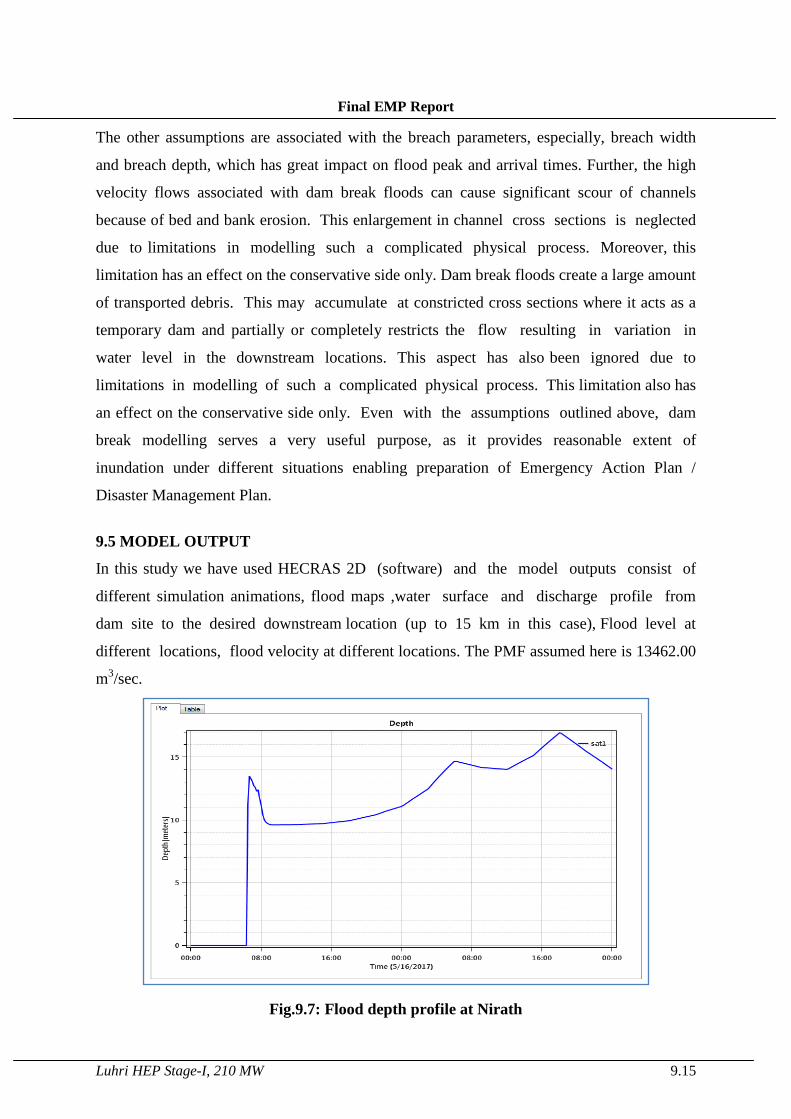
Dam of Luhri HEP Stage-I is a large dam, therefore, the Probable Maximum Flood (PMF)

hydrograph has been used as design flood hydrograph for the upstream boundary of the dam

break model set up. The PMF of the order of 13462.00 m3/sec, which has been applied at the

reservoir branch in the model set up. The flood routing for 13462.00 m3/sec is given in Table

9.2.

Table 9.2: Time versus Discharge Particulars

Table 9.2 Time (Hour) Discharge (cumecs)

0 3773 1 3783 2 3804 3 3857 4 3996 5 4362 6 4984 7 5555 8 6169 9 6873 10 8028

MWL El. 855.00 m MDDL EL 853.00 m

CONCRETE DAM Type Concrete Gravity Dam Top of Dam El. 860.00 m Height of the Dam 80.00 m Width of the Dam at top 8.0 m

SPILLWAY Type Combination of Upper Level Spillway(ULS)

and Low Level Spillway(LLS) and (sluice spillway)

Design Flood (PMF) 13462.00 m3/sec Spillway gates Radial Six (06), Flap One ( 01)

No of Bays LLS- 6 nos. ULS- 1 no

Crest Level LLS- EL 820.00 m ULS- EL 854.00 m

Energy Dissipation System Trajectory Bucket

Luhri HEP Stage-I, 210 MW 9.10

Final EMP Report

11 9974 12 12237 13 13462 14 12771 15 10589 16 8306 17 6582 18 5471 19 4814 20 4559 21 4612 22 4873 23 5410 24 6071 25 6436 26 6169 27 5438 28 4706 29 4234 30 4019 31 3926 32 3891 33 3867 34 3841 35 3812 36 3789 37 3777 38 3774 39 3772 40 3772 41 3772

Source: DPR Luhri HEP Stage-I

Luhri HEP Stage-I, 210 MW 9.11

Final EMP Report

Source: DPR of Luhri HEP Stage-I

Fig. 9.4: Inflow & Outflow Hydrographs

9.4 DAM BREAK SIMULATION

9.4.1 Selection of Dam Breach Parameters

Prediction of the dam breach parameters and timing of the breach are very important for any

dam break study, but are difficult to predict. However, assuming the dam fails, the important

aspects to deal with are, time of failure, extent of overtopping before failure, as well

as size, shape and time of the breach formation. Estimation of the dam break flood will

depend on these parameters. The breach characteristics that are needed as input to the

existing dam break models are: i) Centre station, ii) final bottom width iii) final bottom width

iv) failure mode v) reservoir level at time of start of breach. The predominant mechanism

of breach formation is, to a large extent, dependent on the type of dam and the cause due to

which the dam failed. Since this is a concrete dam, and there won’t observed dam breach for

any proposed dam, standard/arbitrary failure assumptions are made. As explained in Fig.9.5,

bottom width of 20 m at bottom elevation of 822 m, failure side slope of 0.5 is considered.

Luhri HEP Stage-I, 210 MW 9.12

Final EMP Report

Fig. 9.5: Dam Breach Characteristics

9.4.2 Critical condition for dam break study

The critical condition for a dam break study is when the reservoir is at FRL and design flood

hydrograph (PMF) is impinged. Accordingly, in the present study, keeping the reservoir at

FRL of 857.0 m, the PMF of the order of 13462.00 m3/sechas been impinged with all the

spillway gates fully open. The maximum water level reached in the reservoir is 857 m, after

the application of PMF. As the top of the dam is at El. 860.00 m for concrete structure, no

overtopping of the dam will occur. Further, it is reasonable to assume that the dam will

breach when the water level in the reservoir is at this maximum level. Breach progression

plan is also a major factor influencing the wave impacting the downstream. In this study sine

mode of breach propagation is adapted (Fig. 9.6), which represent more realistic scenario,

rather than a linear progression.

Luhri HEP Stage-I, 210 MW 9.13

Final EMP Report

Fig. 9.6 : Breach Progression Plan

9.4.3 Assumptions

Modelling process involves approximation of a physical phenomenon through which the

physical phenomenon and its effects can be studied. Thus dam break modelling has inherent

approximations made through assumptions and the foremost assumptions are in the

hydrodynamic equations (Saint Venant equations), which are derived on the basis of the

following assumptions:

i) The water is incompressible and homogeneous, i.e. without significant variation in

density.

ii) The bottom slope is small.

iii) The wave lengths are large compared to the water depth. This ensures that the

flow everywhere can be regarded as having a direction parallel to the bottom,

i.e., vertical accelerations can be neglected and a hydrostatic pressure variation along

the vertical can be assumed.

iv) The flow is sub-critical

Luhri HEP Stage-I, 210 MW 9.14

Final EMP Report

The other assumptions are associated with the breach parameters, especially, breach width

and breach depth, which has great impact on flood peak and arrival times. Further, the high

velocity flows associated with dam break floods can cause significant scour of channels

because of bed and bank erosion. This enlargement in channel cross sections is neglected

due to limitations in modelling such a complicated physical process. Moreover, this

limitation has an effect on the conservative side only. Dam break floods create a large amount

of transported debris. This may accumulate at constricted cross sections where it acts as a

temporary dam and partially or completely restricts the flow resulting in variation in

water level in the downstream locations. This aspect has also been ignored due to

limitations in modelling of such a complicated physical process. This limitation also has

an effect on the conservative side only. Even with the assumptions outlined above, dam

break modelling serves a very useful purpose, as it provides reasonable extent of

inundation under different situations enabling preparation of Emergency Action Plan /

Disaster Management Plan.

9.5 MODEL OUTPUT

In this study we have used HECRAS 2D (software) and the model outputs consist of

different simulation animations, flood maps ,water surface and discharge profile from

dam site to the desired downstream location (up to 15 km in this case), Flood level at

different locations, flood velocity at different locations. The PMF assumed here is 13462.00

m3/sec.

Fig.9.7: Flood depth profile at Nirath

Luhri HEP Stage-I, 210 MW 9.15

Final EMP Report

Fig.9.8: Flood depth profile at Luhri

The maximum water level (m) and maximum velocity that would be attained in case of dam

failure at the dam site i.e. Nirath and at the main exposure concentration area Luhri and

shown below at Table 9.3.

Table 9.3 Depth and Velocity Measures at Nirath and Luhri

S.No Time Depth (m) near Nirath

Flood wave velocity (m/s)

near Nirath

Depth (m) at Luhri

Flood wave velocity (m/s) at

Luhri

1 Day 1- 0:00 0 0 0 0

2 Day 1- 0:10 0 0 0 0

3 Day 1- 0:20 0 0 0 0

4 Day 1- 0:30 0 0 0 0

5 Day 1- 0:40 0 0 0 0

6 Day 1- 0:50 0 0 0 0

7 Day 1- 1:00 0 0 0 0

8 Day 1- 1:10 0 0 0 0

9 Day 1- 1:20 0 0 0 0

10 Day 1- 1:30 0 0 0 0

Luhri HEP Stage-I, 210 MW 9.16

Final EMP Report

11 Day 1- 1:40 0 0 0 0

12 Day 1- 1:50 0 0 0 0

13 Day 1- 2:00 0 0 0 0

14 Day 1- 2:10 0 0 0 0

15 Day 1- 2:20 0 0 0 0

16 Day 1- 2:30 0 0 0 0

17 Day 1- 2:40 0 0 0 0

18 Day 1- 2:50 0 0 0 0

19 Day 1- 3:00 0 0 0 0

20 Day 1- 3:10 0 0 0 0

21 Day 1- 3:20 0 0 0 0

22 Day 1- 3:30 0 0 0 0

23 Day 1- 3:40 0 0 0 0

24 Day 1- 3:50 0 0 0 0

25 Day 1- 4:00 0 0 0 0

26 Day 1- 4:10 0 0 0 0

27 Day 1- 4:20 0 0 0 0

28 Day 1- 4:30 0 0 0 0

29 Day 1- 4:40 0 0 0 0

30 Day 1- 4:50 0 0 0 0

31 Day 1- 5:00 0 0 0 0

32 Day 1- 5:10 0 0 0 0

33 Day 1- 5:20 0 0 0 0

34 Day 1- 5:30 0 0 0 0

35 Day 1- 5:40 0 0 0 0

36 Day 1- 5:50 0 0 0 0

Luhri HEP Stage-I, 210 MW 9.17

Final EMP Report

37 Day 1- 6:00 0 0 0 0

38 Day 1- 6:10 0 0 0 0

39 Day 1- 6:20 0 0 0 0

40 Day 1- 6:30 11.1857 7.7207 0 0

41 Day 1- 6:40 13.4852 7.9592 0 0

42 Day 1- 6:50 13.3041 7.9233 0 0

43 Day 1- 7:00 13.0676 7.954 0 0

44 Day 1- 7:10 12.7324 8.016 0 0

45 Day 1- 7:20 12.5891 8.0025 0 0

46 Day 1- 7:30 12.2863 8.0946 0 0

47 Day 1- 7:40 12.4025 8.0348 0 0

48 Day 1- 7:50 11.7202 8.2444 0 0

49 Day 1- 8:00 11.2377 8.7169 0 0

50 Day 1- 8:10 10.5117 12.251 0 0

51 Day 1- 8:20 10.0776 13.6036 0 0

52 Day 1- 8:30 9.8582 13.9573 0 0

53 Day 1- 8:40 9.7558 14.1204 0 0

54 Day 1- 8:50 9.683 14.2344 0 0

55 Day 1- 9:00 9.6324 14.3197 0 0

56 Day 1- 9:10 9.616 14.3531 0 0

57 Day 1- 9:20 9.6111 14.3679 0 0

58 Day 1- 9:30 9.6102 14.3747 0 0

59 Day 1- 9:40 9.611 14.3785 0 0

60 Day 1- 9:50 9.6121 14.3816 0 0

61 Day 1- 10:00 9.6132 14.3846 0 0

62 Day 1- 10:10 9.6144 14.3876 0 0

Luhri HEP Stage-I, 210 MW 9.18

Final EMP Report

63 Day 1- 10:20 9.6155 14.3906 0 0

64 Day 1- 10:30 9.6168 14.3935 0 0

65 Day 1- 10:40 9.6179 14.3965 0 0

66 Day 1- 10:50 9.6191 14.3994 0 0

67 Day 1- 11:00 9.6202 14.4024 0 0

68 Day 1- 11:10 9.6213 14.4054 0 0

69 Day 1- 11:20 9.6225 14.4083 0 0

70 Day 1- 11:30 9.6237 14.4113 0 0

71 Day 1- 11:40 9.6248 14.4142 19.1317 1.6065

72 Day 1- 11:50 9.626 14.4172 18.1803 0.7691

73 Day 1- 12:00 9.6271 14.4201 17.775 0.6272

74 Day 1- 12:10 9.6303 14.4306 15.8506 1.0072

75 Day 1- 12:20 9.6346 14.4421 14.9886 0.8275

76 Day 1- 12:30 9.6389 14.4534 13.4191 0.981

77 Day 1- 12:40 9.6434 14.4653 12.7151 0.8078

78 Day 1- 12:50 9.6478 14.4762 11.7139 0.9248

79 Day 1- 13:00 9.6523 14.4868 10.8256 0.9613

80 Day 1- 13:10 9.6567 14.4972 9.9819 0.9885

81 Day 1- 13:20 9.6611 14.5077 9.2847 1.0397

82 Day 1- 13:30 9.6655 14.5179 8.4883 1.1094

83 Day 1- 13:40 9.6699 14.5284 7.7742 1.2076

84 Day 1- 13:50 9.6743 14.5389 7.3096 1.2824

85 Day 1- 14:00 9.6787 14.5493 7.2009 1.2927

86 Day 1- 14:10 9.6831 14.5596 7.1818 1.2976

87 Day 1- 14:20 9.6875 14.5702 7.1865 1.2987

88 Day 1- 14:30 9.6919 14.5804 7.1926 1.2998

Luhri HEP Stage-I, 210 MW 9.19

Final EMP Report

89 Day 1- 14:40 9.6963 14.5907 7.1964 1.3014

90 Day 1- 14:50 9.7006 14.6021 7.1994 1.303

91 Day 1- 15:00 9.7051 14.617 7.2021 1.3047

92 Day 1- 15:10 9.715 14.6568 7.205 1.3063

93 Day 1- 15:20 9.7278 14.7018 7.2076 1.308

94 Day 1- 15:30 9.7408 14.7462 7.2104 1.3097

95 Day 1- 15:40 9.7538 14.789 7.2133 1.3115

96 Day 1- 15:50 9.7667 14.8311 7.2166 1.3136

97 Day 1- 16:00 9.7796 14.8728 7.2207 1.3163

98 Day 1- 16:10 9.7924 14.9142 7.2259 1.3197

99 Day 1- 16:20 9.8052 14.9553 7.2321 1.3236

100 Day 1- 16:30 9.8178 14.9972 7.239 1.328

101 Day 1- 16:40 9.8304 15.0373 7.2465 1.3327

102 Day 1- 16:50 9.843 15.077 7.2543 1.3376

103 Day 1- 17:00 9.8553 15.1165 7.2624 1.3426

104 Day 1- 17:10 9.8677 15.1559 7.2704 1.3475

105 Day 1- 17:20 9.8801 15.1948 7.2784 1.3525

106 Day 1- 17:30 9.8923 15.2335 7.2868 1.3577

107 Day 1- 17:40 9.9046 15.272 7.2952 1.3629

108 Day 1- 17:50 9.9167 15.3101 7.3033 1.3679

109 Day 1- 18:00 9.9288 15.348 7.3113 1.3728

110 Day 1- 18:10 9.9511 15.4279 7.3192 1.3777

111 Day 1- 18:20 9.9781 15.5133 7.3271 1.3826

112 Day 1- 18:30 10.0051 15.5967 7.3351 1.3875

113 Day 1- 18:40 10.032 15.6779 7.3433 1.3926

114 Day 1- 18:50 10.0587 15.759 7.3524 1.3984

Luhri HEP Stage-I, 210 MW 9.20

Final EMP Report

115 Day 1- 19:00 10.0856 15.8495 7.3636 1.4055

116 Day 1- 19:10 10.1124 15.9465 7.3768 1.4138

117 Day 1- 19:20 10.1392 16.0491 7.3919 1.4232

118 Day 1- 19:30 10.1661 16.1584 7.4083 1.4332

119 Day 1- 19:40 10.1927 16.2425 7.4258 1.4437

120 Day 1- 19:50 10.2194 16.3185 7.444 1.4545

121 Day 1- 20:00 10.2453 16.395 7.4624 1.4651

122 Day 1- 20:10 10.2703 16.4759 7.481 1.4756

123 Day 1- 20:20 10.2963 16.538 7.5001 1.4861

124 Day 1- 20:30 10.3221 16.5289 7.5198 1.4966

125 Day 1- 20:40 10.348 16.5167 7.5402 1.5069

126 Day 1- 20:50 10.3736 16.503 7.5614 1.5169

127 Day 1- 21:00 10.3989 16.4882 7.5832 1.5265

128 Day 1- 21:10 10.4343 16.4869 7.6058 1.5355

129 Day 1- 21:20 10.4743 16.4486 7.6293 1.544

130 Day 1- 21:30 10.5142 16.3984 7.6545 1.5521

131 Day 1- 21:40 10.554 16.3405 7.6824 1.5598

132 Day 1- 21:50 10.5932 16.2707 7.7133 1.5679

133 Day 1- 22:00 10.6441 16.2034 7.7484 1.5768

134 Day 1- 22:10 10.683 16.1268 7.7897 1.586

135 Day 1- 22:20 10.7192 15.9847 7.8391 1.5967

136 Day 1- 22:30 10.7552 15.8283 7.8928 1.6072

137 Day 1- 22:40 10.7914 15.6669 7.9497 1.6156

138 Day 1- 22:50 10.8273 15.5039 8.0103 1.6224

139 Day 1- 23:00 10.8629 15.3431 8.0753 1.6276

140 Day 1- 23:10 10.8984 15.1811 8.1475 1.6316

Luhri HEP Stage-I, 210 MW 9.21

Final EMP Report

141 Day 1- 23:20 10.9337 15.0213 8.2283 1.6328

142 Day 1- 23:30 10.9686 14.8648 8.333 1.6307

143 Day 1- 23:40 11.0034 14.7114 8.4623 1.6261

144 Day 1- 23:50 11.0382 14.5615 8.607 1.6177

145 Day 2- 0:00 11.0728 14.4147 8.7698 1.6066

146 Day 2- 0:10 11.1371 14.2355 8.9486 1.5926

147 Day 2- 0:20 11.2124 13.9884 9.1415 1.5763

148 Day 2- 0:30 11.2923 13.7243 9.3492 1.5581

149 Day 2- 0:40 11.3734 13.4957 9.5746 1.54

150 Day 2- 0:50 11.4539 13.2941 9.8171 1.5247

151 Day 2- 1:00 11.5336 13.1158 10.0771 1.5144

152 Day 2- 1:10 11.6127 12.9596 10.3506 1.5075

153 Day 2- 1:20 11.6927 12.8214 10.6394 1.501

154 Day 2- 1:30 11.7697 12.7201 10.941 1.4958

155 Day 2- 1:40 11.8446 12.6502 11.254 1.4887

156 Day 2- 1:50 11.9196 12.5975 11.5806 1.4779

157 Day 2- 2:00 11.996 12.5584 11.9139 1.4649

158 Day 2- 2:10 12.0743 12.5301 12.258 1.4472

159 Day 2- 2:20 12.1523 12.513 12.6105 1.4212

160 Day 2- 2:30 12.229 12.5004 12.9689 1.3597

161 Day 2- 2:40 12.3049 12.5007 13.3335 1.3453

162 Day 2- 2:50 12.3803 12.5105 13.7053 1.3305

163 Day 2- 3:00 12.4553 12.5291 14.093 1.313

164 Day 2- 3:10 12.5743 12.6111 14.4894 1.2977

165 Day 2- 3:20 12.7109 12.6948 14.892 1.282

166 Day 2- 3:30 12.8464 12.7855 15.2997 1.2678

Luhri HEP Stage-I, 210 MW 9.22

Final EMP Report

167 Day 2- 3:40 12.9807 12.8923 15.7145 1.237

168 Day 2- 3:50 13.1119 13.0052 16.1393 1.2249

169 Day 2- 4:00 13.2403 13.1254 16.5754 1.2197

170 Day 2- 4:10 13.3669 13.249 17.0156 1.2138

171 Day 2- 4:20 13.4921 13.3744 17.4574 1.2096

172 Day 2- 4:30 13.6154 13.5014 17.8991 1.206

173 Day 2- 4:40 13.7374 13.629 18.3401 1.1997

174 Day 2- 4:50 13.8581 13.757 18.7788 1.1831

175 Day 2- 5:00 13.9774 13.8847 19.2176 1.182

176 Day 2- 5:10 14.0955 14.0121 19.6487 1.1825

177 Day 2- 5:20 14.2113 14.1389 20.0711 1.1878

178 Day 2- 5:30 14.325 14.2654 20.4782 1.1951

179 Day 2- 5:40 14.4377 14.391 20.8589 1.1982

180 Day 2- 5:50 14.5491 14.5157 21.2009 1.2383

181 Day 2- 6:00 14.6583 14.6341 21.4691 1.2534

182 Day 2- 6:10 14.6709 14.6063 21.6926 1.2794

183 Day 2- 6:20 14.6464 14.575 22.0287 1.2591

184 Day 2- 6:30 14.6188 14.5447 22.3115 1.2677

185 Day 2- 6:40 14.5909 14.5146 22.5163 1.3278

186 Day 2- 6:50 14.5628 14.4845 22.6287 1.3185

187 Day 2- 7:00 14.5351 14.4541 22.759 1.3087

188 Day 2- 7:10 14.5072 14.4222 22.8599 1.2775

189 Day 2- 7:20 14.4788 14.3902 22.8839 1.2754

190 Day 2- 7:30 14.4504 14.3582 23.0328 1.2506

191 Day 2- 7:40 14.4219 14.3261 23.2082 1.2163

192 Day 2- 7:50 14.3933 14.294 23.3738 1.2132

Luhri HEP Stage-I, 210 MW 9.23

Final EMP Report

193 Day 2- 8:00 14.3647 14.2617 23.5092 1.2016

194 Day 2- 8:10 14.3359 14.2295 23.6215 1.1973

195 Day 2- 8:20 14.3071 14.1971 23.7139 1.1868

196 Day 2- 8:30 14.2781 14.1647 23.7863 1.1843

197 Day 2- 8:40 14.2491 14.1323 23.8449 1.1735

198 Day 2- 8:50 14.22 14.0998 23.8878 1.1716

199 Day 2- 9:00 14.1909 14.0672 23.9211 1.1604

200 Day 2- 9:10 14.176 14.0566 23.9431 1.1605

201 Day 2- 9:20 14.1666 14.0469 23.9541 1.1471

202 Day 2- 9:30 14.1577 14.037 23.9631 1.1511

203 Day 2- 9:40 14.1488 14.0271 23.9714 1.1432

204 Day 2- 9:50 14.14 14.0172 23.9797 1.1421

205 Day 2- 10:00 14.1312 14.0072 23.9831 1.1395

206 Day 2- 10:10 14.1224 13.9973 23.9857 1.1375

207 Day 2- 10:20 14.1135 13.9873 23.9868 1.1358

208 Day 2- 10:30 14.1044 13.9774 23.9869 1.134

209 Day 2- 10:40 14.0953 13.9675 23.986 1.1323

210 Day 2- 10:50 14.0862 13.9576 23.9843 1.1305

211 Day 2- 11:00 14.0771 13.9477 23.982 1.1288

212 Day 2- 11:10 14.068 13.9378 23.9791 1.1271

213 Day 2- 11:20 14.0589 13.9279 23.9756 1.1254

214 Day 2- 11:30 14.0497 13.9179 23.9717 1.1238

215 Day 2- 11:40 14.0406 13.908 23.9673 1.1221

216 Day 2- 11:50 14.0315 13.8981 23.9625 1.1205

217 Day 2- 12:00 14.0223 13.8882 23.9572 1.1189

218 Day 2- 12:10 14.0659 13.9587 23.9516 1.1173

Luhri HEP Stage-I, 210 MW 9.24

Final EMP Report

219 Day 2- 12:20 14.1302 14.0313 23.9462 1.1158

220 Day 2- 12:30 14.1946 14.1033 23.9426 1.1163

221 Day 2- 12:40 14.2588 14.175 23.9435 1.1213

222 Day 2- 12:50 14.3229 14.2465 23.951 1.1301

223 Day 2- 13:00 14.3867 14.3176 23.9652 1.141

224 Day 2- 13:10 14.45 14.3884 23.986 1.1525

225 Day 2- 13:20 14.5129 14.459 24.0125 1.1639

226 Day 2- 13:30 14.575 14.5281 24.0439 1.1748

227 Day 2- 13:40 14.6366 14.5945 24.0798 1.1855

228 Day 2- 13:50 14.6982 14.6608 24.1187 1.1958

229 Day 2- 14:00 14.7595 14.727 24.1598 1.2037

230 Day 2- 14:10 14.8205 14.7933 24.2026 1.2122

231 Day 2- 14:20 14.881 14.8594 24.2472 1.2205

232 Day 2- 14:30 14.9413 14.925 24.2941 1.2297

233 Day 2- 14:40 15.0012 14.9906 24.3432 1.2412

234 Day 2- 14:50 15.0609 15.0558 24.3946 1.2524

235 Day 2- 15:00 15.1203 15.1208 24.4468 1.2634

236 Day 2- 15:10 15.2146 15.2384 24.4527 1.2949

237 Day 2- 15:20 15.3218 15.3569 24.3983 1.3323

238 Day 2- 15:30 15.4296 15.474 24.2765 1.3789

239 Day 2- 15:40 15.5361 15.5902 24.119 1.4294

240 Day 2- 15:50 15.6418 15.7053 23.9565 1.4771

241 Day 2- 16:00 15.7449 15.8193 23.8167 1.509

242 Day 2- 16:10 15.8477 15.9319 23.7211 1.5316

243 Day 2- 16:20 15.9501 16.042 23.6805 1.5477

244 Day 2- 16:30 16.0517 16.1499 23.6975 1.5587

Luhri HEP Stage-I, 210 MW 9.25

Final EMP Report

245 Day 2- 16:40 16.1517 16.2598 23.7704 1.5653

246 Day 2- 16:50 16.2513 16.3738 23.8952 1.5675

247 Day 2- 17:00 16.3495 16.4862 24.0681 1.5634

248 Day 2- 17:10 16.4484 16.5985 24.2872 1.5461

249 Day 2- 17:20 16.5469 16.7099 24.5494 1.5353

250 Day 2- 17:30 16.6449 16.8207 24.8526 1.5248

251 Day 2- 17:40 16.7426 16.9303 25.1919 1.5128

252 Day 2- 17:50 16.8398 17.0393 25.5641 1.4981

253 Day 2- 18:00 16.9363 17.1474 25.9638 1.4826

254 Day 2- 18:10 16.9061 17.0668 26.3831 1.4683

255 Day 2- 18:20 16.8296 16.9748 26.8148 1.4541

256 Day 2- 18:30 16.749 16.8831 27.2502 1.4318

257 Day 2- 18:40 16.6674 16.791 27.6824 1.3959

258 Day 2- 18:50 16.5853 16.6982 28.1081 1.3497

259 Day 2- 19:00 16.5027 16.605 28.5274 1.3027

260 Day 2- 19:10 16.4199 16.5109 28.9409 1.2565

261 Day 2- 19:20 16.3368 16.4167 29.3475 1.2114

262 Day 2- 19:30 16.2532 16.3219 29.7473 1.1683

263 Day 2- 19:40 16.1705 16.2269 30.1395 1.1262

264 Day 2- 19:50 16.0869 16.1304 30.5251 1.0837

265 Day 2- 20:00 16.0026 16.0366 30.9036 1.0317

266 Day 2- 20:10 15.9175 15.946 31.2744 0.9378

267 Day 2- 20:20 15.8316 15.8539 31.6387 0.9023

268 Day 2- 20:30 15.7451 15.7595 31.9959 0.8727

269 Day 2- 20:40 15.6584 15.6642 32.3453 0.8436

270 Day 2- 20:50 15.5717 15.5673 32.6875 0.8158

Luhri HEP Stage-I, 210 MW 9.26

Final EMP Report

271 Day 2- 21:00 15.483 15.4701 33.0223 0.7893

272 Day 2- 21:10 15.4036 15.3864 33.3499 0.7636

273 Day 2- 21:20 15.3272 15.303 33.6701 0.7382

274 Day 2- 21:30 15.2505 15.2189 33.9832 0.7147

275 Day 2- 21:40 15.1735 15.1343 34.2897 0.693

276 Day 2- 21:50 15.0963 15.0492 34.5907 0.6724

277 Day 2- 22:00 15.0187 14.9636 34.8855 0.6525

278 Day 2- 22:10 14.9406 14.8774 35.1743 0.6336

279 Day 2- 22:20 14.8618 14.7911 35.4572 0.6154

280 Day 2- 22:30 14.7826 14.7041 35.7345 0.5979

281 Day 2- 22:40 14.7026 14.6169 36.006 0.5809

282 Day 2- 22:50 14.6221 14.5295 36.2719 0.5647

283 Day 2- 23:00 14.541 14.4421 36.5323 0.549

284 Day 2- 23:10 14.4598 14.3503 36.7874 0.5337

285 Day 2- 23:20 14.3773 14.2572 37.0369 0.5188

286 Day 2- 23:30 14.2941 14.1634 37.2815 0.5045

287 Day 2- 23:40 14.2101 14.0692 37.5208 0.4907

288 Day 2- 23:50 14.1255 13.9746 37.7552 0.4774

289 Day 3- 0:00 14.0401 13.8795 37.9844 0.4643

Luhri HEP Stage-I, 210 MW 9.27

Final EMP Report

Fig.9.9: Flood wave velocity (m/s)Nirath

Fig. 9.10: Flood wave velocity (m/s) Luhri

Further there are few villages in between Luhri & Nirath, for which measurements were

checked. For instance, measurements at two such villages namely Rewali and Naula which

lying between Nirath and Luhri were studied. But since these two villages are very well

above the river, they are very safe, as seen in Fig 9.11. Similarly other villages like Narola,

Charontha & Bithal are also safe.

Luhri HEP Stage-I, 210 MW 9.28

Final EMP Report

Fig. 9.11: Rewali and Naula villages are safely high and far from the River

9.6 PREPARATION OF INUNDATION MAP

An inundation map depicting the downstream areas likely to be inundated by the dam break

flood was prepared. The HECRAS 2D model computes maximum flood elevation, max

velocity at each grid cell in the computation domain. For the downstream stretch,this

information are available for up to 15km from dam site. Various instances of dam breach and

wave propagation are shown in the following figures.

Fig.9.12: Step 1 - Model start [Day 1 at 00:00:00 hours]

Luhri HEP Stage-I, 210 MW 9.29

Final EMP Report

Fig.9.13: Step 2 - Water accumulation at dam site Nirath [Day 1 at 02:40:00 hours]

Fig.9.14: Step 3-First flood wave hitting Luhri after dam breach after5 hours

[Day 1 at 07:50:00 hours]

Luhri HEP Stage-I, 210 MW 9.30

Final EMP Report

Fig.9.15: Step 4-Max flood depth map

Fig. 9.16: Step 5-Max flood velocity map

It is clear from the results that in case of dam break, under worst case scenario, there would

be inundation of only lower areas i.e. Luhri and further downstream settlements to Luhri, like

Parashan, Behna, Mahor, Choddi, Paruup to Nathan. Because most part of Luhri town is

located at lower elevation, this area is likely to suffer maximum damage in case of dam break

flood. Most parts of the other villages would be safe as lesser number of houses are

located below the expected dam break flood level.

Luhri HEP Stage-I, 210 MW 9.31

Final EMP Report

Fig.9.17: Parts of Luhri village getting submerged

Few bridges located in this stretch will likely be submerged in case of a dam break flood. The

bridges along with villages downstream to Luhri which are likely to be submerged have been

marked and shown as Fig. 9.18.

The flood generated in case of dam break may also lead to a number of landslips

downstream of dam causing damage to banks and roads and thereby blocking the river, which

may compound the hazard and adversely affect the life and property around and downstream

of those localities.

9.7 DISASTER MANAGEMENT PLAN

From the results, it appears that up to about 15 km d/s of the Luhri Stage 1dam, the time

required for the flood wave to reach maximum elevation is of the order of 5 hours. However,

surveillance and monitoring programmes are required to be implemented during design and

investigation, construction, first reservoir filling, early operation period and operation &

maintenance phases during the life span of dam. It is desirable that all gates, electricity and

power installations, public announcement system, power generator backups, etc. are

thoroughly checked before onset of the monsoon. Because the upstream water level has

significant effect on the dam break flood, different levels of flood conditions would indicate

different levels of alertness as discussed below.

Luhri HEP Stage-I, 210 MW 9.32

Final EMP Report

i) Normal flood

When the upstream water level is at or below FRL (857 m), the flood is of the order

of 20% to 30% of PMF. This is to be considered as the normal flood condition. In this

case normal routine is to be followed.

ii) Level-1 Emergency

Level-1 Emergency invokes a condition when the upstream water level rises above FRL. In

this condition the diversion tunnel for the upper reservoir and at least 3 gates must

be kept fully operational. All the concerned officials must be alerted and would be

available at the dam site to take appropriate action as the situation develops. A

suitable warning and notification procedure must be put in place.

iii) Level-2 Emergency

This situation suggests the condition when upstream water level reaches 858 m and continues

to rise. All the communication systems and safety measures will be operational at this

stage. Public announcement system or centralized siren system will be used to issue flood

warning to the people, particularly residing in the downstream reaches so that they are able to

shift to safer places.

iv) Level-3 Emergency

In this situation the upstream water level reaches near the top of the dam (864 m).

At this point only a few minutes are available for taking any action. All the staff from the

dam site shall be alerted to move to a safe place. The Tehsil and District level officers as well

as the Corporation Heads must be informed immediately about the possibility of a dam

failure. This shall be followed by simultaneous public announcements and flood

warning issued to the people so that they are able to shift to safer places.

v) Disastrous Condition

In this condition the upstream water level rises above the dam top and dam starts to fail. If

this situation arises, the civil administration shall be immediately informed for necessary

rescue operations. All the necessary emergency public announcements be made and

evacuation plan put in place.

Luhri HEP Stage-I, 210 MW 9.33

Final EMP Report

9.7.1 Surveillance

The surveillance and monitoring programs are required to be implemented during design and

investigation, construction, early operation period and operation and maintenance phases

during the life span of the dam. An affective flood forecasting system is required by

establishing hourly gauge reading at suitable upstream locations with real time

communication at the top. An effective dam safety surveillance, monitoring and observation

along with periodic inspection, safety reviews and evaluation must be dealt with in the

protocol. These programs need to be included in all the phases of the dam, viz. i) design and

investigation phase, ii) construction phase, iii) first reservoir filling, iv) early operation

period, and v) operation and maintenance phase.

9.7.2 Emergency Action Plan

An emergency is a hazardous condition that develops unexpectedly and may end in a

disastrous situation for the downstream life and property. Therefore, it calls for immediate

attention because the primary concern is for timely and reliable identification and evaluation

of potential emergency. An Emergency Action Plan would include all the potential indicators

of likely failure of the dam and provide timely warning to the nearby residents and alert key

personnel responsible for taking action in case of an emergency. This Plan must include

warning and notification procedures to be followed in case of potential failure of the dam. To

reasonably prepare an emergency plan, it will be necessary for the dam break analysis to

provide:

a. Inundation maps at a scale sufficient to determine the extent of flooding in relation to

people at risk, properties and access routes

b. Identification of structures (bridges etc.) likely to be destroyed

c. Indication of main flow areas (damage potential of flow)

d. Timing of the arrival and peak of the flood wave

e. Identification of features likely to affect mobility / evacuation during and after the event

including impact on infrastructure and the deposition and scour of debris and sediment.

9.7.3 Administrative and Procedural Aspects

A list including the names, addresses and telephone numbers (preferably hand phones/mobile

phones) of the responsible officials must be prepared and made available to various officials

concerned with disaster management, village heads, panchayat offices, where these numbers

would be displayed in a manner that are handy. Each person will be made aware of his/her

Luhri HEP Stage-I, 210 MW 9.34

Final EMP Report

responsibilities/ duties and the importance of work assigned under the Emergency Action

Plan. In the event of a potential emergency, the observer at the site is required to report it to

the Engineer-in-charge through a wireless system, mobile phone or by any available fastest

communication system. The Engineer-in-charge shall be responsible for contacting the Civil

Administration, particularly the Deputy Commissioner. A centralised control room is

required to be set up by the project authorities at Nirath so that the operations required at the

emergency situations can be properly executed.

9.7.4 Preventive Action

When the likelihood of an emergency situation is suspected, action is to be initiated to

prevent a failure. The point at which a situation reaches an emergency status shall be

specified and at that stage the vigilance and surveillance shall be upgraded. At this stage, a

thorough inspection of the dam shall be carried out to locate any visible signs of distress. A

plan shall be drawn on priority for inspection of the dam. The dam, its sluices and non-

overflow sections will be properly illuminated. A plan for equipment requirement and

availability as well as their operations for specific purpose must be prepared.

9.7.5 Communication System

The success of an emergency plan depends on an efficient communication system and a

downstream warning system. The downstream people must be made aware of the likelihood

of inundation and the inundation levels so that they are able to differentiate between a high

flood and a dam-break situation. All the villages situated in the area likely to be inundated (or

at its margin) in case of a dam break flood are required to be connected through wireless

communication system with backup of standby telephone lines. Because it is not possible to

inform every individual through messengers in any emergency situation, a centralized siren

alert system is required to be installed at all village Panchayats. A financial allocation of Rs.

40.00lakhs has been made in the project for setting up of an emergency control room and

installation of siren/hooter alert systems at different vulnerable locations. In case of an

emergency situation a faster communication system is required and the justification,

description and financial requirement for such a system is discussed below.

i) Why do we need a Satellite Communication System?

The land based telecommunication system may be first affected in case of a disaster like

flood or an earthquake followed by a flood. The maintenance of such land-based

Luhri HEP Stage-I, 210 MW 9.35

Final EMP Report

communication systems becomes a problem during emergency for the technical personnel

who are required to reach the site of fault, which is struck by the disaster. So the system

cannot be put back into operation soon. The fault repairs and restoration of communication

services are usually not possible for a considerable period of time after the calamity has

struck. On the other hand, in such a situation to organize action plan for relief/medical teams

and other rescue teams, it is necessary that the communication system be such that i) it is not

affected by the natural disaster, and/or ii) is restored to operate at the earliest possible time.

Thus, the entire management operations dependsolely on the communication system and its

swift deployment. As this is of paramount importance, existing systems such as telephones

and telex, etc. are practically of little use in case of such events. Similarly, microwave links

are expected to be down due to collapse of towers and other technical difficulties and re-

establishing the links is a time consuming process. Hence, to provide an ideal solution at the

emergency situation, there is a need of a satellite based or a wireless communication system.

ii) Components of a Satellite Communication System and how the system is beneficial?

The satellite based communication system requires: i) A small dish of approximately one

meter diameter, ii) Associated radio equipment, and iii) A power source. The deployment of

the system is not dependent on the restoration of land routes. The existing satellite based

communication system is designed in such a manner that it is able to withstand fairly high

degree of demanding environmental conditions. If the dish is affected during the disaster, the

restoration of the satellite based system can be undertaken by carrying maintenance personnel

and equipment by helicopters at a very short notice. Even the fresh systems could be inducted

in a matter of minutes or an hour because most of these are designed for easy deployment and

operations after being airlifted. The deployment takes usually less than an hour. The power

requirements are not large and can be met by sources such as UPS/batteries/ generators.

VSAT (Very Small Aperture Terminal) technology and satellite phones represent effective

solution for users seeking an independent communications network connecting a large

number of geographically dispersed sites. There are two different VSAT based systems

which have the capability to support couple of voice and data channels namely Single

Channel per Carrier-Demand Assigned Multiple Access (SCPC DAMA) and TDMA. These

highly superior communication systems in VSAT marketed by National agencies like HECL,

HFCL and HCL Comet. Similarly satellite phones could be carried in a small case and

deployed for communication at short notice.

Luhri HEP Stage-I, 210 MW 9.36

Final EMP Report

iii) Financial Outlay for Installation of VSAT Communication System

The SCPC DAMA system will be suitable for the Luhri HEP Stage-I because a large area of

the downstream stretch may need to be communicated for quick action. The Project

authorities may install two systems at suitable sites in the area. One of them would be

installed at a suitable location in the upstream of dam site while the second between Luhri to

Nirath. The estimated cost of installation of such a communication systems is Rs. 58 lakhs

which includes of antenna, RF equipment, modem, UPS, generator etc.

9.7.6 Evacuation Plans

Emergency Action Plan includes evacuation plans and procedures for implementation based

on local needs and includes the aspects like i) Demarcation/prioritization of areas to be

evacuated, ii) Notification procedures and evacuation instructions, iii) demarcation of safe

routes for transport as well as traffic control, iv) demarcation of shelter areas, v) Functions

and responsibilities of members of evacuation team. The dam-break flood prone zone in the

event of dam failure of Luhri HEP stage 1 shall be marked properly at the village locations

with adequate factor of safety. As the expected dam break flood wave will take a certain time

in reaching maximum elevation in these villages, the citizens shall be informed well in time

through wireless and sirens, etc. so that people may immediately reach areas of safety

particularly elevated places above the marked flood zone. The Emergency Action Plan and

Evacuation Team would comprise of

Engineer-in-Charge of the Project (Team Leader)

District Magistrate (DM) or the nominated officer

Superintendent of Police (SP) or the nominated Police Officer (to maintain law and

order)

Head / nominated officer in Fire Brigade (Divers division) Department of Himachal

Pradesh.

Director/nominated officer of Disaster Management Cell in the Himachal Pradesh

Institute of Public Administration

Chief Medical Officer of the area (To tackle morbidity of the affected people)

Sarpanch/Affected Village Representative to execute the resettlement operation with the

aid of state machinery and project proponents

Sub-committees at village level and NGOs of the respective districts which have

knowledge of the evacuation procedures.

Luhri HEP Stage-I, 210 MW 9.37

Final EMP Report

The Engineer-in-Charge will be responsible for the entire operation including prompt

determination of the flood situation from time to time. Once the red alert is declared the

whole state machinery will swing into motion and start evacuating people from the areas

likely to be inundated during dam break flood as marked on the inundation map and

delineated in the field. For successful execution, a demo exercise headed by D.M. may be

organized every year in Village Panchayats, that are likely to be affected during flood.

9.7.7 Notifications

Notification procedures are an integral part of any emergency action plan. Separate

procedures shall be put in place for slowly and rapidly developing situations and dam failure.

Notifications will include communications of either an alert situation or an alert situation

followed by a warning situation. An alert situation will indicate that although failure or

flooding is not imminent, a more serious situation can occur unless conditions improve. A

warning situation will indicate that flooding is imminent as a result of an impending failure of

the dam. It will normally include an order for evacuation from the designated inundation

areas. For a regular watch on the flood level situation, it is necessary that two or more people

handle the flood cell so that an alternative person is available for notification round the clock.

In addition, the guidelines to be generally followed by the inhabitants of the flood prone

areas, which form part of public awareness for disaster mitigation and include:

Listen to radio for advance information and advice,

Disconnect all electrical appliances and move all valuable personal and household

goods and all clothing out of reach of flood water,

Move vehicles, farm animals and movable goods to the highest ground nearby,

Move all dangerous pollutants and insecticides out of reach of water,

Do not enter flood waters on foot, if it can be avoided

9.8 COST ESTIMATES

The estimated total cost for execution of disaster management plan including the equipment

is Rs. 143.00lakhs. The break up of the financial outlay is given in Table 9.4. It includes Rs.

58 lakhs for the establishment of communication system with maintenance, Rs. 40lakhs for

siren alert system and Rs. 45 lakhs for miscellaneous purposes like notification, evacuation,

etc. Apart from this, a detailed Emergency Preparedness Plan (EPP) needs to be prepared by

SJVN before the commissioning of the project in consultation with State

Govt./Administration for the implementation of this programme.

Luhri HEP Stage-I, 210 MW 9.38

Final EMP Report

Table 9.4 Estimated Cost forDisaster Management Plan

S.No. Description Amount (Rs in Lakhs)

1. Setting up of V-SAT Communication system with maitenance of 10 years (Antenna, RF equipment, modem, UPS, generator etc.)

58

2. Installation of siren alert system and maintenance etc. 40

3. Notification and publication procedures, evacuation equipment, Medicines etc.

45

Total 143

Luhri HEP Stage-I, 210 MW 9.39


Recommended