29
Section A Revision
| Date post: | 07-Aug-2015 |
| Category: |
Education |
| Upload: | aarono1979 |
| View: | 27 times |
| Download: | 3 times |

Section A Revision
1) Vision and perception
Key terminology Perception:
Perception – the way the brain makes sense of the visual image detected by the brain.
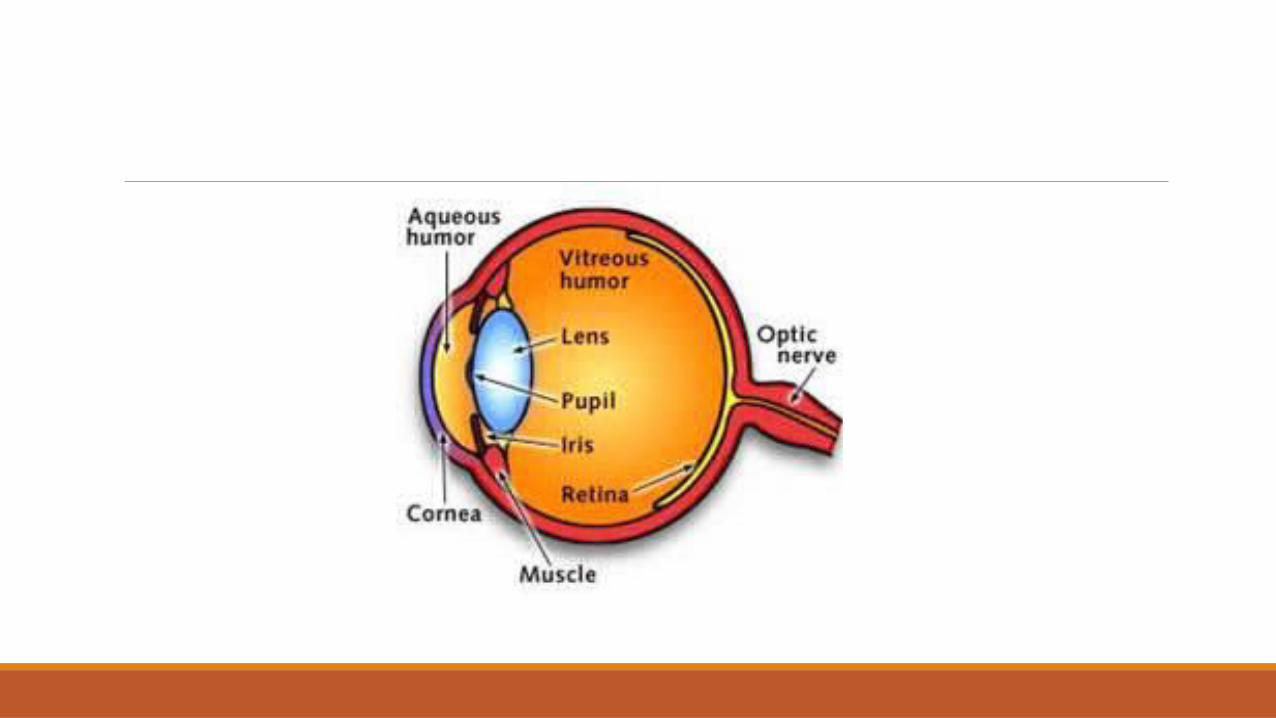
Retina – the light-sensitive layer at the back of the eye. It is made up of nerve cells called rods and cones.
Rods – light-sensitive cells in the retina that respond even in dim light.
Cones - light-sensitive cells in the retina that can detect colour.
Optic nerve – bundle of nerves that leads out from the retina at the back of the eye. It carries information from the rods and cones to the brain.
Blind spot – the area of the retina where the optic nerve leaves. It has no rods or cones so cannot detect light.
Optic chiasma – the cross-shape where some of the information from the left and right eye crosses over to pass into the opposite side of the brain.
Visual cortex – the area at the back of the brain that interprets visual information.
Depth cues – the visual ‘clues’ that we use to understand depth or distance.
Monocular depth cues – information about distance that comes from one eye, such as superimposition, relative size, texture gradient, linear perspective and height in the plane.
Binocular depth cues – information about distance that needs two eyes, such as stereopsis.
Size constancy – we perceive an object as the same size even when its distance from us changes.
Relative size – smaller objects are perceived as further away than larger ones.
Texture gradient – an area with a detailed pattern perceived to be nearer than one with less detail.
Height in the plane – objects closer to the horizon are perceived to be more distant than ones below or above the horizon.
Superimposition– a partly hidden object must be further away than the object covering it.
Linear perspective – parallel lines appear to converge (meet) in the distance.
Stereopsis – a binocular depth cue. The greater the difference between the view seen by the left eye and the right eye, the closer the viewer is looking.


3) Gestalt laws
Gestalt laws – perceptual rules that organise stimuli.
Figure-ground – a small, complex, symmetrical object (the figure) is seen as separate from a background (the ground).
Similarity – figures sharing shape, size or colour are grouped together with other things that look the same.
Proximity – objects which are close together are perceived to be related.
Continuity – straight lines, curves and shapes are perceived to carry on being the same.
Closure – lines or shapes are perceived as complete figures even if parts are missing.
“The whole is worth more than the sum of its parts”. We organise these parts of what we can see (the stimulus information) to give us a more complex perception.
We look for patterns to help us make sense of our world.
We use the Gestalt law of figure-ground to see a more complex, symmetrical and smaller object from the ground.
We tend to group things that are similar in size colour or shape – this is the Gestalt law of similarity.
Objects that are close together are seen as a group because of the Gestalt law of proximity.
Gestalt law of continuity says that we link things that follow a predictable pattern and see them as continuous even if they are not.
We tend to perceive objects as a whole – our brains ‘fill in the gaps’ – this is the Gestalt law of closure.

Illusions Key terminology Illusions:
Visual illusion – a conflict between reality and what we perceive.
Fiction – an illusion caused when a figure is perceived even though it is not present in the stimulus.
Illusory contour – a boundary (edge) that is perceived in a figure but is not present in the stimulus.
Motion after-effect – an illusion caused by paying more attention to movement in one direction and perceiving movement in the opposite direction immediately afterwards.
Colour after-effects – an illusion caused by focusing on a coloured stimulus and perceiving opposite colours immediately afterward.
Ambiguous figure – a stimulus with two possible interpretations, in which it is possible to perceive only one of the alternatives at a time.
Distortion illusion – where our perception is deceived by some aspect of the stimulus. This can affect the shape or size of an object.

Revision notes:
Visual illusions occur when our perception conflicts or disagrees with reality;
we are not seeing the world as it really is. We see an illusion when we misinterpret the stimulus, so the physical reality and our perception disagree.
For ambiguous figures swapping between the two interpretations is quite difficult.
Some common geometrical illusions only work when seen on paper. If you see the object in real life and walk around it, the illusion goes away.

For fictions such as the Kanizsa triangle when we see a figure as incomplete, our perception makes a ‘whole’ shape. This is the figure of the figure-ground relationship.
When explaining distortions – the Muller-Lyer illusion - in perceiving the figure as a whole we tend to ‘add’ fins or circles to the central lines. When pointing out the fins drag out the line and make it look longer.
Gestalt theory explains ambiguous figures by saying that we normally identify the figure or ground but in ambiguous figures it could be either figure or ground because we cannot tell whether the black or white area is the figure.
Gestalt theory provides a good explanation for ambiguous figures however it cannot explain any illusions other than the Muller-Lyer illusion.
Gestalt theory explains fictions well but in the case of the Kanizsa triangle Gestalt explanation says we would use closure to organise this figure which means we should see a six pointed star, but we don’t, we see two triangles.

5) Gregory’s perspective theory of illusions
Remember size constancy and monocular depth cues? We maintain the relative size of objects regardless of their distance from us.
In the Hering illusion the radiating lines look like a linear perceptive cue so we use constancy scaling as if the scene really had depth. The person who appears furthest away would be scaled up so they look bigger and the person who appears closer would be scaled down, and look smaller.
The Ponzo illusion (the top bar looks bigger than the bottom bar) – if the railway tracks were used as cues to linear perspective, the top bar would seem further away. As it is perceived to be more distant, it is scaled up so it seems bigger than the bottom bar.
The Muller-Lyer illusion can be explained using the ideas of linear perspective and constancy scaling. On the left hand photo the front of the shop is closer than the back. We scale things down that are near us.
In the picture on the right the middle vertical line looks further away as it is scaled up.

Evaluating Gregory’s theory - it is a good explanation of distortions. If angled lines are used as depth
cues, this explains many illusions.
However, Gregory’s theory cannot explain some versions of the Muller-Lyer illusion.
Gregory’s theory can explain some ambiguous figures when the two alternative figures are perceived using depth cues. e.g. On Leeper’s Lady the nose of the young woman looks further away than the wart on the old woman’s nose.
Depth cues can also explain some fictions as the background lines appear closer to the horizon and so further away.
6) Schemas and perception
Key terminology Schemas and perception:
Schema – a framework of knowledge about an object, event or group of people that can affect our perception and help us to organise information and recall what we have seen.
Perceptual set – the tendency to notice some things more than others. This is caused by experience, context or expectations.
Independent variable – (IV) – the factor which is changed by the researcher in an experiment to make two or more conditions.
Dependent variable – (DV) – the factor which is measured in an experiment.
Palmer (1975) Palmer (1975) wanted to find out whether context would affect perception. He used a laboratory experiment and showed participants visual
scenes such as one of a kitchen. They were then shown an object (a mail box, a drum, a loaf of bread) which they were asked to identify. There were 4 conditions in the experiment (the IVs – appropriate, inappropriate-similar, inappropriate-different and no context). It was a repeated measures design as all participants participated in all aspects of the experiment.
The number of correctly identified items was the dependent variable (DV). The participants correctly identified the most objects after seeing an appropriate context and the least after seeing an inappropriate context therefore Palmer concluded that expectations affect perception.
People have a perceptual set based on context which affects how accurately they recognise objects.
Strengths
Controlled how long participants saw the object for
Clear instructions so they knew exactly what to do
Data from two participants was not used as they had forgotten their glasses (poor vision, which could have affected the results).
Weaknesses
Because the participants were told what they were doing it might have made them
try harder in some conditions. They might have been trying to please the experimenter.
As data from some participants couldn’t be used, this means there were fewer results.

7) Bartlett (1932)
Key terminology Bartlett (1932) Schemas and remembering stories
Serial reproduction – a task where a piece of information is passed from one participant to the next in a chain or ‘series’. Differences between each version are measured. (‘Chinese Whispers’)
Repeated reproduction – a task where the participant is given a story or picture to remember. They then recall it several times after time delays. Differences between each version are measured.
Bartlett (1932) Bartlett (1932) wanted to investigate how information changes with each reproduction and to find out why the information changes.
He deliberately chose ‘The War of the Ghosts’, a North American Indian folk tale from another culture and unknown to the participants.
The first participant read the story twice themselves (serial reproduction) then after 15- 30 mins told the story to a second participant. Each participant repeated their story to the next person in a chain of participants.
For the repeated reproduction task each participant was tested separately after reading the story to themselves twice, 15 minutes later they gave their preproduction of it. Later reproductions were done at 20 hours, 8 days, 6 months and 10 years for different participants. Participants did not know the aim of the study.
Very, very few participants recalled the story accurately – Bartlett found the following pattern of errors – form (the order of events), details (names and numbers were lost), simplification (details are left out or made more familiar) and addition (inaccurate details were included).
Bartlett concluded that unfamiliar material changes when it is recalled. It becomes shorter, simpler and more stereotyped- this may be due to the effect of schema on memory.
Strengths
Both the repeated and serial reproduction tasks were done many times to show that the changes to the story followed the same patterns.
Other stories were also used and showed similar results.
Weaknesses
By choosing unfamiliar material, Bartlett could not be sure that the changes he found would happen with familiar information.
Bartlett did not always test the repeated reproduction participants after the same time intervals, so the changes over time cannot be compared fairly.
Bartlett (1932)

8) Carmichael (1932) Key terminology Carmichael (1932) Do words affect recall?
Reconstructive memory – recalled material is not just a ‘copy’ of what we see or hear. Information is sorted and when it is remembered it is ‘rebuilt’, so can be affected by extra information and by ideas (like schemas) we might already have.

8) Carmichael (1932)
Key terminology Carmichael (1932) Do words affect recall?
Reconstructive memory – recalled material is not just a ‘copy’ of what we see or hear. Information is sorted and when it is remembered it is ‘rebuilt’, so can be affected by extra information and by ideas (like schemas) we might already have.
Revision notes:
Carmichael, Hogan and Walter (1932) wanted to find out whether words shown with pictures would affect the way the pictures were remembered.
He used a laboratory experiment (with independent groups design) in which 95 participants were shown 12 pictures (the stimulus material). The independent variable (IV) was which word they heard. Between each picture the experimenter said, ‘The next picture resembles…’ followed by a picture from list 1 or list 2. The participants were then asked to draw the pictures they had seen and their drawings were compared to the original. This was the dependent variable (DV).
The drawings produced by people who heard words from list one were very different to list 2. The drawings looked like the words they heard. Carmichael et al. concluded that memory for pictures is reconstructed and the verbal context in which the drawings are learned affects recall because the memory of the word alters the way the picture is represented.
Strengths
By using a control group Carmichael et al. could be sure that people’s drawings weren’t always distorted in the same way.
By using 2 different lists they showed that the verbal labels affected people’s drawings.
Having 12 pictures and many participants gave them lots of evidence, so they could be sure their findings weren’t just a fluke.
Weaknesses
In real life things are not generally ambiguous as the stimulus figures shown.
Prentice (1954) tested the effect of verbal labels on recognition rather than recall and found that verbal labels didn’t affect recognition, this means Carmichael’s findings did not apply widely.

9) Designing and understanding experiments
Key terminology Designing and Understanding experiments
Experiment – a research method which measures participants’ performance in two or more conditions.
Experimental (participant) design – the way that participants are used in different conditions in an
experiment. They may do all conditions or different participants may do each condition.
Independent groups design – different participants are used in each condition in an experiment.
Repeated measures design – the same participants are used in all the conditions in an experiment.
Hypothesis – a testable statement of the difference between the conditions in an experiment. It
describes how the independent variable will affect the dependent variable.
Controls – ways to keep variable constant in all conditions of an experiment.
Key terminology Dealing with descriptive statistics
Mode – an average that is the most common score or response in a set.
Descriptive statistics – ways to summarise results from a study. They can show a typical or average score or how spread out the results are.
Bar chart – a graph with separate bars. Usually there is one bar for each condition in an experiment.
Median – an average that is the middle number in a set of scores where they are put in order from smallest to largest.
Mean – an average that is calculated by adding up all of the scores in a set and dividing by the number of scores.
Range – a way to show how spread out a set of results is by looking at the biggest and smallest scores.

Key terminology Ethics in psychology experiments
Ethical issues – potential psychological or physical risks for people in experiments.
Informed consent – an individual’s right to know what will happen in an experiment, and its aims, before agreeing to participate.
Right to withdraw – a participant’s right to leave a study at any time and they ability to do so.
Ethical guidelines - advice to help psychologists solve ethical issues.

A Ambiguous figure
B Fiction
C Stereopsis
D Distortion
- In some illusions you perceive an object or effect which does not really exist.
-Some illusions happen when we misinterpret an aspect of the stimulus which affects our perception of shape or size e.g. the Müller-Lyer illusion.
- Some illusions happen because there are two competing interpretations of the stimulus e.g. Leeper’s Lady.

Angali is doing an experiment about her participants’ recall of unfamiliar objects. She gives
each participant a number instead of using their name. She doesn’t tell her participants that the
experiment is about recall of unfamiliar objects but she does say that they can leave at any time.
4 Angali says to her participants that her experiment is about the effect of colour on
memory.
This breaks the ethical guideline of:
5 When Angali tells each participant that they can leave at any time, this relates to the
ethical guideline of:

In a study the independent variable is the thing which the researcher:
A measures to see if there is an effect
B measures to reduce errors
C changes to find out what it does
D changes to control for errors

The experimental (participant) design in a study is:
A all the things that the experimenter does to avoid causing ethical problems for
the participants
B the briefing that participants are given beforehand
C the research method the experimenter uses
D the way that participants are allocated to conditions

Bartlett (1932) used a story called ‘The War of the Ghosts’.
What did he find out about repeated stories?
A That they get more complicated.
B That they are well remembered.
C That numbers are accurately recalled.
D That details are forgotten.

(a) What is meant by the term ‘schema’?
(b) Shreya is at the train station waiting for her favourite elderly aunt to arrive. She isvery excited and can’t wait to see her aunt again.Describe why Shreya’s schema for her aunt might cause her to rush up and hug adifferent elderly lady.

Three of the following structures are found in the retina and one is not.
Which structure is not found in the retina?
A Rod
B Cone
C Optic chiasma
D Blind spot


![First Revision No. 88-NFPA 72-2013 [ Section No. 2.4 ] Revision No. 88-NFPA 72-2013 [ Section No. 2.4 ] ... First Revision No. 49-NFPA 72-2013 [ Section No. 29.6.1 ] ... 29.6.6 (nonrechargeable](https://static.documents.pub/doc/80x56/5b04546e7f8b9a2e228dab08/first-revision-no-88-nfpa-72-2013-section-no-24-revision-no-88-nfpa-72-2013.jpg)

