Baker Petrolite ACROLE IN December 2005 Section A7.1.1.1.1 Hy drolysis as a function of pH and identification of Annex P oint IIA breakdown product s VII. 7 .6.2.1 Official 1 REFERENCE use only 1.1 Referen ce Haag, W. R. et al. (1988a), Estimation of Hydrolysis Ra te Constants for Acrolei.t1 (Magnacide®H Herbicide, Magnacide®B Microbiocide) m the Environment, SRI Intemational, SRI Project No. 3562-3. 1.2 D ata protection Ye s 1.2.l Data ov.rner Baker Petrolite 1.2.2 Criteria for data Data on new a.s. for first entiy to Annex I protecti on 2 GUIDELINES AND QUALITY ASSURANCE 2.1 Guideline study Yes US EPA-FIFRA, SubdivisionN, Guidelme 161-1 2.2 GLP Ye s 2.3 Deviations No 3 MATE RIALS AND METHODS 3.1 Test m ate rial As given i.t 1 Section 2 3.1.1 Lot/Batch number NN-481-76 3.1.2 Specification As given i.t1 Section 2 3.1.3 Purity See 3.1.2 3.1.4 Further relevant properties 3.2 Referenc.e No s ubstance 3.2.l Initial concentration of reference substance 3.3 Test solution See Tables A 7 1 1 1 1-1 and A7 1 1 1 1-2 - - - - - - - - 3.4 Testing prncedure 3.4. l Test system See Table A7 1 1 1 1-3 - - - - 3.4 .2 Temperature 25°C Document IIIA
Transcript
Baker Petrolite ACROLEIN December 2005
Section A7.1.1.1.1 Hydrolysis as a function of pH and identification of
Annex Point IIA breakdown products
VII. 7 .6.2.1
Official 1 REFERENCE use only
1.1 Reference Haag, W.R. et al. (1988a), Estimation of Hydrolysis Rate Constants for Acrolei.t1 (Magnacide®H Herbicide, Magnacide®B Microbiocide) m the Environment, SRI Intemational, SRI Project No. 3562-3.
1.2 Data protection Yes
1.2.l Data ov.rner Baker Petrolite
1.2.2 Criteria for data Data on new a.s. for first entiy to Annex I protection
2 GUIDELINES AND QUALITY ASSURANCE
2.1 Guideline study Yes
US EPA-FIFRA, SubdivisionN, Guidelme 161-1
2.2 GLP Yes
2.3 Deviations No
3 MATERIALS AND METHODS
3.1 Test material As given i.t1 Section 2
3.1.1 Lot/Batch number NN-481-76
3.1.2 Specification As given i.t1 Section 2
3.1.3 Purity See 3.1.2
3.1.4 Further relevant properties
3.2 Referenc.e No substance
3.2 .l Initial concentration of reference substance
3.3 Test solution See Tables A 7 1 1 1 1-1 and A7 1 1 1 1-2 - - - - - - - -
3.4 Testing prncedure
3.4. l Test system See Table A7 1 1 1 1-3 - - - -
3.4 .2 Temperature 25°C
Document IIIA
Baker Petr olite ACROLEIN December 2005
Section A7.1.1.1.1 Hydrolysis as a function of pH and identification of
Figure 1: Experimen tal Conditions for Determining Acr olein Hydration Rate Constants
3.4.4 Duration of the test Up to 290 hours
3.4 .5 Number of Duplicate analyses 11111 on each sample replicates
3.4 .6 Sampling Method UV-le
Solutions were placed into I cm spectrophotometer cells thermostatted at 25 ± 1°C and the reaction monitored continually by UV absorbance at 210 nm. This method was the most convenient and precise and was used whenever the reaction could be completed within 24 hours (pH extremes).
Method UV-10
Document IIIA
Baker Petrolite
Section A7.1.1.1.1
Annex Point IIA VII. 7 .6.2.1
ACROLEIN
Hydrolysis as a function of pH and identification of breakdown products
December 2005
Solutions were placed into 10 cm spectrophotometer cells and the absorbanc.e at 320 run measured periodically. Between measurements the cells were stored at 25°C in the dark This method was used in three early experiments before the other more sensitive analytical methods were developed.
MethodUV-1
Solutions were prepared in volumetric flasks, placed into a dark water bath at 25 ± 0.2°C, and aliquots removed periodically for UV analysis at 218 nm in a 1 cm cell. This method was the most convenient for reactions taking longer than 24 hours. A wavelength of218 nm was chosen to minimise background absorbance in solutions of hmnic acid and natural waters. In principle, any wavelength near the acrolein maximum of 210 run could have be.en used.
MethodHLPC
Samples were prepared in volumetric flasks, placed into a dark water bath at 25 ± 0.2 °C, and aliquots removed periodically and the reaction stopped by cooling to 1 °C. Samples were stored at 1 °C in the dark and analysed at the end of the reaction by HPLC as described below. The small en-or introduced by incomplete stoppage of the reaction at 1 °C was coITected for by adding the rate constant observed at 1°C. This method was used initially for reactions taking longer than 24 hours, before the more convenient method UV-1 as developed. In prut icular, the HPLC method was used in Run number 15 to determine the amount of acrolein remaining at equilibrium.
3 .4. 7 Analytical methods HPLC analyses for kinetic mns were performed on a HP 1090 system equipped with a diode an·ay detector. Conditions were as follows:
Cohunn:
Eluent:
Injection volume:
Detection:
3 µm Hypersil Cl8 60 mm x 4.5 mm
20% acetonitrile in water at 0.4 ml/min
15 ~ll
210nm
Acrolein retention time: 2.5 minutes
Quantitation was by external standat·ds; peak areas varied linearly with concentration over the range of 1-100 ppm with a coITelation coefficient > 0.999.
Absorbance measurements for kinetic mns were made on HP 8450 UVMS spectrophotometer. Acrolein absorbance obeyed Beer's law with an extinction coefficient of 11 ,800 M-1 cm·1 over the concentration range studied. A similar calibration curve was found at 328 run, also with a coITelation coefficient greater than 0.999.
Product analyses were perfonned using HPLC GC/ECD and GC/MS following the derivitisation with PFPH. Aqueous samples (1 .0 ml) were mixed with 1.0 ml of a solution of 1.53 g/l pentaflurophenylhydrazine (PFPH) (12) in methanol and allowed to react overnight at 1 °C in the dark. At pH > 7, the PFPH derivative of 3-hydroxypropanal was unstable and therefore for srunples at pH 9, 24 ~tl of0.50 M pH 4 phosphate buffer was added to the derivitising mixture to bring the pH to 6. The PFPH derivative of acrolein was similru·ly unstable at pH > 5 and therefore acrolein was detennined directly by ultraviolet
Document IIIA
Baker Petrolite ACROLEIN December 2005
Section A7.1.1.1.1 Hydrolysis as a function of pH and identification of
Annex Point IIA breakdown products
VII. 7 .6.2.1
spectromefly at 210 nm on a separate, underivatised aliquot. In each case, the reference cell contained buffer at the same pH as the reaction solution but without acrolein.
The data were analysed using the general kinetic rate law for a reversible first order reaction. Statistical analysis was performed using the Statworks® statistics programme.
3.5 Prelimina1-y test Yes
0.5M phosphate buffer used
4 RESULTS
4.1 Concentration and See TableA7 1 1 1 1-4 - - - -hydrolysis values
4.2 Hydrolysis rate constant (kh)
4.3 Dissipation time See TableA7 1 1 1 1-5 - - - -
4.4 Conc.entration -time date
4.5 Specification of See TableA7 1 1 1 1-6 - - - -the transformation products
5 APPLICANT'S SUMMARY AND CONCLUSION
5.1 M aterials and US EPA-FIFRA, Subdivision N, Guideline 161-1. methods
Hydrolysis was studied in a variety of water types and over a broad pH range, in order to gain fi.mdamental kinetic data and allow confident prediction of rates under va1ying conditions.
5.2 Results and Acrolein hydration in water is catalysed by both hydrogen and discussion hydroxide ions·, but neither process is expected to be very significant in
the natlU'al water pH range of 5 to 9. However, unidentified catalysts, probably including both organic and inorganic compounds, are ubiquitously present in natural waters in sufficient quantities to increase the hydration ra.te at pH 5 to 9 by an order of magnitude over that observed in pure water. The catalytic effect appears to be quite constant over a broad range of water types and therefore the measured half-lives of 14 to 92 hours (pH 9.3 to 5.3, respectively) are expected to generally be applicable.
5.2 .1 kH
5.2.2 DTso See Table A 7 1 1 1 1-5 x - - - -
5.2 .3 r2
5.3 Condusion The major hydration product is 3-hydroxypropanal, which could not be distinguished from its hydrated fonn, 3,3-dihydroxy-1-propanol. At 25°C, 9.1 ± 1.5% of acrolein remains at equilibrium. The reversibility of the hydration reaction implies that a small fraction of acrolein will persist for reaction times much longer than the hydration half-life, in the absence of other loss processes. Because volatisation of acrolein is a si~1ificant aquatic fate process in turbulent waters, hvdration products
Document IIIA
Baker Petrolite ACROLEIN December 2005
Section A7.1.1.1.1 Hydrolysis as a function of pH and identification of
Annex Point IIA breakdown products
VII. 7 .6.2.1
may simply act as a reservoir of acrolein to slow down the volatilisation process. However, in calm waters where volatisation is less impo1tant, sorption of acrolein and biotransfo1mation of the hydrated products may drive the reaction to completion, as has been observed previously in itrigation supply waters.
5.3.1 Reliability 1
5.3.2 Deficiencies No
Evaluation by Competent Authorities Use separate "evaluation boxes" to provide transparency as to the comments and views submitted
EVALUATION BY RAPPORTEUR MEMBER STATE
Date 30/11//2007
Materials and Methods The Applicant's version is considered to be acceptable
Results and discussion The Applicant's version is considered to be acceptable with the following amendment.
5.2.2 Table A7 _1_ 1_1_ 1-5 should be replaced with the following (conected values underlined);
TableA7 1 1 1 1-5: Average half life (hours) of parent compound, and - - - -dissipation time (hours) of transformation product. at pH 5.3, pH 7.2 and pH 9.3
pH 5.3 pH 7.2 pH9.3 DTso DToo DTso DT90 DTso DToo
Pa rent 92 >209 37 209 14 >65.8 compound (acrolein)
Condusion The Applicant's version is considered to be acceptable.
Reliability 1
Acceptability Acceptable
Remarks All endpoit1ts and data presented in the smnmary have been checked agaitist the original study and are coll'ect.
COMMENTS FROM ...
Date Give date of comments submitted
Materials and Methods Discuss additional relevant discrepancies refening to the (sub)heading numbers and to applicant's summmy and conclusion. Discuss if deviatingfrom view of rapporteur member state
Results and discussion Discuss if deviating.from view of rapporteur member state
Condusion Discuss if deviating.from view of rapporteur member state
Document IIIA
Baker Petrolite ACROLEIN December 2005
Document IIIA
Section A7.1.1.1.1
Annex Point IIA VII.7.6.2.1
Hydrolysis as a function of pH and identification of breakdown products
Reliability Discuss if deviating from view of rapporteur member state
Acceptability Discuss if deviating from view of rapporteur member state
Remarks
Baker Petrolite ACROLEIN December 2005
Document IIIA
Table A7_1_1_1_1-1: Type and composition of buffer solutions
pH Type of buffer (final molarity)
Composition
5 Phosphate 2 ml of 0.5 M buffer stock solution made up to 100 ml with water
7 Phosphate 2 ml of 0.5 M buffer stock solution made up to 100 ml with water
9 Phosphate 2 ml of 0.5 M buffer stock solution made up to 100 ml with water
Table A7_1_1_1_1-2: Description of test solution Criteria
Details
Purity of water Filter-sterilised
Preparation of test medium Stock solution was prepared by adding neat acrolein to unbuffered Milli-Q purified water. Typically a 200ppm solution was prepared by dissolving 11.9 µl of acrolein in 50 ml of pure water, and a 1000ppm solution by mixing 29.8 µl of acrolein with 25 ml of pure water. The stock solutions were usually prepared daily, stored at 2ºC and discarded after two days.
Test concentrations (mg a.i./l) 5 ppm or 10 ppm Temperature (°C) 25 ± 0.2 Controls
2.0 ml of 5.0 M phosphate buffer diluted up to 100 ml.
Identity and concentration of co-solvent None Replicates Duplicate analyses were run on each sample, but one
sample per time point was adequate because of the excellent reproducibility of the UV and HPLC measurements.
Table A7_1_1_1_1-3: Description of test system
Glassware Glass cuvettes, 1 cm and 10 cm Other equipment Not specified Method of sterilisation Reaction vessels were usually autoclaved to prevent
microbial transformation; however, runs using unsterilised glassware were considered equally valid because duplicate runs at certain pH values showed no effect of autoclaving.
Baker Petrolite ACROLEIN December 2005
Document IIIA
Table A7_1_1_1_1-4: Hydrolysis of test compound, transformation products and reference substance, expressed as percentage of initial concentrations, at pH 5, pH 7 and pH 9
Amount [%] of parent compound measured at CAS-umber N
CAS and/or IUPAC Chemical Name(s)
pH 5 pH 7 pH 9
3-hydroxypropanal
71
87
79
Baker Petrolite ACROLEIN December 2005
Section A7.1.1.1.2 Phototransformation in water including identity of
Annex Point IIA7.1.1.1.2 transformation products
Official 1 REFERENCE use ouly
• Reference Haag, W.R. et al (1988b) Estimation of Photolysis Rate Constants for Acrolein (Magnacide®H Herbicide and Magnacide®B Microbiocide) in the Environment, SRI International, SRI Project No. 3562-3.
1.1 Data protection Yes
1.1.1 Data owner Baker Pet:rolite
1.1.2 Criteria for data Data on new a.s. for first enfly to Annex I protection
2 GUIDELINES AND QUALITY ASSURANCE
2.1 Guideline study Yes
FR 796.3700 and
Pesticide Assessment Guidelines, Subdivision N, 161-2
2.2 GLP Yes
2.3 Deviations No x
3 METHOD
• Test material As given in Section 2
3.1.1 Lot/Batch number NN-481 -76
3.1.2 Specification As given in Section 2
3.1.3 Purity 96.2 %
3.1.4 Radio labelling Not used
3.1.5 UV N IS absorption Extinction coefficients were estimated relative to the maximum of spectra and 11 ,800 M-1 cm ·1 at 210 run using the respective attenuations absorbance value
3.1.6 Further relevant None properties
3.2 Referenc.e No substance
3.2.l Initial concentration of reference substance
3.3 Test solution SeeTableA7 1 1 1 2-1 - - - -
3.4 Testing procedure
3.4.l Test system Sunlight inadiations were perfonned in screw-capped, 11-mm o.d. qua11z tubes, held on a rack at about 30° to the horizon on the roof of the SRI Physical Sciences building on consecutive cloudless days from 6 July to 10 July 1987 (kinetic studies) and from 26 May to 3 June 1988 (product studies). Photolyses were nm at ambient temperature, which was 25 ± 5 °C. The actinometer solution (10 ~tM p-nitroacetophenone/20 mM pyridine) was iffadiated in identical fashion and sampled at the same time as the acrolein solutions. Controls consisted of replicate solutions
Document IHA
Baker Petrolite ACROLEIN December 2005
Section A7.1.1.1.2 Phototransformation in water including identity of
Annex Point IIA7.1.1.1.2 transformation products
placed in tubes and in the sun but covered with aluminium foil. During analysis the tubes were sampled at regular intervals and replaced on the rack.
3.4.2 Prope1t ies of light See TableA7 1 1 1 2-2 x - - - -source
3.4 .3 Detemtination of A sunlight actinometer was used for kinetic studies. The solution itradiance contained 10 ~1M p-nitroacetophenone and 20 mM pyridine.
3.4.4 Temperature 25 ± 5 °C x 3.4 .5 pH 7
3.4.6 Duration of test Kit1etic studies: 4 days
Product studies: 8 days
3.4 .7 Number of Not specified replicates
3.4.8 Sampling Samples were stored at 1 °C before analysis. Samples were taken at 0, 18, 42, 66 and 90 hours.
3.4.9 Analytical methods Reaction solutions for kinetic runs were prepared by diluting 1.0 ml of 1000 ppm acrolein stock and 2 ml of 0.5 M phosphate buffer to 100 ml with Milli-Q water to yield 10 ppm acrolein and 10 mM phosphate. Runs were performed at pH 3, where the dark hydration reaction is the slowest, at pH 7, which is more typical of natural waters.
Solutions of 10 ppm acrolein in I 0 mg/I humic acid were prepared by dilutit1g 0.5 ml of 1000 ppm acrolein s tock, 5 ml of 100 mg/I humic acid stock and 1.0 ml of 0.5 M pH 7 phosphate buffer to 50 ml.
The actinometer solution was prepared by diluting 0.5 ml of PNAP stock and 161 µ1 of pyridine to 100 ml with Milli-Q water.
Solutions for product studies were prepared as for kit1etic studies except that 3 .0 ml of acroleill stock was used, yielding a final concentration of 30 ppm. Product studies were run only at pH 7, and no actinometer was used.
During killetic studies, acroleit1 was detennined by HPLC on a HP I 090 system equipped with a diode airay detector. Conditions were as follows:
Column: 3 ~un hypersil Cl8 60 mm x 4 .5 rmn
Eluent: 20 % acetonitrile ill water at 0.4 mL/min.
Inje.ctor volume: 15 µ1
Detection: 210 run
Acrolein retention tillie: 2 .7 min.
Quantitation was achieved by the external standard method.
During product studies, acrolein was ai1alysed by direct UV spectrophotometry on a HP 8450 UVNIS spectrophotometer. The hydration product, 3-hydroxypropanal, was ai1alysed by HPLC following derivatisa.tion with penta.fluorophenylhydrazit1e (PFPH). Conditions were as follows:
Colll1ll11: 3 ~un hypersil C 18 60 rmn x 4 . 5 mm
Eluent: 40 % a.cetonitrile ill water for 3.8 tnin. increa.sit1~ to
Document IIIA
Baker Petrolite ACROLEIN December 2005
Section A7.1.1.1.2 Phototransformation in water including identity of
Annex Point IIA7.1.1.1.2 transformation products
70 % acetonitrile at 4.1 minutes.
Injection volume: 5 ~tl
Detection: 260 nm
Retention times: 4.7, 7.5 and 7.8 min. for derivatives of3-hydroxypropanal, acrolein and propanal, respectively.
The retention time of PFPH-derivatised 3-hydroxypropanal was verified by use of a standard prepared by allowing a 30 ppm solution acrolein to hydrate at pH 7 for 40 days. In lieu of an authentic standard for PFPH-derivatised 3-hydroxypropanal, PFPH-derivatised propanal was used as a quantitative standard and assumed that the molar absorptivities of the two derivatives are identical.
Statistical analyses were perfonned using the Statworks® statistical program.
3.5 Transformation Yes
products
3.5. 1 Method of analysis 3-hydroxypropanal was analysed by HPLC following derivatisation with for transfonnation PFPH. products
4 RESULTS
4.1 Screening test Not pe1fom1ed
See Table A 7 1 1 1 2-3 - - - -
4.2 Actinomete1· data See Table A 7 1 1 1 2-4 - - - -
4.3 Controls
4.4 Photolysis data
4 .4. l Concentration values
4 .4.2 Mass balance
4 .4.3 kc O.Ql d-1
p
4.4.4 Kinetic order
4 .4 .5 kcp I k"p
4 .4.6 Reaction quantum ~ 0.001
yield (~cE)
4.4.7 kpE
4 .4.8 Half-life ( t1nE) 70 days
5 APPLICANT'S SUMMARY AND CONCLUSION
5.1 M aterials and The study was perfo1med according to the protocols in Federal Register methods 1985, 50(188) 796.3700, 796.3780,796.3800 and Pesticide Assessment
Sunli~t irradiations were perfonned on the samples of acrolein, the
Document IIIA
Baker Petrolite ACROLEIN December 2005
Section A7.1.1.1.2 Phototransformation in water including identity of
Annex Point IIA7.1.1.1.2 transformation products
actinometer solution (10 µM p-nitroacetophenone/20 mM pyridine) and the controls, on consecutive cloudless days over a period of 4 to 8 days. Sampling occtmed at 0, 18, 42, 66, and 90 hours. Photolyses were nm at ambient temperature (25 ± 5 °C). Dming kinetic studies, acrolein was detennined by HPLC and during product studies, it was analysed by direct UV spectrophotometiy. The hydration product, 3-hydroxypropanaI, was analysed by HPLC following derivatisation with PFPH.
5.2 Results and The results show that photolysis is negligible compared to the dark discussion hydration reaction. In addition, the mn with 10 mg/I humic acid indicates
that sensitised photolysis is unimportant. Because the hydration rate is tmaffected by stmlight, the prima1y products must also be the same in light and dark. However, it is conceivable that the hydration product, 3-hydroxypropanal, is transfo1med photochemically. To test for this, product concentrations were detennined as a function of time. This demonstrnted that a material balance of reactant and product was obtained in both light and dark reactions.
5.2 .l kc p
5.2 .2 l<pE o.oi d-1
5.2 .3 <pcE
5.2 .4 t 112E 70 days
5.3 Conclusion The photolysis of acrolein in water was found to proceed at a rate much slower than hydrolysis, and therefore the aqueous photolysis rate could not be measured. The maximum quantmn yield was estimated to be :::; 0.001. From this, the photolysis rate constant was calculated to be 0.01 d-1 and the minimum half-life was estimated to be 70 days under summer sunlight conditions at 40 °N.
Since no photolysis occtmed, no photolysis products could be fom1d. However, it was shown that stmlight had no effect on the fo1mation of the hydration product, 3-hydroxypropanal
5.3.1 Reliability 1
5.3.2 Deficiencies No
Evaluation by Competent Authorities
Use separate "evaluation boxes" to provide transparency as to the comments and views submitted
EVALUATION BY RAPPORTEUR MEMBER STATE
Date 10/07/2007
M aterials and Methods The Applicant' s version is considered acceptable with the following exceptions:
2.3 No data on hours of daylight, see point 3.4.2.
3.4.2 Table A 7 _1_1_1_2-2: Desc.ription of test system :
The hours of daylight have not been included in the table. This does not affect the endpoint from the study.
3.4.4 Temperatm·e:
The stated temperatme range is 25 ± 5°C. EPA guideline 161-2 states the desired range to be 25 ± 1 °C. This does not affect the endpoint from the study.
Document IIIA
Baker Petrolite ACROLEIN December 2005
Section A7.1.1.1.2
Annex Point IIA7.1.1.1.2
Phototransformation in water including identity of transformation products
Results and discussion The Applicant’s version is considered to be acceptable
Conclusion The Applicant’s version is considered to be acceptable
Reliability 1
Acceptability Acceptable
Remarks All endpoints and data presented in the summary have been checked against the original study and are correct.
COMMENTS FROM ... (specify)
Date Give date of comments submitted
Materials and Methods Discuss additional relevant discrepancies referring to the (sub)heading numbers and to applicant's summary and conclusion. Discuss if deviating from view of rapporteur member state
Results and discussion Discuss if deviating from view of rapporteur member state
Conclusion Discuss if deviating from view of rapporteur member state
Reliability Discuss if deviating from view of rapporteur member state
Acceptability Discuss if deviating from view of rapporteur member state
Remarks
Document IIIA
Baker Petrolite ACROLEIN December 2005
Table A7_1_1_1_2-1: Description of test solution and controls
Criteria Details Purity of water Unbuffered Milli-Q water
Preparation of test chemical solution Solutions of 10 ppm acrolein in 10 mg/l humic acid prepared by diluting 0.5 ml of 1000 ppm acrolein stock, 5 ml of 100 mg/l humic acid stock and 1.0 ml of 0.5M pH 7 phosphate buffer to 50 ml.
Test concentrations (mg a.s./l) Initial concentration: 10 ppm acrolein.
Temperature (°C) Ambient 25ºC ± 5ºC
Preparation of a.s. solution 0.5 ml of p-nitroacetophenol stock and 161 µl of pyridine diluted to 100 ml with Milli-Q water.
Controls None
Identity and concentration of co-solvent No co-solvent used
Table A7_1_1_1_2-2: Description of test system
Criteria Details
Laboratory equipment Screw-capped 11 mm o.d. quartz tubes. HPLC: HP 1090 system Spectrometer: HP 8450 UV/Vis Give details on the type and geometry of the reaction vessels (test tubes, material, size, type of absorption cell, pathlength); describe applicability in relationship to the applied wavelength. Report the name and the model of the spectrometer used.
Test apparatus e.g. sunlight actinometer; describe details
Properties of artificial light source: No artificial light source used.
Properties of natural sunlight: Natural sunlight used
Latitude 40ºN
Hours of daylight Not stated
Time of year Kinetic studies: 6 - 10 July 1987
Product studies: 26 May - 3 June 1988
Light intensity Not stated
Solar irradiance (Lλ) Not stated
Document IIIA
Baker Petrolite ACROLEIN December 2005
Table A7_1_1_1_2-3: Screening test results
Absorption curve give the plot of absorbanc of test substance vs. wavelenght (plus baseline)
Aλ give the absorbance at wavelength λ for each replicate and the mean value.
ελc give determined molar absorptivity (ελc) of the test substance (determined from absorption spectra
kpEmax give the calculated maximum direct aqueous photolysis sunlight rate constant (KpE)max for summer and winter solstices using appropriate Lλ values
t1/2Emin give the calculated minimum sunlight half-life in water bodies (t1/2E)min
Lλ Give the solar irradiance in water [10-3 einsteins cm-2 d-1]
Table A7_1_1_1_2-4: Actinometer data
PNAP/ pyridine concentrations 0.5l of PNAP stock and 161 µl of pyridine diluted to 100 ml with Milli-Q water
Give the molar concentration values of the actinometer chemicals at the start of each photolysis experiment and each time point t for each replicate (mean values).
φaE 3.4E-04 for 20 mM pyridine
kap Give the rate constant for the used actinometer
Table A7_1_1_1_2-5: Specification and amount of transformation products (adjust table size as required)
Amount [%] of parent compound measured at CAS-Number
CAS and/or IUPAC Chemical Name(s)
pH1 pH2 pH3
Document IIIA
Baker Petr olite ACROLEIN December 2005
Section 7.1.1.2.1 Ready Biodegradation Annex Point IIA VII.7.6.1.1
1.2 .2 Criteria for data Not applicable. prote.ction
2 GUIDELINES AND QUALITY ASSURANCE
2.1 Guideline study Bunch, R.L. and Chambers, C.W., "A Biodegradability Test for Organic x Compounds." Jour. Water Poll. Control Fed., 39, 181 (1967).
2.2 GLP No x 2.3 Deviations Initial 7-day study, triplicate subcultmes taken to 14 days.
No infotmation on the test substance. Specification of sewage sludge not given.
Reference substance not the one specified by the guidelines.
Results based on DOC and extraction from test substrate for detection by GC.
Full range of controls not used.
3 METHOD
3.1 Test material Commercially available Acrolein.
3.1.1 Lot/Batch number Not stated. x 3.1.2 Specification Not stated. x 3.1.3 Plll'ity Not stated. x 3.1.4 Further relevant
properties
3.2 Reference Yes, Phenol. substance
3.2 .l Initial 5, 10 mg/l concentration of reference substance
3.3 Testing procedure
3.3.1 Test vessels 250 ml glass-stopped reagent bottles
3.3.2 Test concentrations 5, 10 mg/l
3.3.3 Controls Blank control, inoculum - medium and substrate - medium control.
3.3.4 Test conditions The test with acrolein was ca1ried out in glass-stopped reagent bottles to x 1ninimise volatilisation, inoculated with pre-chilled yeast extra.ct and settled domestic wastewater. The bottles were incubated at a constant room temperature of 25°C in darkness.
Document IIIA
Baker Petrolite ACROLEIN December 2005
Section 7.1.1.2.1 Ready Biodegradation Annex Point IIA VII.7.6.1.1
3.3.5 Duration of test 28 days
3.3.6 Analytical parameters
3.3.7 Sampling Duplicate samples at the beginning of each incubation period and triplicate samples at the end of the 7 day incubation
3.3.8 Analysis of study data
4 RESULTS
4. 1 Ready The seven day culture (and all of the further subcultures) showed 100% Biodegradability biodegradation at both initial concentrations of 5 and 10 mg/I.
4 .2 Dissolved Oxygen
5 APPLICANT'S SUMMARY AND CONCLUSION
5.1 M ate1ials and The biodegradability test method used was the static-culture flask-methods screening procedure of Bunch and Chambers, utilising biochemical
oxygen demand (BOD) dilution water containing 5 mg yeast extract per litre, as the synthetic medium; 5 and 10 mg/I concentrations of the test compound, a 7 day static incubation of 25°C in the dark, followed by three weekly subcultures, incmporating settled domestic wastewater as microbial inoculum. The test was modified to include the capability to study volatile compow1ds and to facilitate the use of GC, DOC and TOC analytical procedures. The procedure was extended to include the dete1111ination of the initial concentration of the test compound at the beginning of each incubation period.
Aqueous stock solutions were used to prepare the culture media. Biodegradability studies with acrolein were canied out in glass-stopped reagent bottles to minimise volatilisation. These were then inoculated with the pre-chilled yeast extract and settled domestic wastewater inoculum, before incubation at a constant room temperature of 25°C in darkness.
Duplicate samples at the beginning of each incubation period and ti·iplicate samples at the end of the 7 day incubation were subjected to GC and DOC analysis as follows:
The culture samples were extracted three times with 20 ml portions of methylene chloride. The pooled solvent extracts were evaporated by the Kudema-Danish evaporation technique and the concentrated exti·acts were then processed for GC analysis. For DOC, the samples were membrane filtered through a system using 0.22 µm porosity filters.
5.2 Results and The seven-day culture (and all of the fu11her subcultures) showed 100% x discu ssion biodegradation at both initial concentrations of 5 and 10 mg/I. The 100%
biodegradation results only indicate that test substance concentrations had fallen below the detectable level. The minimum sensitivity of the GC procedures used was about 0. 1 mg/I, as the procedure was not optimised for sensitivity.
The extraction efficiency differed with each of the test compounds and the recove1y value ranged from 78 to 98% and were fairly reproducible for several test rnns with each of the substrate-dosed cultme samples.
5.3 Conclusion Acrolein was shown to be easily dissimilated with rapid acclimation of x microbiota to the substrate.
Document IIIA
Baker Petr olite ACROLEIN December 2005
Section 7.1.1.2.1 Ready Biodegradation Annex Point IIA VII.7.6.1.1
The reliability of 2 was given in the EU risk assessment of Acrolein .
5.3. 1 Reliability 2
5.3.2 Deficiencies Not to standard test guideline.
Evaluation by Competent Authorities
Use separate "evaluation boxes" to provide transparency as to the comments and views submitted
EVALUATION BY RAPPORTEUR MEMBE R STATE
Date 21103/2006
Materials and Methods The Applicant's version is considered to be acceptable, noting the following:
1.1 The data submitted is taken from a published study and no raw data or quality assurance statement is given.
2.1 A copy of the guideline 'Bllllch, R.L. and Chambers, C.W., "A Biodegradability Test for Organic Compollllds." Jour. Water Poll. Control Fed. 39, 181 (1967)' was not accessible, therefore the evaluation by the UK CA is cairied out using a scientific compai·ison with the available OECD guidelines.
2.2 As the study was published before 1989, it is exempt from GLP.
3.1.1 Batch number not stated.
3.1.2 Specification not stated.
3.1.3 Purity not stated.
3.3.4 Test can1ed out at 25°C, OECD guidelines state test to be can-ied out at 30°C.
Results and discussion The Applicant's version is considered to be acceptable, noting the following:
5.2 No tabulated results are presented in the RSS, however the following results are available in the 01-iginal pa.per:
Table 5: Biodegradability of Acrolein.
Test Cone.Of Performance Average of 3 test flasks (Biodegradation of test Compound test summary compound in 7 days(%))
Compound Original 1st Culture 2.a Culture 3r<1 culture (mg/L) Culture
Acrolein 5 D* 100 100 100 100
Acrolein 10 D* 100 100 100 100
D*= significant degradation with rapid adaptation.
Conc.lusion The Applicant's version is considered to be acceptable, noting the following:
5.3 The statement 'Acrolein was shown to be easily dissimilated with rapid acclimation ofmicrobiota to the substrate' is a statement by the author of the original paper. There are no data presented to suppo1t this.
Reliability 3
Ac.ceptability Not Acceptable.
The reliability level has been changed from a 2 to a 3 because the UK CA believes that there are a number of deficiencies in the methodology and repo1ting of the original study.
Document IIIA
Baker Petrolite ACROLEIN December 2005
Section 7.1.1.2.1 Annex Point IIA VII.7.6.1.1
Ready Biodegradation
Remarks The guideline ‘Bunch, R.L. and Chambers, C.W., ‘A Biodegradability Test for Organic Compounds.” Jour. Water Poll. Control Fed. 39, 181 (1967)’, was not available to view and therefore the reliability level was changed as an accurate evaluation could not be made. [This has been requested so the remark may change].
As no tabulated results or graphs were included in the RSS, the reporting was considered to be deficient. All endpoints addressed in the summary have been checked against those in the study.
Taking the above factors into account, the UK CA considers that this study can only be used as supporting evidence that acrolein would degrade in the aquatic environment.
COMMENTS FROM ... (specify)
Date Give date of comments submitted
Materials and Methods Discuss additional relevant discrepancies referring to the (sub)heading numbers and to applicant's summary and conclusion. Discuss if deviating from view of rapporteur member state
Results and discussion Discuss if deviating from view of rapporteur member state
Conclusion Discuss if deviating from view of rapporteur member state
Reliability Discuss if deviating from view of rapporteur member state
Acceptability Discuss if deviating from view of rapporteur member state
Remarks
Document IIIA
Baker Petrolite ACROLEIN Dec.ember 2005
Section A7.1.1.2.2 Inherent biodegradability Annex Point HA VIl.7.6.1.2
JUSTIFICATION FOR NON-SUBMISSION OF DATA Official use only
Other existing data ( l Technic.ally not feasible ( l Sdentific.ally unjustified ( X ]
Limited exposure ( l Other justification ( ]
Detailed justification: As a ready biodegradability study was ca1ried out and gave a positive result (Section A7.l.l.2.l , Annex Point IIA, VII.7.6.1.2.), in accordance with the TNsG on Data Requirements for the Biocidal Products Directive an inherent biodegradability study is not required. In addition the active substance has been shown to undergo rapid degradation by physico-chemical processes including rapid volatilisation (A 7 .2.1) and photodegradation (A 7 .1.1.1.2). and microbial degradation in water (anaerobic and aerobic freshwater-sediment radio-labelle.d studies, A 7.1.2.1.1 and A7. l.2.1.2) transfonning the active substance to C02.
Under taking of intended data submission ( l
Evaluation by Competent Authorities
Use separate "evaluation boxes" to provide transparency as to the comments and views submitted
EVALUATION BY RAPPORTEUR MEMBER STATE
Date 30/11/2007
Evaluation of applicant's The UK CA has made the decision at the evaluation stage that the ready justification biodegradation test is not acceptable as a stand alone endpoint. However, due to
the exposure route i.e. not via an STP, and the availability of other data to show degradation no additional data are considered necessa1y for this specific use pattern.
Conclusion Acceptable because of the availability of other studies and not on the basis of the ready biodegradability.
Remarks
COMl\fENTS FROM OTHER MEMBER STATE (specify)
Date Give date of comments submitted
Evaluation of applicant's Discuss if deviating from view of rapporteur member state justific.ation
Conclusion Discuss if deviating from view of rapporteur member state
Remarks
Docmnent IIIA
Baker Petrolite ACROLEIN December 2005
Section A 7 .1.1.2.2 Inherent biodegradability Annex Point IIA VIl.7.6.1.2
JUSTIFICATION FOR NON-SUBMISSION OF DATA Official use only
Othe1· existing data I I Tec.hnically not feasible I I Scientifically unjustified [ X )
Limited exposure I I Other justific.ation [ )
Detailed justification: As a ready biodegradability study was can-ied out and gave a positive result (Section A 7 .1.1.2.1 , Annex Point IIA, VII. 7 .6.1.2.), in accordance with the TNsG on Data Requirements for the Biocidal Products Directive an inherent biodegradability study is not required. In addition the active substance has been show11 to undergo rapid degradation by physico-chemical processes including rapid volatilisation (A 7.2.1) and photodegradation (A 7.1.1.1.2). and microbial degradation in water (anaerobic and aerobic freshwater-sediment radio-labelled studies, A7. l.2. l.1 and A7. l.2.1.2) trnnsforming the active substance to C02.
Undertaking of intended data submission I I
Evaluation by Competent Authorities
Use separate "evaluation boxes" to provide transparency as to the comments and views submitted
EVALUATION BY RAPPORTEUR MEMBER STATE
Date 30/ 1112007
Evaluation of applic.ant's The UK CA has made the decision at the evaluation stage that the ready justification biodegradation test is not acceptable as a stand alone endpoint. However, due to
the exposure route i.e. not via an STP, and the availability of other data to show degradation no additional data are considered necessary for this specific use pattern.
Conclusion Acceptable because of the availability of other studies and not on the basis of the ready biodegradability.
Remarks
COMMENTS FROM OTHER MEMBER STATE (specify)
Date Give date of comments submitted
Evaluation of applicant's Discuss if deviating from view of rapporteur member state justification
Conclusion Discuss if deviating from view of rapporteur member state
Remarks
Docmnent IIIA
Baker Petrolite ACROLEIN December 2005
Section A 7 .1.1.2.2 Inherent biodegradability Annex Point IIA VIl.7.6.1.2
Section A 7 .1.1.2.2 Inherent biodegradability Annex Point IIA VIl.7.6.1.2
JUSTIFICATION FOR NON-SUBMISSION OF DATA Official use only
Othe1· existing data I I Tec.hnically not feasible I I Scientifically unjustified [ X )
Limited exposure I I Other justific.ation [ )
Detailed justification: As a ready biodegradability study was can-ied out and gave a positive result (Section A 7 .1 .1.2.1 , Annex Point IIA, VII. 7 .6.1.2.), in accordance with the TNsG on Data Requirements for the Biocidal Products Directive an inherent biodegradability study is not required. In addition the active substance has been show11 to undergo rapid degradation by physico-chemical processes including rapid volatilisation (A 7.2.1) and photodegradation (A 7.1.1.1.2). and microbial degradation in water (anaerobic and aerobic freshwater-sediment radio-labelled studies, A7. l.2. l.1 and A7. l.2.1.2) trnnsforming the active substance to C02.
Undertaking of intended data submission I I
Evaluation by Competent Authorities
Use separate "evaluation boxes" to provide transparency as to the comments and views submitted
EVALUATION BY RAPPORTEUR MEMBER STATE
Date Give date of action
Evaluation of applicant 's Discuss applicant's justification and, if applicable, deviating view justification
Conclusion Indicate whether applicant's justification is acceptable or not. If unacceptable because of the reasons discussed above, indicate which action will be required, e.g. submission of specific test/study data
Remarks
COMMENTS FROM OTHER MEMBER STATE (specify)
Date Give date of comments submitted
Evaluation of applicant's Discuss if deviating from view of rapporteur member state justification
Conclusion Discuss if deviating from view of rapporteur member state
Remarks
Docmnent IIIA
Baker Petr olite ACROLEIN December 2005
Section 7.1.1.2.3 Biodegradation in seawater Annex Point IIIA XII 2.1
Official 1 REFERENCE use ouly
1.1 Refer enc.e Manley, R. (2003a) A Study of the Aerobic Biodegradation in Seawater ofMAGNATREAT-M using the Closed Bottle Procedure in a Screening Test. Sevem Trent Limited. Study No. STL031989.
1.2 Data protect ion Yes
1.2 .1 Data owner Baker Petrolite
1.2 .2 Criteria for data Data on new a.s. for first entiy to Annex I protection
2 GUIDELINES AND QUALITY ASSURANCE
2.1 Guideline study Yes
OECD Guideline 306
2.2 GLP Yes
2.3 Deviations No x
3 METHOD
3.1 Test material Magna.treat M: As given in Section 2 x 3.1.1 Lot/Batch number STL reference: 832111
3.1.2 Specification As given in Section 2 x 3.1.3 Purity Not stated
3.3.1 Test vessels Completely filled, sealed glass biological oxygen demand (BOD) bottles of nominal 272 tn1 vohune.
3.3.2 Test concenti·ations Ma.gna.treat-M used at 2.0 mg/I and 3.5 mg/I. Soluble test materials are added to the test media from a 1.0 g/l stock solution
3.3.3 Controls Sodium benzoa.te, at a. concentration of 2.5 mg/I was used to as a. reference substance to monitor microbial activity. Sodium benzoate a.t 2 .5 mg/I and 2.0 mg/I Magnatreat-M were used as an inhibition blank to monitor any inhibition/toxicity of the sample.
3.3.4 Test conditions All test bottles contained coarse filtered, natural seawater a.s inoculum. For ea.ch of the sample days, duplicate bottles were prepared for ea.ch of the test material concentrations and sodium benzoate. All bottles were incubated a.t 18. 5 - 21. 0°C in the dark. The incubator was a.t 21 °C for one da.y only and wa.s adjusted back to 15.0-20.0°C.
3.3.5 Sow·ce of sea.water Natw·al sea.water was collected from Penrhyn Point in No1th Wales. The x temperature at collection was 9.5°C, pH 7.96, salinitv 32.9 g/l and the
Document IIIA
Baker Petrolite ACROLEIN December 2005
Section 7.1.1.2.3 Biodegradation in seawater Annex Point IIIA XII 2.1
dissolved oxygen level 98.4%. After collection, the seawater was coarse filtered and maintained in the dark. The seawater was aged prior to use by gentle aeration, at 20 ± 2°C.
3.3.8 Sampling Days 0, 14, 28. x Duplicate bottles of each concentration of test material, and bottles containing sodium benzoate were measured.
3.3.9 Analysis of study The calculated ThOD and dissolved oxygen data were recorded at each data analysis point (including Day 0 readings), and processed to derive the
percentage degradability of the test material.
Degradation values were calculated using the e.quation:
% Degradability = BODmg02mit1test material x 100
ThOD (mg02mg-1)
4 RESULTS
4.1 Thod The theoretica l oxygen demand was 2 .0 mg mg·1
Degradation profile ofMAGNATREAT-M, at 2.0mg 1·1 and 3.5mg 1·1,
plus sodium benzoate at 2.5 mg r 1' and sodium benzoate and 2.0 mg r 1
MAGNATREAT-M inhibition blank over 28 days.
5 APPLICANT'S SUMMARY AND CONCLUSION
5.1 M ate1ials and The study was pe1fonned in accordance with OECD Guideline 306. A methods sample ofMagnatreat-M was assessed for 28 days in a screening test. All
test bottles contained seawater collected from Pemhyn Point in North Wales. Magnatreat-M at concentrations of2.0 mg/I and 3.5 mg/I was added. Sodium benzoate, (2.5 mg/l) was used as a reference material to monitor microbial activity. Sodium benzoate at 2 .5 mg/I and 2.0 mg/I Magnatreat-M were used as an inhibition blank to monitor any inhibition/toxicitv of the sample. All bottles were incubated at 18.5 -
Document IIIA
Baker Petrolite ACROLEIN December 2005
Section 7.1.1.2.3 Biodegradation in seawater Annex Point IIIA XII 2.1
21 °C in the dark for 28 days.
Dissolved oxygen and theoretical oxygen demand were measW'ed on Days 0, 14 and 28.
5.2 Results and A figure of 60% degradation within 28 days is usually taken as being x discussion indicative of a good potential for degradation in the marine enviromnent.
Under the test condition in the closed bottle procedW'e, Magnatreat-M showed limited potential for degradation in the marine environment at test concentrations of2.0 and 3.5 mg/I. It was concluded from the inclusion of an inhibition blank that the sample was either toxic or inhibitive to the micro-organisms present.
% Degradability
Material (mg/I) : Magnatreat M
Day 14: Negative value, indicating possible toxicity/inhibition.
Day28: Negative value, indicating possible toxicity/inhibition.
Material (mg/I) : Magnatreat-M (3.5)
Day 14: Negative value, indicating possible toxicity/inhibition.
Day28: Negative value, indicating possible toxicity/inhibition.
Material (mg/I) : Sodium benzoate (2.5)*
Day 14: 91.3 %
Day28: 93.9 %
Material (mg/I): Inhibition blank, Sodium benzoate (2.5) + Magnatreat-M at (2.0)
Day 14: Negative value, indicating possible toxicity/inhibition.
Day28: Negative value, indicating possible toxicity/inhibition.
*Using the calculated theoretical oxygen demand (1110D) of sodium benzoate as 1.67 mg 0 2/l
A degradation of 93 .9% after 28 days was obtained from sodimn benzoate. This demonstrates that the inoculum was biologically active. Negative values indicated inhibition or toxicity by the test material.
5.3 Conclusion x 5.3.1 Reliability I
5.3.2 Deficiencies No. x
Document IIIA
Baker Petr olite ACR OLE IN December 2005
Section 7.1.1.2.3 Biodegradation in seawater Annex P oint IIIA XII 2.1
Evaluation by Competent Authorities
Use separate "evaluation boxes" to provide transparency as to the comments and views submitted
EVALUATION BY RAPPORTEUR MEMBER STATE
Date 24/03/2006
M aterials and Methods The Applicant's version is acceptable, noting the following:
2.3 Deviations were made, see points 3.1, 3.1.2, 3.3.5 and 3.3.8 below.
3.1, & 3.1.2 No details provided in the study, or the summaiy, on the test substai1ce 'MAGNATREAT·M' to compare with details in section 2. 'Section 2' refers to section 2 of Doc III, but there is nothing in the report to verify this.
3.3.5 Infonnation on the seawater missing from the original study. Namely, depth of collection, appearance of seawater, length of time between collection and use, ai1d the length of time the seawater was aged prior to use.
3.3.8 OECD guideline 306 that states aiialysis should be perfo1med after 5, 15 ai1d 28 days as a. minimum.
Results and discussion The Applicant's version is considered to be acceptable, noting the following;
5.2 The first % degrada.bility summary does not state the concentration of MAGNATREAT-M in the test solution. This should read MAGNATREAT-M (2.0)
Condusion The Applicant's version is considered to be acceptable, noting the following;
5.3 No conclusion provided by the Applicant. The UK CA suggests the following should be used;
'It was concluded from the inclusion of an inhibition blank that the sample was either toxic or inhibito1y to the microorganisms present in the sea.water. A degradation of93.9% after 28 days was obtained from sodium benzoa.te demonstrating that the inoculum was biologically active' . Fmther testing, using a lower concentration of test substance, may address this issue. However, the toxicity of a.crolein is such that derivation of a valid (mea.smed) endpoint would be m1likely.
Reliability 2
Ac.ceptability Acceptable
5.3.2 The reliability level has been changed from a 1 to a 2 because the UK CA believes that there ai·e. a number of deficiencies in the methodology and reporting.
Remar ks The UK CA believes that the study was perfonned correctly with only minor deviations from OECD guideline 306.
All endpoints addresse.d in the smruna1y have been checked against those in the study.
Under the conditions tested Acrolein has not been shown to be readily biodegradable in sea.water. This study should have been perfonned with lower test concentrations.
COMMENTS FRO M ... (specify)
Date Give date of comments submitted
Document IIIA
Baker Petrolite ACROLEIN December 2005
Section 7.1.1.2.3 Annex Point IIIA XII 2.1
Biodegradation in seawater
Materials and Methods Discuss additional relevant discrepancies referring to the (sub)heading numbers and to applicant's summary and conclusion. Discuss if deviating from view of rapporteur member state
Results and discussion Discuss if deviating from view of rapporteur member state
Conclusion Discuss if deviating from view of rapporteur member state
Reliability Discuss if deviating from view of rapporteur member state
Acceptability Discuss if deviating from view of rapporteur member state
Remarks
Table A7_1_2_2_3-1: Dissolved oxygen (mg/l) data for control and inoculum blanks and test media containing MAGNATREAT-M
mg O2/l after n days Culture medium Flask No.
Day 0 Day 14 Day 28
1 7.65 7.15 7.07
2 7.66 7.15 7.07
Test:
Nutrient fortified seawater with 2.0 mg/l test material Mean 7.65 7.15 7.07
1 7.66 7.25 7.09
2 7.71 7.30 7.10
Test:
Nutrient fortified seawater with 3.5 mg/l test material Mean 7.69 7.28 7.10
1 7.64 3.00 2.10
2 7.66 2.92 2.40
Reference: Nutrient fortified seawater with 2.5 mg/l sodium benzoate Mean 7.65 2.96 2.25
1 7.62 6.80 6.16
2 7.64 6.70 6.14
Blank:
Nutrient fortified seawater only
Mean 7.63 6.75 6.15
1 7.62 7.30 6.92
2 7.63 7.21 7.03
Reference: Nutrient fortified seawater with 2.5 mg/l sodium benzoate and 2.0 mg/l test material Mean 7.63 7.26 6.98
Document IIIA
Baker Petrolite ACROLEIN December 2005
Section A7.1.2 Rate and route of degradation in aquatic systems Annex Point IIIA including identification of metabolites and degradation XIl.2.1 products
JUSTIFICATION FOR NON-SUBMISSION OF DATA Official use only
Othe1· existing data I I Tec.hnically not feasible I I Scientifically unjustified [ X )
Limited exposure I I Other justific.ation [ )
Detailed justification: The rate and route of degradation in water/sediment has been detennined and discussed in section IIIA7.l.2.l.l & IIIA7.l.2.l.2
Undertaking of intended data submission I I
Evaluation by Competent Authorities
Use separate "evaluation boxes" to provide transparency as to the comments and views submitted
EVALUATION BY RAPPORTEUR MEMBER STATE
Date 18/05/2006
Evaluation of applicant's The Applicant's justification is acceptable. justification
Conclusion Acceptable
Remar ks
COMMENTS FROM OTHER MEMBER STATE (specify)
Date Give date of comments submitted
Evaluation of applicant 's Discuss if deviating from view of rapporteur member state justification
Conclusion Discuss if deviating from view of rapporteur member state
Remarks
Docmnent IIIA
Baker Petrolite ACROLEIN December 2005
Section A7.1.2.1.1 Biological sewage treatment: Aerobic simulation study Annex Point IIIA XIl.2.1
JUSTIFICATION FOR NON-SUBMISSION OF DATA Official use only
Othe1· existing data I I Tec.hnically not feasible I I Scientifically unjustified [ X )
Limited exposure I I Other justific.ation [ )
Detailed justification: The active substance will not be released to biological sewage treatment plants before release as it is used exclusively in the marine environment on off-shore oil product platforms. An aerobic simulation study is therefore considered to be scientifically w1justified.
Undertaking of intended data submission I I
Evaluation by Competent Authorities
Use separate "evaluation boxes" to provide transparency as to the comments and views submitted
EVALUATION BY RAPPORTEUR MEMBER STATE
Date 16/05/2006
Evaluation of applicant's The Applicant's justification is acceptable justification
Conclusion Acceptable
Remar ks
COMMENTS FROM OTHER MEMBER STATE (specify)
Date Give date of comments submitted
Evaluation of applicant 's Discuss if deviating from view of rapporteur member state justification
Conclusion Discuss if deviating from view of rapporteur member state
Remarks
Docmnent IIIA
Baker Petrolite ACROLEIN December 2005
Section A7.1.2.1.2 Biological sewage treatment: anaerobic degradation Annex Point IIIA study XIl.2.1
JUSTIFICATION FOR NON-SUBMISSION OF DATA Official use only
Othe1· existing data I I Tec.hnically not feasible I I Scientifically unjustified [ )
Limited exposure I I Other justific.ation [ )
Detailed justification: The active substance will not be released to biological sewage treatment plants before release as it is used exclusively in the marine environment on off-shore oil product platforms. An anaerobic degradation study is therefore considered to be scientifically w1justified.
Undertaking of intended data submission I I
Evaluation by Competent Authorities
Use separate "evaluation boxes" to provide transparency as to the comments and views submitted
EVALUATION BY RAPPORTEUR MEMBER STATE
Date 16/05/2006
Evaluation of applicant's The Applicant's justification is acceptable. justification
Conclusion Acceptable
Remar ks
COMMENTS FROM OTHER MEMBER STATE (specify)
Date Give date of comments submitted
Evaluation of applicant 's Discuss if deviating from view of rapporteur member state justification
Conclusion Discuss if deviating from view of rapporteur member state
Remarks
Docmnent IIIA
Baker Petrolite ACROLEIN December 2005
Section 7.1.2.2.1 Aerobic aquatic degradation Annex Point IIIA XII 2.1
Official 1 REFERENCE use ouly
1.1 Referenc.e Smith , A.M. (1993a). (14C-Acrolein) - Determination of the Aerobic Aquatic Metabolism, Springbom Laboratories, Inc. SLI Report No. 91-3-3747.
1.2 Data protect ion Yes
1.2 .1 Data owner Baker Petrolite
1.2.2 Criteria for data Data on new a.s. for first entty to Annex I protection
2 GUIDELINES AND QUALITY ASSURANCE
2.1 Guideline study Yes
US EPA FIFRA Guideline 162-4
2.2 GLP Yes
2.3 Deviations No
3 METHOD
3.1 Test material As given in Section 2
3.1.1 Lot/Batch number Sample no. 6587 x 3.1.2 Specification As given in Section 2
3.1.3 Purity 95.06% x 3.1.4 Further relevant Acrolein has a water solubility of23 .7% at 25°C.
prope1t ies
3.1.5 Composition of Not applicable Product
3.1.6 TS i11hibito1y to Yes microorganisms
Exposme to increasing concentrations of acrolein had increasingly inhibito1y effects upon the population of Anabaenajlos-aquae.
The effects of test substance on mean standing crop on day 5, relative to control, ranged from 5.12% to 98.6% inhibition.
3.1.7 Specific chemical None used analysis
3.2 Reference No substance
3.2.1 Initial concentration of reference substance
3.3 Testing procedure
3.3.1 Inoculum I SeeTableA7 1 2 1 2-1 - - - -test species
3.3.2 Test system See TableA7 1 2 1 2-2 - - - -
3.3.3 Test conditions See Table A7 1 2 1 2-3 x - - - -
Document IIIA
Baker Petrolite ACROLEIN December 2005
Section 7.1.2.2.1 Aerobic aquatic degradation Annex Point IIIA XII 2.1
3.3.4 Method of A radiolabelled superstock solution was prepared by quantitatively preparation of test transfening the entire contents of an ampoule of radiolabelled 14C-solution Acrolein (100 mCi) through repetitive rinsing with Burdick and Jackson
high purity acetone into a 100 ml volumetric flask and diluting to volume. This super-stock had a mean measured concentration of 4.30 mg/ml (triplicate analysis by liquid scintillation counting (LSC)). A 1.25 ml sample of the 4.30 mg/ml radiolabelled stock was combined with 32. 125 mg of non-radiolabelled acrolein and diluted to a final volume of 25 ml with NANOpure® water, to obtain a dosing solution concentration of 1.50 mg/ml acrolein. Exactly 4.00 ml of this solution was added by gas-tight syringe to each replicate test vessel containing sediment and 400 ml of canal water to obtain a nominal concentration of 15.0 mg/I.
3.3.5 Initial TS 15.0 mg/I concentration
3.3.6 Duration of test 32 days x 3.3.7 Analytical Rate of metabolism and pattem of decline of 14C-acrolein.
parameter
3.3.8 Sampling The sampling intervals for this study were chosen as events where maximum levels of each degradation product would be expected based on the results observed in the interim study. Sediment samples were taken for microbial biomass detenninations at initiation and tennination of the study. At hours 0, 3, and 5 and Days 1, 2, 5 and 32, HPLC and LSC analysis samples were drawn. On Day 32 the canal water was decanted and the volume recorded. Percent moisture analysis and radiometric combustion analysis was caffied out on the remaining sediment. Sub-samples were extracted with 120 ml of sodium hydroxide and analysed by HPLC and LSC techniques. After extraction, radiometric combustion samples were weighed and analysed for non-extractable residues.
The sodium hydroxide trapping systems were replaced and analysed at each sampling interval except Hour 0. In order to preclude saturation, additional trap changes were perfo1med on Days 3, 4, 6, 7, 8, 9, 11 , 12, 14, 17, 20 and 25 over the 32-day study. The total volume of the sodium hydroxide traps was measured and samples were analysed by LSC.
At Day 32, the Tenax® traps were eluted twice sequentially with methanol and the eluent analysed by LSC.
Representative sodium hydroxide traps (replicate 1 Day 3, 11 , 25, and 32 and replicate 3 Day 25) were analysed by barium hydroxide precipitation procedure to detennine the presence of 14C-carbon dioxide Replicate 1 Day 32 canal water was also analysed to confinn the presence of 14C-carbon dioxide
Samples were treated with a saturated barium hydroxide solution and the resulting precipitate filtered. Precipitate and supematant liquid were subsequently analysed by LSC.
3.3.9 Intem1ediates/ Identified degradation
High performance liquid chromatography with radiometric detection products
(HPLC-RAM) of the natural water phase collected at Hours 0, 3 and 5 and on Days 1, 2, 5 and 32, revealed the rapid degradation of 14C-acrolein. Through Day 5 of the study, six products were produced in the water phase which were ephemeral in nature: 3-hydroxypropanal, acrylic acid, ally! alcohol, propionic acid, glyceric acid and 3-hydropropionic acid. An additional product, oxalic acid, was fonned on Day 2 and
Document IHA
Baker Petrolite ACROLEIN December 2005
Section 7.1.2.2.1 Annex Point IIIA XII 2.1
3. 3 .10 Controls
3. 3 .11 Statistics
4.1 Degradation of test substance
Aerobic aquatic degradation
remained throughout the study . All of these metabolites were fwther mineralised to carbon dioxide.
Not specified
The rate constant and half-life of acrolein in natural water under aerobic aquatic conditions were determined in this study. The interim study presents rate constants and half-lives in both the canal water and sediment phases.
A cumulative material balance was calculated for each replicate at each sampling interval and a final material balance was calculated upon termination. The final material balance was calculated by summing the cumulative disintegrations per minute (DPM) recovered in the carbon dioxide and Tenax® traps, DPM recovered in the canal water, DPM recovered in the sediment extl-act, and the non-extractable DPM remaining in the sediment, and then dividing by the total DPM applied in the dose.
4 RESULTS
4 .1.l Degradation of TS Not specified in abiotic control
4 .1.2 Degradation Carbon dioxide, the primary degradation product was fonned in the water phase on Day 2 and remained throughout the study. Expressed as bicarbonate ion (HC03.), carbon dioxide represented greater than 90% of the HPLC-RAM peak area on Days 5 and 32 and was observed to be 40% (4.7 ppm acrolein equivalents) and 25% (2.9 ppm acrolein equivalents) of the initial dose on the Day 5 and Day 32 sampling events, respectively .
4 .1.3 Graph Aguro 9. The ratio ol C01 to olll'cr vOlstiles in the npplng system at
representative sampling even\$.
100 -
co J -co2
>. :o i D other volatlles .... ·:;
~ 1~ -
c "::;
.s: -c: p: :i ~
3G
:: 1 0 '
Derr J Doy H Dor ;.$ Dey :;z
Time
Document IIIA
x
Baker Petrolite ACROLEIN December2005
Section 7.1.2.2.1 Aerobic aquatic degradation Annex Point IIIA XII 2.1
Figure 1: The Ratio of Carbon-dioxide to Other Volatiles in the Trapping System at Representative Sampling Events
4 .1.4 Other observations None
4.1.5 Degradation of Not applicable reference substance
4 .1.6 Intermediates/ See Section 5.2 degradation products
5 APPLICANT'S SUMMARY AND CONCLUSION
5.1 Materials and US EPA FIFRA Guideline No. 162-4 methods
5.2 Results and HPLC results of canal water samples as percent of peak area x discussion
Results indicated that hydrolysis was one of the main degradation pathways. This is evidenced by the fonnation of 3-hydroxypropanal. 3-hydroxypropanal was then further oxidised to produce 3-hydropropionic acid. The biotransformation of acrolein tmder aerobic conditions was also demonstrated, as evidenced by the fonnulation of acrylic acid and allyl alcohol. This microbial biotransfonnation of acrolein took place early in the study and competed with the hydrolysis process. Acrolein also underwent rapid self-oxidation and reduction to produce its
Document IIIA
Baker Petrolite ACROLEIN December2005
Section 7.1.2.2.1 Aerobic aquatic degradation Annex Point IIIA XII 2.1
oxidative product, a.c1ylic acid and its reductive product, allyl alcohol. Acrylic acid was reduced to propionic and which oxidised to oxalic acid and eventually to carbon dioxide tlrrough complete mineralization. The fate of allyl alcohol was less obvious largely due to its volatility. For the same reason, allyl alcohol was not present in the aqueous phase in the same amount as ac1ylic acid.
All metabolites of a.crolein are polar and highly water soluble and are less volatile than acrolein. Due to the rapid degradation of acrolein through these pathways, the loss of radioactivity through volatility of acrolein was further inhibited. After 32 days, most of the remaining radioactivity was detected in the aqueous phase of the test system at approximately 25 % of the initial dose, while the radioactivity in the sediment phase amounted to approximately 20% of the initial dose. The x decrease in radioactivity in the aqueous phase was not a result of so1ption to solids but rather due to the rapid mineralization of acrolein metabolites to carbon dioxide Consequently, the carbon dioxide fo1med was found to be the major product in volatile traps. The inineralization of acrolein also took place in the sediment phase. Inorganic bicarbonate and carbonate anions absorbed strongly to the sediment which explains why the more non-polar solvents (e.g., acetonitrile, methanol) were not suitable for extracting sediment samples.
5.3 Condusion Results of this study indicated hydrolysis was an early step in acrolein degradation, and is suppo1ted by previous reported acrolein behaviour. Under the conditions of this study, acrolein unde1went rapid hydrolysis and biodegradation in water.
5.3.1 Reliability 1
5.3.2 Deficiencies No
Document IHA
Baker Petr olite ACROLEIN December 2005
Evaluation by Competent Authorities
Use separate "evaluation boxes" to provide transparency as to the comments and views submitted
EVALUATION BY RAPPORTEUR MEMBER STATE
Date 30/1112007
M aterials and Methods The Applicant's version is acceptable, noting the following;
3.1.1 The sample nlllllber given in the summary (6587) differs from that stated in the study (6687).
3.1.3 TI1e purity stated in the summary, 95 .06%, is that repo1t ed by Sigma Aldrich. The Applicant's laborato1y, SLI, states the purity to be 92.2%. The UK CA considers 92.2% the actual purity to be used.
3.3.3 There is no inclusion, in the SUllllllary, of the water and sediment characteristics. These are available in the study, however. TI1e UK CA suggests the following tables to be included:
Table 1: Kem County Canal Sediment Characteristics :
Classific Sand Silt Clay Field PH Cation Organic Bulle ation (%) (%) (%) Moisture Exchange Matter Density
Descripti Total Total Suspende Total Dissolved Ph Specific on Alkalin Hardness d Solids Solids Oxygen c2o·q Conductivi
ity (mg/Las (mg/L) (mg/L) (mg/L) ty (~· (mg/L CaC03) MHO/cm)
as CaC03)
Clear/Ye 75 56 <0.002 0.122 10.8 8.0 184 llowTint
3.3.6 EPA Guideline 162-04 states that the duration of the test is to be 30 days.
3.3.10 No controls were used.
Document IIIA
Baker Petrolite ACROLEIN December2005
Results and discussion The Applicant’s version is considered to be acceptable, noting the following;
5.2 No half-life data have been reported in the summary. These are available in the study, however. The UK CA suggests the following table to be included:
Table 3: Acrolein rate constants and half-life results for aerobic water samples:
No. Of Observations
Correlation Coefficient (r2)
Rat Constant (1/hour)
Half-Life (hours)
12 0.994 0.021 33.7
Also, in the text it states ‘3-hydroxypropanal was then further oxidised to produce 3-hydropropionic acid’. The UK CA suggests this is changed to ‘3-hydroxypropanal was then further oxidised to produce 3-hydroxypropionic acid’.
Further in the text it is stated ‘Acrylic acid was reduced to propionic and which oxidised to oxalic acid and eventually to carbon dioxide through complete mineralization.’ The UK CA suggests this should read as follows:
‘Acrylic acid was reduced to propionic acid and which oxidised to oxalic acid and eventually to carbon dioxide through complete mineralization.’
5.2 The last paragraph states ‘After 32 days, most of the remaining radioactivity was detected in the aqueous phase of the test system at approximately 25 % of the initial dose, while the radioactivity in the sediment phase amounted to approximately 20% of the initial dose. The decrease in radioactivity in the aqueous phase was not a result of sorption to solids but rather due to the rapid mineralization of acrolein metabolites to carbon dioxide’, this is a direct contradiction of the conclusions made by the Applicant regarding adsorption/desorption (section A7.1.3).
Conclusion The Applicant’s version is considered acceptable.
Reliability 2
Acceptability Acceptable
No controls were used in the study, therefore the reliability factor has been changed to 2.
Remarks All endpoints and data presented in the summary have been checked against the original study and are correct.
COMMENTS FROM ... (specify)
Date Give date of comments submitted
Materials and Methods Discuss additional relevant discrepancies referring to the (sub)heading numbers and to applicant's summary and conclusion. Discuss if deviating from view of rapporteur member state
Results and discussion Discuss if deviating from view of rapporteur member state
Conclusion Discuss if deviating from view of rapporteur member state
Reliability Discuss if deviating from view of rapporteur member state
Acceptability Discuss if deviating from view of rapporteur member state
Remarks
Document IIIA
Baker Petrolite ACROLEIN December2005
Table A7_1_2_1_2-1: Inoculum / Test organism
Criteria Details
Nature Not specified
Species Not specified
Strain Not specified
Source Canal
Sampling site Kern County Canal, California, USA.
Laboratory culture No
Method of cultivation Not applicable
Preparation of inoculum for exposure Upon receipt, the sediment was stored in the dark in a soil incubator maintained at 17 °C and subsequently sieved through a 2 mm stainless steel sieve. The canal water was refrigerated upon receipt.
Pretreatment A daily 30 minute air purge of test systems allowed ample oxygenation yet deterred material loss.
Initial cell concentration Water: 9.7 x 10⁴ (CFU/ml)
Sediment: 3.1 x 10⁶ (CFU/ml)
Table A7_1_2_1_2-2: Test system
Criteria Details
Culturing apparatus Glass 1000 ml Erlenmeyer flask fitted with a glass Dreschel cap containing inlet and outlet ports for air exchange.
Number of replicates/concentration 3
Measuring equipment For each test vessel, one Tenax® trap was used to collect the volatile products in series with two sodium hydroxide traps designed to collect 14C-carbon dioxide.
Oxidation reduction indicator No
Table A7_1_2_1_2-3: Test conditions
Criteria Details
Composition of medium Not specified
Additional substrate No
Solvent No
Preparation of medium Each test vessel was covered with aluminium foil and incubated in an environmental chamber.
Test temperature 25 ± 1 °C
pH Sediment: 6.1
Water: 8.0
Suspended solids concentration < 0.002 mg/l
Other relevant criteria Each sample was swirled after dosing
Document IIIA
Baker Petrolite ACROLEIN December 2005
Section 7.1.2.2.2 Water/sediment degradation Annex Point IIIA XII 2.1
Official 1 REFERENCE use ouly
1.1 Referenc.e Smith, A.M. (1993b), (14C-Acrolein) • Detennination of the Anaerobic Aquatic Metabolism, Springbom Laboratories, Inc. SLI Report No. 91-3-3680.
1.2 Data protect ion Yes
1.2.l Data owner Baker Petrolite
1.2.2 Criteria for data Data on new a.s. for first entiy to Annex I protection
2 GUIDELINES AND QUALITY ASSURANCE
2.1 Guideline study Yes
US EPA FIFRA Guideline No. 162-3, 40 CFR 158.290
2.2 GLP Yes
2.3 Deviations Yes
The protocol stated that a Beckman Model LS-1801 liquid scintillation cotmter would be used for LSC analyses. In this study, a Beckman Model LS-5000 liquid scintillation counter was also used in addition to the Beckman Model LS-1801 liquid scintillation counter. This deviation is not expected to alter the results of this study.
3 METHOD
3.1 Test material As given in Section 2
3.1.1 Lot/Batch number Sample No. 5587 x 3.1.2 Specification As given in Section 2
3.1.3 Purity 95.06 % x 3.1.4 Further relevant Acrolein has a water solubility of23.7% at 25°C.
properties
3.1.5 Composition of Not applicable Product
3.1.6 TS inhibito1y to Yes micro-organisms
Exposure to increasing concentrations of acrolein had increasingly inhibitory effects upon the population of Anabaenajlos-aquae.
The effects of test substance on mean standing crop on Day 5, relative to control, ranged from 5.12% to 98.6% inhibition.
3.1.7 Specific chemical None used analysis
3.2 Reference No substanc.e
3.2.l Initial concentration of reference substance
3.3 Testing procedure
Document IIIA
Baker Petrolite ACROLEIN December 2005
Section 7.1.2.2.2 Water/sediment degradation Annex Point IIIA XII 2.1
3.3.1 Inoculum / See Table A7 1 2 1 2-1 - - - -test species
3.3.2 Test system See Table A7 1 2 1 2-2 - - - -
3.3.3 Test conditions See Table A7 1 2 1 2-3 x - - - -
3.3.4 Method of A radiolabelled super-stock solution was prepared by quantitatively preparation of test trnnsfening the entire contents of an ampoule of radiolabelled 14C-solution acrolein (100 mCi) through repetitive rinsing with Burdick and Jackson
high plll'ity acetone into a 100 ml volumetric flask and diluting to volume. This super-stock had a mean measUl'ed concentration of 4.30 mg/ml by triplicate liquid scintillation counting (LSC) analyses. 2.50 ml of the 4 .30 mg/ml radiolabelled stock was combined with 64.3 mg of non-radiolabelled acrolein and diluted to a final volume of 50 ml with NANOpure® water, to obtain a dosing solution concentration of 1.50 mg/ml acrolein. 4.00 ml of this solution was added by gas-tight syringe to each 1 litre flask replicate test vessel containing sediment and 400 ml of canal water to obtain a nominal concentration of 15.0 mg/I. 1.00 ml of this solution was added to each 250 ml flask replicate test vessel containing sediment and 100 ml of canal water to obtain a nominal test concentration of 15.0 mg/I.
3.3.5 Initial TS 15.0 mg/I concentration
3.3.6 Duration of test 184 days
3.3.7 Analytical Rate of metabolism and pattem of decline of 14C-acrolein. parameter
3.3.8 Sampling Folll' 1 litre flasks, Replicates 11 - 14, were prepared and aqueous samples (10 ml) were drawn and analysed at Days 0, 1, 2 and 8. On Day 30 each complete 1 litre test system was collected and analysed. Ten 250 ml flasks, Replicates 1 - 10, were also prepared on Day 0 and two complete test systems were collected and both analysed at Days 93 and at Day 178. The sodium hydroxide trapping systems were replaced and analysed at Days 1, 2, 3, 4, 5, 7, 8, 11, 16, 21 and 28 for each 1 litre and 250 ml test system. Additional trap changes for the 250 ml test systems occun-ed on Days 36, 42, 49, 56, 63, 70, 85, 106, 119, 126, 142, 154, 168 and 178. Duplicate 250 ml test systems were collected at Days 93 and 178. (Replicates 2, 3 and 4, 5, respectively).
At Day 30, the entire sample (both water and se.di.ment) was centrifuged at 100 1pm for 20 minutes. The water fraction was sampled high pe1fonnance liquid chromatography (HPLC) and radiometric LSC analysis. The sediment was removed for radiometric combustion analysis, microbial biomass determination and percent moisture analysis. Sub-samples of the sediment were extracted using sodium hydroxide and analysed by HPLC-RAM and LSC techniques.
On Days 93 and 178, the canal water was decanted from samples of the test system and radiometric combustion analysis and percent moisture analysis was perfonned on the remaining sediment. Extracts were also analysed by HPLC-RAM and LSC techniques.
The sodium hydroxide trapping systems were analysed by LSC over the coUl'se of the study to preclude saturation. Representative traps were chosen (Replicate 2 from Days 1 through 93 and Replicate 4 from days 106 through 178) and analysed by barimn hydroxide precipitation procedlll'e to detennine the presence of 14C -carbon dioxide. In addition, Day 30 (Replicate 13) canal water and Day 93 (Replicate 2) and Day 178
Document IIIA
Baker Petrolite ACROLEIN December 2005
Section 7.1.2.2.2 Water/sediment degradation Annex Point IIIA XII 2.1
(Replicate 4) canal water and sediment were also analysed. The resulting precipitate was filtered and analysed by LSC along with the supernatant.
The Day 178 (Replicate 4) post extraction sediment was acidified to test for bicarbonate content.
3.3.9 Intermediates/ Identified degradation
High performance liquid chromatography with radiometric detection products
(HPLC-RAM) revealed the following degradation products:
Day 1- oxalic acid
Day 2- acrylic acid, allyl alcohol and 3-hydroxypropionic acid
Day 8- 3-hydroxypropanal, propanol and propionic acid
All of these metabolites were further mineralised to carbon dioxide
3.3.10 Controls Not specified x 3.3.11 Statistics A cumulative material balance was calculated for each llitre replicate at
each sampling interval and a final material balance was calculated on Day 30 for the 1 litre replicates and Days 93 and 178 for the 250 ml replicates. The material balance was calculated by summing the cumulative disintegrations per minute (DPM) recovered in the carbon dioxide and Tenax® traps, DPM recovered in the canal water, DPM recovered in the sediment exti-act, and the non-extra.ctable DPM remaining in the sediment, and then dividing by the total DPM applied in the dose.
4 RESULTS
4.1 Degradation of test substance
4 .1.1 Degradation of TS Not specified in abiotic control
4 .1.2 Degradation Carbon dioxide, the primary degradation product, was fonned in the water phase on Day 2 and remained throughout the study. Expressed as bicarbonate ion (HC03.) , carbon dioxide represented greater than 60% of HPLC-RAM peak area on Days 30, 93 and 178. On the Day 8, 30, 93 and 178 sampling events, carbon dioxide was observed to be 13% (1.5 ppm acrolein equivalents), 20% (2.4 ppm acrolein equivalents) 4.4% (0.5 ppm acrolein equivalents) and 3.2% (0.4 ppm acrolein equivalents) of the initial dose, respectively.
Document IHA
Baker Petrolite ACROLEIN December 2005
Section 7.1.2.2.2 Water/sediment degradation Annex Point IIIA XII 2.1
4 .1.3 Graph -· ;..,v~
Cumulative Data from Traps ..... Votatileo> and Catboo OiOldde °""'"""'"' ....
C«bcr>~
: .~l 1J .~ ~ j201-6 . : ~ !"~·- ,- ·1 ~"t . ~
;;) -a,.~ •
o!i' 0 20 4o ,;'a so 100 120 1.:0 \60 160
Sam;lllng lnle~ (Oayi;)
Figure 1: Cumulative Data from Traps
4 .1.4 Other observations None
4.1.5 Degradation of Not applicable reference substance
4 .1.6 Intem1ediates/ See Section 5.2 degradation
Through Day 2 of the study, three products were produced in the water products
phase which were ephemeral in natme: acrylic acid, allyl alcohol and 3-hydropropionic acid. Through Day 8 of the study, three products were produced in the water phase which were detected at trace levels by Day 30 of the study: 3-hydroxypropanal, propanol and propionic acid. Additionally, oxalic acid was fonned on Day I and remained throughout the study. All of these metabolites were further mineralised to carbon dioxide
5 APPLICANT'S SUMMARY AND CONCLUSION
5.1 M ate1i als and US EPA FIFRA Guideline No. 162-3 methods
The protocol stated that a Beckman Model LS-1801 liquid scintillation counter would be used for LSC analyses. In this study, a. Beckman Model LS-5000 liquid scintillation counter was also used in addition to the Beckman Model LS-180 I liquid scintillation counter. This deviation is not expected to alter the results of this study.
5.2 Results and HPLC results of canal water samples as percent of peak area x discussion
Results indicated that hydrolysis was one of the main degradation pathways. This is evidenced by the fonnation of 3-hydroxypropanal. 3-hydroxypropanal was then further oxidised to produce 3-hydropropionic acid. The biotransfotmation of acrolein under anaerobic conditions was also demonstrated, as evidenced by the fonnulation of ally! alcohol. This microbial biotransfonnation of acrolein took place early in the study and competed with the hydrolysis process. Acrolein also unde1went rapid self-oxidation and reduction to produce its oxidative product, acrylic acid and its reductive product, ally I alcohol during the early stages of the study. Ally! alcohol was then fmiher reduced to propanol and acrylic acid was further reduced to propionic acid. All of these ti·ansient metabolites were then further metabolised under anaerobic conditions to their and products, carbon dioxide and oxalic acid.
All metabolites of acrolein are polar and highly water soluble and are less volatile than acrolein. After 30 days, most of the remaining radioactivity was detected in the aqueous phase of the test system at approximately 29% of the initial dose, while the radioactivity in the sediment phase amom1ted to approximately 22% of the initial dose. By Day 93, most of the remaining radioactivity was detected in the sediment phases of the test system at 20% of initial dose, while the radioactivity in the aqueous phase amow1ted to approximately 7.0% of the initial dose. On Day 178, the radioactivity remaining in the aqueous phase was 5% of the initial dose and in the sediment was 11 % of the initial dose. The observed decrease in radioactivity in the aqueous phase was a result of sorption to solids and also due to the rapid mineralization of acrolein metabolites to carbon dioxide. Consequently, the carbon dioxide fotmed was found to be the major product in volatile traps. The mineralization of acrolein also took place in the sediment phase. Inorganic bicarbonate and carbonate anions absorbed strnngly to the sediment which explains why the more non-polar solvents (e.g., acetonitrile, methanol) were not suitable for extracting sediment samples.
Results of this study indicated hydrolysis was an early step in acrolein degradation, and is suppott ed by previous repo1ted acrolein behaviour. Under the conditions of this study, acrolein w1de1went rapid hydrolysis and biodegrada.tion in water.
Document IHA
x
Baker Petr olite ACROLEIN December 2005
Section 7.1.2.2.2 Water/sediment degradation Annex Point IIIA XII 2.1
5.3.2 Deficiencies Yes
See Section 2.3
Evaluation by Competent Authorities
Use separate "evaluation boxes" to provide transparency as to the comments and views submitted
EVALUATION BY RAPPORTEUR MEMBER STATE
Date 09/05/2006
M aterials and Methods The Applicant's version is considered acceptable, noting the following;
3.1.1 The sample number in the summa1y (5587) is different from the one stated in the study (6687). The UKCA suggests that the following should be included:
• Non-radiolabelled Acrolein, Lot No. 6687
• Radiolabelled Acrolein, Lot no. 032H9223
3.1.3 The purity stated in the summary (95 .06) is that of the study sponsored non-radiolabelled Acrolein. The radiolabelled Acrolein purity should also be included. The UKCA suggests point 3 .1.3 should read:
• Non-radiolabelled Acrolein (repo1t ed by study sponsor) = 95.06%
• Radiolabelled Acrolein = ~95% (Sigma Chemicals Company), and 92.2% (duplicate radiochemical purity pe1formed at SLI)
3.3.3 There is no inclusion, in the summary, of the water and sediment characteristics. These are available in the study, however. The UK CA suggests the following tables to be included:
Table 1: Kem County Canal Sediment Characteristics:
Classific Sand Silt Clay Field PH Cation Organic Bulle a ti on (%) (%) (%) Moisture Exchange Matter Density
Results and discussion The Applicant’s Version is considered acceptable, noting the following;
5.2 The data presented within the report demonstrates that Acrolein rapidly degraded with a half-life < 1 day (the interim report states 10.3 hours) under anaerobic aquatic conditions.
The interim study also concluded that the half-life in sediment, based on radioactivity, was 240 hours (10 days)
Conclusion The Applicant’s version is considered to be acceptable
Reliability 2
Acceptability Acceptable
No controls were specified; therefore the reliability factor has been changed to 2.
Remarks All endpoints and data presented in the summary have been checked against the original study and are correct.
COMMENTS FROM ... (specify)
Date Give date of comments submitted
Materials and Methods Discuss additional relevant discrepancies referring to the (sub)heading numbers and to applicant's summary and conclusion. Discuss if deviating from view of rapporteur member state
Results and discussion Discuss if deviating from view of rapporteur member state
Conclusion Discuss if deviating from view of rapporteur member state
Reliability Discuss if deviating from view of rapporteur member state
Acceptability Discuss if deviating from view of rapporteur member state
Remarks
Table A7_1_2_1_2-1: Inoculum / Test organism
Criteria Details
Nature Not specified
Species Not specified
Strain Not specified
Source Canal
Sampling site Kern Island Canal, California, USA.
Laboratory culture No
Method of cultivation Not applicable
Preparation of inoculum for exposure Upon receipt, the sediment was stored in the dark in a soil incubator maintained at 17 °C and subsequently sieved through a 2 mm stainless steel sieve. The canal water was refrigerated upon receipt.
Pretreatment Test vessels containing untreated sediment and water were anaerobically incubated for approximately one month prior to dosing by daily 30 minute purging with
Document IIIA
Baker Petrolite ACROLEIN December 2005
nitrogen.
Initial cell concentration Water: 2.2 x 10² (CFU/ml)
Sediment: 8.3 x 10⁵ (CFU/ml)
Table A7_1_2_1_2-2: Test system
Criteria Details
Culturing apparatus Glass Erlenmeyer flask (1000 or 250 ml) fitted with a glass Dreschel cap containing inlet and outlet ports for nitrogen exchange.
Number of replicates/concentration 14
Measuring equipment For each test vessel, one Tenax® trap was used to collect the volatile products in series with two sodium hydroxide traps designed to collect 14C-carbon dioxide
Oxidation reduction indicator No
Table A7_1_2_1_2-3: Test conditions
Criteria Details
Composition of medium To promote microbial oxygen consumption and maintain an anaerobic environment, test vessels were flooded with 400 ml (1 litre test systems) or 100 ml (250 ml test systems) of a 1% glucose/canal water solution.
Additional substrate No
Solvent No
Preparation of medium Each test vessel was covered with aluminium foil and incubated in an environmental chamber kept at 25 ± 1 °C.
Test temperature Not specified
pH 7.96
Suspended solids concentration < 0.002 mg/l
Other relevant criteria Each sample was swirled after dosing
Document IIIA
Baker Petrolite ACROLEIN December 2005
Section A7.1.3 Adsorption test
Annex Point IIA 7. 7
Official 1 REFERENCE use only
1.1 Reference !twin, K (1988) Soil Adso1ption Coefficient for Acrolein (Magnacide®Herbicide and Magnacide®B Microbiocide). SRl Itttemational. SRl Project No. 3562-2.
1.2 Data protection Yes
1.2.1 Data owner Baker Petrolite
1.2.2 Criteria for data Data on new a.s for first entty to Annex I protection
2 GUIDELINES AND QUALITY ASSURANCE
2.1 Guideline study Yes
FIFRA No. 163-1
2.2 GLP Yes
2.3 Deviations No
3 MATERIALS AND METHODS
3.1 Test material As given in Section 2 x 3.1.1 Lot/Batch number NN-481-76
3.1.2 Specification As given in Section 2 x 3.1.3 Purity See 3.1.2.
3.1.4 Further relevant The test material will hydrolyse in water as well as polymerise in the x properties presence of light. The test was conducted in 24 holll's to minimise these
effects
3.1.5 Method of analysis Acrolein concentt·ation was detennined by either ultraviolet absorption x spectt·oscopy or HPLC analysis. The absorbance was measlll'ed in a 1 cm cuvette with a Beckman DU-2 spectrophotometer at 209 run. A stock solution of Acrolein was prepared by pippetting 100 µl of Acrolein into 500 ml of argon-sparged deionised water. Serial dilutions of the stock solutions were prepared to generate the calibration curve from absorbance versus concentration. Dilutions of so1p tion samples and the calibration solutions were prepared in 10 ml flask to give a final concentration less than 5 mg per litt·e Acrolein. Additional samples were prepared in the same manner using O.OlM cakimn sulphate solution. The calibration curve was detennined from single detenninations at five concentrations for both the deionised water and calcium sulphate solutions.
HPLC conditions:
Ittstnunent Waters model 6000A liquid chromatograph
Mobile phase 30% acetonitrile/70% water
Flow rate 1 ml/min
Ittjection size 5 µl
Colmnn Cl8
Since Acrolein 1111dergoes hydration in water, the Acrolein solutions used in the so1ption experiments were analysed before and after the so1ption equilibration period. Duplicate injections of the solutions gave reproducible results ( <l % ), therefore it was necessary to analyse. the
Document IIIA
Baker Petrolite ACROLEIN December 2005
Section A7.1.3 Adsorption test
Annex Point IIA 7. 7
sample as soon as possible.
3.2 Degradation No. x products
3.2. l Method of analysis for degradation products
3.3 Reference None. substance
3.3.1 Method of analysis for reference substance
3.4 Soil types see table A 7 1 3-1 x 3.5 Testing p rocedure
3.5. 1 Test system To prevent volatilisation of Acrolein, experiments were conducted with x Turlock soil using continuous-flow frontal analysis. The soil column (4 nun i.d. stainless steel, 8 cm long) was packed with l .6g of autoclaved Turlock soil between silanised glass wool and 5µ stainless steel frits. The colunm was conditioned with deionised water to remove water-soluble lea.chates.
3.5.2 Test solution and x Test conditions
3.6 Test pel"formance
3.6. 1 Preli.minruy test No.
3.6.2 Screening test: No. Adsorption
3.6.3 Screening test: x Desorption
3.6.4 HPLC-method A Waters LC system which includes a. WISP 710B autosampler, the Programmable System Controller and Data Module, and Model 450 Variable Wavelength Detector was used. The flow rate was l mL/min and injection size was 5µL.
3.6.5 Other test
4 RESULTS
4.1 Preliminary test
4.2 Screening test: x Adsorption
4.3 Screening test: x Desorption
4.4 Calculations
4 .4 .l Ka. , Kd .Ka 0.14 to 1.26 mL/g
4 .4.2 Kaoc , Kdoc Kaoc 50 to 270 mL/g
4.5 Degradation x product(s)
Document IIIA
Baker Petr olite ACROLEIN December 2005
Section A7.1.3 Adsorption test
Annex Point IIA 7. 7
5 APPLICANT'S SUMMARY AND CO NCL USION
5.1 M aterials and The study was conducted according to FIFRA Guideline No. 163-1. x method s The soil or sediment samples were weighed into 25 ml corex centrifuge
tubes with Teflon-lined caps. The tubes were then filled to a zero headspace with six dilutions of the aqueous Acrolein solution. Appropriate soil and solution blanks at each concentration were iun simultaneously with the sorption samples. The samples were equilibrated with end-over-end- mixing in a 25°C temperature-controlled air bath for four hours. Following equilibration, the samples were centrifuged at 25°C and 10,000 rpm for 20 minutes. TI1e initial and final Acrolein concentrations in the solution phase were detennined using either absorbance measurements at 209 run, or HPLC analysis. TI1e concentration of Acrolein on the soil or sediment was calculated from the difference between the equilibrium concentration of tubes with sorbent and the appropriate solution blank.
A continuous-flow frontal analysis was used, the Acrolein solution or deionised water were percolated through the column at a constant flow rate (5.0 ml/min) with two HPLC syringe pumps coru1ected to the column by four-way valve. The effluent flowed directly into a variable wavelength detector at 209 lllll. A computer program was used to integrate the areas above the breakthrough and elution curves and to calculate the amorn1ts adsorped and desorbed.
5.2 Results and Acrolein adso1ption on autoclaved Turlock soil was too small to measure x discu ssion using batch adso1ption measurements. In two sets of experiments the
average changes in the aqueous concentration without soil were 22% and 14.5%, whereas in sample with soil the average changes were 21 % and 13.5% respectively.
5.2 .l Adsorbed a.s. [%] x 5.2 .2 Ka Ranging between 0.14 and 1.26 mL/g x 5.2 .3 K.i
5.2.4 Kaoc Ranging between 50 and 270 mL/g x 5.2 .5 Ka./Kd
5.2 .6 Degradation x products (% of a.s.)
5.3 Conclusion The higher Koc values and the irreversible s01ption of Acrolein suggest x that Acrolein specifically interacts with substrate mineral and organic carbon functional groups. The measured Kp values are insufficient to estimate Acrolein mobility through soils. So1ption in-eversibility, hydration, biotransfo1mation and volatilization are expected to significantly retard the high infilitration rates of Acrolein estimated from these low Kp values
5.3.1 Reliability 2
5.3.2 Deficiencies Yes . There are no desorbent values .
Document IIIA
Baker Petr olite
Section A7.1.3
Annex Point IIA 7. 7
Date
Materials and Methods
ACROLEIN
Adsorption test
Evaluation by Competent Authorities
Use separate "evaluation boxes" to provide transparency as to the comments and views submitted
EVALUATION BY RAPPORTEUR MEMBER STATE
2 1104/2006
December 2005
The study report provided was poorly summarised but all relevant raw data and results were presented. The Applicant's evaluation of the available data was not adequate. However, the UKCA has reproduced essential results below where relevant to demonstrate that the study provided should be considered adequate for risk assessment pmposes .
The Applicant's version is unclear, the following additional points should be noted;
3.1 & 3.1.2 The purity (96.17 %) and specification repo1ted in the study is very similar but not identical to that given in A2 (refers to Appendix XI Confidential data) . However, the UK CA is confident that the study is valid for this endpoint.
3.1.4 There is no reference in the study for the statement 'It is also known that Acrolein will polymerize in the presence of light' . There is no evidence to suppo1t this statement in any of the photolytic degradation studies (DOC IIIA, 7 .1.3 and 7 .1.1 .1.2), therefore it should be removed
3.2 Identification of degradation products was not perfo1med.
3.4 Table A7 _ 1_3-l refers to 4 soils being used in the study; 1, 2, 3 and 4, which are refeffed to in the study as EP A-6 sediment, Trnfock soil, Phoenix soil and Menlo Park soil respectively,
3.5.1 and 5.1 The summa1y infonnation provided is unclear. This study was caffied out in 2 paits. Firstly, partition coefficients were investigated for 3 soils and 1 sediment using 25 ml centrifuge tubes (as detailed under 5.1) . Then in order to investigate the impact of volatilisation on the results from the primary test, the adso1ption of acrolein was investigated further using continuous-flow frontal analysis for soil 2 (Turlock soil). See point 3.5. l in slllllinaty for futther details.
The Applicant's srnrunaiy and the study repo1t state that the study was conducted to FIFRA Guideline No. 163-1. However, neither the study nor the summa1y states that the soil was aged under aerobic conditions prior to the test beginning. This is a requirement stated in EPA guideline 163-1. The soil column dimensions do not match those recommended by EPA guideline 163-1. The guideline states ' the colmru1 should be from 30 to 300 cm in height ' not 8 cm as used for the continuous-flow frontal analysis.3.6.3 No details were given in the repo1t but results of batch deso1ption analysis were discussed (see 4.3 below).
Document IIIA
Baker Petrolite ACROLEIN December 2005
Section A7.1.3 Annex Point IIA7.7
Adsorption test
Results and discussion
3.5.2 Details of test conditions are provided below; a) Batch adsorption analysis The experiment was carried out using end-over mixing at 25°C for 4 hours.
Number of replicates
Sample Soil No soil
Mean sorbent
conc. (±SD) (g/ml)
Acrolein conc.
(initial min – max range)
Soil 1 (EPA-6 sediment)
10 12 0.18 (±0.003) 48 - 241
Soil 2 (Turlock soil)
9 7 0.33 (±0.01) 64 - 250
Soil 3 (Phoenix soil)
6 6 0.38 (±0.02) 2.8 - 97
Soil 4 (Menlo Park soil)
11 11 0.22 (±0.13) 4.22 – 96.5
b) Continuous flow sorption experiment with soil 2 (Turlock soil)
Experimental Conditions
Temperature 25°C
Mass of soil 1.6257 g
Column dimensions 4 mm (internal diam.), 8 cm long
Solute 0.002 M CaSO4
Flow rate 0.5 mL/min
Detector Waters model 450 at 209 nm
The Applicant’s version is unacceptable and should be replaced by the following UK CA evaluation of available data; 4.3 The study report states that in batch desorption studies no acrolein was desorbed from the soil. 4.2, 5.2, 5.2.1, 5.2.2 & 5.2.4 The mean percentage adsorption/loss estimated from the difference between initial and final acrolein concentrations both with and without (blanks) the influence of soil have been calculated by the UK CA and are presented in the following Table;
Soil 4 (Menlo Park soil) 29.0 (±13.3) 9.9 (±11.0) 19.0 * - Turlock soil, greater losses were recorded for the blank solutions than those with soil.
Acrolein adsorption on autoclaved Turlock soil was too small to measure using batch adsorption measurements and the mean changes in the aqueous acrolein concentration without soil (blanks) were not significantly different from those with soil. For the remaining 3 soils there were small but significant differences between the with and without soil (blank) samples and adsorption coefficients were calculated. The following table presents the available regression parameters for the batch adsorption isotherms:
Sample Kp (slope) ±SD Corr.
Coeff. % OC Koc
Soil 1 (EPA-6 sediment)
0.93 0.05 0.99 0.72 130
Soil 3 (Phoenix soil)
0.73 0.03 0.99 0.27 270
Soil 4 (Menlo Park soil)
1.26 0.1 0.94 2.67 51
For the additional experiments using soil 2 (Turlock soil) with a continuous frontal flow sorption technique, the Kp and Koc for acrolein were estimated to be 0.14 (± 0.03) mL/g and 52 mL/g. 4.5 and 5.2.6 From the available HPLC analysis data it would suggest that where degradation products were detected (additional peaks to acrolein) the levels were too small for quantification. Therefore, these metabolites would be less than 10 % of the applied parent compound and not of concern for the risk assessment. The Applicant’s version is not acceptable for the following reasons; 5.3 There was no evidence presented to support that the Acrolein interacted with substrate mineral and carbonyl functional groups under the conditions tested. The study and Applicant’s summary was centred on the fact that the experimental Kp values being higher than those predicted, and no desorption could be detected. However, the data presented for the range of soils tested do not suggest adsorption is a main route of removal for acrolein. In addition, the available analytical data does not suggest that there are significant quantities of soluble metabolites formed. Therefore, volatilisation of acrolein or its metabolites from the system cannot be dismissed as supported by the improved adsorption data using the continuous flow technique for soil 2.
Baker Petrolite ACROLEIN December 2005
Section A7.1.3 Annex Point IIA7.7
Adsorption test
Reliability
The UK CA has concluded from the data presented in the study report that acrolein has a strong tendency to remain in the aquatic phase, removal from which is likely to be predominantly via volatilisation or biodegradation. 2
Acceptability Acceptable
Remarks All endpoints addressed in the summary have been checked against those in the study. Although the information was poorly presented both in the original study and the Applicant’s summary (e.g. tables A7_1 _3-2, A7_1 _3-3 and A7_1 _3-4 included, but not completed), the available raw data in the study has enabled the UK CA to evaluate this endpoint thoroughly. The UK CA has concluded that the overall endpoint is sufficiently robust for the risk assessment of acrolein considering its use is limited as a slimicide for offshore oil drilling. However, should acrolein be proposed for use where direct application/release to soil is expected, additional data to address soil mobility would be required.
COMMENTS FROM ...
Date Give date of comments submitted
Materials and Methods Discuss additional relevant discrepancies referring to the (sub)heading numbers and to applicant's summary and conclusion. Discuss if deviating from view of rapporteur member state
Results and discussion Discuss if deviating from view of rapporteur member state
Conclusion Discuss if deviating from view of rapporteur member state
Reliability Discuss if deviating from view of rapporteur member state
Acceptability Discuss if deviating from view of rapporteur member state
Remarks
Document IIIA
Baker Petrolite ACROLEIN December 2005
Table A7_1 _3-1: Classification and physico-chemical properties of soils used as adsorbents
Concentration of the test solution (show calculation)
Details of the analytical method used:
Method
Recovery rate
Detection limit
Document IIIA
Baker Petrolite ACROLEIN December 2005
Table A7_1 _3-3: Results of screening test - adsorption:
Soil 1 Soil 2 Soil 3
Concentration of test material [mg/l]
After contact of....hours with soil
Correction for blank with soil
Correction for blank without soil
Final corrected concentration [mg/l]
Initial concentration of test solution [mg/l]
Decrease in concentration [mg/l]
Quantity adsorbed [μg]
Quantity of soil [g of oven-dried equivalent]
Quantity adsorbed [μg] per gram of soil
Test material adsorbed [%]
Temperature [°C]
Volume of solution recovered after centrifugation [ml]
Volume of solution not recovered [ml]
Corresponding quantity of test substance [mg]
Table A7_1 _3-4: Results of screening test - desorption:
Soil 1 Soil 2 Soil 3
Temperature [°C]
Concentration in combined washings [mg/l]
Corresponding quantity of test material [mg]
Quantity desorbed [μg]
[%] of adsorbed test material, which is desorbed
[%] of adsorbed test material, which is not desorbed
Document IIIA
Baker Petr olite ACROLEIN Dec.ember 2005
Section A7.1.3 Adsorption/desorption screening test Annex Point HA VIl.7. 7
JUSTIFICATION FOR NON-SUBMISSION OF DATA Offid al use only
' Other existing data [ x I Tec.hnic.ally not feasible [ I Sc.ientific.ally unjustified [ )
Limited exposure [ I O ther justification [ )
Detailed justific.ation: A screening study is not required as a detennination of abs01ption in soil has been pe1fo1med. See section IIIA7.3.l.
Under taking of intended data submission [ I
Evaluation by Competent Authorities
Use separate "evaluation boxes" to provide transparency as to the comments and views submitted
EVALUATION BY RAPPORTE UR MEMBE R STATE
Date 18/05/2006
Evaluation of applicant's The Applicant 's justification is acceptable justification
Conclusion Acceptable
Remar ks
COMMENTS FROM OTHER MEMBE R STATE (specify)
Date Give date of comments submitted
E valuation of applicant's Discuss if deviating from view of rapporteur member state justification
Conclusion Discuss if deviating from view of rapporteur member state
Remarks
Docmnent IIIA
Baker Petrolite ACROLEIN December 2005
Section A7.1.3 Adsorption test
Annex Point IIA7.7
Official 1 REFERENCE use only
1.1 Refer ence Itwin, K (1988) Soil Adso1ption Coefficient for Acrolein (Magnacide®Herbicide and Magnacide®B Microbiocide). SRI International. SRI Project No. 3562-2.
1.2 Data protection Yes
1.2.l Data owner Baker Petrolite
1.2.2 Criteria for data Data on new a.s for first entry to Annex I protection
2 GUIDELINES AND QUALITY ASSURANCE
2.1 G uideline study Yes
FIFRA No. 163-1
2.2 GLP Yes
2.3 Deviations No
3 MAT ERIALS AND METHODS
3.1 Test material As given in Section 2 x 3.1.1 Lot/Batch number NN-481 -76
3.1.2 Specification As given in Section 2 x 3.1.3 Purity See 3.1.2.
3.1.4 Fmiher relevant The test material will hydrolyse in water as well as polymerise in the x prope1ties presence of light. The test was conducted in 24 hours to minimise these
effects
3.1.5 Method of analysis Acrolein concentration was detennined by either ultraviolet abso1ption x spe.ctroscopy or HPLC analysis. The absorbance was measured in a lcm cuvette with a Beckman DU-2 spectrophotometer at 209 lllll. A stock solution of Acrolein was prepared by pippetting 100 ~d of Acrolein into 500 ml of argon-sparged deionised water. Serial dilutions of the stock solutions were prepared to generate the calibration curve from absorbance versus concentration. Dilutions of sorption samples and the calibration solutions were prepared in 10 ml flask to give a final concentration less than 5 mg per litre Acrolein. Additional samples were prepared in the same manner using O.OlM calcium sulphate solution. The calibration curve was detennined from single detenninations at five concentrations for both the deionised water and calcium sulphate solutions.
HPLC conditions:
Instnunent Waters model 6000A liquid chromatograph
Mobile phase 30% acetonitrile/70% water
Flow rate I ml/min
Injection size 5 µ1
Column Cl8
Since Acrolein undergoes hydration in water, the Acrolein solutions used in the sorption experiments were analysed before and after the sorption equilibration period. Duplicate injections of the solutions gave reproducible results (<I%), therefore it was necessary to analyse the
Document IIIA
Baker Petrolite ACROLEIN December 2005
Section A7.1.3 Adsorption test
Annex Point IIA7.7
sample as soon as possible.
3.2 Degradation No. x products
3.2.l Method of analysis for degradation products
3.3 Reference None. substance
3.3.1 Method of analysis for reference substance
3.4 Soil types see table A 7 1 - 3-1 x 3.5 Testing procedure
3.5.1 Test system To prevent volatilisation of Acrolein, experiments were conducted with x Turlock soil using continuous-flow frontal analysis. The soil column (4 mm i.d. stainless steel, 8 cm long) was packed with l .6g of autoclaved Tmfock soil between silanised glass wool and 5 ~1 stainless steel frits. The column was conditioned with deionised water to remove water-soluble 1 ea.cha tes .
3.5.2 Test solution and x Test conditions
3.6 Test perfo1·mance
3.6.1 Preliminary test No.
3.6.2 Screening test: No. Adso1ption
3.6.3 Screening test: x Deso1ption
3.6.4 HPLC-method A Waters LC system which includes a WISP 710B autosampler, the Programmable System Controller and Data Module, and Model 450 Variable Wavelength Detector was used. The flow rate was lmL/min and injection size was 5µL.
3.6.5 Other test
4 RESULTS
4.1 Preliminary test
4.2 Screening test: x Adso1·ption
4.3 Screening test : x Deso1·ption
4.4 Calculations
4.4.l Ka. , Kd .Ka. 0. 14 to 1.26 mL/g
4.4.2 Kaoc , K<loc Kaoc 50 to 270 mL/g
4.5 Degradation x product(s)
Document IIIA
Baker Petrolite ACROLEIN December 2005
Section A7.1.3 Adsorption test
Annex Point IIA7.7
5 APPLICANT'S SUMMARY AND CONCLUSION
5.1 Materials and The study was conducted according to FIFRA Guideline No. 163-1. x methods The soil or sediment samples were weighed into 25 ml corex centrifuge
tubes with Teflon-lined caps. The tubes were then filled to a zero headspace with six dilutions of the aqueous Acrolein solution. Appropriate soil and solution blanks at each concentration were mn simultaneously with the sotption samples. The samples were equilibrated with end-over-end- mixing in a 25°C temperature-controlled air bath for four hours. Following equilibration, the samples were centrifuged at 25°C and 10,000 1pm for 20 minutes. The initial and final Acrolein concentrations in the solution phase were detennined using either absorbance measurements at 209 nm, or HPLC analysis. The c.oncentration of Acrolein on the soil or sediment was calculated from the difference between the equilibrium concentration of tubes with sorbent and the appropriate solution blank.
A continuous-flow frontal analysis was used, the Acrolein solution or deionised water were percolated through the column at a constant flow rate (5.0 ml/min) with two HPLC syringe pumps connected to the colUlllll by four-way valve. The effluent flowed directly into a variable wavelength detector at 209 run. A computer program was used to integrate the areas above the breakthrough and elution curves and to calculate the amounts adsorped and desorbed.
5.2 Results and Acrolein adsorption on autoclaved Turlock soil was too small to measure x discussion using batch adsorption measmements. In two sets of experiments the
average changes in the aqueous concentration without soil were 22% and 14.5%, whereas in sample with soil the average changes were 21 % and 13.5% respectively.
5.2.1 Adsorbed a.s. [%] x 5.2.2 Ka Ranging between 0.14 and 1.26 mL/g x 5.2.3 K.i
5.2.4 Kaoc Ranging between 50 and 270 mL/g x 5.2.5 Ka/Kd
5.2.6 Degradation x products (% of a.s.)
5.3 Conclusion The higher Koc values and the itTeversible so1ption of Acroleit1 suggest x that Acrolein specifically interacts with substrate mit1eral and organic carbon functional groups. The measmed Kp values are insufficient to estitna.te Acrolein mobility through soils. Sorption irreversibility, hydration, biotransfonnation and volatilization are expected to significantly retard the high infilitration rates of Acrolein estimated from these low Kp values
5.3.1 Reliability 2
5.3.2 Deficiencies Yes. There are no desorbent values.
Document IIIA
Baker Petrolite
Section A7.1.3
Annex Point IIA7.7
Date
Materials and Methods
ACROLEIN
Adsorption test
Evaluation by Competent Authorities
Use separate "evaluation boxes" to provide transparency as to the comments and views submitted
EVALUATION BY RAPPORTEUR MEMBER STATE
21/04/2006
December 2005
The study report provided was poorly summarised but all relevant raw data and results were presented. The Applicant's evaluation of the available data was not adequate. However, the UK.CA has reproduced essential results below where relevant to demonstrate that the study provided should be considered adequate for risk assessment pmposes.
The Applicant's version is unclear, the following additional points should be noted;
3.1 & 3.1.2 The purity (96.17 %) and specification repo1ted in the study is very similar but not identical to that given in A2 (refers to Appendix XI Confidential data). However, the UK CA is confident that the study is valid for this endpoint.
3.1.4 There is no reference in the study for the statement 'It is also known that Acrolein will polymerize in the presence of light' . There is no evidence to support th.is statement in any of the photolytic degradation studies (DOC IIIA, 7.1.3 and 7 .1.1.1.2), therefore it should be removed
3.2 Identification of degradation products was not perfonned.
3.4 Table A7 _ 1_3-l refers to 4 soils being used in the study; 1, 2, 3 and 4, which are refen-ed to in the study as EPA-6 sediment, Turlock soil, Phoenix soil and Menlo Park soil respectively,
3.5.1 and 5.1 The sW'llillary infom1ation provided is unclear. This study was carried out in 2 paits. Firstly, partition coefficients were investigated for 3 soils ai1d 1 sediment using 25 ml centi·ifuge tubes (as detailed under 5.1). Then in order to investigate the impact of volatilisation on the results from the primaiy test, the adso1ption of acrolein was investigated futther using continuous-flow frontal analysis for soil 2 (Twfock soil) . See point 3.5.1 in SW'llilla1y for further details. The Applicant's summa1y and the study report state that the study was conducted to FIFRA Guideline No. 163-1. However, neither the study nor the swnmary states that the soil was aged under aerobic conditions prior to the test beginning. This is a requirement stated in EPA guideline 163-1.The soil column dimensions do not match those recommended by EPA guideline 163-1. The guideline states 'the colwnn should be from 30 to 300 cm in height' not 8 cm as used for the continuous-flow frontal analysis.3.6.3 No details were given in the report but results of batch deso1ption analysis were discussed (see 4.3 below).
Document IIIA
Baker Petrolite ACROLEIN December 2005
Section A7.1.3 Annex Point IIA7.7
Adsorption test
Results and discussion
3.5.2 Details of test conditions are provided below; a) Batch adsorption analysis The experiment was carried out using end-over mixing at 25°C for 4 hours.
Number of replicates
Sample Soil No soil
Mean sorbent
conc. (±SD) (g/ml)
Acrolein conc.
(initial min – max range)
Soil 1 (EPA-6 sediment)
10 12 0.18 (±0.003) 48 - 241
Soil 2 (Turlock soil)
9 7 0.33 (±0.01) 64 - 250
Soil 3 (Phoenix soil)
6 6 0.38 (±0.02) 2.8 - 97
Soil 4 (Menlo Park soil)
11 11 0.22 (±0.13) 4.22 – 96.5
b) Continuous flow sorption experiment with soil 2 (Turlock soil)
Experimental Conditions
Temperature 25°C
Mass of soil 1.6257 g
Column dimensions 4 mm (internal diam.), 8 cm long
Solute 0.002 M CaSO4
Flow rate 0.5 mL/min
Detector Waters model 450 at 209 nm
The Applicant’s version is unacceptable and should be replaced by the following UK CA evaluation of available data; 4.3 The study report states that in batch desorption studies no acrolein was desorbed from the soil. 4.2, 5.2, 5.2.1, 5.2.2 & 5.2.4 The mean percentage adsorption/loss estimated from the difference between initial and final acrolein concentrations both with and without (blanks) the influence of soil have been calculated by the UK CA and are presented in the following Table;
Soil 4 (Menlo Park soil) 29.0 (±13.3) 9.9 (±11.0) 19.0 * - Turlock soil, greater losses were recorded for the blank solutions than those with soil.
Acrolein adsorption on autoclaved Turlock soil was too small to measure using batch adsorption measurements and the mean changes in the aqueous acrolein concentration without soil (blanks) were not significantly different from those with soil. For the remaining 3 soils there were small but significant differences between the with and without soil (blank) samples and adsorption coefficients were calculated. The following table presents the available regression parameters for the batch adsorption isotherms:
Sample Kp (slope) ±SD Corr.
Coeff. % OC Koc
Soil 1 (EPA-6 sediment)
0.93 0.05 0.99 0.72 130
Soil 3 (Phoenix soil)
0.73 0.03 0.99 0.27 270
Soil 4 (Menlo Park soil)
1.26 0.1 0.94 2.67 51
For the additional experiments using soil 2 (Turlock soil) with a continuous frontal flow sorption technique, the Kp and Koc for acrolein were estimated to be 0.14 (± 0.03) mL/g and 52 mL/g. 4.5 and 5.2.6 From the available HPLC analysis data it would suggest that where degradation products were detected (additional peaks to acrolein) the levels were too small for quantification. Therefore, these metabolites would be less than 10 % of the applied parent compound and not of concern for the risk assessment. The Applicant’s version is not acceptable for the following reasons; 5.3 There was no evidence presented to support that the Acrolein interacted with substrate mineral and carbonyl functional groups under the conditions tested. The study and Applicant’s summary was centred on the fact that the experimental Kp values being higher than those predicted, and no desorption could be detected. However, the data presented for the range of soils tested do not suggest adsorption is a main route of removal for acrolein. In addition, the available analytical data does not suggest that there are significant quantities of soluble metabolites formed. Therefore, volatilisation of acrolein or its metabolites from the system cannot be dismissed as supported by the improved adsorption data using the continuous flow technique for soil 2.
Baker Petrolite ACROLEIN December 2005
Section A7.1.3 Annex Point IIA7.7
Adsorption test
Reliability
The UK CA has concluded from the data presented in the study report that acrolein has a strong tendency to remain in the aquatic phase, removal from which is likely to be predominantly via volatilisation or biodegradation. 2
Acceptability Acceptable
Remarks All endpoints addressed in the summary have been checked against those in the study. Although the information was poorly presented both in the original study and the Applicant’s summary, the available raw data in the study has enabled the UK CA to evaluate this endpoint thoroughly. The UK CA has concluded that the overall endpoint is sufficiently robust for the risk assessment of acrolein considering its use is limited as a slimicide for offshore oil drilling. However, should acrolein be proposed for use where direct application/release to soil is expected, additional data to address soil mobility would be required.
COMMENTS FROM ...
Date Give date of comments submitted
Materials and Methods Discuss additional relevant discrepancies referring to the (sub)heading numbers and to applicant's summary and conclusion. Discuss if deviating from view of rapporteur member state
Results and discussion Discuss if deviating from view of rapporteur member state
Conclusion Discuss if deviating from view of rapporteur member state
Reliability Discuss if deviating from view of rapporteur member state
Acceptability Discuss if deviating from view of rapporteur member state
Remarks
Document IIIA
Baker Petrolite ACROLEIN December 2005
Table A7_1 _3-1: Classification and physico-chemical properties of soils used as adsorbents
Concentration of the test solution (show calculation)
Details of the analytical method used:
Method
Recovery rate
Detection limit
Document IIIA
Baker Petrolite ACROLEIN December 2005
Table A7_1 _3-3: Results of screening test - adsorption:
Soil 1 Soil 2 Soil 3
Concentration of test material [mg/l]
After contact of....hours with soil
Correction for blank with soil
Correction for blank without soil
Final corrected concentration [mg/l]
Initial concentration of test solution [mg/l]
Decrease in concentration [mg/l]
Quantity adsorbed [μg]
Quantity of soil [g of oven-dried equivalent]
Quantity adsorbed [μg] per gram of soil
Test material adsorbed [%]
Temperature [°C]
Volume of solution recovered after centrifugation [ml]
Volume of solution not recovered [ml]
Corresponding quantity of test substance [mg]
Document IIIA
Baker Petrolite ACROLEIN December 2005
Table A7_1 _3-4: Results of screening test - desorption:
Soil 1 Soil 2 Soil 3
Temperature [°C]
Concentration in combined washings [mg/l]
Corresponding quantity of test material [mg]
Quantity desorbed [μg]
[%] of adsorbed test material, which is desorbed
[%] of adsorbed test material, which is not desorbed
Document IIIA
Baker Petr olite ACROLEIN Dec.ember 2005
Section A7.1.4 Further studies on adsorption and desorption in Annex Point IIIA water/sediment systems and, where r elevant, on the XIl.2.2 adsorption and desorption of metabolites and
degradation products where the preliminary risk assessment indicates that it is necessary
JUSTIFICATION FOR NON-SUBMISSION OF DATA Official use only
O ther existing data [ l Tec.hnic.ally not feasible [ l Sc.ien tific.ally unjustified [ X ]
Limited exposure [ l Other justification [ ]
Detailed justification: RadiolabeUed studies on the degradation of the active substance and its metabolites in water and sediment have been perfonned with abs01ption/ desotp tion studies in sediment (Section IIIA 7 .1.2 .1.1 , IIIA7. l.2.1.2). Further studies on ads01ption and desorption in water/sediment systems and on the adso1p tion and deso1ption of metabolites and degradation products, are not considered to be necessary.
Under taking of intended data submission [ l
• Evaluation by Competent Authorities
Use separate "evaluation boxes" to provide transparency as to the comments and views submitted
EVALUATION BY RAPPORTE UR MEMBER STATE
Date 18/05/2006
Evaluation of applic.ant 's The Applicant's justification is acceptable justification
Conclusion Acceptable
Remarks
COMMENTS FROM OTHER MEMBER STATE (specify)
Date Give date of comments submitted
Evaluation of applicant's Discuss if deviating from view of rapporteur member state justification
Conclusion D;scuss if deviating fl-om view of rapporteur member state
Remarks
Document IIIA
Baker Petrolite ACROLEIN Dec.ember 2005
Section A7.1.4.1 Field study on accumulation in the sediment Annex Point IIIA XIl.2.1
JUSTIFICATION FOR NON-SUBMISSION OF DATA Official use only
Other existing data ( l Technic.ally not feasible ( l Sdentific.ally unjustified ( X ]
Limited exposure ( l Other justification ( ]
Detailed justification: Further studies on accumulation in the sediment are not considered necessaiy as the active substance has been shown to be easily dissimilated in a ready biodegradation study (Section A 7 .1.1.2 .1, Annex Point IIA, VIl.7.6.1.1.). In addition the active substance has been shown to tmdergo rapid degradation by physico-chemical processes including rapid volatilisation (A7.2. l) and photodegradation (A 7.1.1.1.2) and microbial degradation in water (anaerobic and aerobic freshwater-sediment radio-labelled studies, A7. l.2. l.1 and A7. l.2.1.2) transfonning the active substai1ce to C02.
Under taking of intended data submission ( l
Evaluation by Competent Authorities
Use separate "evaluation boxes" to provide transparency as to the comments and views submitted
EVALUATION BY RAPPORTEUR MEMBER STATE
Date 18/05/2006
Evaluation of applicant's The Applicant's justification is acceptable justification
Conclusion Acceptable
Remarks
COMMENTS FROM OTHER MEMBER STATE (specify)
Date Give date of comments submitted
Evaluation of applicant's Discuss if deviating from view of rapporteur member state justification
Conclusion Discuss if deviating from view of rapporteur member state
Remarks
Doctrment IIIA
Baker Petr olite ACROLEIN December 2005
Section A7.2.1 Fate and behaviour in soil: aerobic degradation in soil
Annex Point IIA7.4, 7.1.1
Official 1 REFERENCE use only
1.1 Referenc.e Chou, T-W. & Spanggord, R.J. (1990) Estimation of the Aerobic Biotransfonna.tion Rates for Acrolein (Magna.cide®H Herbicide, Magna.cide®B Microbiocide) in Soil. SRI International. SRI Project No. 2562-4.
1.2 Data protection Yes
1.2.1 Data. owner Baker Petrolite
1.2.2 Criteria for data. Data. on new a.s. for first entry to Annex I protection
2 GUIDELINES AND QUALITY ASSURANCE
2.1 Guideline study Yes
FIFRA 162-1
2.2 GLP No x No GLP statement
2.3 Deviations No
3 MATERIALS AND METHODS
3.1 Test material As given in Section 2
3.1.1 Lot/Batch number NN-481 -76
3.1.2 Specification As given in Section 2
Deviating from specification given in section 2 as follows
Radiolabelled at the 2 and 3 positions ( acrolein-2,3-14C)
3.1.3 Purity See 3.1.2
3.1.4 Further relevant properties
3.1.5 Method of analysis
3.2 Degradation Degradation products tested: Yes/No x products
3.2.l Method of analysis At various time points, three tubes (one sterile and two non-sterile) were for degradation used, 9.0 ml of acetonitrile (Burdick & Jackson, HPLC grade) added, and products the suspension was vigorously shaken by hand for five minutes. The
tubes were centrifuged at 2500 1pm for 10 minutes and the acetoniti·ile (plus 1.2 ml water originally added) was pipetted into a vial and capped. The soil was transfeITed to a sintered glass funnel, washed with acetone, filtered, and air-dried. The a.cetonitrile extracts were analysed by high-perfo1mance liquid chromatography (HPLC) using the following conditions:
Instnunent: Spectra-Physics Model 8000 Liquid Chromatograph
Column: Regis Hi-Chrom ODS-II column, 4.7 x 250 mm
Document III.A
Baker Petrolite ACROLEIN December 2005
Section A7.2.1 Fate and behaviour in soil: aerobic degradation in soil
Annex Point IIA7.4, 7.1.1
Solvent: Water/ Acetonitrile (80/20)
Flow rate: 1.0 ml/minute
Detectors: UV at 210 nm in series with a Raytest solid-state radioactivity detector
Quantitation was achieved using the extemal standard method relation peak area to pruts per million (ppm) of acrolein injected as detennined from stru1dard calibration curves. Total radioactivity in the extract was detennined by direct counting of a 50 µ1 aliquot diluted in Aquasol scintillation counting liquid.
The soil samples were oxidised using a Packard Model 306 Oxidizer where the sample is combusted and the 14C-cru·bon is conve1ted to 14C-cru·bon dioxide and trapped. The trapped activity is counted in a scintillation counter.
3.3 Reference No substanc.e
3.3.1 Method of analysis Not applicable for reference substance
3.4 Soil types See table A 7 2 1-1
3.5 Testing pl'Ocedure
3.5.1 Test system Studies were performed in 20 x 150 imn Pyrex glass tubes capped with Teflon liners. 36 tubes were prepared by weighing 10.0 g of Phoenix soil into each tube. 0.8ml of deionised water (67% of field capacity) was added to each tube, and the contents were thoroughly mixed with a metal spatula. The tubes were allowed to stru1d at room temperature (20 - 22°C) for seven days to activate microbial populations. 12 tubes were autoclaved for one hour on each of three consecutive days to serve as sterile controls. 0.5 ml of sterile water was added to each sterile tube after autoclaving to re supply the water lost on heating.
3.5.2 Test solution ru1d Biotransformation r ate studies: Test conditions
A stock solution of 14C-acrolein in water was prepared by adding 0.37 ml of the solution (3.3 mCi in 0.5 ml of dimethylfonnamide, fmther diluted to 1.0 ml with acetonitrile) to 29.6 ml of sterilised water (total volume = 30 ml). 0.4 ml of this solution was added to the sterile and non-sterile tubes containing 1 Og of soil, to yield a 10 ppm acrolein spike with respect to the soil [(56 mg/8.9 mCi) x (3.3 mCi x 0.37 ml/30 ml) x 0.4 ml] = 0.10 mg/10 g soil]. This aqueous addition brought the total soil moisture content up to 75% of field capacity. The soil was mixed with a spatula ru1d capped to minimise volatisation.
One sterile and two non-sterile tubes were removed for extraction and analysis at times 0, 2, 4, 8, 48 ru1d 115 hours after application. The study was conducted at 20 - 23°C.
Mineralisation studies:
Conducted in three 250 ml Brut ha biometer flasks. 50 g of soil was added to each flask (three Phoenix soil flasks) and 4.0 ml of deionised water. The soils were thoroughly mixed ru1d allowed to acclimate for seven
Document IIIA
Baker Petrolite
Section A7.2.1
Annex Point IIA7.4, 7.1.1
3.6 Test performance
3.6.1
3.6.2
Identification of products
Analysis of Data
ACROLEIN December 2005
Fate and behaviour in soil: aerobic degradation in soil
days. One flask was autoclaved for one hom each on three consecutive days to serve as a sterile control. To each flask side ann was added 10 ml 0.2M potassium hydroxide solution to trnp evolved carbon dioxide. 2 .0 ml of the aqueous a.crolein stock solution was added to each flask and the contents thoroughly mixed. The potassium hydroxide solution was replaced with fresh solution at Days 2, 6, 13, 20, 27, and 34. A 50 µl aliquot of the potassium hydroxide solution was mixed with 10 ml of Aquasol cotmting solution for scintillation cotmting. A 5.0 ml aliquot was mixed with 5.0 ml of 0.2M barium chloride solution to precipitate carbon dioxide. After centrifuging the pre.cipitate, a 100 ~tl aliquot was mixed with the cotmting solution for scintillation counting. The difference between the potassium hydroxide and barium chloride solution cotmts was attributed to 14C-carbon dioxide.
Products were identified by their co-chromatography with authentic standards or as derivatised products. Two derivatisation procedures were used; One procedure involved the conversion of aldehydes to their pentafluorophenylhydrazones by reaction with pentafluorophenylhydrazine. The derivatives were then analysed be HPLC as described in section 3.2 .1 with the exception that gradient program was used sta1t ing from acetonitrile/water (20/80) for 5 minutes programmed to 100% acetonitrile in five ininutes (six minute hold). The colmnn was re-equilibrated for five minutes with the starting solvent composition. The components, 3-hydroxypropanal penta.fluorophenylhydrazone and acrolein penta.fluorophenylliydrazone eluted at 12.5 and 14.5 mnmtes respectively. To confirm, identifications were performed by gas chromatography/mass spectroscopy using a Ribenna.g R-10-10 GC/MS and a 30 m DB-5 fused silica capillruy temperature programmed from 50 - 200°C
The loss of a.crolein from soil was assumed to a following a first-order reaction shown in Equation 1:
Equation 1
-d[A]/dt = ~[A]
Where:
[A] = Concentration of acrolein
~ = First-order biotransfonnation rate constant
t = time.
Integration of Equation 1 yields Equation 2
Equation 2
In [Ao]/ [AJ = ~t
Where:
[Ao] = Concentration of acrolein at time zero
[ A1] = Concentration at time t.
Other loss processes (irreversible so1ption, hydrolysis and volatilization) are occun·ing to acrolein on soil besides biotransfonnation. The ha.If life
Document IIIA
Baker Petrolite
Section A7.2.1
Annex Point IIA7.4, 7.1.1
3.6.3
3.6.4
4.1
4.2
4.3
Screening test: Desorption
HPLC-method
Preliminary test
Biotrnnsfonnatio n Rate
Products
ACROLEIN December 2005
Fate and behaviour in soil: aerobic degradation in soil
of acrolein in soil due to biotrausfonnation :
tYi = In 2/ki,
Not perfo1med
According to (a)" OECD-HPLC-method": Yes/No
4 RESULTS
The extraction of acrolei.n from low moisture field capacity (unsaturated) soils was poor, with only 75 - 77% recovered after the initial mixing. This is due to both water and acrolein competing for available binding sit.es on the soil. As the water is adsorbed, acrolein is volatilised due to its increased concentration in the aqueous phase, the high soil surface area to liquid ratio, and the mixing of the tube contents.
Acrolein was found to be rapidly lost from both the sterile and non-sterile Phoenix soil reaction tubes . Acrolein was completely gone from the acetonitrile extracts within 8 hours in the non-sterile soils and within 115 hours in the sterile soils. The non-sterile soils followed first-order kinetics. The average rate constant was 0.431 ± 0.08 111·-1
• The sterile soil did not show first-order behaviour, it mimicked that observed for reversible first-order processes up to 48 hours. The average fin t.-order rate constant for the sterile soils was 0.264 ru·-1.
The rate constant for the aerobic soil biotransfo1mation was 0.167 ru·-1,
thus the aerobic soil biotransfo1mation half-life was 4.2 hours. The w1coll'ected half-life of acrolein in soil is approximately 1.4 hours.
Acrol•in Lou In M101>ic SoU
c • .. ~ • u <
,., __ •
:i Q.
2 Q.
0 0 2 • & 10
T'mit{hrs)
Figure 1. Acrolein (ppm) loss as a function of time in Sterile and Nonst.erile soils
Two products were identified;
1. Acrylic acid: - CH2=CH-COOH, fo1m ed in sterile soil, but there was approximately tv.1ice the amotmt in the non-sterile soil. The disappearance rate is similar for both types of soil. This was totally removed after 115 hours in sterile soil.
2 . 3-hydroxypropionic acid: - HO-CHrCHrCOOH, disappears rapidly in the non-sterile soils to where it is non-detectable after
Document IIIA
x
Baker Petrolite ACROLEIN December 2005
Section A7.2.1 Fate and behaviour in soil: aerobic degradation in soil
Annex Point IIA7.4, 7.1.1
48 hours.
3. Carbon dioxide: - fonned rapidly within the seven days and shows a more gradual release up till the tennination of the study.
In the sterile control soil, 3-hydroxypropanal was present as a result from the hydrolysis of acrolein. This was not present in the non-sterile soil.
4.4 M aterial balance The total material balance was 98.3%. The data below show the distribution of activity found in material balance
Sample Activity fow1d (x 10-6dpm)
% of Total
Soil extract 12.5 43.1
Plug extract 2 .87 9.9
Soil 5.66 19.5
Plug 7.98 27.5
4.5 Binding to soil The recove1y of acrolein from soil was low indicating that other loss processes were occwring simultaneously with biotransfonnation. One such process was ineversible binding to the soil. At least 27.5% of the activity readily binds to the soil and is not extracted by acetonitrile, water, or 0.2M sodium hydroxide solution after a 20 1ninute exposure to the soil. In non-sterile soils, the binding of acrolein and products is complete after 8 hours followed by an observed loss of activity with time. The activity botu1d to the soil after 8 homs represents 109% (due to volatilised acrolein adding back to the soil) of the total activity added.
The sterile soil showed less total binding of activity than the non-sterile soils and the activity appeared to remain constant after 8 hours.
4 .5.1 Conversion of soil Carbon dioxide generated from acrolein, acrolein metabolites, and bow1d products acrolein bound to soil was followed as a function of time by measuring
the activity trapped in 0.2M potassiwn hydroxide solution and by precipitating the 14C-carbon dioxide with barium chloride and re.corn1ting the solution.
The majority of the activity was released within several days and approximately 50% of the released activity was carbon dioxide. After six days, the released activity was entirely carbon dioxide and appeared to follow a zero-order release rate upto the end of the study.
Between zero and six days, acrolein and other volatile metabolites that are trapped in 0.2M potassiwn hydroxide are released from soil. This indicates that the ill'eversibly bound acrolein products are converted to carbon dioxide and this transfonnation is biotic.
5 APPLICANT'S SUMMARY AND CONCLUSION
5.1 M aterials and This study was conducted in accordance to FIFRA Guideline No. 162-1. methods Soil biotransfo1mation rate study were performed in 20 x 150 mm Pyrex
glass tubes capped with Teflon liners. 36 tubes were prepared by weighing 10.0 g of Phoenix soil into each tube. 0.8 ml of deionised water (67% of field capacity) was added to each tube, and the contents were thoroughly mixed with a metal spatula. The tubes were allowed to stand
Document IIIA
Baker Petrolite ACROLEIN December 2005
Section A7.2.1 Fate and behaviour in soil: aerobic degradation in soil
Annex Point IIA7.4, 7.1.1
at room temperature (20 - 22°C) for seven days to activate microbial populations. 12 tubes were autoclaved for one hour on each of three consecutive days to serve as sterile controls. 0.5 ml of sterile water was added to each sterile tube after autoclaving to re supply the water lost on heating.
5.2 Results and Acrolein is shot-lived when added to unsaturated soils and its fate will be x discussion controlled by biotransformation, volatilisation and ill'eversible binding to
soil processes.
Free acrolein in soil is readily biotransfonned with a half-life of 4.2 hours. Acrylic acid and 3-hydroxypropionic acid are also readily biotransfonned and are presumably conve1t ed to carbon dioxide with a half-life of29 days.
Acrolein products that are ill'eversibly bound to soil are mineralised to carbon dioxide with an estimated half-life of 410 days. The bound products are not readily extracted from soil since they are not even solubilised by 0.2M sodium hydroxide.
The transformations of acrolein in soil produce polar products that are rapidly consumed (within 48 hours) but at a slower rate than acrolein.
The mechanism by which acrolein ill'eversibly binds to soil in inconclusive, since even the n01mal procedure for removing fulvic and humic acids from soil failed to significantly remove the majority of bound radioactivity. The bound materials are biodegradable and can be mineralised to carbon dioxide.
5.3 Conclusion Biotransformation of acrolein and its abiotic transfo1mation products will occur readily in aerobic soil eventually leading to carbon dioxide. Based on the rapid evolution of carbon dioxide, it appears that soil microbes adapt easily to concentrations above any expected field exposure value. Thus, microbes will play an impo1iant role in the overall persistence of acrolein in soil.
5.3.1 Reliability 1
5.3.2 Deficiencies No
Evaluation by Competent Authorities
Use separate "evaluation boxes" to provide transparency as to tlte comments and views submitted
EVALUATION BY RAPPORTEUR MEMBER STATE
Date 16/07/2007
The Applicant's version is considered acceptable, noting the following;
2.2 There is no ce1i.ificate of GLP, which has been noted by the applicant.
M atel'ials and Methods The Applicant's version is considered acceptable, noting the following;
3.2 Should read 'Degradation products tested: Yes'
3.6.4 Should read 'According to (a) "OECD-HPLC-method": Yes'
Document IIIA
Baker Petrolite ACROLEIN December 2005
Section A7.2.1
Annex Point IIA7.4, 7.1.1
Fate and behaviour in soil: aerobic degradation in soil
Results and discussion The Applicant’s version is considered acceptable, noting the following:
5.2 The first line states: ‘Acrolein is shot-lived when added….’, this is a spelling error and should be replaced with ‘Acrolein is short-lived when added…’.
The Applicant has not discussed the issue of volatilisation from the initial soil samples. Data presented in the study show that approximately 50 % of the applied radioactivity (AR) was recovered in the NaOH traps but that only 35 % of this was CO2. Data available in the study also suggests that the bound fraction within the soil was approximately 30 % radioactive residues by the end of the study (115 h).
Although the Applicant identified 2 main metabolites, these were not quantified. Acrylic acid exceeded 10 % of the AR after 4 hours with a mean peak of 14.7 % AR recorded at 48 hours in non-sterile soil. By 115 hours no acrylic acid was detected in either the sterile or non-sterile soils tested. The second degradation product discussed by the applicant, 3-hydroxypropionic acid did not exceed a mean of 10 % AR under non-sterile soil with a maximum peak value of 9.4 % AR reported after 2 hours, which declined to zero by 48 hours. This is therefore not a substance for concern in the risk assessment.
Conclusion The Applicant’s version is considered acceptable.
Reliability 2
Acceptability Acceptable
The reliability factor has been changed to 2 because there is no certificate of GLP (This has been noted by the Applicant). However, it should be noted that the study was started in 1989, which is the year in which GLP use began, hence GLP certification may not have been readily available at this time. The UKCA believes that the data reported in the study are sufficiently robust for risk assessment.
Remarks All endpoints and data presented in the summary have been checked against the original study and are correct.
The UK CA notes that the Applicant has included uncompleted tables within the study summary (A7_2 _1-3, A7_2 _1-4, A7_2 _1-2). This will not affect the reliability factor of the study.
COMMENTS FROM ...
Date Give date of comments submitted
Materials and Methods Discuss additional relevant discrepancies referring to the (sub)heading numbers and to applicant's summary and conclusion. Discuss if deviating from view of rapporteur member state
Results and discussion Discuss if deviating from view of rapporteur member state
Conclusion Discuss if deviating from view of rapporteur member state
Reliability Discuss if deviating from view of rapporteur member state
Acceptability Discuss if deviating from view of rapporteur member state
Remarks
Document IIIA
Baker Petrolite ACROLEIN December 2005
Table A7_2 _1-1: Classification and physico-chemical properties of soils used as adsorbents
Soil 1
Soil identification Pheonix
Classification Sandy loam
Location Cotton field located at S.32nd Street in Phoenix, Arizona, USA
Sand [%] 61.4
Silt [%] 24.6
Clay [%] 14.0
Organic matter [%] 0.4
pH (1:1 H2O) 7.9
Cation exchange capacity (MEQ/100 g) 9.1
Table A7_2 _1-2: Results of preliminary test:
Test substance
Sample purity
Weighed soil
Volume of CaCl2 solution
Nominal concentration of a.s. final solution
Analytical concentration final of a.s. solution
Concentration of the test solution (show calculation)
Details of the analytical method used:
Method
Recovery rate
Detection limit
Document IIIA
Baker Petrolite ACROLEIN December 2005
Table A7_2 _1-3: Results of screening test - adsorption:
Soil 1
Concentration of test material [mg/l]
After contact of....hours with soil
Correction for blank with soil
Correction for blank without soil
Final corrected concentration [mg/l]
Initial concentration of test solution [mg/l]
Decrease in concentration [mg/l]
Quantity adsorbed [μg]
Quantity of soil [g of oven-dried equivalent]
Quantity adsorbed [μg] per gram of soil
Test material adsorbed [%]
Temperature [°C]
Volume of solution recovered after centrifugation [ml]
Volume of solution not recovered [ml]
Corresponding quantity of test substance [mg]
Table A7_2 _1-4: Results of screening test - desorption:
Soil 1
Temperature [°C]
Concentration in combined washings [mg/l]
Corresponding quantity of test material [mg]
Quantity desorbed [μg]
[%] of adsorbed test material, which is desorbed
[%] of adsorbed test material, which is not desorbed
Document IIIA
Baker Petrolite ACROLEIN December 2005
Section A7.2.2.1 The rate and route of degradation including Annex Point IIIA VIl.4, identification of the process involved and identification XIl.1.1, XIl.1.4 of any metabolites and degradation products in at least
three soil types under appropriate conditions
JUSTIFICATION FOR NON-SUBMISSION OF DATA Official use only
Other existing data I I Technically not feasible I I Scientifically unjustified [ X )
Limited exposure Ix I Other justific.ation [ )
Detailed justification: The use pattem of acrolein would lead to negligible exposure to soil. The rate and route of degradation in soil has aheady been elucidated in studies on the estimation of the aerobic biotransfo1mation rates for acrolein (Magnacide®H Herbicide, Magnacide®B Microbiocide) in soil (Section A7.2.l , Annex Point IIIA, VIl.4., Atm. IIIA, XII.1.1.) and the soil ads01ption coefficient for acrolein (Magnacide®Herbicide and Magnacide®B Microbiocide) study (Section A 7 .1.3, Atutex Point IIIA, XII.2 .2 .) Therefore, in view of the low exposure potential in soil from use and the existing data fmiher studies are considered not to be ne.cessary.
Undertaking of intended data submission I I
Evaluation by Competent Authorities
Use separate "evaluation boxes" to provide transparency as to the comments and views submitted
EVALUATION BY RAPPORTEUR MEMBER STATE
Date 18/05/2006
Evaluation of applicant's The Applicant's justification is acceptable justification
Conclusion Acceptable
Remarks
COMMENTS FROM OTHER MEMBER STATE (specify)
Date Give date of comments submitted
Evaluation of applicant's Discuss if deviating from vie111 of rapporteur member state justification
Conclusion Discuss if deviating from vie111 of rapporteur member state
Remarks
Document IIIA
Baker Petrolite ACROLEIN December 2005
Section A7.2.2.2 Field soil dissipation and accumulation Annex Point IIIA XIl.1.1, Annex VI, para 85
JUSTIFICATION FOR NON-SUBMISSION OF DATA Official use only
Other existing data I I Technically not feasible I I Scientifically unjustified [ X )
Limited exposure Ix I Other justific.ation [ )
Detailed justification: The use pattem of acrolein would lead to negligible exposure to soil. The rate and route of degradation in soil has aheady been elucidated in studies on the estimation of the aerobic biotransfo1mation rates for acrolein (Magnacide®H Herbicide, Magnacide®B Microbiocide) in soil (Section A7.2.l , Annex Point IIIA, VIl.4., Atm. IIIA, XII.1.1.) and the soil ads01ption coefficient for acrolein (Magnacide®Herbicide and Magnacide®B Microbiocide) study (Section A7.l.3, Annex Point IIIA, XII.2 .2 .) Therefore, in view of the low exposure potential in soil from use and the existing data fmiher studies are considered not to be ne.cessary
Undertaking of intended data submission I I
Evaluation by Competent Authorities
Use separate "evaluation boxes" to p rovide transparency as to the comments and views submitted
EVALUATION BY RAPPORTEUR MEMBER STATE
Date 18/05/2006
Evaluation of applicant's The Applicant's justification is acceptable. justification
Conclusion Acceptable
Remarks
COMMENTS FROM OTHER MEMBER STATE (specify)
Date Give date of comments submitted
Evaluation of applicant's Discuss if deviating f rom vie111 of rapporteur member state justification
Conclusion Discuss if deviating from vie111 of rapporteur member state
Remarks
Document IIIA
Baker Petrolite ACROLEIN December 2005
Section A7.2.2.3 Extent and nature of bound r esidues Annex Point IIIA XIl.1.4
JUSTIFICATION FOR NON-SUBMISSION OF DATA Official use only
Othe1· existing data I I Tec.hnically not feasible I I Scientifically unjustified [ X )
Limited exposure Ix I Other justific.ation [ )
Detailed justification: The use pattem of acrolein would lead to negligible exposure to soil. The rate and route of degradation in soil has already been elucidated in studies on the estimation of the aerobic biotransfo1m ation rates for acrolein (Magnacide®H Herbicide, Magnacide®B Microbiocide) in soil (Section A7.2.l , Annex Point IIIA, VII.4., Ann. IIIA, XII.1.1.) and the soil adsorption coefficient for acrolein (Magnacide®Herbicide and Magnacide®B Microbiocide) study (Section A 7 .1.3, Annex Point IIIA, XII.2 .2 .) Therefore, in view of the low exposure potential in soil from use and the existing data further studies are considered not to be necessary
Undertaking of intended data submission I I
Evaluation by Competent Authorities
Use separate "evaluation boxes" to provide transparency as to the comments and views submitted
EVALUATION BY RAPPORTEUR MEMBER STATE
Date 18/05/2006
Evaluation of applicant's The Applicant's justification is acceptable. justification
Conclusion Acceptable
Remarks
COMMENTS FROM OTHER MEMBER STATE (specify)
Date Give date of comments submitted
Evaluation of applicant's Discuss if deviatingf/'Om view of rapporteur member state justification
Conclusion Discuss if deviating from view of rapporteur member state
Remar ks
Section A 7 .2.2.3 Extent and nature of bound r esidues Annex Point IIIA XII.1.4
JUSTIFICATION FOR NON-SUBMISSION OF DATA Official use only
Document IIIA
Baker Petrolite ACROLEIN December 2005
Section A7.2.2.3 Extent and nature of bound residues Annex Point IIIA XIl.1.4
Other existing data I I Technically not feasible I I Scientifically unjustified [ X )
Limited exposure Ix I Other justific.ation [ )
Detailed justification: The use pattern of acrolein would lead to negligible exposure to soil. The rate and route of degradation in soil has already been elucidated in studies on the estimation of the aerobic biotransfo1mation rates for acrolein (Magnacide®H Herbicide, Magnacide®B Microbiocide) in soil (Section A7.2.l , Annex Point IIIA, VIl.4., Ann. IIIA, XII. I.I.) and the soil adso1ption coefficient for acrolein (Magnacide®Herbicide and Magnacide®B Microbiocide) study (Section A 7 .1.3, Annex Point IIIA, XII.2.2.) Therefore, in view of the low exposure potential in soil from use and the existing data fmiher studies are considered not to be necessary
Undertaking of intended data submission I I
Evaluation by Competent Authorities
Use separate "evaluation boxes" to provide transparency as to the comments and views submitted
EVALUATION BY RAPPORTEUR MEMBER STATE
Date Give date of action
Evaluation of applicant's Discuss applicant's justification and, if applicable, deviating view justification
Conclusion Indicate whether applicant's justification is acceptable or not. If unacceptable because of the reasons discussed above, indicate which action will be required, e.g. submission of specific test/study data
Remarks
COMMENTS FROM OTHER MEMBER STATE (specify)
Date Give date of comments submitted
Evaluation of applicant's Discuss if deviating from view of rapporteur member state justification
Conclusion Discuss if deviating from view of rapporteur member state
Remarks
Document IIIA
Baker Petr olite ACROLEIN December 2005
Section A 7 .2.2.4 Fate and behaviour in soil: anaerobic degradation in soil
Annex Point HA 7 .2.2.4
Official 1 REFERENCE use only
1.1 Referenc.e Chou, T-W. & Spanggord, R.J. (1991) Estimation of the Anaerobic Biotransfonna.tion Rates for Acrolein (Magna.cide®H Herbicide, Magna.cide®B Biocide) in Soil-Water Mixnu·e. SRI International. SRI Project No. 3562-4.
1.2 Data protection Yes
1.2.1 Data. owner Baker Petrolite
1.2 .2 Criteria for data. Data. on new a.s. for first entry to Annex I protection
2 GUIDELINES AND QUALITY ASSURANCE
2.1 Guideline study Yes x FIFRA 162-2 and 162-3
2.2 GLP No x No GLP statement provided
2.3 Deviations No
3 MATERIALS AND METHODS
3.1 Test material As given in Section 2
3.1.1 Lot/Batch number NN-481-76
3.1.2 Specification As given in Section 2
Deviating from specification given in section 2 as follows
Radiolabelled at the 2 and 3 positions ( acrolein-2,3-14C)
3.1.3 Purity See 3.1.2
3.1.4 Further relevant x properties
3.1.5 Method of analysis x 3.2 Degradation Degradation products tested: Yes
products
3.2 .l Method of analysis At various time points, aliquots from the six flasks (two sterile and fom for degradation non-sterile) were removed and placed in amber glass vials. The vials were products centrifuged at 2500 1pm for 10 minutes and the a.cetonitrile (plus 1.2 ml
water originally added) was carefully pipetted into a vial and capped. The aqueous supematants were analysed by high-perfonnance liquid chromatography (HPLC) using the following conditions:
Instrument: Specti·a-Physics Model 8000 Liquid Chromatograph
Cohunn: Regis Hi-Chrom ODS-II column, 4 .6 x 250 mm
Solvent: Water/Aceton.iti·ile (80/20)
Flow rate: 1.0 ml/m.inute
Detectors: UV at 210 nm in series with a. Ra.ytest solid-state radioactivity detector
Document III.A
Baker Petrolite ACROLEIN December 2005
Section A 7 .2.2.4 Fate and behaviour in soil: anaerobic degradation in soil
Annex Point HA 7 .2.2.4
Quantitation was achieved using the extemal standard method relating peak area to pruts per million (ppm) of acrolein injected as detennined from stru1dru·d calibration curves. Tota.I radioactivity in the aqueous phase was detennined by direct counting of a 100 ~tl in 10 ml of Aquasol scintillation counting liquid.
The soil samples were oxidised using a Packard Model 306 Oxidizer where the sample is combusted and the 14C-cru·bon is conve1ted to 14C-cru·bon dioxide and trapped. The trapped activity is counted in a scintillation counter.
3.3 Reference No substanc.e
3.3.1 Method of analysis Not applicable for reference substance
3.4 Soil types See Table A 7 2 2 4-1
3.5 Testing prncedure
3.5.1 Test system Soil biotransfonnation rate studies were performed in 125 ml Erlenmeyer flasks. Each flask was equipped with ru1 intemal carbon dioxide trap containing 1 Oml of a 0.2M potassium hydroxide solution, ru1d a pressure relief valve to allow nitrogen to enter the flask through a sterilised filter when the flask was being sampled.
Six flasks were prepru·ed by weighing 6.0 g of Phoenix soil into three flasks and 6.0 g Menlo Park soil into the other three flasks. One flask containing each soil ru1d 60 ml ofMilli-Q water was autoclaved for one hour, then the water level was brought to 120 ml with sterilised water. To each non-sterile flask was added 120 ml of deionised water followed by 1.0 ml of a 0.5 ml/I filter sterilised resazurin solution as an oxidation-reduction indicator. The contents were thoroughly mixed with a stir-bru· and the flasks were incubated at room temperature (20 ± 3°C) for 30 days. During the incubation, aerobic bacteria grew initially, consumed the dissolved oxygen, and reduced the water to an ruiaerobic condition. This effect was noted by a change in the resazurin dye which progressed from a blue-violet to pink to colourless solution. To accelerate the utilisation of oxygen in the Phoenix soil-water flasks, 10 ppm of Difeo nutrient broth was added.
3.5.2 Test solution ru1d A stock solution of 14C-acrolein in water was prepared by adding 0.37 ml Test conditions of the test material solution to 29.6 ml of sterilised water. 2.0 ml of this
solution was added to the sterile and non-sterile flasks while flushing with nitrogen, to yield a 4.2 ppm acrolein spike to the soil-water. The water-soil-containing flasks were capped to minimise volatilization and stiITed with the magnetic-stir bar for 10 minutes. For sample analysis, 1.0 ml aliquots were removed by syringe, placed in a capped vial, ru1d centi·ifuged at 2500 1pm for 10 minutes.
Sampling and analysis were perfo1med on Days 0, 2, 7, 14, 21, 28, 35, 42 and 56 after application.
3.6 Test performance
3.6.1 Identification of Products were identified by their co-chromatography with authentic products standards or as derivatised products. Two derivatisation procedures were
used. One procedure involved the conversion of aidehydes to their pentafluorophenylhydrazones by reaction with
Document IHA
Baker Petrolite
Section A 7 .2.2.4
Annex Point HA 7 .2.2.4
3.6.2 Analysis of Data
3.6.3 Screening test: Deso1ption
3.6.4 HPLC-method
4.1 Biotransformatio n Rate
ACROLEIN December 2005
Fate and behaviour in soil: anaerobic degradation in soil
pentafluorophenylhydrazine. The derivatives were then analysed by HPLC as described in section 3 .2.1 with the exception that the gradient programme was used, starting from acetonitrile/water (20/80) for five minutes progranuned to 100% acetonitrile in five 1ninutes (six minute hold). The column was re-equilibrated for five minutes with the starting solvent composition. The components, 3-hydroxypropanal pentafluorophenylhydrazone and acrolein pentafluorophenylhydrazone eluted at 12.5 and 14.5 1ninutes respectively. To confum, identifications were perfonned by gas chromatography/mass spe.ctroscopy using a Ribennag R-10-10 GC/MS and a 30 m DB-5 fused silica capilla1y temperature programmed from 50 - 200°C
The loss of acrolein from soil was assumed to a following a first-order reaction as shown in Equation 1 :
Equation 1
-d[A]/dt = ki, [A]
Where
[A] is the concentration of acrolein
ki, is the first-order biotransfo1mation rate constant
tis time.
Integration of equation 1 yields equation 2
Equation 2
In [Ao]/ [A1] = ki,t
Where
[Ao] is the concentrntion of acrolein at time zero
[At] is the concentration at time t.
Other loss processes (irreversible so1ption, hydrolysis and volatilization) are occwring to acrolein on soil besides biotransfonnation. The half life of acrolein in soil due to biotransfonnation :
tY2 = In 2/ki,
Not performed
According to OECD-HPLC-method: Yes
4 RESULTS
Acrolein was found to be rapidly lost from both the sterile and non-sterile Phoenix and Menlo Park soil-water reaction flasks. Acrolein was completely gone from the aqueous phase within 14 days in both types of non-sterile soils. The sterile soil-water mixtures showed the presence of acrolein up to Day 56. The first-order rate constant for the Phoenix soilwater was averaged to 0.192/day. The first-order rate constant for the sterile control was 0.154/day.
The first-order rate constant for the Menlo Park soil-water mixtures were averaged to be 0.239/day for the non-sterile soil-water, and 0.147/day for the sterile samples.
The average half-life in the Phoenix soil was 3.6 days, while the half-life
Document IIIA
Baker Petrolite ACROLEIN December 2005
Section A 7 .2.2.4 Fate and behaviour in soil: anaerobic degradation in soil
Annex Point HA 7 .2.2.4
in the sterile control was 4.5 days.
In Menlo Park soil, the half-life was 2.9 days and half-life of the sterile control was 4.9 days. For both of the sterile soils, the average rate constant was calculated to be 0.151/day.
The difference between the averaged non-sterile and sterile rate constants is 0.038/day in Phoenix soil-water and 0.092/day in Menlo Park soil-water from which an average anaerobic biotransfonnation half-life was 11 days.
4.2 Products Two products were identified; x 1. 2-hydroxypropanal Acrylic acid -
2. 3-hydroxypropanaI
These products remained in the sterile controls with in equilibrium with acrolein up to Day 56. In the non-sterile samples, comporn1d was transfo1med to 1,3-propanediol. Small amounts of 3-hydroxypropionic acid was also found.
Carbon dioxide was identified as the final product resulting from acrolein biotransfonnation. This was continuously released between days 14 till the end of the study. The sterile controls showed minimal carbon dioxide production.
4.3 M aterial balance In the sterile Menlo Park soil, the majority of the activity was found in the aqueous phase and potassirnn hydroxide trap. Approximately 4% of the activity was bound to the soil at the end of the study.
In the non-sterile soil, the born1d activity was slightly higher (6.7 - 6.9%) and the bound activity was being converted to carbon dioxide. Minimal activity was found bound to the Phoenix soil and the total recove1y averaged 90%.
5 APPLICANT'S SUMMARY AND CONCLUSION
5.1 M ate1i als and This study was conducted in accordance to FIFRA guidelines No. 162-2. methods
Six flasks were prepared by weighing 6.0 g of Phoenix soil into three flasks and 6.0 g Menlo Park soil into the other three flasks. One flask containing each soil and 60 ml ofMilli-Q water was autoclaved for one hour, then the water level was brought to 120 ml with sterilised water. To each non-sterile flask was added 120 ml of deionised water followed by 1.0 ml of a 0.5 ml/I filter sterilised resazurin solution as an oxidation-reduction indicator. The contents were thoroughly mixed with a stir-bar and the flasks were incubated at room temperature (20 ± 3°C) for 30 days. During the incubation, aerobic bacteria grew initially, consllllled the dissolved oxygen, and reduced the water to an anaerobic condition. This effect was noted by a change in the resazurin dye which progressed from a blue-violet to pink to colourless solution. To accelerate the utilisation of oxygen in the phoenix soil-water flasks, 10 ppm of difco nutrient broth was added.
To sterile and non-sterile flasks was added 2.0 ml of test material while flushing with nitrogen to yield a 4.2 ppm acrolein spike to the soil-water. The water-soil containing flasks were capped to minimise volatilization and stiffed with the magnetic-stir bar for 10 tninutes. For sample analysis, 1.0 ml aliquots were removed by syringe, placed in a capped vial, and centi·ifuged at 2500 1pm for 10 tninutes.
Document IHA
Baker Petrolite ACROLEIN December 2005
Section A 7 .2.2.4 Fate and behaviour in soil: anaerobic degradation in soil
Annex Point HA 7 .2.2.4
Sampling and analysis was perfotmed on Days 0, 2, 7, 14, 21, 28, 35, 42 and 56 after application.
5.2 Results and Acrolein tmdergoes bio-transfonnation in anaerobic soil-water x discu ssion compartments. The halflife was detennined to be 2.9 and 3.6 days in
Menlo Park and Phoenix soil-water mixtures. When cotl'ected for sterile control, the half life was estimated to be 11 days.
3-hydroxypropanaI is the hydrolytic product of acrolein, which is at it' s maximum concentration after 7 days after which it is converted to 1,3-propandiol. This reaches maximum concentration after 14 days and is fmiher transfonned to 3-hydroxypropionic acid . Fmiher oxidation possibly leads to malonyl derivatives (acid and aldehyde) and acetate.
1,3-propanediol and 3-hydroxypropionic acid are also readily biotransfonned and are presumably conve1ted to carbon dioxide with a ha.If-life betv.reen 80 and 110 days.
Acrolein products that are bound to soil are mineralised to carbon dioxide.
5.3 Conc.lusion Biotransfo1mation of acrolein and its abiotic transfo1ma.tion products will occur readily in an-aerobic soil-water eventually leading to carbon dioxide. Based on the rapid evolution of carbon dioxide, it appears that anaerobic soil-water 1nicrobes adapt easily to concentrations above any expected field exposme value. Thus, 1nicrobes will play an impotiant role in the overall persistence of acrolein in anaerobic soil-water environments.
5.3.1 Reliability 1
5.3.2 Deficiencies No
Evaluation by Competent Authorities
Use separate "evaluation boxes" to provide transparency as to the comments and views sub1nitted
EVALUATION BY RAPPORTEUR MEMBER STATE
Date 17/07/2007
The Applicant's version is acceptable, noting the following;
2.1 FIFRA guideline 162-2 was followed for this study. Guideline 162-3 refers to 'Anaerobic Aquatic Metabolism Studies' and is therefore non-applicable.
2.2 There is no ce1tification of GLP (see remarks)
Materials and Methods The Applicant's version is considered acceptable, noting the following:
3.1.4 The UK CA believes that the water solubility figme should be given (237,628mg/l ± 2856 mg/I at 25°C).
3.1.5 The method of analysis should be stated (HPLC and Scintillation Counting).
Document IIIA
Baker Petrolite ACROLEIN December 2005
Section A7.2.2.4
Annex Point IIA7.2.2.4
Fate and behaviour in soil: anaerobic degradation in soil
Results and discussion The Applicant’s version is considered acceptable, with the following additional comments;
4.2 The UK CA believes that the study summary is incorrect with respect to the following statement:
Two products were identified;
1. 2-hydroxypropanal Acrylic acid
2. 3-hydroxypropanal
Although this is a direct interpretation of what is stated in the study report, the UK CA believes that the report incorrectly states that one of the products is ‘2-hydroxypropanal Acrylic acid’. The two products identified where 3-hydroxypropanal and the hydrated 3-hydroxypropanal. Therefore, section 4.2 should read as follows:
Two products were identified;
1. 3-hydroxypropanal
2. hydrated 3-hydroxypropanal
5.2 The UK CA suggest that the wording below is used:
3-hydroxypropanal is the hydrolytic product of acrolein, which is at it’s maximum concentration (67.2 % AR) after 7 days, and is then converted to 1,3-propandiol, whis reaches maximum concentration (53.2 % AR) after 14 days and is further transformed to 3-hydroxypropionic acid, which has a maximum concentration of 51.3 % AR after 28 days . Further oxidation possibly leads to malonyl derivatives (acid and aldehyde) and acetate.
Using zero order kinetics, it is estimated that complete mineralization to CO2 will yield a half-life of 80 - 110 days.
Acrolein products that are bound to soil are mineralised to carbon dioxide. The total recovery at termination of the study was approximately 90 %. This therefore illustrates that the potential maximum amount of bound residues remaining is < 10 %.
Conclusion The Applicant’s version is considered acceptable.
Reliability 2
Acceptability Acceptable
The reliability factor has been changed to 2 because there is no certificate of GLP. However, it should be noted that the study was started prior to 1989, which is the year in which GLP use begun, hence GLP certification may not have been readily available at this time. The UK CA believes that the data reported in the study are considered sufficiently robust for risk assessment.
Remarks All endpoints and data presented in the summary have been checked against the original study and are correct.
The UK CA notes that the Applicant has included uncompleted tables within the study summary (A7_2_2_4-2, A7_2_2_4-3, and A7_2_2_4-4). This will not affect the reliability factor of the study.
Document IIIA
Baker Petrolite ACROLEIN December 2005
Section A7.2.2.4
Annex Point IIA7.2.2.4
Fate and behaviour in soil: anaerobic degradation in soil
COMMENTS FROM ...
Date Give date of comments submitted
Materials and Methods Discuss additional relevant discrepancies referring to the (sub)heading numbers and to applicant's summary and conclusion. Discuss if deviating from view of rapporteur member state
Results and discussion Discuss if deviating from view of rapporteur member state
Conclusion Discuss if deviating from view of rapporteur member state
Reliability Discuss if deviating from view of rapporteur member state
Acceptability Discuss if deviating from view of rapporteur member state
Remarks
Document IIIA
Baker Petrolite ACROLEIN December 2005
Table A7_2_2_4-1:Classification and physico-chemical properties of soils used as adsorbents
Soil 1 Soil 2
Soil identification Phoenix Menlo Park
Classification Sandy loam Loam
Location S.32nd Street, Phoenix, Arizona, USA
S.32nd Street, Phoenix, Arizona, USA
Sand [%] 61.4 46.0
Silt [%] 24.6 31.8
Clay [%] 14.0 22.2
Organic matter [%] 0.4 4.0
pH (1:1 H2O) 7.9 5.9
Cation exchange capacity (MEQ/100 g) 9.1 21.5
Table A7_2_2_4-2: Results of preliminary test:
Test substance
Sample purity
Weighed soil
Volume of calcium chloride solution
Nominal concentration of a.s. final solution
Analytical concentration final of a.s. solution
Concentration of the test solution (show calculation)
Details of the analytical method used:
Method
Recovery rate
Detection limit
Document IIIA
Baker Petrolite ACROLEIN December 2005
Table A7_2_2_4-3: Results of screening test - adsorption:
Soil 1 Soil 2
Concentration of test material [mg/l]
After contact of....hours with soil
Correction for blank with soil
Correction for blank without soil
Final corrected concentration [mg/l]
Initial concentration of test solution [mg/l]
Decrease in concentration [mg/l]
Quantity adsorbed [μg]
Quantity of soil [g of oven-dried equivalent]
Quantity adsorbed [μg] per gram of soil
Test material adsorbed [%]
Temperature [°C]
Volume of solution recovered after centrifugation [ml]
Volume of solution not recovered [ml]
Corresponding quantity of test substance [mg]
Table A7_2_2_4-4: Results of screening test - desorption:
Soil 1 Soil 2
Temperature [°C]
Concentration in combined washings [mg/l]
Corresponding quantity of test material [mg]
Quantity desorbed [μg]
[%] of adsorbed test material, which is desorbed
[%] of adsorbed test material, which is not desorbed
Document IIIA
Baker Petrolite ACROLEIN Dec.ember 2005
Section A 7 .2.3 Adsorption and mobility in soil, further studies Annex Point IIIA.XIl.1.2.-3
JUSTIFICATION FOR NON-SUBMISSION OF DATA Official nse only
' Other existing data ( l Technically not feasible ( l Sdentific.ally unjustified ( X]
Limited exposure ( l Other justification ( ]
Detailed justification: The use pattem of acrolein would lead to negligible exposme to soil. The mobility in soil has afready been elucidated in studies on the estimation of the aerobic biotransfonnation rates for acrolein (Magnacide®H Herbicide, Magnacide®B Microbiocide) in soil (Section A7.2.l, Annex Point IIIA, VII.4., Ann. IIIA, XII. I. I .) and the soil adsotption coefficient for acrolein (Magnacide®Herbicide and Magnacide®B Microbiocide) study (Section A7. l.3, Annex Point IIIA, XII.2.2.) Therefore, in view of the low exposure potential in soil from use and the existing data fo.rther studies are considered not to be necessaiy
Under taking of intended data submission ( l
Evaluation by Competent Authorities
Use separate "evaluation boxes" to provide transparency as to the comments and views submitted
EVALUATION BY RAPPORTEUR MEMBER STATE
Date 18/05/2006
Evaluation of applicant's The Applicant's justification is acceptable. justification
Conclusion Acceptable
Remar ks
COMMENTS FROM OTHER MEMBER STATE (specify)
Date Give date of comments submitted
Evaluation of applicant's Discuss if deviating from view of rapporteur member state justification
Conclusion Discuss if deviating from view of rapporteur member state
Remar ks
Document IIIA
Baker Petrolite ACROLEIN Dec.ember 2005
Section A7.2.3.1 Adsorption and desorption accordance with the new test Annex Point IIIA guideline EC C18 or the corresponding OECD 106 and, XIl.1.2 where relevant, adsorption and desorption of metabolites
and degradation products
JUSTIFICATION FOR NON-SUBMISSION OF DATA Official use only
' Other existing data ( l Technically not feasible ( l Sdentific.ally unjustified ( X ]
Limited exposure ( x l Other justification ( ]
Detailed justification: A full OECD study in 5 soils is not required as a detennination of abso1ption in soil has been performed. See section IIIA 7 .1.3.
The substance and product will be used in a marine environment only and therefore there will be no teITestrial exposure.
Undertaking of intended data submission ( l
Evaluation by Competent Authorities
Use separate "evaluation boxes" to provide transparency as to the comments and views submitted
E VALUATION BY RAPPORTEUR M EMBER STATE
Date 18/05/2006
E valuation of applicant's The Applicant's justification is acceptable. justification
Conc.lusion Acceptable
Remarks
COMMENTS FROM OTHER MEMBER STATE (specify)
Date Give date of comments submitted
Evaluation of applicant's Discuss if deviating from view of rapporteur member state justification
Conc.lusion Discuss if deviating from view of rapporteur member state
Remarks
Document IIIA
Baker Petrolite ACROLEIN December 2005
Section A7.3.1(1) Phototransformation in air including identity of
Annex Point IHA VII.5 transformation products
Official 1 REFERENCE use ouly
1.1 Referenc.e Haag, W.R. et al (1988b) Estimation of Photolysis Rate Constants for Acrolein (Magnacide®H Herbicide and Magnacide®B Microbiocide) in the Environment, SRI International, SRI Project No. 3562-3.
1.2 Data protection Yes
1.2.l Data owner Baker Pet:rolite
1.2.2 Criteria for data Data on new a.s. for first enfly to Annex I protection
2 GUIDELINES AND QUALITY ASSURANCE
2.1 Guideline study Yes x FR 796.3780 and
Pesticide Assessment Guidelines, Subdivision N, 161-3
2.2 GLP Yes
2.3 Deviations No x
3 METHOD
3.1 Test material As given in Section 2
3.1.1 Lot/Batch munber NN-481-76
3.1.2 Specification As given in Section 2
3.1.3 Pmity 96.2 %
3.1.4 Radio labelling Not used
3.1.5 UV N IS absorption Extinct ion coefficients were estimated relative to the maximum of spectra and 11 ,800 M.1 cm ·1 at 210 run using the respective attenuations absorbance value
3.1.6 Fwther relevant None properties
3.2 Referenc.e No substanc.e
3.2.l Initial concenti·ation of reference substance
3.3 Test solution See Table A 7 3 1-1
3.4 Testing p rocedure
3.4.l Test system Sw1light inidation was perfonned in a 5 1 Pyrex bulk equipped with a x stopclock and a septum-capped side po1t. The bulb was pmged with nitrogen gas at 100 ml/min for 30 minutes, then with synthetic air at 50 ml/min for 50 minutes. Acrolein (60 ~tg/l) and methylene chloride (57.7 µ.g/l) were added by injection to give final concentrations of 180 ~tM each. The bulb was clamped above a grey swfa.ce on the roof of the SRI Physical Sciences building in Menlo Park, California, USA and exposed for 11 cloudless days from 17 July 1987 to 27 July 1987. An identically
Document IIIA
Baker Petrolite ACROLEIN December 2005
Section A7.3.1(1) Phototransformation in air including identity of
Annex Point IHA VII.5 transformation products
prepared bulb kept in the laborat01y in the dark se1v ed as the control. The temperature was ambient, approximately 25 to 30°C during daylight.
Analyses were perfo1med at regular time inte1v als by removing a 10 ~tl sample (after three syringe rinses) through the septum using a pressure lock syringe and injecting into a Varian 3700 gas chromatograph equipped with a flame ionisation detector ..
3.4.2 Prope1t ies of light See Table A 7 3 1-2 x source
3.4.3 Dete1mination of A sunlight actinometer was used for kinetic studies. The solution iffadiance contained 10 µM p-nitroacetophenone and 20 mM pyridine.
3.4.4 Temperature 25 ± 5 °C x 3.4.5 pH 7
3.4.6 Duration of test 11 days
3.4.7 Number of Not specified replicates
3.4.8 Sampling Samples were taken at 0, 1.0, 3.7, 7.0, 8.1 (nm 2 only) and 11.0 hours.
3.4.9 Analytical methods Analyses were perfonned at regular time inte1vals by removing a 10 ~tl sample (after three syringe rinses) through the septum using a pressure lock syringe and injecting into a Varian 3700 gas chromatograph equipped with a flame ionisation detector. Conditions were as follows:
Column: 0.32 mm i.d. x 30 m DB-5
Nitrogen flow rate: 0 .5 ml/min
Air/hydrogen (2:1) flow rate) : 30 ml/min
A gas phase UV spectmm of acrolein was obtained by injection of 0.1 µl of acrolein from a 1.0 ~11 syringe into a 28.3 ml, I 0 cm quartz cell (acrolein = 0.96 ton) and recording the specttum on an HP 8450 diode affay sprectt·ophotometer.
3.5 Transformation Yes
products
3.5.1 Method of analysis 3-hydroxypropanal was analysed by HPLC following derivatisation with for transfonnation PFPH. products
4 RESULTS
4.1 Screening test Not perfo1med
4.2 Actinomete1· data
4.3 Controls
4.4 Photolysis data
4 .4 .I Concentt·ation values
4 .4.2 Mass balance
4 .4.3 kc 0.090 d·1
p
Document IIIA
Baker Petrolite ACROLEIN December 2005
Section A7.3.1(1) Phototransformation in air including identity of
Annex Point IHA VII.5 transformation products
4.4 .4 Kinetic order
4 .4 .5 kcp I k"p
4.4.6 Reaction quantum yield W E)
4 .4 .7 kpE
4.4.8 Half-life (t1f2.E) 7.7 days
5 APPLICANT'S SUMMARY AND CONCLUSION
5.1 M aterials and The study was perfo1med according to the protocols in Federal Register x methods 796.3780 and Pesticide Assessment Guidelines, Subdivision N, 161-3.
Sunlight irradiations were perfonned on the acrolein/methylene chloride samples on 11 consecutive cloudless days. Sampling occtmed at 0, 1.0, 3.7, 7.0, 8.1 (nm2 only) and 11.0 hours. Photolyses were nm at ambient temperature (25 ± 5°C) During analysis, acrolein levels were detennined by gas chromatography, with a gas UV spectmm of acrolein obtained by a HP 8450 diode array spectrophotometer.
5.2 Results and There was a small, rapid initial loss, but it was not thought to be due to x discussion direct photolysis. Possible explanations include incomplete mixing when
the zero time point was taken, adso1ption of acrolein onto the walls of the bulb, or incomplete removal by purging with synthetic air of nitrogen oxides and other hydroxide radical precursors, which were rapidly consumed in the initial part. of the reaction.
Acrolein may be lost from the troposphere by sensitised photo-oxidation. The most important photo-oxidant in the trnposphere is the hydroxy radical, present in average concentrations of approximately 5E+5 molecules/cm3
. Using a rate constant of l.9E-l 1 cm3/molecule/s for reaction of acrolein with the hydroxy radical, a first order rate constant of l .9E-05 s·1 or a half life of 29 hours for tropospheric consumption of acrolein by hydroxy radicals, which is nearly 10 times faster than the measured direct photolysis rate.
Ozone may oxidise acrolein. Assuming an average ozone concentration of 1E+22 molecules/cm3 and a rate constant of2.8E-19 cm3/molecule/s for acrolein, an ozoneation rate constant of2.8E-07 s·1 or halflife of 41 days is calcu lated. Therefore, ozone reactions will be negligible and hydroxy radical reactions will control the tropospheric transfonnation rate of acrolein.
The repo1t states that the products from direct photolysis of acrolein under atmospheric conditions are carbon monoxide (75%), carbon dioxide (29%), glyoxal (31 %), ethylene (27%), methanol (5%), fo1maldehyde (6%) and methane (1 %). Hydroxy attack on acrolein will occur primarily at the aldehydic hydrogen, probably yielding ac1ylic acid after several steps. Acrolin and acrylic acid can both add hydroxy radicals to the double bond to form a variety of polar products.
5.2 .l kc p
5.2 .2 l<pE 0.090 d·1
5.2 .3 <pcE
5.2.4 t l/2E 7.7 days
Document IIIA
Baker Petrolite ACROLEIN December 2005
Section A7.3.1(1) Phototransformation in air including identity of
Annex Point IHA VII.5 transformation products
5.3 Conclusion The observed rate constant for the gas phase photolysis of acrolein was measw·ed at 0.063 d·1 yielding a half-life of 10.9 days. The calculated rate constant was 0.090 d.1 or a half-life of 7. 7 days. Estimation of half-lives from other atmospheric oxidation processes indicated reactions with hydroxy radicals (HO) would be rapid (half-life = 29 how-s) and reactions with ozone much slower. (Half-life = 41 days).
5.3. 1 Reliability 2
5.3.2 Deficiencies Yes
The report states that the products from direct photolysis of acrolein wider atmospheric conditions are carbon monoxide (75%), carbon dioxide (29%), glyoxal (31 %), ethylene (27%), methanol (5%), fotmaldehyde (6%) and methane (1 %). These values added together give a total of 174 %. Unfortunately, it is not readily possible to explain the origin of the disproportionate percentage results cited by Haag et al. These results are claimed to originate from an EPA report by Gardner et al (Gardner, Speny and Calver, Primary Photochemical Processes of Acrolein, EPA, 1986).
Peter Fisk Associates (PF A), experts in Environmental Chemistry have reviewed both repo11s and although they have explored some realistic conversions, there is no obvious way that these percentages could have been calculated from the results that are presented in the Gardner et al report. PF A ' s comments have been provided as an appendix to this robust summa1y and a robust summa1y has been written on the EPA repo11 (see Document IIIA Section 7.3. 1(2)).
The dispropo1tionate percentages do not affect the validity of the report, since the general findings are supported by the Gardner et al repo1t . This repo1t states that the order of abundance of phototransfonnation products of acrolein are:
The repo1t also states that degradation of acrolein via direct photolysis is much slower than degradation via reaction with hydroxyl radicals (half lives of > 5 days and 14.6 hours, respectively). Hence indirect photolysis is the major and more impot1ant route of degradation.
Evaluation by Competent Authorities
Use separate "evaluation boxes" to provide transparency as to the comments and views submitted
EVALUATION BY RAPPORTEUR MEMBER STATE
Date 13/07/2007
Document IIIA
Baker Petrolite ACROLEIN December 2005
Section A7.3.1(1)
Annex Point IIIA VII.5
Phototransformation in air including identity of transformation products
Materials and Methods The Applicant’s version is considered acceptable with the following exceptions:
2.1 The guideline stated by the applicant, Pesticide Assessment Guidelines, Subdivision N, 161-3, is for ‘Photodegradation Studies in Soil’. The applicant has actually followed the correct guideline, ‘161-4: Photodegradation studies in Air’.
2.2 No data on hours of daylight, See point 3.4.2.
3.4.1 The units used for Acrolein and Methylene Chloride, µg l-1, are incorrect. The study states that the units are µl. This will not affect the endpoint from the study.
3.4.2 Table A7_3_1-2: Description of test system.
Hours of daylight are not included in the table. This is a requirement of guideline 161-4. This will not affect the endpoint from the study.
3.4.4 The guideline, 161-4, states that the temperature should be maintained as closely to 30 °C as possible. This will not affect the endpoint from the study.
5.1 see point 2.1
5.2 The figure given in the summary for average ozone concentration is incorrect. The study states this figure should be 1 x 10¹². This will not affect the endpoint from the study.
Results and discussion The Applicant’s version is considered to be acceptable.
Conclusion The Applicant’s version is considered to be acceptable.
Reliability 2
Acceptability Acceptable
Remarks All endpoints and data presented in the summary have been checked against the original study and are correct (with the exceptions of those noted above).
COMMENTS FROM ... (specify)
Date Give date of comments submitted
Materials and Methods Discuss additional relevant discrepancies referring to the (sub)heading numbers and to applicant's summary and conclusion. Discuss if deviating from view of rapporteur member state
Results and discussion Discuss if deviating from view of rapporteur member state
Conclusion Discuss if deviating from view of rapporteur member state
Reliability Discuss if deviating from view of rapporteur member state
Acceptability Discuss if deviating from view of rapporteur member state
Remarks
Document IIIA
Baker Petrolite ACROLEIN December 2005
Table A7_3_1-1: Description of test solution and controls
Criteria Details Purity of water Unbuffered Milli-Q water
Preparation of test chemical solution Solutions of 10 ppm acrolein in 10 mg/l humic acid prepared by diluting 0.5 ml of 1000 ppm acrolein stock, 5 ml of 100 mg/l humic acid stock and 1.0 ml of 0.5M pH 7 phosphate buffer to 50 ml.
Test concentrations (mg a.s./l) Initial concentration: 10 ppm acrolein.
Temperature (°C) Ambient 25ºC ± 5ºC
Preparation of a.s. solution Not applicable
Controls Identical to test solution, but kept in the laboratory in the dark
Identity and concentration of co-solvent No co-solvent used
Table A7_3_1-2: Description of test system
Criteria Details
Laboratory equipment 5 l Pyrex bulb with stopcock and septum-capped side port. GC: Varian 3700 equipped with flame ionisation detector Spectrometer: HP 8450 diode array spectrophotometer Give details on the type and geometry of the reaction vessels (test tubes, material, size, type of absorption cell, pathlength); describe applicability in relationship to the applied wavelength. Report the name and the model of the spectrometer used.
Test apparatus e.g. sunlight actinometer; describe details
Properties of artificial light source: No artificial light source used.
Properties of natural sunlight: Natural sunlight used
Latitude 40ºN
Hours of daylight Not stated
Time of year Summer (17 - 27 July 1987)
Light intensity Not stated
Solar irradiance (Lλ) Not stated
Document IIIA
Baker Petr olite ACROLEIN October 2006
Section A7.3.1(2) Phototransformation in air including identity of
Annex Point IHA VII.5 transformation products
Official 1 REFERENCE use ouly
1.1 Refer enc.e Gardner, E.P., Sperry, P.D. and Calve1t, J.G. (1986). The Primaiy Photochemical Processes of Acrolein. EPA Repo1t EP A/600/3-86/005. US EPA Research, Triangle Park, NC. 93 pp.
1.2 Data protection No.
Report mai·ked Unclassified: Release to Public
1.2.l Dataovmer NIA
1.2.2 Criteria for data No data protection claimed protection
2 GUIDELI NES AND QUALITY ASSURANCE
2.1 Guideline study Yes
No fo1malised EU standai·d guideline is available. Methods ai1d experimentaI equipment used were largely compliant with OECD monograph 61 (1993) section 3.4: Methods to Determine the Rate of Direct Photo-transfonnation.
There ai·e some deviations (see 5.3.2) and some aspects of the OECD method, if call'ied out in this study, are not repo1ted (e.g. preliminary experiments across a range of time periods).
2.2 GLP No
2.3 Deviations Yes
See 5.3.2
3 METHOD
3.1 Test material Acrolein
3.1.1 Lot/Batch mllllber Not repo1ted.
3.1.2 Specification Acrolein was obtained from Sigma Aldrich
3.1.3 Purity Acrolein as obtained: 97% pure in water; 200 ppm hydroquinone present
Sample was fwther purified prior to the experiment; final purity estimated as 99 .9% (refer to table A 7_3_ 1-1)
3.1.4 Radio labelling None
3.1.5 UVNIS abso1ption Absorbance at 313 run. At this wavelength, in the test system used, only spectra and acrolein is absorbing. absorbance value
Please see figure 1 for the UV abs01ption spectrum of acrolein.
3.1.6 Further relevant None properties
3.2 Refer ence None substanc.e
Document IHA
Baker Petrolite ACROLEIN October 2006
Section A7.3.1(2) Phototransformation in air including identity of
Annex Point IHA VII.5 transformation products
3.2.l Initial NIA concentration of reference substance
3.3 Test atmosphere See Table A 7 3 1-1
3.4 Testing procedure
3.4. 1 Test system See Table A 7 3 1-2
3.4.2 Prope1t ies of light See Table A 7 3 1-2 source
3.4.3 Detennination of Light exiting the reaction cell passes into a photomultiplier tube (model itradiance 8575 RCA), with naITow band and neutral density filters, then into a
Hewlett Packard 5201L scaler timer, digital pulse height analyser to obtain a measure of integrated light intensity.
3.4.4 Temperature 24.08°C (nm 7F)
22.3 - 25.8°C across 11 experitnental 11111s
3.4.5 Duration of test Rl11l time 1620 minutes = 27 hours (Rrn1 #7F).
1620 - 2770 minutes across 11 experitnental 1111lS
3.4.6 Number of Eleven experimental nms in total. Quantrnn yields are presented for all replicates nms but results discussed in the repo1t relate only to one nm (7F).
3.4.7 Sampling After photolysis, the reaction mixture flows into a reservofr/sample chamber, which incorporates a Dewar trap. The mixture passes into a sample loop.
3.4.8 Analytical methods From the sample loop the products are passed via. Carle valves for analysis using a. gas chromatograph fitted with flame ionisation detector (GC-FID) and the1mal conductivity detector (GC-TCD).
GC-mass spectrometly was used for primaiy identification of rntlaiown products.
3.5 Transformation Yes
products
Document IIIA
Baker Petr olite ACROLEIN October 2006
Section A7.3.1(2) Phototransformation in air including identity of
Annex Point IHA VII.5 transformation products
3.5.1 Method of analysis Eight transfonnation products were identified by GC-MS. These are for transfonnation identified in Table A7 _3_ 1-3, in which CAS munbers and foll chemical products names are presented, together with product-specific normalised mean
molar ratios and other results.
The repo1t clearly states the finding that the order of abundance of phototransfonnation products of acrolein are:
Trace amom1ts of acetaldehyde, acetylene and acetic acid were also detected.
Notes:
It is not made clear how 'abundance' has been calculated and this sequence does not con-elate exactly with molar ratios/ number of molecules or the equivalent by weight or the quantum yields.
There is 11e1y e"Cfensive reporting in this source of transfonnation mechanisms occurring at 313 nm. Over 20 separate reaction mechanisms are defined. It is not necessmy to reproduce these here.
4 RESULTS
4.1 Scr eening test Not repo1ted
4.2 Actinomete1· data Two actinometers used, azomethane (CH3CN=NCH3) and acetone (Or free). Products are N2 and CO respectively.
Actinometer data are not presented in repo1t. It is reported that the data indicate accuracy to within 10% and reproducibility better than ± 5% for the acrolein experiment.
4.3 Contr ols None
4.4 Photolysis data
4 .4. l Concentration Molar ratios of the products are presented in Table A 7 _3 _ 1_3. values
4 .4 .2 Mass balance As shown in Table A7 _3_ 1_3, a mass balance (based on carbon atoms) of2.69 moles C in products: 3.00 moles C in acrolein lost in the test system is achieved.
This is equivalent to 90%, not including non-carbon products (hydrogen, water).
The transfo1mation processes and products are discussed in detail in the report, though this is not reproduced here.
The small quantmn yield of acrolein loss indicates efficient deactivation processes occmTing. This is thought to be due to collisional transfer of vibrational energy to oxygen.
4 .4.3 kc p Many pathways of decomposition are identified in the report and no
single overall value of kc is defined.
It is of interest to consider the varying values of the first-order rate coefficient (J) presented in the repo1t. J varies in accordance with solar zenith angle from 2.8E-06 s·1 at 0°, 2.3E-06 s·1 at 40°, to 0.08E-06 s·1 at 86°
Document IIIA
Baker Petr olite ACR OLE IN October 2006
Section A7.3.1(2) Phototransformation in air including identity of
Annex P oint IHA VII.5 transformation products
4 .4 .4 Kinetic order First order
4.4.5 kcp I k"p See section 4.4.3
4.4.6 Reaction quantum Quantum yields are reported for specific products. These results are yield WE) presented in Table A7 _3_ 1_3.
The perfect quantum yield would be 1. In this study, quantum yields are derived for loss of acrolein and also generation of products. The sum of the yields for products is more than the yield from loss of acrolein because they are smaller mole.cules resulting from fragmentation.
Quantum yields are shown in the study to be strongly affected by pressure, with much lower quantum yields at higher pressures. This indicates that reaction will be fastest at higher altitudes.
4.4.7 kpE See section 4.4.3
4 .4.8 Half-life (t1f2.E) Half-life for direct photolysis tuider atmospheric conditions, is reported in this study as >5 days.
Note:
The authors p oint out in the concluding discussions that photodegradation by hydroxyl radicals will be a much more significant degradation process for acrolein than direct p hotolysis. A half-life for the hydroxyl radical process of 14.6 hours is reported.
4.5 Transformation See Table A 7_3_1-3 for transformation products, abundance data and products 1·esults quantum yields.
5 APPLICANT'S SUMMARY AND CO NCLUSION
5.1 M atelials and Direct photolysis of acrolein w as studied. The study used a highly method s purified sample of acrolein (99.9% pure), a wavelength 313 run, in a
synthetic atmosphere comprising ca. 20% 0 2 and 80% N2.
The test system comprised a vacuum line connected to the reaction cell, with direct outflow to a Varian model 2700 gas cln·omatograph.
The vacuum line w as comprised of five sections: storage, high vacuum/reference, measurement, calibration/mixture preparation, and distillation.
Light passed from a UV light source (high pressure mercury arc lamp), via shutter and monochromator, through a window into a reaction cell. The reaction cell was connected to the vacuum system and featured photomultiplier tube, sampling reservoir, gas piston and outlet to GC analysis. Detection/analysis is by a gas chromatograph equipped with flame ionisation detector and thennal conductivity detector.
It is repotted that actinometer data indicate accuracy to within I 0% and reproducibility better than ± 5% for the acrolein experiment.
Document IIIA
Baker Petrolite ACROLEIN October 2006
Section A7.3.1(2) Phototransformation in air including identity of
Annex Point IHA VII.5 transformation products
5.2 Results and Eight transfonnation products were identified by GC-MS. The report discussion clearly states the finding that the order of abundance of
Trace amow1ts of acetaldehyde, acetylene and acetic acid were also detected.
Notes:
I t is not made clear how 'abundance' has been calculated and this sequence does not con·elate exactly with molar ratios/ number of molecules or the equi11alent by weight or the quantum yields.
There is ve1y extensive reporting in this source of transformation mechanisms occuning at 313 nm. Over 20 separate reaction mechanisms are defined. It is not necessmy to reproduce these here.
5.2 .1 kc p Many pathways of decomposition are identified in the report and no
single overall value of kc is defined.
5.2 .2 l<pE See section 5.2.1
5.2 .3 <pcE Quantwn yields are reported for specific products. These results are presented in Table A7 _3_ 1_3.
Quantum yields are shown in the study to be strongly affected by pressure, with much lower quantum yields at higher pressures. This indicates that reaction will be fastest at higher altitudes.
5.2.4 t 112E Half-life for direct photolysis under atmospheric conditions, is reported in this study as >5 days.
Note:
The authors p oint out in the concluding discussions that photodegradation by hydroxyl radicals will be a much more significant degradation process for acrolein than direct p hotolysis. A half-life for the hydroxyl radical p rocess of 14. 6 hours is reported.
5.3 Conclusion The authors' conclusions with regard to half-life are accepted.
5.3.1 Reliability (2)
Study conducted in accordance with generally accepted scientific principles, possibly with incomplete repo1ting or methodological deficiencies, which do not affect the quality of relevant results
5.3.2 Deficiencies Yes
Only one absorbing frequency was used in the test. OECD Monograph 61 recommends the use of two separate frequencies/wavelengths in separate tests to ensure the quantwn yield is not frequency-dependent.
The repo1t acknowledges this as a potential weakness but indicates that it is not improbable that the results will be independent of wavelength.
The high level of accuracy and reproducibility of the results means that the result is still reliable and useful in itself.
Document IIIA
Baker Petrolite ACROLEIN October 2006
Section A7.3.1(2) Phototransformation in air including identity of
Annex Point IHA VII.5 transformation products
Evaluation by Competent Authorities
Use separate "evaluation boxes" to provide transparency as to the comments and views submitted
EVALUATION BY RAPPORTEUR MEMBER STATE
Date 16/07/2007
Materials and Methods The Applicant' s version is considered acceptable.
R esults and discussion The Applicant' s version is considered acceptable.
Conc.lusion The Applicant' s version is considered acceptable.
Reliability 3
See remarks section below
Acceptability The Applicant's version is considered acceptable.
R emar ks The UK CA believes that the study and summruy are acceptable as supporting evidence only as although the degradation products have been identified there is no quantification of them. Therefore the reliability factor has been reduced to 3. The study was not can-ied out to a specific guideline, but did follow an OECD Environmental Monograph 61 ru1d is scientifically justified.
The study is used as supporting evidence to Doc IIIA, A7.3.l (1), with respect to the transfonnation products of acrolein during photolysis in air. The study summarised in Doc IIIA, A 7.3.1 (1) states an acrolein half-life of 10.9 d, under experimental conditions. This study suppo11s the ti·ru1sfonnation pathway only and therefore, for the environmental risk assessment, a full evaluation is not required.
COMMENTS FROM ... (specify)
Date Give date of comments submitted
Materials and Methods Discuss additional relevant discrepancies referring to the (sub)heading numbers and to applicant's summmy and conclusion. Discuss if deviating from vie111 of rapporteur member state
Results and discussion Discuss if deviating from vie111 of rapporteur member state
Conc.lusion Discuss if deviating from vie111 of rapporteur member state
R eliability Discuss if deviating from vie111 of rapporteur member state
Ac.ceptability Discuss if deviating from vie111 of rapporteur member state
R emarks
Document IIIA
Baker Petrolite ACROLEIN October2006
Figure 1: UV absorption spectrum of acrolein
Document IIIA
Baker Petrolite ACROLEIN October2006
Table A7_3_1-1: Description of test atmosphere and controls
Criteria Details Purity of atmosphere Oxygen and nitrogen obtained from Linde (Union Carbide Corp.) at 99.99% and
99.998% purity respectively.
Preparation of test chemicals
Acrolein purified by repeat distillation on the vacuum line and further purification by GC. Aliquots analysed by FID-GC (Porapak P/Q) showed no impurity detected. Minimum purity estimated 99.9%
Test concentrations (mg a.s./m3)
1.39% acrolein in synthetic air (% by volume or weight not stated)
Temperature (°C) Temperatures 22.3-25.8°C across 11 experimental runs
Pressure (Pa) For all experimental runs, acrolein was tested at a pressure of 0.355 Torr (ca. 50 Pa) acrolein in a synthetic air, comprising ca. 20% O2 and 80% N2
The main experiment (Run 7F) conducted at 25.607 Torr (3414 Pa).
Preparation of a.s. test atmosphere
Atmosphere preparation not described in report.
Controls None.
Actinometer Two actinometers used, azomethane (CH3CN=NCH3) and acetone (O2-free). Products are N2 and CO respectively.
Actinometer data are not presented in report. It is reported that the data indicate accuracy to within 10% and reproducibility better than ± 5% for the acrolein experiment.
Internal standard Argon was used as internal standard, to establish normalised molar ratios of products.
Mole fraction Argon in run 7F: 1.3982E-03
Document IIIA
Baker Petrolite ACROLEIN October2006
Table A7_3_1-2: Description of test system
Criteria Details
Laboratory equipment The internal optical path of the reaction cell was 155.8 cm with Suprasil windows fitted at the two ends. The windows were fitted so as to protrude inside the reaction cell, precluding any temperature disparity between the windows and the interior.
Test apparatus The test system comprised a vacuum line connected to the reaction cell, with direct outflow to a Varian model 2700 gas chromatograph.
The vacuum line was comprised of five sections: storage, high vacuum/reference, measurement, calibration/mixture preparation, distillation.
Light passed from a UV light source (see below), via shutter and monochromator, through a window into a reaction cell. The reaction cell was connected to the vacuum system and featured photomultiplier tube, sampling reservoir, gas piston and outlet to GC analysis.
The sample chamber was sealed from the reaction cell and its contents cryogenically fractionated and/or expanded into the gas piston, a spiral tube 118 cm long and 2.5 cm in diameter. Helium gas at greater than 1 atmosphere pressure was introduced and the sample is compressed into a ‘plug’ which enters the sample loop.
The sample loop was re-evacuated using Carle sampling valves, controlled by Hewlett Packard 3390A computer/recorder.
Detection/analysis was by gas chromatography equipped with flame ionisation detector and thermal conductivity detector. The carrier gas is Helium (99.99% pure). Column conditions are described in the report but it is not necessary to reproduce the details here.
Properties of artificial light source:
High pressure mercury arc lamp (OSRAM HBO 500 W/2) enclosed in Oriel C-60-51 lamp housing with quartz collimating lens.
A narrow band interference filter (313 nm) enclosed in metal housing is introduced into the optical train to isolate initiating wavelength. Alternatively a Jarrell-Ash grating monochromator is inserted between the lamp housing and photolysis cell.
A spectrum of the mercury arc lamp taken using a Varian/Cary 219 grating spectrophotometer is presented in the report. This is not reproduced here.
Document IIIA
Baker Petrolite ACROLEIN October2006
Table A7_3_1_3: Specification of transformation products, abundance data and quantum yields
CAS-Number
CAS and/or IUPAC Chemical Name(s)
Normalised mean
molar ratio
Number of molecules
from normalised mean molar
ratio
Molar ratios
normalised wrt. acrolein
lost 1
Molar ratios in terms of carbon atoms,
normalised wrt. acrolein
lost 1
Quantum yields
630-08-0 Carbon Monoxide (CO)
1.630 8.936 E+18 0.857 0.857 0.0674
124-38-9 Carbon dioxide (CO2)
0.244 1.338 E+18 0.128 0.128 0.0101
74-85-1 Ethylene or Ethene (C2H4)
1.260 6.908 E+18 0.663 1.326 0.0521
50-00-0 Formaldehyde or Methanal (HCHO)
0.3417 1.873 E+18 0.180 0.180 0.0141
7732-18-5 Water (HOH) 1.494 8.190 E+18 0.786 - 0.0618
1 – Product molar ratios normalised with respect to Acrolein loss: figures calculated by reviewer. Normalised mean molar ratios, number of molecules and quantum yield figures copied directly from Gardner et al., 1986.
Document IIIA
Bake1· Petrolite
Section A7.3.2 Annex Point IIIA XIl.3
Othe1· existing data [ )
Limited exposure [ X )
Detailed justification:
Undertaking of intended data submission [ )
Date
Evaluation of applicant's justification
Conclusion
Remarks
Date
Evaluation of applicant's justification
Conclusion
ACROLEIN Dec embel"2005
Fate and behaviour in air, further studies
JUSTIFICATION FOR NON-SUBMISSION OF DATA
Technically not feasible [ )
Other justification [ )
Scientifically unjustified [ X )
Acrolein is a highly volatile active substance (VP= 31920 Pa at 25°C) and undergoes volatilisation readily in water (A 7 .2.1 ) and therefore would be released to air under general use conditions. However, the active substance is applied via a closed system from sealed containers. If there was any release to the environment it would be via the aqueous environment where the substance undergoes rapid degradation by physico-chemical processes including rapid volatilisation (A 7.2.1) and photodegradation (A7. l .1. l .2) and microbial degradation in water (anaerobic and aerobic freshwater-sediment radio-labelled studies, A7. l.2. l. l and A7. l.2.1.2) transfo1ming the active substance to C02. The application system and containers are neutralised by purging with nitrogen gas followed by flushing of the system with methanol before opening to prevent vapour release (A2.10.l.2 Confidential infonnation). The use pattem would lead to negligible exposure to air, therefore it is considered that studies in addition to the estimation of photolysis rate in air and the identification of the degradation products (Section A7.3.l, Annex Point IIIA, VII.5), are not necessary.
Evaluation by Competent Authorities
Use separate "evaluation boxes" to provide transparency as to the comments and views submitted
EVALUATION BY RAPPORTEUR MEMBER STATE
19/05/2006
The Applicant's version is acceptable noting the following;
Official use only
x
X: The UKCA considers the justification to be acceptable due to limited exposure only. It is not considered to be scientifically unjustified. This issue is addressed in Doc IIC.
Acceptable
COMMENTS FROM OTHER MEMBER STATE (specify)
Give date of comments submitted
Discuss if deviatingf/'Om view of rapporteur member state
Discuss if deviatingf/'Om view of rapporteur member state


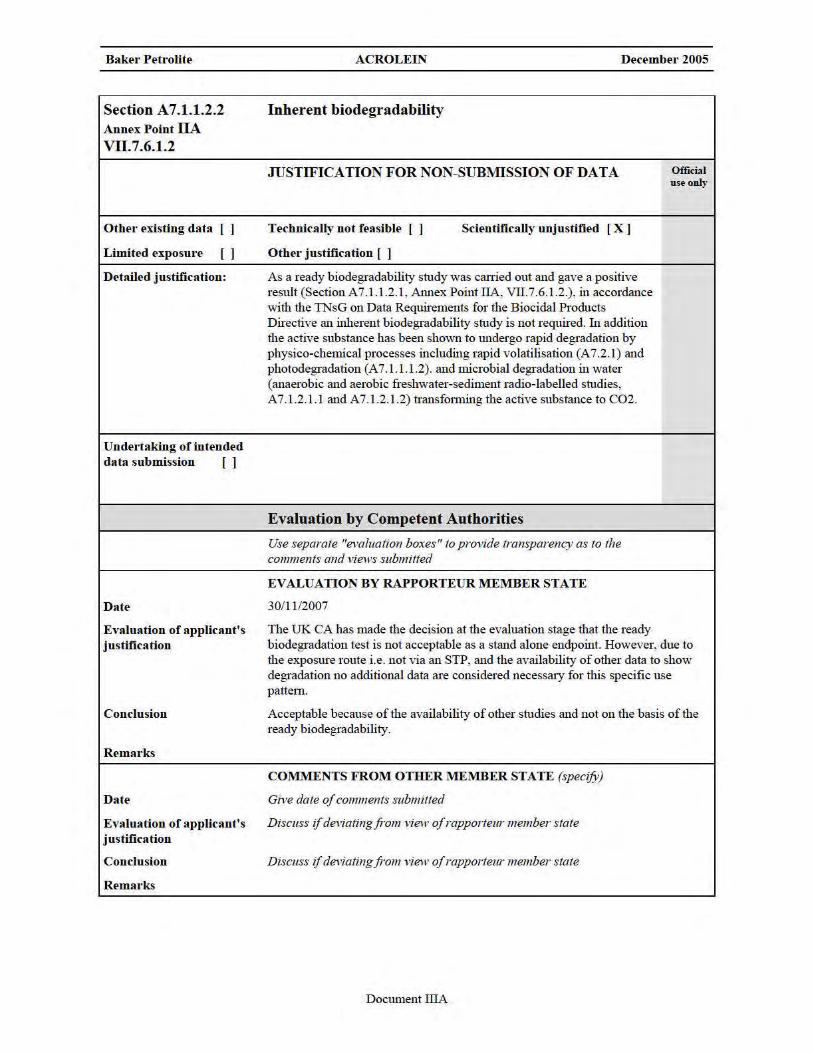


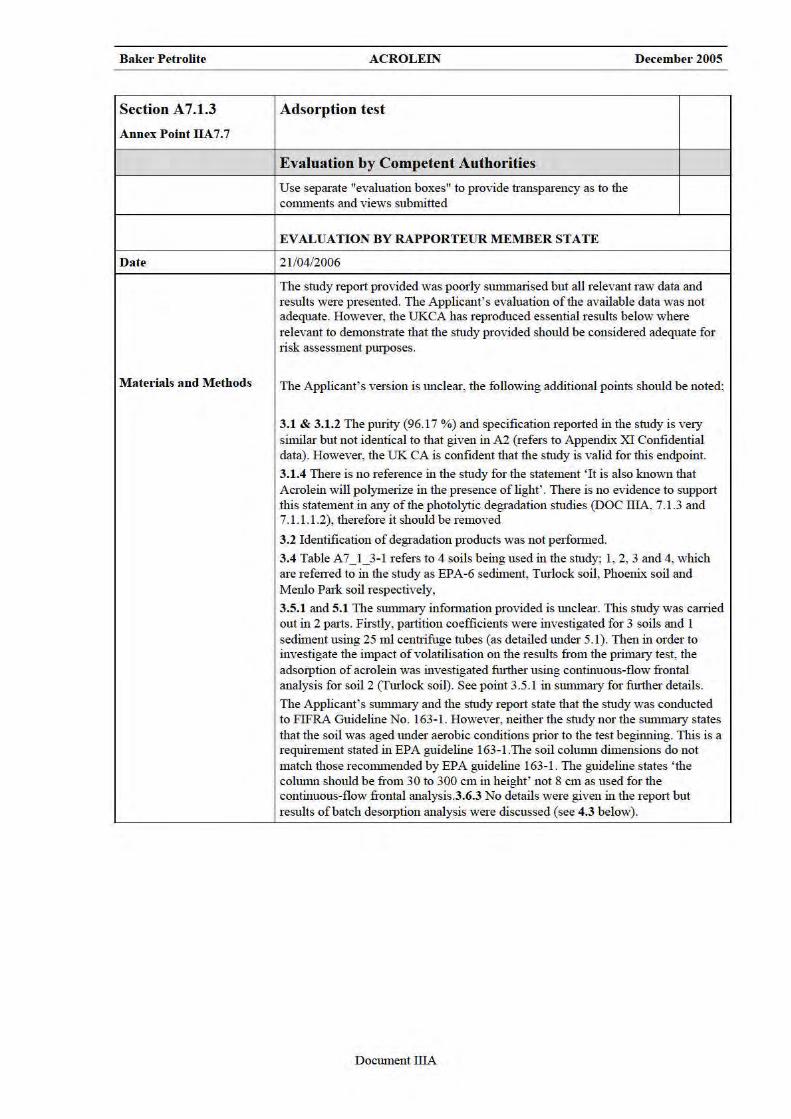


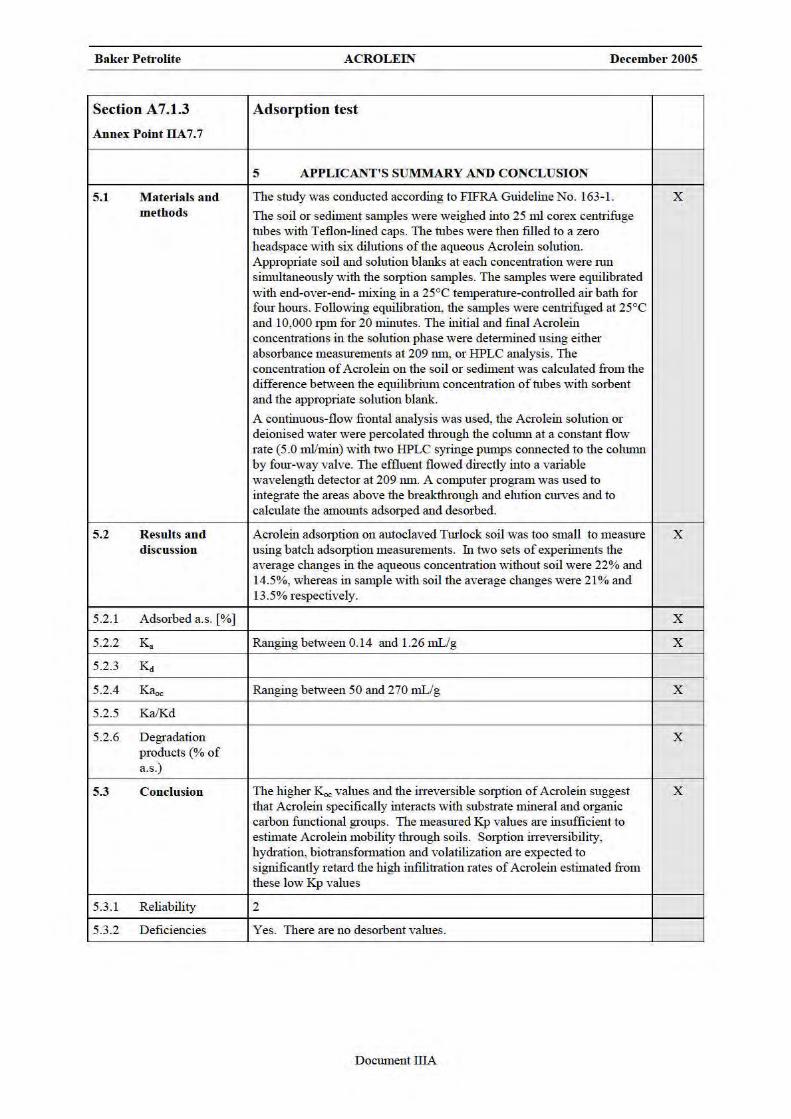

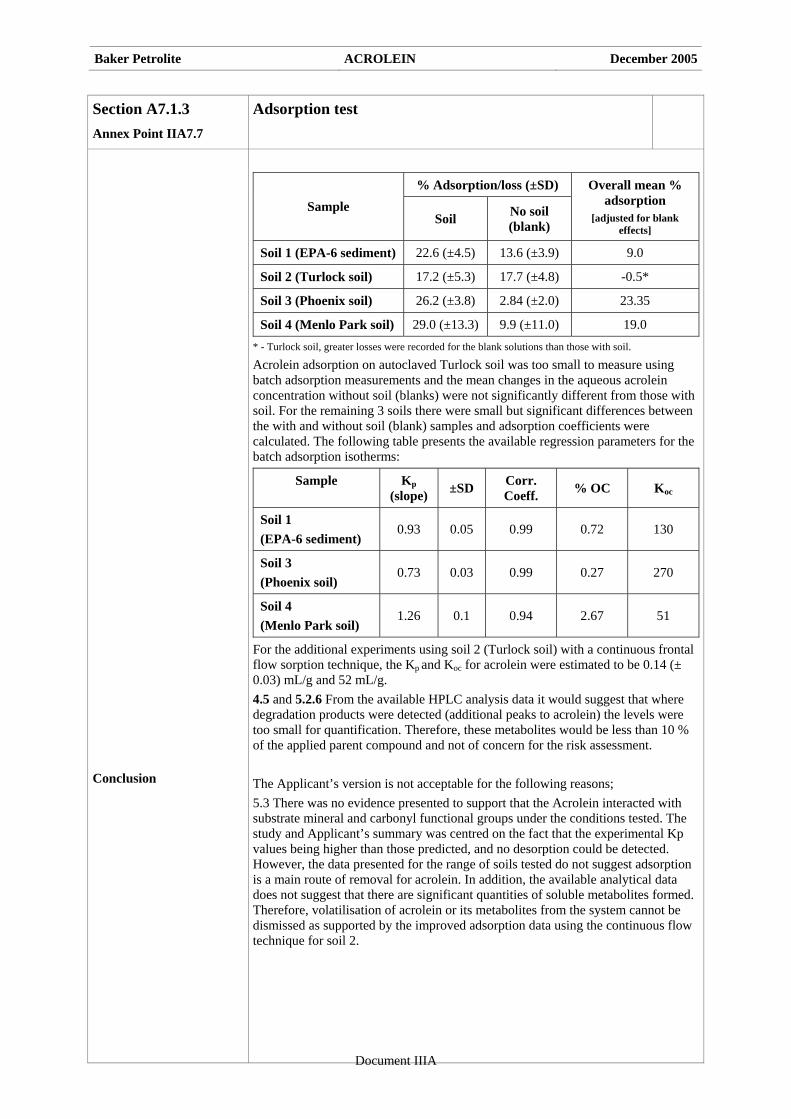


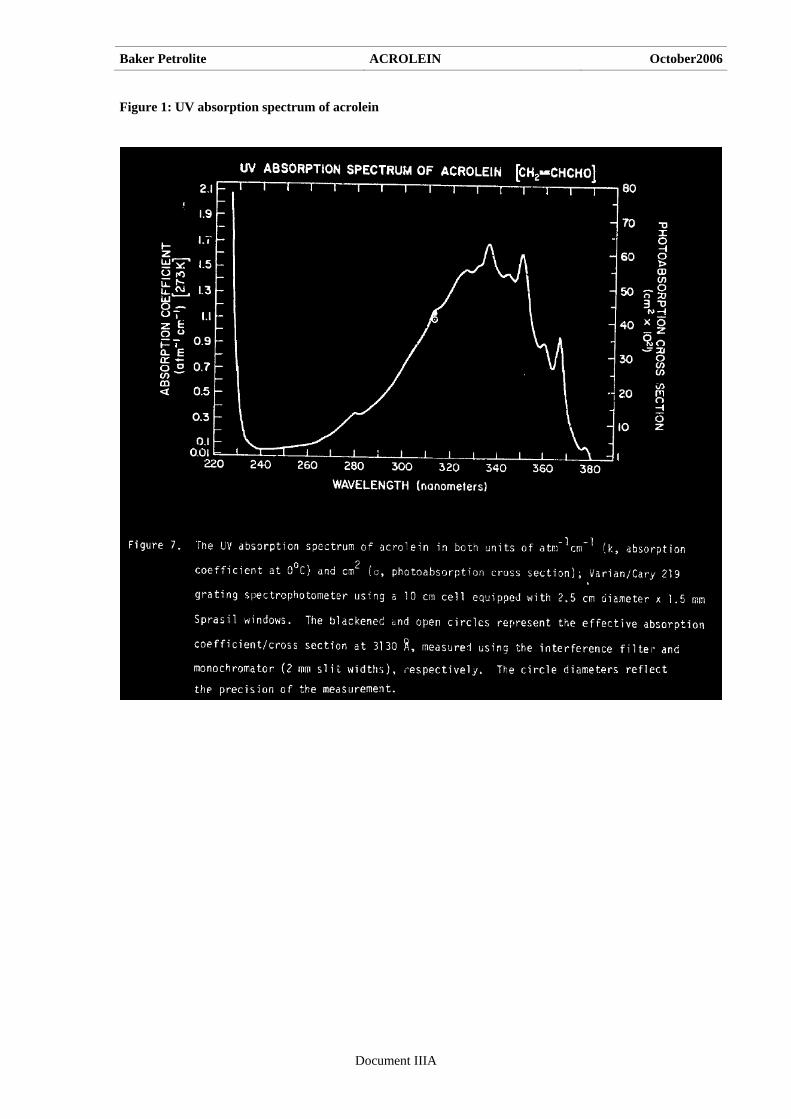


![Designofbackfillassupportin PolishCoalMines - SAIMM · pipelineP(lp,hp),theequationforpressurecan bepresentedas v2 Hpmg=Pp+hpp mg+-Lpm 2 k +I.t1.pJi i=1 [3] [1] where:H=totaldepthofthepipeline](https://static.documents.pub/doc/80x56/5cf97b8088c99315288c5755/designofbackfillassupportin-polishcoalmines-saimm-pipelineplphptheequationforpressurecan.jpg)
