July 2013 29 Advanced Water Purification Facility Findings Comprehensive water quality program at the AWP Facility included more than 9,000 tests at various points in the treatment process for 342 different chemical constituents, microbial constituents, and water quality parameters. Water quality of the purified water was compared to regulatory limits, verifying that purified water met all applicable water quality standards. This comprehensive water quality testing shows that the purified water produced at the AWP Facility is very pure – approaching distilled water quality. Operational data gathered during the 12 month testing period verified continuous and daily monitoring of each water purification process can assure the integrity of the process and that only the highest quality water is produced. The AWP Facility produced purified water using the same processes as a potential full-scale facility. Section B: Advanced Water Purification Facility The City recognizes the importance of developing a thorough understanding of the technology, operations, and quality of purified water prior to moving forward with construction of a full-scale AWP facility. In addition, CDPH required the City to demonstrate the ability of the water purification process to produce purified water suitable for addition to San Vicente Reservoir prior to issuing concept approval for a reservoir augmentation project at San Vicente Reservoir. To this end, the City installed and operated a demonstration-scale facility, referred to as the AWP Facility. An integral component of the Demonstration Project, the AWP Facility generated valuable information that will aid the City in selecting specific process equipment, understanding the quality of water that would be produced by a full-scale AWP facility, securing regulatory approval, and estimating full-scale AWP facility costs, should the City decide to move forward with construction of a full-scale AWP facility. This section describes the characteristics and performance of the AWP Facility. Additional information on the AWP Facility can be found in AWP Facility Study Report (CDM Smith and MWH 2013a). City of San Diego Water Purification Demonstration Project
Transcript
July 2013 29
Advanced Water Purification Facility Findings
Comprehensive water quality program at the AWP Facility included more than 9,000 tests at various points in the treatment process for 342 different chemical constituents, microbial constituents, and water quality parameters. Water quality of the purified water was compared to regulatory limits, verifying that purified water met all applicable water quality standards. This comprehensive water quality testing shows that the purified water produced at the AWP Facility is very pure – approaching distilled water quality.
Operational data gathered during the 12 month testing period verified continuous and daily monitoring of each water purification process can assure the integrity of the process and that only the highest quality water is produced.
The AWP Facility produced purified water using the same processes as a potential full-scale facility.
Section B: Advanced Water Purification Facility
The City recognizes the importance of developing a thorough understanding of the technology, operations, and quality of purified water prior to moving forward with construction of a full-scale AWP facility. In addition, CDPH required the City to demonstrate the ability of the water purification process to produce purified water suitable for addition to San Vicente Reservoir prior to issuing concept approval for a reservoir augmentation project at San Vicente Reservoir.
To this end, the City installed and operated a demonstration-scale facility, referred to as the AWP Facility. An integral component of the Demonstration Project, the AWP Facility generated valuable information that will aid the City in selecting specific process equipment, understanding the quality of water that would be produced by a full-scale AWP facility, securing regulatory approval, and estimating full-scale AWP facility costs, should the City decide to move forward with construction of a full-scale AWP facility.
This section describes the characteristics and performance of the AWP Facility. Additional information on the AWP Facility can be found in AWP Facility Study Report (CDM Smith and MWH 2013a).
City of San Diego Water Purification Demonstration Project
July 2013 30
What is the AWP Facility?
The main purpose of the AWP Facility was to demonstrate the expected performance of a potential full-scale AWP facility prior to investing in and constructing the larger facility. Demonstration facilities such as the AWP Facility generate valuable information to guide full-scale facility planning and design, support permitting, and confirm the ability of potential full-scale facilities to meet project objectives.
The AWP Facility was designed, installed, operated, and tested between September 2010 and July 2012, as shown graphically in Figure B-1. AWP Facility start-up occurred over a one-and-a-half month period (mid-June 2011 through the end of July 2011), and facility testing spanned the following one year (August 2011 through July 2012). This section summarizes results and conclusions from that test period. Although the testing period is complete, the AWP Facility continues to operate for public tours and to gather additional equipment performance data. More information on public tours conducted at the AWP Facility is included in Section E.
Figure B - 1: AWP Facility Schedule
The AWP Facility produces one mgd of purified water using the same process components and multiple barrier strategy as those currently implemented at the 70 mgd GWRS, which has been operated by the Orange County Water District since 2008.
The AWP Facility provided a venue for conducting tours and educating the public on water purification processes. The facility layout accommodated public viewing and included signage and other visual aids to explain the water purification processes.
The water treated by the AWP Facility was recycled water from North City. No purified water was sent from the AWP Facility to San Vicente Reservoir during the Demonstration Project. All purified water produced at the AWP Facility was returned to the existing North City recycled water system and used for irrigation and industrial purposes.
July 2013 31
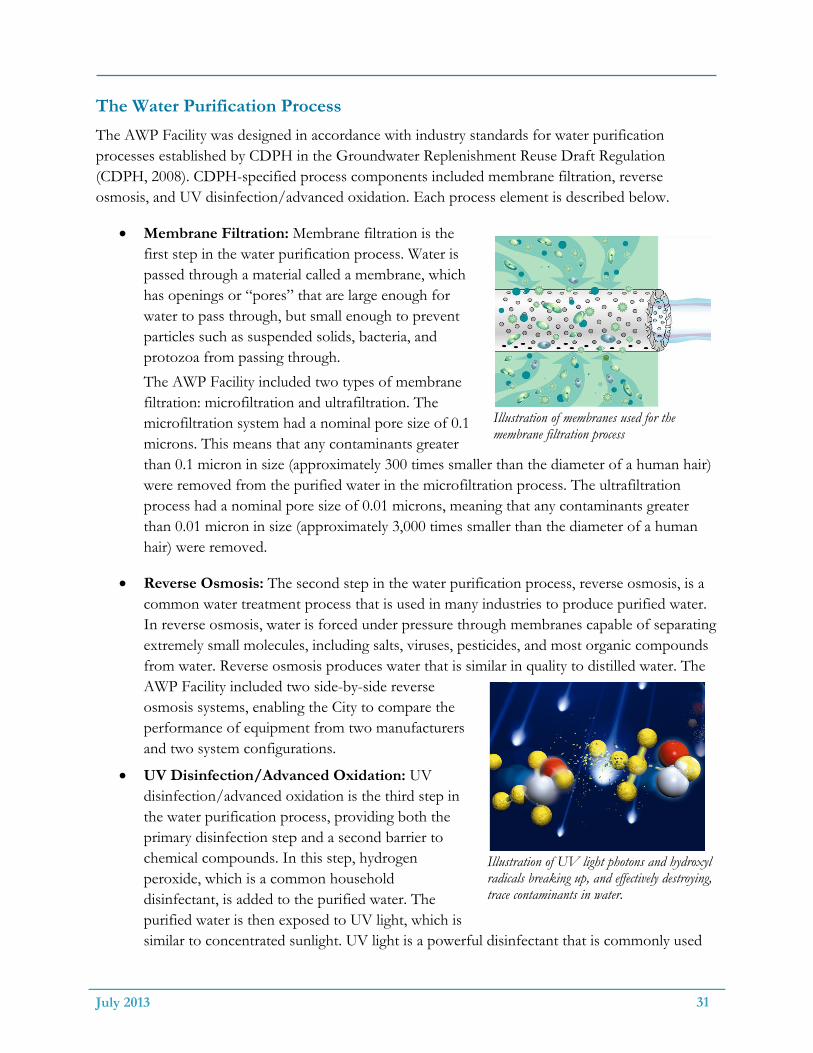
Illustration of membranes used for the membrane filtration process
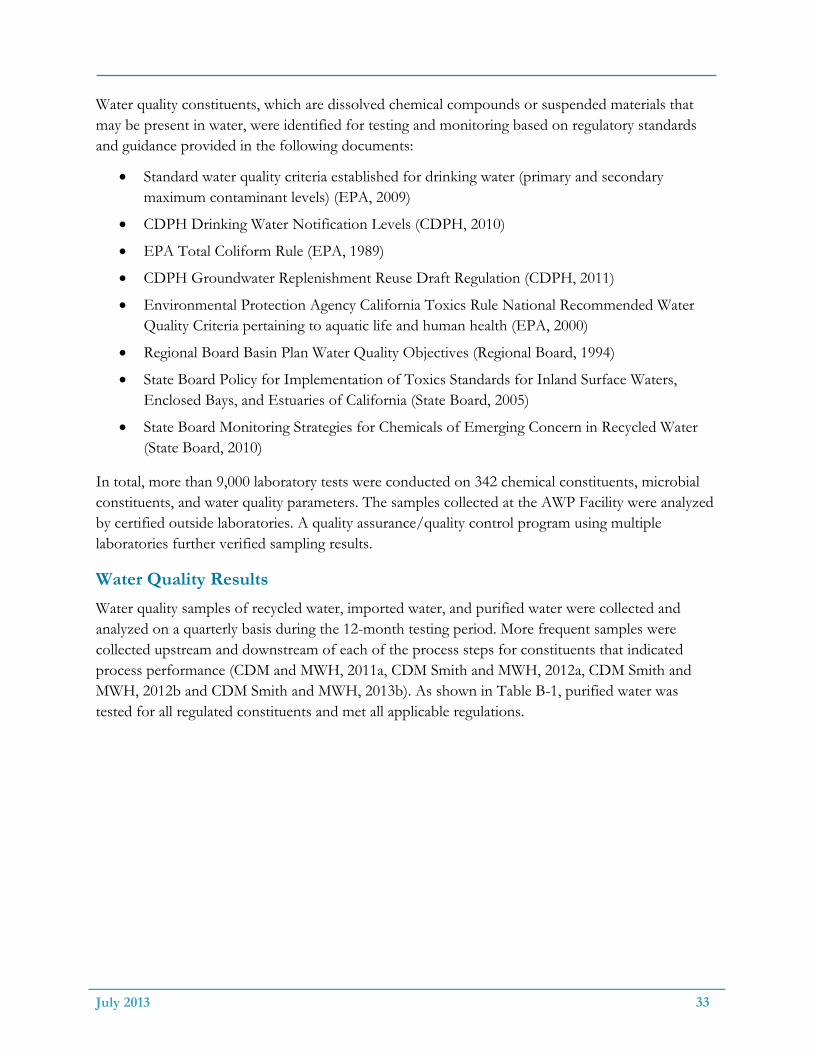
Illustration of UV light photons and hydroxyl radicals breaking up, and effectively destroying, trace contaminants in water.
The Water Purification Process
The AWP Facility was designed in accordance with industry standards for water purification processes established by CDPH in the Groundwater Replenishment Reuse Draft Regulation (CDPH, 2008). CDPH-specified process components included membrane filtration, reverse osmosis, and UV disinfection/advanced oxidation. Each process element is described below.
Membrane Filtration: Membrane filtration is the first step in the water purification process. Water is passed through a material called a membrane, which has openings or “pores” that are large enough for water to pass through, but small enough to prevent particles such as suspended solids, bacteria, and protozoa from passing through.
The AWP Facility included two types of membrane filtration: microfiltration and ultrafiltration. The microfiltration system had a nominal pore size of 0.1 microns. This means that any contaminants greater than 0.1 micron in size (approximately 300 times smaller than the diameter of a human hair) were removed from the purified water in the microfiltration process. The ultrafiltration process had a nominal pore size of 0.01 microns, meaning that any contaminants greater than 0.01 micron in size (approximately 3,000 times smaller than the diameter of a human hair) were removed.
Reverse Osmosis: The second step in the water purification process, reverse osmosis, is a common water treatment process that is used in many industries to produce purified water. In reverse osmosis, water is forced under pressure through membranes capable of separating extremely small molecules, including salts, viruses, pesticides, and most organic compounds from water. Reverse osmosis produces water that is similar in quality to distilled water. The AWP Facility included two side-by-side reverse osmosis systems, enabling the City to compare the performance of equipment from two manufacturers and two system configurations.
UV Disinfection/Advanced Oxidation: UV disinfection/advanced oxidation is the third step in the water purification process, providing both the primary disinfection step and a second barrier to chemical compounds. In this step, hydrogen peroxide, which is a common household disinfectant, is added to the purified water. The purified water is then exposed to UV light, which is similar to concentrated sunlight. UV light is a powerful disinfectant that is commonly used
July 2013 32
to disinfect medical and dental equipment.
Advanced oxidation is achieved when UV light breaks chemical bonds and converts hydrogen peroxide into reactive particles known as hydroxyl radicals. These hydroxyl radicals destroy low molecular weight contaminants such as 1,4-dioxane that are known to penetrate the reverse osmosis membrane. In this way, advanced oxidation destroys trace contaminants that may have passed through the reverse osmosis process. The hydroxyl radicals are combined into other molecules in this process and do not persist in the purified water.
AWP Facility Testing Approach
A formal Testing and Monitoring Plan was prepared at the outset of the Demonstration Project with oversight and input from both the IAP and regulatory agencies (CDM and MWH, 2011a). This comprehensive Testing and Monitoring Plan was designed to achieve the following objectives:
1. Validate the overall performance of the water purification process in meeting regulatory requirements.
2. Demonstrate that continuous and daily monitoring of each water purification process can assure the integrity of the process and that only the highest quality water is produced.
AWP Facility Purification Process
The AWP Facility purification process included membrane filtration, reverse osmosis, andultraviolet disinfection/advanced oxidation. This purification process is being successfullyused by multiple other projects currentlyoperatingin California,includingOrange County’sGWRS.
Water quality constituents, which are dissolved chemical compounds or suspended materials that may be present in water, were identified for testing and monitoring based on regulatory standards and guidance provided in the following documents:
Standard water quality criteria established for drinking water (primary and secondary maximum contaminant levels) (EPA, 2009)
CDPH Drinking Water Notification Levels (CDPH, 2010)
Environmental Protection Agency California Toxics Rule National Recommended Water Quality Criteria pertaining to aquatic life and human health (EPA, 2000)
Regional Board Basin Plan Water Quality Objectives (Regional Board, 1994)
State Board Policy for Implementation of Toxics Standards for Inland Surface Waters, Enclosed Bays, and Estuaries of California (State Board, 2005)
State Board Monitoring Strategies for Chemicals of Emerging Concern in Recycled Water (State Board, 2010)
In total, more than 9,000 laboratory tests were conducted on 342 chemical constituents, microbial constituents, and water quality parameters. The samples collected at the AWP Facility were analyzed by certified outside laboratories. A quality assurance/quality control program using multiple laboratories further verified sampling results.
Water Quality Results
Water quality samples of recycled water, imported water, and purified water were collected and analyzed on a quarterly basis during the 12-month testing period. More frequent samples were collected upstream and downstream of each of the process steps for constituents that indicated process performance (CDM and MWH, 2011a, CDM Smith and MWH, 2012a, CDM Smith and MWH, 2012b and CDM Smith and MWH, 2013b). As shown in Table B-1, purified water was tested for all regulated constituents and met all applicable regulations.
July 2013 34
Table B - 1: Water Quality –Regulated Constituent Results
Regulations / Guidelines Number of
Constituents
Purified Water Results
California Department of Public Health Goals Primary Drinking Water Maximum Contaminant Levels (MCLs) 1
90 Meets All Regulations
Secondary Drinking Water MCLs2 18 Meets All Regulations Microbial3 4 Not Detected Notification Levels4 30 Meets All Regulations Groundwater Replenishment Criteria5 142 Meets All Regulations
State Board Goals for Reservoir Augmentation at San Vicente Reservoir (projected) San Vicente Reservoir Limits6 143 Meets All Regulations Total7 231 Footnotes: 1. Primary drinking water MCLs are enforceable, human health‐based water quality limits. 2. Secondary drinking water MCLs are unenforceable water quality goals related to aesthetic water
characteristics such as taste and odor. Purified water met all Federal and State Secondary MCLs with the exception of pH and corrosivity. The potential full‐scale AWP facility would include post treatment to meet these requirements.
3. Total Coliform, Fecal Coliform, and Viruses (Somatic and Male Specific Bacteriophage) 4. Notification levels are drinking water quality advisory limits. 5. Groundwater Replenishment Criteria are water quality limits specifically developed for indirect potable
reuse via groundwater replenishment. 6. Reservoir limits are EPA Numeric Criteria for Priority Pollutants and San Diego Basin Numeric Objectives. 7. Because some contaminants and parameters are in multiple regulations / guidelines the total of unique
parameters is less than the sum.
Relevant unregulated constituents were also measured, including 30 constituents listed in the EPA Unregulated Contaminant Monitoring Rule 3, 90 CECs (pharmaceuticals, and other products typically found in treated wastewater), six nitrosamines, three radionuclides, and lithium.3 Accounting for overlap, this totals 111 unique additional unregulated constituents. Of these, six constituents were detected in the purified water during at least one sampling event; that is to say, the constituent was detected at a level that the laboratory was able to determine a numerical concentration. In comparison, 21 constituents were detected in the imported aqueduct water during at least one sampling event.
The six constituents detected in the purified water are: Bromochloromethane, used in fire-extinguishing fluid; Chromium (VI), formed by oxidation of chromium (III) in the advanced oxidation process; Strontium, a naturally occurring metal and dietary supplement; Acesulfame-K, a widely used artificial sweetener; Iohexal, a contrasting agent used in X-ray procedures; and
3 The Unregulated Contaminant Monitoring Rule 3 (UCMR 3) was signed by EPA Administrator, Lisa P. Jackson on April 16, 2012. UCMR 3 will require public water systems to monitor for up to 30 potential drinking water contaminants. Additional information can be found at: http://water.epa.gov/lawsregs/rulesregs/sdwa/ucmr/ucmr3/index.cfm
July 2013 35
Integrity testing and water quality monitoring confirmed that the advanced water purification processes are functioning properly.
Triclosan, an antibacterial agent used in hand soap and toothpaste. Since these non-regulated constituents do not have regulatory limits, the best way to determine the significance of measured concentrations is to compare them to the constituent’s Drinking Water Equivalent Level (DWEL) or the EPA indentified Health Reference Level. The DWEL and Health Reference Levels both represent an acceptable concentration in drinking water assuming an average person consumes two liters of water per day for 70 years. The measured concentration of these six constituents in the purified water were 10 million times to 18 times lower than associated DWELs and Health Reference Levels.
In general, water quality testing shows that the purified water is approaching distilled water purity. For example, TDS (a measure of salt content) in the purified water is about 15 mg/L, compared to TDS in San Diego’s source water and drinking water of about 500 mg/L. As a second example, TOC (a measure of carbon that is bound in organic molecules) in the purified water is about 0.1 mg/L compared to a TOC of 3.0 mg/L in San Diego’s source water and 2.5 mg/L in San Diego’s drinking water (City of San Diego, 2012a, City of San Diego, 2012g).
For detailed information regarding water quality and other data collected and analyzed for the Demonstration Project, please refer to Quarterly Testing Report No. 4 for the AWP Facility, which is included in the References section of this Project Report.
Integrity Testing and Monitoring
Verifying the integrity and reliability of each water purification process was critical to assure that only the highest quality water is produced by the AWP Facility. Integrity testing uses both mechanical tests and routine water quality sampling to verify that equipment is functioning properly. Integrity monitoring consists of continuous and daily measurements at critical points in the treatment process. During the 12-month testing period, a critical control-point monitoring plan was implemented to identify any changes in performance of the treatment processes that could adversely impact final water quality. Examples of the techniques used to assure reliable performance are illustrated in Table B-2.
Integrity monitoring and critical control point monitoring showed that the AWP Facility equipment remained intact, met the intended treatment performance on a continuous basis, and was reliable throughout the operational period (CDM and MWH, 2013a). During the design phase of a full-scale AWP facility, the City would develop a similar online monitoring and response plan to provide sufficient features and assurances that any foreseeable malfunction could be promptly identified and appropriate responses promptly applied. Overall, the results of both integrity testing and monitoring verified that the purification processes met their intended treatment performance levels on a continuous basis.
July 2013 36
Table B - 2: Summary of Advanced Water Purification Process Integrity Monitoring
Critical Control Point
Critical Limit Parameter
Monitoring Frequency Results
Membrane Filtration Pressure Decay1 Once per day
Results showed that both membrane filtration systems remained intact over
the testing periods.
Reverse Osmosis (RO)
TOC2, Conductivity3
Continuous4
Both RO systems achieved consistent conductivity rejection, and nearly six months of online TOC monitoring showed the combined RO permeate
TOC was consistently below the maximum acceptable level of 0.1 mg/L.
UV Disinfection Reactor Power Level Continuous When any of the 72 lamps or 36 ballasts
failed, system alarms and power levels adjusted as programmed, and water
quality was not affected. UV
Disinfection/ Advanced Oxidation
Hydrogen PeroxideDose Rate/
Continuous Flow Confirmation
Once per day by draw down
Continuous flow confirmation
1. Pressure Decay: The operational integrity of membrane filtration systems can be tested by a pressure decay test, which measures the rate of pressure decay (drop) across a membrane over a specified period of time. A sharp drop in pressure can alert operators to a potential defect or leak in the membrane filtration system.
2. TOC is the amount of carbon present in the water, and includes all natural and man‐made organic chemicals.
3. Conductivity is the ability to conduct or transmit electricity. Conductivity of water increases with the concentration of dissolved ions, so measuring conductivity provides a measure of the concentration of dissolved ions in water.
4. The term “continuous” may also apply to measurements that are taken frequently (example: every four minutes) and automatically whenever the process is in production.
Performance Indicator Monitoring
The AWP Facility testing also included performance indicator monitoring to determine if any constituents could be used to indicate the treatment efficiency of the reverse osmosis and UV/advanced oxidation processes. Many of the constituents monitored at the AWP Facility were removed by the reverse osmosis to levels at or below quantifiable limits, demonstrating strong performance of the reverse osmosis process. Therefore, identifying usable performance indicators to accurately measure advanced oxidation removal was a challenge.
Sixteen constituents were monitored as performance indicators, and removal generally exceeded 95 percent within the reverse osmosis process when sufficient quantities were present to calculate removals. In some cases, greater than 99.9 percent removal was observed.
Indicator compounds, such as TOC (a measure of carbon bound in organic molecules), conductivity (ability to conduct electricity which corresponds to salt content), monochloramines (a mild disinfectant used to prevent microbial growth in drinking water), and UV 254 (a measure of absorbance of light of a particular wave length as it passes through water), may prove to be more
July 2013 37
reliable as CEC removal performance indicators due to their ease of measurement and their reliable presence in the water downstream of both the reverse osmosis and advanced oxidation processes. For the reverse osmosis process, the average removal results were: TOC - 99.6 percent, conductivity - 99.0 percent, and UV254 - 88.8 percent. For the advanced oxidation process, the average removal results were: UV254 - 68.7 percent and monochloramines - 72.8 percent.
Operational Performance
The AWP Facility became fully operational on June 16, 2011. The operation and testing results were presented in quarterly reports over the operating period as summarized in Table B-3 (CDM and MWH, 2011b, CDM and MWH, 2012a, CDM and MWH, 2012b, CDM and MWH, 2013b).
Table B - 3: Operation and Testing Schedule
Testing Period
Testing Quarter
Operating Period Report Date
Test Period Start Test Period End
1 Quarter 1 6/16/2011 10/31/2011 December 2011
2 Quarter 2 11/1/2011 2/10/2012 March 2012
3 Quarter 3 5/11/2012 5/14/2012 June 2012
4 Quarter 4 5/15/2012 7/31/2012 September 2012
The following subsections summarize the operational specifics of the membrane filtration, reverse osmosis, and UV disinfection and advanced oxidation systems (CDM and MWH, 2013a).
Membrane Filtration The membrane filtration equipment used at the AWP Facility included two parallel systems, each treating half of the recycled water entering the AWP Facility. One system used microfiltration membranes, while the second system used ultrafiltration membranes. Although both systems were expected to efficiently remove suspended solids, bacteria, and protozoa as the first step in the multiple barrier process, the smaller pore size of ultrafiltration membranes was expected to provide better removal, but with higher energy usage. Side-by-side testing was performed to determine the feasibility of using either microfiltration or ultrafiltration systems for the full-scale AWP facility. More membrane selection options will allow for more competitive bids on full-scale equipment.
Water quality data demonstrated that both systems consistently produced purified water that met water quality objectives for target constituents. Microbial monitoring confirmed that both membrane systems provide a substantial barrier to pathogenic organisms. Both membranes removed more than 99.9 percent of bacteria and more than 99 percent of viruses. The ultrafiltration membranes provided an increased level of protection against the smallest pathogenic organisms (viruses) due to its smaller pore size. The side-by-side testing showed that the smaller pore size on the ultrafiltration membrane did not result in higher pressure/energy requirements.
July 2013 38
Reverse Osmosis Two reverse osmosis configurations, a two-stage configuration and a three-stage configuration, were tested (shown in Figure B-2). The different configurations were tested to identify any operating advantages that one configuration may have over the other. The two-stage and three-stage configurations were tested at both an 80 percent and an 85 percent recovery rate, where recovery rate refers to the percentage of upstream flow that remains in the downstream flow after the reverse osmosis step. Existing AWP facilities in California typically operate at an 85 percent recovery rate, with approximately half of the plants using two-stage configurations and half using three-stage configurations. The testing showed that both the two-stage and three-stage reverse osmosis configurations could reliably operate at 85 percent recovery. The three-stage configuration did not offer the improved system hydraulics that were anticipated.
Figure B - 2: Reverse Osmosis Configurations Tested at the AWP Facility
Water quality testing of the reverse osmosis membranes focused primarily on expected differences in nitrogen, a nutrient of concern for San Vicente Reservoir. Both reverse osmosis configurations exhibited similar water quality performance. Specifically, both systems showed similar ability to remove salts and nitrates and produced purified water that would meet or exceed regulatory requirements.
The three-stage configuration required eight percent more energy than the two-stage configuration. Based on operational performance, the two-stage configuration provided the basis for a full-scale AWP facility layout and cost estimation conducted as part of the Demonstration Project.
Because reverse osmosis uses semi-permeable membranes that only let the smallest molecules pass through, it requires more pressure and energy than the other treatment processes. Both reverse osmosis configurations were equipped with energy recovery devices designed to optimize the overall energy use of the reverse osmosis system. Energy recovery devices are designed to recover energy between reverse osmosis stages, minimizing energy requirements. Specifically, these devices transfer pressure (and associated energy to create pressure) from one reverse osmosis stage to another, thereby reducing the amount of pressure and energy required for each stage. The energy recovery devices tested for the reverse osmosis process demonstrated that these devices performed
July 2013 39
successfully and resulted in an eight percent overall energy reduction for the two-stage configuration. The full-scale energy savings with energy recovery devices was assumed to be four to seven percent.
Concentrate produced by the reverse osmosis system would be discharged to Point Loma. Ocean discharges from Point Loma have decreased in recent years, and currently average approximately 150 mgd to 160 mgd. At a recovery rate of 85 percent, a reservoir augmentation project at San Vicente Reservoir producing 15 mgd (average production) of purified water would generate approximately 2.6 mgd of concentrate. This would constitute approximately 1.9 percent of the total Point Loma flow, increasing the TDS of the Point Loma ocean discharge by approximately 100 mg/L – which would not have any insignificant effect.
UV Disinfection and Advanced Oxidation During the testing period, the UV disinfection and advanced oxidation system, which includes UV light and hydrogen peroxide, was operated to achieve specific removals of n-nitrosodimethylamine (NDMA) and 1,4-dioxane. These chemicals are used by CDPH as indicator compounds to assess the performance of advanced oxidation since both are difficult to remove and the ability of a process to achieve removal indicates that the process provides a robust barrier to a wide array of chemicals. Although NDMA concentrations are extremely low in North City recycled water as compared to other recycled water sources throughout California and nationwide, percent removal can still provide an indication of advanced oxidation system performance.
Performance results demonstrated that, with an adequate amount of hydrogen peroxide and power applied to the UV system, sufficient contaminant removal was achieved to meet regulatory requirements. Because the excellent disinfection capability of UV/advanced oxidation systems has been well established by other full-scale operations (such as the Orange County GWRS), there was no need to test this system’s disinfection performance as part of the Demonstration Project. Specifically, deactivation of 99.9999 percent of viruses has been demonstrated for this process operating under similar conditions. Throughout the testing period, the UV/advanced oxidation process achieved the target NDMA and 1,4‐dioxane removal rates defined by CDPH (CDPH, 2008; CDPH, 2011).
AWP Facility Findings
Key findings of the AWP Facility include the following.
The water quality testing and monitoring program at the AWP Facility included more than 9,000 tests at various points in the treatment process and imported water aqueduct for 342 different water quality constituents and microbial parameters. Water quality of the purified water was compared to regulatory limits, verifying that purified water met all applicable water quality standards. Further, this comprehensive water quality testing shows that the purified water is pure, approaching distilled water purity.
It was demonstrated that continuous and daily monitoring of each water purification process can assure the integrity of the process and that only the highest quality water is produced.