35
Hydrogen, Fuel Cells, and Infrastructure Technologies FY 2002 Progress Report 265 Section IV. Fuel Cells

Hydrogen, Fuel Cells, and Infrastructure Technologies FY 2002 Progress Report
Section IV. Fuel Cells
265

Hydrogen, Fuel Cells, and Infrastructure Technologies FY 2002 Progress Report
266

Hydrogen, Fuel Cells, and Infrastructure Technologies FY 2002 Progress Report
IV.A Transportation Power Systems
IV.A.1 Atmospheric Fuel Cell Power System for Transportation
Murdo J. SmithUTC Fuel Cells195 Governor’s HighwaySouth Windsor, CT 06074(860) 727-2269, fax:(860) 727-2399, e-mail: [email protected]
DOE Technology Development Manager: Patrick Davis(202) 586-8061, fax: (202) 586-9811, e-mail: [email protected]
ANL Technical Advisor: Walter Podolski(630) 252-7558, fax: (630) 252-4176, e-mail: [email protected]
Objectives• Deliver the following to DOE/Argonne National Laboratory (ANL) for functional demonstration
testing:- A 50 kW-equivalent gasoline fuel processing system- A fully integrated, gasoline-fueled 50 kW proton exchange membrane (PEM) power plant- A fully integrated, gasoline-fueled 75 kW advanced PEM power plant
• Although focused on gasoline operation, the fuel processing system will utilize fuel-flexible reforming technology that can be modified to accommodate fuels such as methanol, ethanol and natural gas
Approach• Deliver and test an autothermal fuel processor• Deliver and test a 50 kW, ambient-pressure integrated power subsystem• Deliver and test a 75 kW advanced ambient-pressure integrated power subsystem
Accomplishments• Delivered and tested a 50 kW-equivalent gasoline fuel processing system• Delivered and tested a 50 kW integrated power plant configured for system verification testing at UTC
Fuel Cells (UTCFC) and delivered the power plant to DOE for follow-on testing at ANL
Future Directions• Completely tear down and analyze the 50 kW power plant• Deliver and test the 75 kW power plant at UTCFC and deliver to DOE for follow-on testing at ANL
267

Hydrogen, Fuel Cells, and Infrastructure Technologies FY 2002 Progress Report
Introduction
The focus of UTCFC’s program is an ambient pressure PEM power plant system operating on gasoline fuel and delivering 75 kW net dc power to the automotive electrical system.
UTCFC will deliver to DOE a 50 kW-equivalent gasoline fuel processing system, a 50 kW PEM power plant, and a 75 kW advanced PEM power plant.
Approach
Figure 1 provides a schematic of the gasoline fuel cell power plant. The major subsystems include the Fuel Processing Subsystem, the Power Subsystem and the Balance of Plant. The Balance of Plant includes the Thermal Management Subsystem, the Air and Water Subsystems and the Controller and associated electrical equipment.
Results
50 kW Power Plant
Figures 2 and 3 are photographs of the fully integrated 50 kW, ambient pressure, gasoline-fueled power plant showing the locations of major components.
The power plant was installed for demonstration testing at UTCFC’s facilities in South Windsor, Connecticut. A California Phase II reformulated gasoline (RFG) fuel was used throughout the test program.
A summary of the demonstrated system characteristics is shown in Table 1.
Table 2 provides selected comparative DOE Technical Targets for a 50 kWe (net) integrated fuel cell power system operating on Tier 2 gasoline containing 30 ppm sulfur.
Comparing the two tables, the UTCFC power plant demonstrated an efficiency level close to the DOE “2001 status” for 25% of rated power but was lower at rated power. The volume and weight numbers are significantly different, with the UTCFC power plant being larger and heavier.
Figure 1. Power Plant Schematic
Figure 2. 50 kW Gasoline Fueled Power Plant – side view
Figure 3. 50 kW Gasoline Fueled Power Plant – end view
268

Hydrogen, Fuel Cells, and Infrastructure Technologies FY 2002 Progress Report
Following testing at UTCFC, the power plant was delivered to DOE’s Argonne National Laboratory. Figure 4 shows the power plant installed in the ANL test facility. Testing at ANL included steady-state and transient operation and provided experience in the new test facility.
The power plant has been returned to UTCFC after completion of the ANL test program. It will be torn down and specific components analyzed to better understand the impact of operation on their physical characteristics. These analyses will focus on the cell stack and fuel processing system.
75 kW Power Plant
In the second phase of the project, UTCFC will deliver to DOE an advanced 75 kW, gasoline-fueled PEM fuel cell power plant. This power plant will address opportunities for distributing components throughout the automobile structure.
Conclusions
A fully-integrated, ambient-pressure, 50 kW PEM power plant was assembled and tested at UTCFC and then delivered to ANL for follow-on testing. The power plant has been returned to UTCFC for teardown and analysis. Under Phase 2 of the project, UTCFC will deliver to DOE an advanced 75 kW gasoline-fueled ambient pressure PEM power plant.
Characteristic Anticipated Demonstrated
Rated net power ≥50 kWe 53 kWe
Efficiency at 50 kWe
--- 25%
Efficiency at 25% rated power
≥32% 32%
Specific power based on wet weight
1550 lbs. 1825 lbs.
Power density ft3 kW
28.5 ft3 30.7 ft3
Fuel compatibility CA Phase II RFG
CA Phase II RFG
Start time to full power
45 min. >45 min.
Voltage range ≤220 voltage ≤400 Vdc
≤250 voltage ≤420 Vdc
Table 1. Power Plant System Characteristics
Characteristic Units 2001 Status
2005 2010
Energy Efficiency @ rated power
% 31 33 35
Energy Efficiency @25% of rated power
% 34 40 45
Power Density W/L 140 250 325
Specific Power W/kg 140 250 325
Table 2. DOE Fuel Cell Power System Technical Targets
Figure 4. 50 kW power plant installed in ANL test facility
269

Hydrogen, Fuel Cells, and Infrastructure Technologies FY 2002 Progress Report
IV.A.2 Fuel Cell Systems Analysis
Romesh Kumar (Primary Contact), Rajesh Ahluwalia, E. Danial Doss, and Michael KrumpeltArgonne National Laboratory9700 South Cass AvenueArgonne, IL 60439-4837(630) 252-4342, fax: (630) 252-4176, e-mail: [email protected]
DOE Technology Development Managers: JoAnn Milliken: (202) 586-2480, fax: (202) 586-9811, e-mail: [email protected] Garland: (202) 586-5673, fax: (202) 586-9811, e-mail: [email protected]
Objectives• Identify key design parameters and operating efficiencies of direct hydrogen and reformed gasoline-
fueled automotive fuel cell systems.• Assess design-point, part-load, and dynamic performance of automotive fuel cell systems and system
components.
Approach• Develop, document, and make available an efficient, versatile system design and analysis code.• Develop models of different fidelity (mechanistic detail) for fuel cells, stacks, and balance-of-plant
components, such as reactors, condensers, and radiators.• Apply models and modeling to issues of current interest as they evolve.
Accomplishments• Developed new models:
- An application package for the analysis of kinetic data from microreactors;- A generic model for metal hydrides, including kinetics with heat transfer;- A model for a desulfurizer based on zinc oxide sorbent; and- A kinetic model for the autothermal reforming of iso-octane using the Argonne catalyst.
• Developed a variety of GCtool-ENG models of fuel cell system components based on GCtool architecture for the speed and accuracy appropriate for fast transients in vehicle simulations by PSAT and similar MATLAB-based models.
• Working with DOE and others, developed R&D targets for the direct hydrogen fuel cell systems and components.
• Analyzed an 80-kW pressurized direct hydrogen system for efficiency and for heat and water management in an SUV application.
Future Directions• Validate models with data from the Nuvera fuel processor system.• Analyze the performance of ambient-pressure direct-hydrogen systems.• Analyze reformed liquid-fueled systems on drive cycles.• Model fast-start and load-following fuel processors.• Analyze high-temperature-membrane fuel cell systems.
270

Hydrogen, Fuel Cells, and Infrastructure Technologies FY 2002 Progress Report
Introduction
While different developers are addressing improvements in individual components and subsystems in automotive fuel cell propulsion systems (e.g., cells, stacks, fuel processors, balance-of-plant components), we are using modeling and analysis to address issues of thermal and water management, design-point and part-load operation, and component-, system-, and vehicle-level efficiencies and fuel economies. Such analyses are essential for effective system integration.
Approach
We use Argonne’s GCtool software package to devise and analyze system configurations and operation. We develop additional component models as needed to address evolving issues.
Results
During FY 2002, one of our major activities was to model and analyze an 80-kW pressurized direct hydrogen fuel cell system, potentially for an SUV application. The modeled system used compressed hydrogen fuel and operated at 3 atm, 80ºC, and a cell potential of 0.7 V at the rated power point. Performance data for the compressor-expander module (CEM) were obtained from a DOE development program. The fuel cell stack polarization curve was based on data from Los Alamos National Laboratory, extrapolated to various pressures and temperatures by the detailed fuel cell model in GCtool. The anode and cathode feed gases were heated/cooled to 70ºC and humidified to 90% relative humidity at the stack temperature. The modeled fuel cell system was analyzed for water and heat management issues, parasitic losses and system efficiency at normal and high ambient temperatures and elevations, and startup and dynamic response and efficiency in drive cycles.
Water Management
At the rated power, the dew point of the cathode exit gas that is needed to maintain water self-sufficiency is higher than the stack operating temperature, so no condensation of the water from the exhaust gas is needed. As the system operates at part load, however, the pressure ratio decreases from
3 toward 1. At pressure ratios below about 1.8, the required dew point decreases below 80ºC (the stack temperature), indicating that condensation of water from the exhaust is needed. The needed dew point as a function of the pressure ratio is shown in Figure 1. The figure shows the base case for 25% ambient relative humidity and 1 atm ambient pressure (at mean sea level), as well as cases for 100% relative humidity and 0.75 atm ambient pressure (at elevated locations, such as Los Alamos, New Mexico).
The corresponding heat duty of the condenser is shown in Figure 2. As discussed above, the condenser is needed only at pressure ratios less than about 1.8. The condenser duty increases with decreasing pressure ratios from ~1.8, reaching a maximum at a pressure ratio of ~1.2. At still lower pressure ratios, the condenser duty decreases due to the reduced air flow rates. Figure 2 also shows the effect of varying the oxygen utilization from 60% to 30% (50% is the base case). With decreasing oxygen utilization, the condenser duty increases; the maximum condenser duty more than doubles for operation with 40% oxygen utilization versus operation with 60% oxygen utilization.
Figure 1. Dew point of the cathode exhaust required for water self-sufficiency in the fuel cell system. Dew points lower than the stack temperature must be achieved by condensing out some of the water from the exhaust. Operation at higher elevations requires more water to be recovered.
271

Hydrogen, Fuel Cells, and Infrastructure Technologies FY 2002 Progress Report
Air Heater/Humidifier Duties
As is the case for the condenser, the maximum heat duty required at the cathode feed air heater/humidifier is not at the rated power point; rather, the maximum heat transfer requirement occurs at the part-load pressure ratio of approximately 1.6, as shown in Figure 3. At higher pressure ratios, the compression itself provides the major portion of the heating and humidification heat duty. The compressor contributes a successively lesser fraction of the needed heating as the pressure ratio decreases from 3 at the rated power point toward 1.6 at approximately 20% of full load. Figure 3 also shows that the maximum heat duty increases with decreasing oxygen utilization, with the maximum air heater duty with 30% oxygen utilization being about twice the heat duty with 60% oxygen utilization.
Parasitic Losses and Efficiencies
In the pressurized direct hydrogen fuel cell system, the two major parasitic power consumers are the CEM and the radiator fan. Parasitic power consumption becomes significantly greater as the ambient temperature increases from the nominal 300 K (27°C, 80°F) to 320 K (47°C, 116°F), as shown in Figure 4. At the lower ambient temperature, the total parasitic power consumption at the rated power is approximately 6 kW (for an 80-kW net power system), most of which is due to the power consumed
by the CEM. At the higher ambient temperature, the system is unable to deliver the full rated power of 80 kW net. At 90% of the rated power, the CEM and the radiator fan each consume over 6 kW, with a total parasitic power consumption of nearly 14 kW (for a net 72 kW delivered by the system).
The cell and overall system efficiencies (based on the lower heating value of hydrogen) at various power factors are shown in Figure 5. At the rated power and the nominal 300 K ambient temperature, the cell and system efficiencies are approximately 58% and 52%, respectively. The corresponding cell and system efficiencies at 320 K and 90% of rated power are approximately 57% and 46%, respectively.
Figure 2. Condenser heat duty in the 80-kW system as a function of pressure ratio and oxygen utilization. The heat duty reaches a maximum at part load.
Figure 3. Heat duty of the air heater/humidifier in the 80-kW system as a function of pressure ratio and oxygen utilization. The maximum heat duty is required at part load.
Figure 4. The compressor module and the radiator fan are the biggest parasitic power consumers in the system.
272

Hydrogen, Fuel Cells, and Infrastructure Technologies FY 2002 Progress Report
Startup and Dynamic Response on Drive Cycles
We have analyzed the performance of the pressurized direct hydrogen system during cold and warm startup at 300 K and at 320 K. Figure 6 shows the calculated efficiencies at various power factors for different operating conditions. In particular, at power factors less than about 0.5, i.e., at net power deliveries of 40 kW or less [the power most commonly called for from the 80-kW fuel cell system on the Federal Urban Driving Schedule (FUDS) and the Federal Highway Driving Schedule (FHDS)], the system efficiency can vary by more than 5 percentage points, depending on the state of the fuel cell system and the ambient conditions.
The key factors for the dynamic performance of the fuel cell system are the response characteristics of the CEM and of its controller. An example of the system's dynamic response is given in Figure 7, which shows the power demand for the SUV and the power available from a warmed-up fuel cell system during a 100-second portion of the FUDS. During rapid power up-ramps, the power generation by the fuel cell lags behind the demand. The magnitude of this difference depends primarily on the response time of the CEM and the operating logic of its controller.
Conclusions
Our analysis of the pressurized direct hydrogen system shows that:• A condenser is required at part load for water
self-sufficiency.• The condenser and the air heater/humidifier must
be designed for the maximum heat duties, which occur at part load rather than at the system’s design operating point.
• The compressor-expander module and the radia-tor fan are the biggest parasitic power consumers in the system, taking up nearly 15% of the gross power generated.
• Efficiencies of the system range from ~45% at the rated power to ~65% at part load.
Figure 5. Fuel cell and system efficiencies as a function of power factor and ambient temperature.
Figure 6. System efficiency at various power factors for different ambient temperatures and different cold and warm start conditions.
Figure 7. Dynamic response of the system on a portion of the FUDS. The fuel cell system's power generation lags behind the driving schedule's power demand during rapid power up-ramps.
273

Hydrogen, Fuel Cells, and Infrastructure Technologies FY 2002 Progress Report
• In load-following mode, the response character-istics of the CEM and its controller cause the power delivered to lag behind the power demand during the sharp transients of the FUDS.
FY 2002 Publications/Presentations
1. Ahluwalia, R. K., Doss, E. D., and Kumar, R., "Performance and Specific Power Attributes of PEFC Systems for Transportation," IEA Annex XV Meeting, Sacramento, CA, December 10–11, 2001.
2. Kumar, R., Ahluwalia, R., Doss, E., Krumpelt, M., “Fuel Cell Systems Analysis,” 2002 Annual National Laboratory R&D Meeting, DOE Fuel Cells for Transportation Program, Golden, CO, May 9–10, 2002.
3. Ahluwalia, R. K., Doss, E. D., and Kumar, R., “Performance of High-Temperature Polymer Electrolyte Fuel Cell Systems,” IEA Annex XI Phase II Meeting, Philadelphia, PA, May 17–18, 2002.
4. Ahluwalia, R. K., DeVille, B., Zhang, Q., Doss, E. D., Rousseau, A., and Kumar, R., "Performance of Hydrogen Fuel Cell Systems and Vehicles," IEA Annex XV Meeting, Dusseldorf, Germany, June 28, 2002.
5. Rousseau, A. and Ahluwalia, R. K., "Modeling and Control of Fuel Cell Vehicle Transient Behavior," Future Car Congress, June 3–5, 2002.
274

Hydrogen, Fuel Cells, and Infrastructure Technologies FY 2002 Progress Report
IV.A.3 Fuel Cell Vehicle Systems Analysis
Keith Wipke (Primary Contact), Tony MarkelNational Renewable Energy Laboratory1617 Cole Blvd.Golden, CO 80401(303) 275-4451, fax: (303) 275-4415, e-mail: [email protected]
DOE Technology Development Managers: JoAnn Milliken: (202) 586-2480, fax: (202) 586-9811, e-mail: [email protected] Garland: (202) 586-5673, fax: (202) 586-9811, e-mail: [email protected]
Objectives• Develop and validate models and simulation programs to predict fuel economy and emissions and aid
in setting performance targets for fuel cell electric and fuel cell hybrid electric vehicles• Provide DOE and industry with modeling tools and early design insights that lead to introduction and
application of advanced technology• Quantify benefits and impacts of DOE fuel cell technology development efforts at the vehicle level
Approach• Apply vehicle systems analysis expertise and software tools to study the impacts of DOE component
technology development programs and a variety of design scenarios• Develop and link existing component and vehicle models to enhance systems analysis capabilities• Collect experimental data and models from DOE contractors to validate system model predictions and
to provide systems level insights to component developers
Accomplishments• Completed a series of three technical papers that evaluated how several vehicle and component
characteristic parameters could influence the optimal vehicle design for neat and hybrid fuel cell vehicles
• Released a vehicle simulation model, ADVISOR 2002, with a reorganized, configurable subsystem fuel cell model library
• Enhanced fuel cell system thermal network model developed by Virginia Tech based on FutureTruck competition vehicle
• Initiated fuel cell component data collection effort with DOE contractors and received data from several parties
• Contributed to the development of Society of Automotive Engineers (SAE) recommended practice for measuring fuel economy and performance of a fuel cell hybrid electric vehicle
Future Directions• Optimize fuel cell hybrid vehicle system, considering a variety of energy storage options and system
operating characteristics, including fuel cell idling and start-up/shut-down• Continue to collect available data and models from fuel cell program contractors to enhance modeling
capabilities • Evaluate options for enhancing fuel cell system performance and reducing cost in a vehicle application
275

Hydrogen, Fuel Cells, and Infrastructure Technologies FY 2002 Progress Report
• Complete the enhanced fuel cell system thermal model under development at Virginia Tech• Work with industry partners to validate model predictions and perform studies that support fuel cell
technology introductions
Introduction
The U.S. Department of Energy has supported the development of vehicle and subsystem computer models to provide research and development program guidance for promising future research directions and to evaluate applications of existing advanced technologies. The vehicle simulation model ADVISOR (Advanced Vehicle Simulator) has been developed and is supported by the staff of the National Renewable Energy Laboratory. The model uses the MATLAB/Simulink programming environment and has an easy-to-use graphical user interface. ADVISOR is used mainly for target setting, systems analysis, and optimization.
In this project, ADVISOR was used to simulate different fuel cell vehicle design scenarios and to quantify the impacts of several influential parameters. The effects of designing for a specific drive cycle were analyzed. Likewise, vehicle scenarios for optimal fuel economy were derived for vehicles with a range of fuel cell system performance attributes. These studies have established the groundwork for future studies to be performed based on existing and planned technology deliverables in the DOE Fuel Cells for Transportation Program.
Approach
This analysis effort has focused on two areas: 1) model enhancement and validation with data collected from DOE contractors and 2) application of the model to understand some of the design trade-offs associated with fuel cell vehicles. The approach has been to work closely with industry partners to ensure that the models are accurate, to focus on appropriate systems issues, and to disseminate the study results in peer reviewed forums when possible.
Results
Data Collection and Analysis
The vehicle systems modeling tools can be used to understand the impacts, specifically on fuel
economy and performance, of single or multiple component characteristics. Characteristic performance data will be collected from the several DOE contractors working on developing technologies for fuel cell systems. The data being requested includes attributes like the fuel cell polarization curve, the load vs. flow rate for an air compressor or compressor/expander unit, or the fuel usage vs. the net power out of the complete system.
After the component data has been imported into ADVISOR, a variety of studies can be performed. For example, if the use of a different catalyst improves a portion of the polarization curve but has no impact on other operating regions, does this have any impact on the overall vehicle performance? Such questions as “under what design scenarios will a change have an impact and what is the value of the impact?” can be investigated.
Data has been collected from several air compressor suppliers and from a fuel cell system supplier. The air compressor data provides realistic inputs to estimate the parasitic load placed on the fuel cell stack for pressurized operation. The fuel cell system data is being used to investigate several options to overcome the start-up issues of current fuel cell systems.
Fuel Cell Vehicle Optimization Studies
At the vehicle systems level, there are thousands of interacting parameters that can influence the performance of a fuel cell vehicle. ADVISOR makes the task of quantifying the impacts of these parameters easier. However, studies that go beyond one or two parameters are difficult to do through manual iteration. Optimization tools have been incorporated into ADVISOR by NREL to automate the process of multi-dimensional analysis of fuel cell hybrid vehicles.
Two fuel cell vehicle analysis studies have been completed using ADVISOR and optimization techniques. In both studies, the optimizer was allowed to vary component parameters including fuel
276

Hydrogen, Fuel Cells, and Infrastructure Technologies FY 2002 Progress Report
cell peak power, the motor peak power, the battery power, and the battery capacity. In addition, the optimizer was allowed to adjust energy management parameters including minimum and maximum fuel cell power settings, minimum off time for the fuel cell, and the maximum charge power to be requested from the fuel cell. In each case, the vehicle was required to meet or exceed a set of performance constraints that were derived from the comparable baseline conventional vehicle. The performance constraints are summarized in Table 1.
In the first study, optimal component and control strategy parameters were derived to provide the best fuel economy on 4 individual drive cycles. The drive cycles included• Comp. - City/Highway composite, a weighted
value composed of the results of one highway cycle and one Federal Test Procedure (FTP) cycle
• US06 – high speed, high acceleration rate profile to be used in the U.S. Environmental Protection Agency Supplemental Federal Test Procedure (SFTP)
• NEDC – New European Drive Cycle including both low speed urban and high speed highway driving
• 1015 - Japan 1015 Mode Cycle, representing congested urban driving typical in Japan.
The four optimized vehicles were then simulated over the other three cycles. The fuel consumption results are summarized in Figure 1. In all cases, the vehicle designed for the cycle (indicated with a “D”) was better (lower fuel consumption) than all other vehicles over the drive cycle for which it was designed. Additionally, it was observed that the vehicle designed for the NEDC cycle was always the next best vehicle over the off-design cycles. This indicates that designing for the NEDC provides a reasonable vehicle design that is robust to variance in fuel economy.
It was assumed in the drive cycle study that the fuel cell system could respond to a transient power request from 10-90% peak power in 2 seconds, based on current DOE R&D Plan technical targets. In the follow-on study, all other assumptions were held the same while the transient power response capability was varied between 0 seconds (fast response, i.e. direct hydrogen) to 40 seconds (slow response, i.e. gasoline reformed system). Again the optimizer was allowed to vary the component sizes and the energy management parameters to find the design scenario that provided the best fuel economy while satisfying the performance constraints.
Figure 2 summarizes the key results of the response time study. It provides the vehicle fuel economy (squares) and the fuel cell specific power (triangles) data for three vehicle designs, an ICE conventional vehicle, a neat (no energy storage) fuel cell vehicle, and a fuel cell hybrid vehicle. The key conclusion to be drawn from these results is that the
Type Description Condition
Acceleration
0-96.5 km/h (0-60 mph) <= 11.2 s
64-96.5 km/h (40-60 mph) <= 4.4 s
0-137 km/h (0-85 mph) <= 20.0 s
Gradeability
@ 88.5 km/h (50 mph) for 20 min. at Curb Weight + 5 passengers and cargo (408 kg)
>= 6.5%
Drive Cycle
Difference between drive cycle requested speed and vehicle achieved speed at every second during the drive cycle
<= 3.2 km/h(2 mph)
SOC Balancing
Difference between final and initial battery state of charge <= 0.5%
Table 1. Performance Constraints for Fuel Cell Vehicle Studies
Figure 1. Fuel Consumption of Fuel Cell Vehicles Over Both On- and Off-Design Drive Cycles
277

Hydrogen, Fuel Cells, and Infrastructure Technologies FY 2002 Progress Report
flexibility of a hybrid design can be used to provide the same fuel economy performance independent of the fuel cell system response capability. However, as response time increases (the fuel cell system responds more slowly) the size of the fuel cell system grows rapidly, and the fuel economy begins to decline significantly in the case of a neat fuel cell vehicle. The neat option does provide about a 65% fuel economy improvement over a conventional internal combustion engine vehicle. An additional 50% improvement over the neat fuel cell vehicle case is available through regenerative energy and other techniques when the fuel cell vehicle is hybridized.
Conclusions
The results of the fuel cell vehicle optimization studies completed this year have contributed substantially to the bulk of knowledge on fuel cell vehicle design for both neat and hybrid design scenarios. It was concluded that the drive cycle can have a significant influence on the optimal design and that designing for the NEDC cycle actually provides a fairly robust vehicle design. Additionally, it was observed that hybridization provides substantial benefits and flexibility in overcoming possible shortfalls in fuel cell system performance caused by slow transient response capability.
A data collection effort was initiated with fuel cell program partners. Component data, including
polarization curves, fuel cell system efficiency, air compressor loads, and system response characteristics have been collected. The experimental data and predictions are being used to 1) validate the existing models and 2) quantify the system level benefits of the technology developments and the progress being made toward satisfying the DOE technical targets.
Publications/Presentations
1. Markel, T.; Wipke, K. “Optimization Techniques for Hybrid Electric Vehicle Analysis Using ADVISOR.” Proceedings of ASME International Mechanical Engineering Congress and Exposition. New York, New York. November 11-16, 2001.
2. Markel, T.; Wipke, K.; Nelson, D. “Vehicle System Impacts of Fuel Cell System Power Response Capability.” SAE Future Car Congress. Arlington, Virginia. June 3-6, 2002.
3. Wipke, K.; Markel, T.; Nelson, D. “Optimizing Energy Management Strategy and Degree of Hybridization for a Hydrogen Fuel Cell SUV.” 18th International Electric Vehicle Symposium. Berlin, Germany. October 20-24, 2001.
Figure 2. Impacts of Transient Response Capability for Hybrid and Neat Fuel Cell Vehicles on Combined City/Highway Driving Fuel Economy
278

Hydrogen, Fuel Cells, and Infrastructure Technologies FY 2002 Progress Report
IV.A.4 Cost Analyses of Fuel Cell Stack/Systems
Eric J. Carlson (Primary Contact) and Dr. Johannes H.J. ThijssenTIAX LLCAcorn ParkCambridge, MA 02140-2390(617) 498-5903, fax: (617) 498-7012, e-mail: [email protected]
DOE Technology Development Manager: Nancy Garland (202) 586-5673, fax: (202) 586-9811, e-mail: [email protected]
ANL Technical Advisor: Robert D. Sutton (630) 252-4321, fax: (630) 252-4176, e-mail: [email protected]
Objective• To develop an independent cost model for proton exchange membrane fuel cell (PEMFC) systems for
transportation applications and to assess cost reduction strategies for year 2000 to 2004 development programs.
Approach• In the first two years, develop a baseline system configuration and cost estimate based on best
available and projected technology and manufacturing practices, and assess the impact of potential technology developments on system cost reduction
• In the subsequent four years, annually update the baseline cost model and system scenarios based on assessments of developments in PEMFC system technologies and manufacturing processes.
Accomplishments• Assessed the potential for reductions in platinum loading by conducting an electrochemical kinetic
analysis of the impact of catalyst loading, temperature, and pressure on polarization of the cathode.• Developed future cost projections for reformer and direct hydrogen systems.
Future Direction• Develop projections of future system performance and cost based on continued industry feedback,
alternative system scenarios, and projected technology developments.
Introduction
In 1999, a baseline cost estimate for a 50 kilowatt (kW) PEMFC system for passenger vehicles was developed based on technology available in the Year 2000, using a high production volume scenario (i.e., 500,000 units per year). In Year 2000, we solicited feedback from system and component developers on the system configuration, design and performance parameters, and manufacturing process and costing assumptions. The impact of alternative
system design approaches were also assessed, including the impact of sizing the stack at the high power point rather than 0.8 volts, and the impact of hybridization, i.e., reducing or increasing rated power, on the fuel cell system power cost ($/kW). In Year 2001, we focused on the development of future costs based on projected technology. In 2002, an electrochemical model for the relationship between catalyst loading, temperature, pressure, and power density was combined with the cost model to understand the tradeoffs between catalyst loading
279

Hydrogen, Fuel Cells, and Infrastructure Technologies FY 2002 Progress Report
and cost of the stack. The cost model was used to develop projections for direct hydrogen fueled systems.
Approach
The factors influencing platinum loading were assessed to develop an estimate of future fuel cell stack cost for reformate and hydrogen systems. Projections of minimum platinum requirements were estimated based on an analysis that considered:
• Impact of catalyst particle size and catalyst activity on kinetics
• Impact of electrolyte adsorption on catalyst kinetics
• Development of polarization curves based on electrochemical kinetics
• Impact of ohmic resistance losses on polarization curve
The assumption of relatively high unit cell voltages (e.g., 0.8 volts) to achieve overall system efficiency targets simplified the analysis because cathode kinetics then dominate the voltage losses within the stack. Tafel kinetics were used to assess the effect of operating conditions and cathode voltage losses. Voltage drops were then assigned to the anode and ohmic components based on experimental data.
The polarization curves and functional relationships between platinum loading and performance were then combined with the stack cost model to assess the relationship between platinum loading and materials cost. Several overall assumptions are important to understanding the basis of the analysis. First, we assumed the performance of the catalyst is not limited by diffusion, the structure of the electrode, or the dispersion of the catalyst. In the early days of PEMFC development, significant performance gains were made while significantly decreasing the catalyst loadings. In our analysis, reduction in platinum loading leads to lower power density. Second, introduction of ohmic resistance losses into the analysis reduces the power density that can be achieved by increasing catalyst loading or by decreasing the cell voltage. Voltage losses across the ohmic resistances (I2R) in the system reduce the voltage available to perform useful
work at the electrodes. Third, in the baseline cost estimate, the fuel stack materials represent over 90% of the stack cost. Consequently, in the following analysis, we only consider the cost of materials in the stack (i.e., MEA, gas diffusion layer, and bipolar plate). The assumptions used to make the future projections are summarized in Table 1.
Table 1. Assumptions Used to Project Future Fuel System Costs
Results
Figure 1 shows polarization curves generated for different platinum loadings and temperatures assuming 3.5 nanometer catalyst particle size and 3 atmospheres pressure. The DOE fuel cell target for current density and voltage is highlighted by the circle. The polarization curve for the stack must lie above this circle to allow for additional voltage losses from the electrolyte, bipolar plates, and anode.
Figure 1. Polarization Curve at Different Temperatures and Platinum Loadings at 3 Atmospheres and with 3.5 nanometer Catalyst Particle Size
280

Hydrogen, Fuel Cells, and Infrastructure Technologies FY 2002 Progress Report
Figure 2 shows the material cost ($/kilowatt electrical [kWe]) versus cathode platinum loading for stacks operating at 3 atmospheres, 160oC, and 0.8 volts with direct hydrogen and reformate. Assumptions in this analysis include use of an alloy catalyst having a kinetic activity two times that of platinum, a unit cell resistance of 0.1 ohm centimeter squared (cm2), and an anode catalyst loading equal to one half the cathode loading.
The analysis produced an “L” shaped curve where material costs rise sharply at low platinum loadings (low power density) and then show weak dependence with increasing platinum loading. Figure 3 shows the flat portion of the curve for various values of ohmic resistance. Independent of the resistance value, all of the curves have a minimum cost in the region of 0.1 to 0.3 mg/cm2.
Figure 4 shows the cost projections for the future system scenarios. The contribution of precious metal cost to each system is broken out separately to highlight its impact on system cost. This analysis compares the cost of reformate and direct hydrogen systems on a 50 kWe basis. In practice, the lighter weight of direct hydrogen systems will produce equivalent vehicle performance (e.g., acceleration, hill climb) at lower net system power. The higher efficiency of the hydrogen system may also lead to operation of the stack at lower voltages (higher power density) leading to lighter, less costly stacks. Hence, the cost of the hydrogen system could be reduced further relative to the reformate system.
Conclusions
The analysis of minimum platinum loading and projection of cost for future scenarios provided several important insights, including:
Figure 2. Fuel Cell Stack Material Cost versus Cathode Platinum Loading
Figure 3. Impact of Ohmic Resistance on the Cost versus Platinum Loading Relationship
281
Hydrogen, Fuel Cells, and Infrastructure Technologies FY 2002 Progress Report
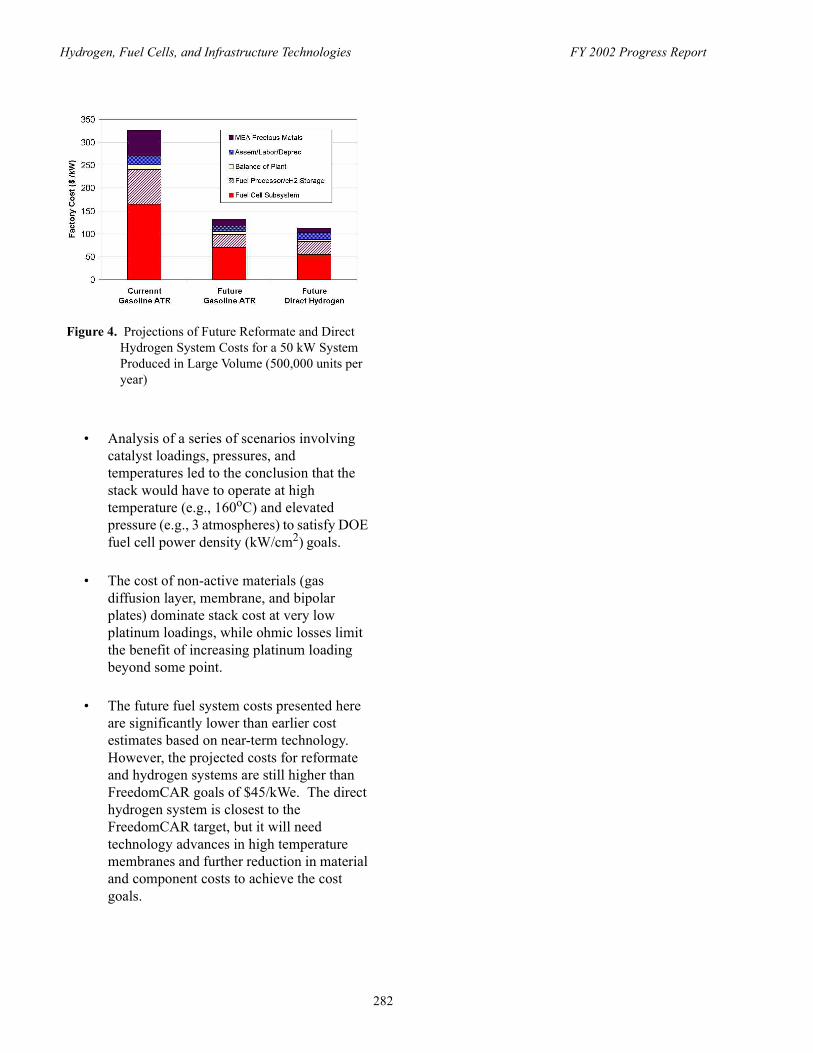
• Analysis of a series of scenarios involving catalyst loadings, pressures, and temperatures led to the conclusion that the stack would have to operate at high temperature (e.g., 160oC) and elevated pressure (e.g., 3 atmospheres) to satisfy DOE fuel cell power density (kW/cm2) goals.
• The cost of non-active materials (gas diffusion layer, membrane, and bipolar plates) dominate stack cost at very low platinum loadings, while ohmic losses limit the benefit of increasing platinum loading beyond some point.
• The future fuel system costs presented here are significantly lower than earlier cost estimates based on near-term technology. However, the projected costs for reformate and hydrogen systems are still higher than FreedomCAR goals of $45/kWe. The direct hydrogen system is closest to the FreedomCAR target, but it will need technology advances in high temperature membranes and further reduction in material and component costs to achieve the cost goals.
Figure 4. Projections of Future Reformate and Direct Hydrogen System Costs for a 50 kW System Produced in Large Volume (500,000 units per year)
282

Hydrogen, Fuel Cells, and Infrastructure Technologies FY 2002 Progress Report
IV.B Stationary Power Systems
IV.B.1 Alkaline Fuel Cell Development
Timothy Armstrong (Primary Contact), Dane Wilson, Lynn Klett Oak Ridge National LaboratoryPO Box 2008Oak Ridge, TN 37831-6084(865) 574-7996, fax: (865) 574-4357, e-mail: [email protected]
Wayne Smith (Primary Contact) Los Alamos National LaboratoryPO Box 1663Los Alamos, NM 87545(505) 667-2635, fax: (505) 665-4292, e-mail: [email protected]
DOE Technology Development Manager: Nancy Garland202-586-5673, fax: (202) 586-9811, e-mail: [email protected]
Objectives • Jointly develop alkaline fuel cell research and development (R&D) roadmap • Improve existing alkaline fuel cell anode by eliminating platinum• Improve power density of alkaline fuel cell
Approach• Address needed improvements in current technology and propose research breakthrough technologies
based on evaluation of all existing alkaline fuel cell documentation and company site visits• Evaluate new polymer-based hydroxyl conducting membranes• Determine CO2 tolerance of other aqueous and molten salt based alkaline electrolytes• Evaluate new anode catalysts to promote high efficiencies and operating temperatures• Develop high conductivity composite bipolar plates to allow high power density designs to be
developed
Accomplishments • Draft R&D roadmap completed in August 2002
Future Directions • Evaluate new polymer-based hydroxyl conducting membranes• Determine CO2 tolerance of other aqueous and molten salt based alkaline electrolytes• Evaluate new anode catalysts for high efficiencies and operating temperatures• Develop high conductivity composite bipolar plates to allow high power density designs to be
developed
283

Hydrogen, Fuel Cells, and Infrastructure Technologies FY 2002 Progress Report
Introduction
Alkaline fuel cells are potentially the lowest cost fuel cell due to the materials and manufacturing processes used to make them. They are efficient (51% system), restorable (replacing the electrolyte restores output to near new), and recyclable. The reliability of alkaline fuel cells has been demonstrated convincingly over 30 years of service in space missions. The new low-cost alkaline fuel cells being developed by other manufacturers are equally reliable but at a fraction of the cost. They are fabricated from relatively inexpensive components and catalysts, and can be manufactured using simple production techniques in an inexpensive factory. Their low cost, even in small volume production, will enable the alkaline fuel cell to be used in niche markets (i.e., peaking and/or stationary power) before the mass production envisioned for other fuel cell types (proton exchange membrane [PEM], solid oxide fuel cell [SOFC]) brings the price of these technologies to a competitive level. However, additional development is needed to improve the sensitivity of alkaline fuel cells to atmospheric CO2, increase their efficiency, and to improve their power density.
Approach
This is a new project initiated in early spring 2002. The initial goal is to develop an understanding of the development needs of alkaline fuel cells through visits to developers and by analysis of published records and literature. Upon completion of this analysis, development of critical materials or components will commence with the emphasis on advancing current alkaline technology. To obtain higher temperature, higher power density cells and stacks in the future.
Results
A collaborative laboratory effort between Oakridge National Laboratory and Los Alamos National Laboratory has recently been undertaken to evaluate the alkaline fuel cell literature and develop a research and development program plan. To date, the team evaluated the literature and drafted a review of the state-of-the-art. Based on this and input from industrial participants, a research plan is being
drafted and will be presented to the Office of Hydrogen, Fuel Cells and Infrastructure Technologies in August 2002.
284

Hydrogen, Fuel Cells, and Infrastructure Technologies FY 2002 Progress Report
IV.B.2 Development of Advanced, Low-Cost PEM Fuel Cell Stack and System Design for Operation on Reformate
Michel Fuchs Teledyne Energy Systems, Inc.1501 Northpoint Parkway, #101West Palm Beach, FL 33407(561) 688-0506 x239, fax: (561) 688-0766, e-mail: [email protected]
DOE Technology Development Manager: Donna Ho (202) 586-8000, fax: (202) 586-9811, e-mail: [email protected]
ANL Technical Adivsor: William Swift (630) 252-5964, fax: (630) 252-4176, e-mail: [email protected]
Objectives• Design and demonstrate a reformate-capable fuel cell stack, utilizing CO-tolerant membrane electrode
assemblies (MEAs) and low cost bipolar collector plates.• Design, integrate and demonstrate a natural gas fueled 7-kWnet fuel cell power plant.
Approach• Phase I: Demonstration and delivery of a PEM ten cell stack with reformate capability and ten
additional bi-polar plates manufactured by the compression molding process.• Phase II: Demonstration and delivery of a high efficiency reformate tolerant 7-kWnet fuel cell stack
and power plant utilizing molded bipolar plates and natural gas fuel processor to Argonne National Laboratory for independent testing and verification.
Accomplishments• Built and operated a 3-kWnet fuel cell power plant with integrated natural gas reformer.• Began construction of second 3-kWnet fuel cell power plant with advanced features and controls.• Built and tested reformate tolerant 60-cell 5.0-kWgross Teledyne Perry NG2000 stack.• Have accumulated over 2500 hours of 10-cell stack operation on synthetic reformate.• Developed control architecture capable of compensating for reformer response and effectively meeting
transient power demands.• Developed system design that utilizes improvements generated from 3-kWnet plant testing.• Established design criteria to achieve neutral water balance.
Future Directions• Develop a 7-kWnet fuel cell system with integrated natural gas fuel processor.• Continue evaluations of new MEA materials for optimal reformate performance and longevity.• Fabricate, assemble and test 7-kWnet power plant and prepare it for delivery.
285

Hydrogen, Fuel Cells, and Infrastructure Technologies FY 2002 Progress Report
Introduction
Current work is associated with the development of a 7-kWnet fuel cell power plant with integrated natural gas reformer based on Teledyne Energy Systems’s 3-kWnet prototype stationary power plant. The development effort will focus on a systems approach broken down into three areas: PEM fuel cell stack, natural gas reformer and integrated system.
Approach and Results
PEM Fuel Cell Stack
Taking into account commercial objectives and goals, a Teledyne Perry NG2000 stack configuration was chosen to meet requirements for the 7-kWnet power plant. Two 60-cell stacks rated at 5.0-kWgross (Figures 1 and 2), electrically connected in parallel, will be utilized to meet total power demands.
The NG2000 has an active area size of 300 cm2 and is designed to operate on pure hydrogen or reformate, e.g. 45% H2, 35% N2, 20% CO2, 10 ppm CO. The MEAs are designed for continuous operation with CO concentrations of 10 ppm and can tolerate transients approaching 100 ppm. Excellent cell-to-cell consistency has been demonstrated throughout the stack’s operating range (Figure 3). Running on reformate, the NG2000 can be scaled to meet a variety of power requirements from 360-W to 10-kWgross.
The NG2000 is capable of operating between 0.2 and 3 atm and up to 70°C. Tables 1 and 2 show specifications and capabilities of the 60-cell stack respectively. Ongoing work is focused on attaining 10,000 hours of operation in the near-term with a final objective of 40,000 hours. So far over 2500 hours of continuous operation has been demonstrated on a 10-cell NG2000 stack running on synthetic reformate.
A duplicate of the 60-cell stack that will be used in the power plant was recently constructed and then tested on synthetic reformate. Figures 4 and 5 show the performance of the stack on hydrogen and synthetic reformate respectively. Operating on reformate, the 60-cell exhibits near pure hydrogen performance.
In situ evaluation of a 60-cell stack was demonstrated in Teledyne Energy Systems’s 3kWnet
Figure 1. Teledyne Perry NG2000 60-Cell Stack
Figure 2. Teledyne Perry NG2000 60-Cell Undergoing Testing
Figure 3. Teledyne Perry NG2000 60-Cell Steady-State Performance with Synthetic Reformate
286

Hydrogen, Fuel Cells, and Infrastructure Technologies FY 2002 Progress Report
prototype stationary power plant which incorporated a 7-kW natural gas reformer (Figure 6).
Reformer
A 10-kW natural gas fuel processor will be integrated into the power plant. The processor is capable of starting up and producing fuel cell quality reformate in less than 60 minutes. Furthermore, it is able to transition from minimum power to full power (2 kW to 10 kW) in less than 60 seconds. The reformer is a larger version of the unit used in the 3-kWnet stationary plant, which has demonstrated good transient response and low CO output (less than 50 ppm throughout its operating envelope).
Integrated System
The 7-kWnet system will consist of the fuel cell, reformer and ancillary systems. The final packaged system will be optimized for laboratory use and outfitted with an extensive, PC based, data acquisition system.
To compensate for the response of the fuel processor, a control architecture was developed to allow a battery system to provide for peak power demands. The power plant has been designed to maintain the batteries’ state of charge at an optimal level while the batteries provide the capacitance necessary to meet any load topography. In this configuration, the transient-following capabilities of the power plant are greatly enhanced.
The ancillary systems are designed to track the load demands placed on the power plant. For instance, compressors, pumps and fans will be operated to provide only the conditions necessary to allow the stack to meet a given power demand. This will enable optimal efficiency to be maintained at all operating conditions.
Table 1. Teledyne Perry, NG2000 60-Cell Stack Specifications
Reactants: Air/Reformate
Active area 292 cm2
Operating volt. range 38-57 V
Operating pressure 0.2 to 3.0 atm.
Operating temperature 60 to 70°C
Stack volume 21.2 Liters
Stack weight 50 kg
Table 2. Teledyne Perry, NG2000 60-Cell Stack Performance
Max cont. power 5.4-kW @ 38 VDC
Power density 255 W/L
Reformatecomposition as tested
45% H2, 35 % N2, 20%CO2, 10 ppm CO
Figure 4. Teledyne Perry NG2000 60-Cell Performance with Hydrogen Fuel
Figure 5. Teledyne Perry NG2000 60-Cell Performance with Synthetic Reformate Fuel
287

Hydrogen, Fuel Cells, and Infrastructure Technologies FY 2002 Progress Report
A model based on the performance on the 3-kWnet stationary power plant was developed to assist in designing the 7-kWnet system. Table 3 shows results obtained from the model at various operating conditions.
Sensitive to the necessity to reduce costs critical to the successful commercialization of fuel cell technology, a concerted effort has been placed on designing a system that is as simple as possible and that strives to implement components from well established industries, e.g. automotive and appliance.
Conclusion
Teledyne Energy Systems, Inc. will construct a 7-kWnet stationary fuel cell power plant that will utilize natural gas and enable an in-depth evaluation of a fuel cell and reformer package. The design of the system will be based on Teledyne Energy Systems’s commercially oriented 3-kWnet stationary product, which is currently under development.
Presentations/Publications:
1. M. Fuchs, F. Barbir and M. Nadal, “Performance of Third Generation Fuel Cell Powered Utility Vehicle #2 with Metal Hydride Fuel Storage”, presented at the 2001 European Polymer Electrolyte Fuel Cell Forum, Lucerne, Switzerland, July 2001
2. F. Barbir and J. Braun, “Development of Low Cost Bi-Polar Plates for PEM Fuel Cell”, Proc. Fuel Cell 2000 Research & Development, Strategic Research Institute Conference, Philadelphia, PA, September 2000
3. M. Fuchs, F. Barbir and M. Nadal, “Fuel Cell Powered Utility Vehicle with Metal Hydride Fuel Storage”, presented at the GlobeEx 2000 Conference, Las Vegas, NV, July 2000
4. F. Barbir, “Recent Progress and Remaining Technical Issues in PEM Fuel Cell Development”, submitted to the World Hydrogen Energy Conference, WHEC XIII, Beijing, China, June 2000
5. F. Barbir, “Air, Water and Heat Management in Automotive Fuel Cell Systems”, presented at the Intertech Conference Commercializing Fuel Cell Vehicles 2000, Berlin, Germany, April 2000
6. M. Fuchs, F. Barbir, A. Husar, J. Neutzler, D. Nelson and M. Ogburn, “Performance of Automotive Fuel Cell Stack”, presented at the 2000 Future Car Congress, Arlington, VA, April 2000
7. F. Barbir, “Bi-polar Plates, Flow Fields and Stack Design Criteria”, presented at the American Physical Society Meeting, Minneapolis, MN, March 2000
Table 3. 7-kWnet Fuel Cell Power Plant Model Results
Parameter @7kWnet
@5kWnet
@2kWnet
Stackarray pwr
9.2 kW 6.5 2.7
Stackarray volt
41.1 V 43.9 V 47.8 V
Ancillaryload
2.2 kW 1.5 kW 0.7 kW
StackthermalEff. (LHV)
55% 58% 63%
Figure 6. 7-kW Reformer Test Stand
288

Hydrogen, Fuel Cells, and Infrastructure Technologies FY 2002 Progress Report
8. F. Barbir, M. Fuchs, A. Husar and J.Neutzler, “Design and Operational Characteristics of Automotive PEM Fuel Cell Stacks”, Fuel Cell Power for Transportation, SAE SP-1505, Proc. SAE International Congress & Exhibition, Detroit, March 2000, pp. 63-69, SAE, Warrendale, PA, 2000
9. V. Gurau, F. Barbir and H. Liu, “An Analytical Solution of a Half-cell Model for PEM Fuel Cells”, Journal of Electrochemical Society, Vol. 147(7), 2000
289

Hydrogen, Fuel Cells, and Infrastructure Technologies FY 2002 Progress Report
IV.B.3 Proton Exchange Membrane Fuel Cell Power System on Ethanol
Ahmed Amrani (Primary Contact), Thomas RichardsCaterpillar Inc.Technical Center, P.O. Box 1875Peoria, Illinois 61656 - 1875(309) 578-3913, fax: (309) 578-9900, e-mail: [email protected]
DOE Technology Development Manager: Kathi Epping(202) 586-4725, fax: (202) 586-9811, e-mail: [email protected]
ANL Technical Advisor: William M. Swift (630) 252-5964, fax: (630) 972-4473, e-mail: [email protected]
Main Subcontractors: Nuvera Fuel Cells, Cambridge, Massachusetts; Williams Bio-Energy, Pekin, Illinois
Objectives• Caterpillar, Nuvera Fuel Cells, and Williams Bio-Energy have teamed up to develop and demonstrate a
15 kilowatt (kW) ethanol-fueled proton exchange membrane (PEM) fuel cell system. The primary objectives of this project are to:- Demonstrate performance, durability and reliability- Remove technical uncertainties - Understand correlation and reduce gaps between stationary and transportation application- Collect data to evaluate economic feasibility- Assess commercial viability of total system
Approach• Nuvera will assess and modify advanced fuel cell power module designs that are now under
development in separate projects to develop the power module for this project.- Caterpillar will design the power converter module and will integrate the system.- Williams will supply the ethanol and host the site to test the unit and conduct endurance testing.
Accomplishments• A preliminary design review between Nuvera, Williams and Caterpillar took place May 20 - 21, 2002.• Power module design specifications have been completed.• The ethanol reformer has been tested for a short period of time at rated power.• The fuel cell stack has been tested for a short period of time at ¼ rated power with output from the
reformer.• Power converter specifications have been completed.• The design and release of the power converter is near completion.• Preliminary site specifications exist and a safety codes and standards review has been scheduled.
290

Hydrogen, Fuel Cells, and Infrastructure Technologies FY 2002 Progress Report
Future Directions• Prepare and conduct a final design review with cooperative team and sponsors • Conduct independently the functional test of both the power module and the power converter. This is
targeted for January-February 2003.• Prepare the test site building, which will be the endurance-testing place for the fuel cell system. This is
targeted to be completed in the January 2003 time frame.• Ship the functional unit to the test site and start the endurance-testing phase. This is targeted to start in
February 2003.
Introduction
Nuvera will design, build, test, and deliver a 15 kilowatt electrical (kWe ) direct current (DC) fuel cell power module that will be specifically designed for stationary power operation using ethanol as a primary fuel. Two PEM fuel cell stacks in parallel will produce 250 amps and 60 volts at rated power. The power module will consist of a fuel processor, carbon monoxide (CO) clean-up, fuel cell, air, fuel, water, and anode exhaust gas management subsystems. A state-of-the-art control system will interface with the power system controller and will control the fuel cell power module under start-up, steady-state, transient, and shutdown operation. Temperature, pressure, and flow sensors will be incorporated in the power module to monitor and control the key system variables under these various operating modes. The power module subsystem will be tested at Nuvera and subsequently be delivered to the Williams Bio-Energy Pekin, Illinois site.
Approach
Nuvera plans to modify advanced fuel cell power module designs that are now under development in separate projects for use in this project. They will start with a power module design that is a multi-fuel, 1 atmosphere, 20 kWe power module designed for transportation (light duty vehicle) applications. The purpose of using this design baseline is twofold.
• By using an existing design, much of the design effort and technical risk associated with a completely new power module design will be avoided.
• By using a transportation-based design, this demonstration will simultaneously illustrate that renewable ethanol can be used in fuel
cell power systems applied to stationary power generation as well as transportation.
Caterpillar will design, build, test and deliver a power converter module that converts the DC output of the power module into AC power. Caterpillar will also provide system level control to insure all major subsystems work in harmony and provide constant power (14 kWe) to the industrial load on site. The fuel cell system will add power to the overall power at the Williams Bio-Energy ethanol production site in Pekin, Illinois.
The power converter design will rely on Caterpillar's experience with state-of-the-art solid-state power converters that employ switches, inverters and pulse width modulation to shape a sinusoidal voltage and current in time with the existing power source on site.
Caterpillar also aims to demonstrate technology to the greatest extent possible that can meet the dual requirements of the transportation industry and the stationary electric power generation industry. In addition to low levels of emissions, we intend to demonstrate high efficiency, durability and reliability. These technical objectives will enable us to calculate the cost of electricity ($/kW-hr) for transportation and stationary power applications.
Williams Bio-Energy will host the industrial site for this demonstration. Williams works with Nuvera and Caterpillar to provide them with site electrical load requirements. They will prepare the site to ensure that the fuel cell system links to their power network and will supply ethanol fuel and other utilities. During the demonstration, Williams' personnel will monitor and service equipment and permit visitors to witness the demonstration in comfort and safety.
291

Hydrogen, Fuel Cells, and Infrastructure Technologies FY 2002 Progress Report
Results
The cooperative team has demonstrated several milestones.
Power Converter
The overall system block diagram, system level wiring diagram, and power converter diagram have all been finalized. This is depicted in Figure 1. The overall schematic and bill of material have identified the long lead items, which are now being procured. A system level functional specification is being revised with a baseline allowing configuration control and management.
Power Module
Several rig tests to study contaminant formation from ethanol reforming were conducted to finalize the selection of the proper catalyst, and a burner was re-engineered and sized to meet the different power requirement.
Cold start testing of the reformer using ethanol was completed at half power and operability of the reformer using new sensors and controllers was demonstrated at full power, resulting in reformate with less than 20 parts per million CO and with 37% of hydrogen (H2) under stable condition. (See Figures 2 and 3.)
A 45-stack baseline system test (fuel cell stack and reformer) was conducted to demonstrate stability and high H2 utilization (75%-80%). This was followed by an 80-stack design test at full power for over 45 minutes, resulting in high H2 utilization. Cold start of the reformer without afterburner was completed.
The overall process and instrumentation diagram as well as the interface diagram are now completed.
Conclusions
A preliminary design review was held at Nuvera in Cambridge on May 20, 2002, focusing on refining the project plan with milestones, target critical design review dates and visiting the existing building where the fuel cell system will be hooked up and tested.
Figure 1. System Level Block Diagram
Figure 2. Startup Profile of Reformer System
Figure 3. Stack Performance at Full Power Cell Conditions
292

Hydrogen, Fuel Cells, and Infrastructure Technologies FY 2002 Progress Report
Also reviewed were the power converter and module specifications, power topology, power flow requirement, a common data acquisition system, the different control flow charts, the system wiring diagrams, and the different protocols for data acquisition and monitoring.
The cooperative team has also established a common FMEA (Failure Mode Evaluation and Analysis) system using the power converter FMEA from Caterpillar as a template, and expanding this approach to define a preliminary HazOps analysis to be conducted in the future.
At this phase no technical hurdles are anticipated. Future actions include conducting a safety design review (HazOps analysis), establishing an activity-based target date for a critical design review, and generating a system level functional specification document which will help define the research boundaries for this project.
Procurement of critical long lead hardware will continue. This will allow a sound forecasting in planning the shakedown testing of the power module and the power converter separately. The unit will be then assembled and ready for the endurance testing.
293

Hydrogen, Fuel Cells, and Infrastructure Technologies FY 2002 Progress Report
IV.B.4 Fuel Cell Distributed Power Package Unit: Fuel Processing Based on Autothermal Cyclic Reforming
George Kastanas, Court Moorefield, Parag P. Kulkarni, Shawn Barge, Vladimir Zamansky, Ravi Kumar (Primary Contact)GE Energy and Environmental Research CorporationGeneral Electric Company18 MasonIrvine, CA 92618(949) 859-8851 ext.159, fax: (949) 859-3194, e-mail: [email protected]
DOE Technology Development Manager: Kathi Epping(202) 586-7425, fax: (202) 586-9811, e-mail: [email protected]
Goals and Objectives• The overall goals of the project are to:
- Design, fabricate and operate a precommercial integrated fuel processor;- Create a design for mass manufacturing of the system; - Assess the performance of the system in terms of total efficiency, electrical production efficiency,
and cogeneration value; and - Assess the economics of the design.
• The specific performance objectives of the fuel processor are to:- Convert natural gas to a proton exchange membrane (PEM) fuel cell grade hydrogen-rich stream
(< 10 ppm CO);- Achieve fully automatic operation during normal, start-up, shut-down and stand-by modes;- Operate in a fully automatic mode for over 100 hours; - Achieve 75% fuel processor efficiency on a higher heating value (HHV) basis; and- Achieve a capital cost target that is less than $1000/kW and electricity cost that is less than $0.06/
kWh, when the system is mass produced.
Approach• Design a 50 kW fuel processor capable of producing PEM fuel cell grade hydrogen-rich stream.• Fabricate and operate a fully automated 50 kW fuel processor capable of operating on natural gas. • Conduct an economic and manufacturability analysis to reduce costs for the system and to provide
information on the high volume manufacturing cost of the fuel processor.
Accomplishments• Design of 50 kW integrated fuel processor, which includes reformer, shift reactor, steam generator and
preferential oxidation reactor.• Fabrication of reformer, shift reactor, and steam generator.• Design and programming of automated control system.• Shakedown of steam generator, valves and feed metering systems• Preliminary economic analysis.
294

Hydrogen, Fuel Cells, and Infrastructure Technologies FY 2002 Progress Report
Future Directions• Fabricate preferential oxidation reactor.• Operate and optimize the fully integrated fuel processor.• Analyze the reliability of the fuel processor.• Perform a detailed economic analysis.
Introduction
GE Energy and Environmental Research Corporation (GE EER) is developing a PEM fuel cell based distributed power generation (DPG) system. The DPG system uses a proprietary fuel processor to convert fossil fuels to a hydrogen-rich gas for use in the fuel cell. The project is currently in Phase II, which is a demonstration of the integrated fuel processor operating in a fully automatic mode for over 100 hours to continuously generate a PEM fuel cell grade hydrogen-rich stream (<10 ppm CO) with thermal efficiency of 75% on a HHV basis.
GE EER will design, fabricate and operate a pre-commercial integrated fuel processor, develop a design for mass manufacturing of the system, and assess the potential cost and performance.
Approach
A precommercial, integrated 50 kWe fuel processor that can produce a PEM fuel cell grade hydrogen-rich stream will be designed and fabricated. The Autothermal Cyclic Reforming (ACR) and Low Temperature Shift (LTS) technologies that have been successfully demonstrated during the earlier part of the project will be used. In order to reduce the concentration of CO to less than 10 ppm, GE EER will only consider technologies that are commercially available or are close to commercialization. The technologies that are commercially available are Pressure Swing Adsorption (PSA) and Selective Hydrogen Membrane Permeation. The technologies that are in the developmental stage but potentially are near commercialization are Preferential Oxidation (PROX) of Los Alamos National Laboratory and Methanation. The major deliverable will be a report on continuous operation of the fuel processor in fully automatic mode for over 100 hours. An economic analysis will be conducted to identify the
opportunities for reducing costs of the system and to provide improved information on the high volume manufacturing cost of the fuel processor.
Results, Conclusions, and Future Directions
The autothermal cyclic reformer, LTS reactor, steam generator and desulfurizer have been designed, fabricated and installed on the skid. The desulfurizer absorbs sulfur components from the natural gas upstream of the reformer. A conventional Copper/Zinc catalyst was selected for the LTS reactor. The PROX reactor, which reduces CO level to less than 10 ppm in the hydrogen-rich gas, has been designed. The PROX catalyst was selected and has been ordered. The skid platform, the flow panels and the feed metering systems have been fabricated. The piping to all vessels has been installed and leak checked. The flow control system, control hardware and independent safety systems have been installed. The automatic control system has been designed and programmed. The shakedown of the steam generator, valves and feed metering systems has been completed. The PROX reactor will be fabricated and the integrated fuel processor will be operated and optimized. The 50 kW fuel processor is shown in Figure 1.
Figure 1. 50 kW Integrated Fuel Processor
295

Hydrogen, Fuel Cells, and Infrastructure Technologies FY 2002 Progress Report
The results to date are highly promising and indicate that the GE reforming technology is on the road to success to meet DOE goals. The fuel processor promises to advance the current state of fuel cell technology and will provide clean hydrogen generation, allowing for distributed reforming at high efficiency, with reduced pollutant emissions, and fuel flexibility, at lower cost. The development and commercialization of ACR-based fuel processors will remove the barriers for fuel cell development, which is presently being stifled by the lack of small scale reformers and the lack of hydrogen distribution systems.
A template for calculating cost of electricity has been developed. The analysis considers efficiency, capital costs, operating and maintenance costs, capital recovery factor, availability, fuel price and other factors. A detailed economic analysis will be performed.
GE EER and GE's Global Research Center (GRC) will analyze the design for reliability (DFR) of the fuel processor. The components that require a design review to reduce capital costs have been identified. DFR templates that have been developed by GRC to record all failures will be used. This data will be analyzed and all identified reliability issues will be addressed during the design of the next system. The DFR plan also includes component testing that will help identify failures of subsystems and components. Information from DFR analysis will be combined with the economic analysis to determine the economic benefits of the advanced fuel processor system.
FY 2002 Publications and Presentations
1. R.V. Kumar, "Autothermal Cyclic Reforming Based Hydrogen Refueling System", IEA Annex XV Fuel Cells for Transportation Meeting, 2002, Sacramento, California.
2. R.V. Kumar, G. Kastanas, S. Barge, V. Zamansky, R. Seeker, "Autothermal Cyclic Reforming Based Hydrogen Refueling System", DOE Annual Hydrogen Program Review, 2002, Golden, Colorado.
3. R.V. Kumar, G. Kastanas, P. Kulkarni, C. Moorefield, S. Barge, V. Zamansky, R. Seeker, "Hydrogen Energy Park Based on Autothermal Cyclic Reforming", Fuel Cell Seminar, 2002, Palm Springs, California.
296

Hydrogen, Fuel Cells, and Infrastructure Technologies FY 2002 Progress Report
IV.B.5 Research and Development on an Ultra-Thin Composite Membrane For High-Temperature Operation in Proton Exchange Membrane Fuel Cells
Chao-Yi Yuh (Primary Contact)FuelCell Energy, Inc.3 Great Pasture RoadDanbury, CT 06813(203) 825-6112, fax: (203) 825-6273, e-mail: [email protected]
DOE Technology Development Manager: Kathi Epping (202) 586-7425, fax: (202) 586-9811, e-mail: [email protected]
Main Subcontractors: University of Connecticut, Storrs, Connecticut and Ion Power, Inc., Bear, Delaware
Objectives• Develop an ultra thin, durable membrane (< 75 µm) capable of operation at 100-140oC with the
following properties:- <0.2 Ωcm2 (Ohm-centimeter-squared) membrane ohmic resistance and <1% crossover- High ionic conductance with negligible electronic conductivity- High mechanical strength- >0.6 volts (V) performance at 400 mA/cm2 (milliamps/centimeters squared) under ambient
reformate/air operation at 120oC
Approach • Develop a solid superacid-Nafion®composite membrane electrode assembly (MEA) with the
following components:- Solid superacids as high-temperature proton conductors and moisture retainers- Nafion® phase as proton conducting binder phase- Inert support phase may be added to enhance strength
Accomplishments• Demonstrated atmospheric MEA performance of ~600 mV at 400 mA/cm2 under actual system
operating conditions (atmospheric, low relative humidity, high utilizations) at 120oC for 500 hours (h)• Achieved membrane ohmic resistance and cross-over objectives
Future Directions• Optimization of the promising membrane-electrode assembly• Scale-up to nominal 300 cm2 and validation in single cell• 300 cm2 short stack evaluation
297

Hydrogen, Fuel Cells, and Infrastructure Technologies FY 2002 Progress Report
Introduction
Fuel cells offer the best alternative to conventional power generation technologies. They are inherently very efficient and clean. For fuel cells to be commercially competitive, issues such as cost, size, and functionality need to be addressed. The specific goal of this fuel cell for buildings applications project is to develop an atmospheric-pressure natural gas-fueled proton exchange membrane fuel cell (PEMFC) system with >35% efficiency (higher heating value), >100oC operation for cogeneration, simple construction, >40,000 h reliable life, and <$1500/kW system cost. For the PEMFC to be commercially viable, the performance of critical components, such as the polymer electrolyte membrane in particular, needs to be improved.
At present, the state-of-the-art PEMFC is operated at ~80oC. Carbon monoxide (CO) poisoning of the PEMFC anode's precious metal catalyst is a major technical barrier for utilizing hydrocarbon feedstocks such as natural gas. CO clean-up from the fuel stream requires a complicated and expensive fuel processor. Since the chemisorption of CO on the anode catalysts is exothermic and therefore weakens considerably with temperature, one approach to mitigate the CO poisoning is to operate the PEMFC at higher temperatures. Many other advantages can also be realized, such as faster electrode kinetics, lower voltage loss, higher quality waste heat for cogeneration, cathode flooding mitigation, and greater ability to remove waste heat.
The baseline Nafion® membrane is deficient in terms of ionic conductivity above 100oC and at low relative humidity required for atmospheric-pressure building applications. Such conditions tend to dry out the membrane, drastically reducing membrane proton conductivity. Furthermore, the loss of water causes membrane embrittlement, resulting in membrane cracking, reactant cross-leakage and poor electrode-membrane contact. Therefore, a cost-effective membrane, with proton conductivity that is less sensitive to change in water content, is needed.
Another important issue for >100oC operation is cell voltage loss. Only a minor portion of the cell
voltage loss is in fact caused by the membrane ohmic resistance increase. The majority of the voltage loss increase is due to the increase in cathode polarization. In order to achieve the high-temperature cell performance goal, cathode performance improvement is essential.
Based on the literature survey, no membranes or MEAs reported so far can achieve all the above required goals. This research is directed at developing novel high-temperature, composite proton exchange membrane-electrolyte assemblies for PEMFC for building applications.
Approach
The overall objective is to operate PEMFCs at 100-140oC to improve CO tolerance, mitigate water and thermal management challenges and reduce membrane cost. The basic approach is to develop a composite membrane consisting of mechanical support and high-temperature proton conduction phases. In order to improve cathode performance, modification of cathode formulation and structure is on-going. Promising solid superacids are incorporated into the cathode.
Results
A number of composite membranes and MEAs have been developed to improve water retention and proton conduction at 120oC. Additives/modifiers with specific properties have been synthesized. The performance of the fabricated MEAs in laboratory-scale cells has been characterized to screen promising formulations. The negligibly low anode polarization loss at >100oC has been verified. Significant improvements in 120oC performance and endurance have been achieved. The ohmic resistance and cross-over goals of the membrane have been met. MEA performance of ~0.6 V at 400 mA/cm2 under realistic system operating conditions (atmospheric, low relative humidity, high utilizations) has been achieved in a 500 h 25-cm2 cell endurance test (Figure 1). The MEA Pt loading was 0.4 mg/cm2 for each electrode. This represents one of the best cell performances ever reported in the literature. Performance of >750 mV at 120oC was also achieved under pressurized operating condition (30 psig). These results are highly promising.
298

Hydrogen, Fuel Cells, and Infrastructure Technologies FY 2002 Progress Report
The main activities for the remaining part of this program will focus on optimization of the promising membrane-electrode assembly, scale-up to nominal 300 cm2 and validation in single cells followed by short stack evaluation. The program is scheduled to be completed in February 2003.
Conclusions
An MEA performance of ~600 mV at 400 mA/cm2 under realistic system operating conditions has been demonstrated, representing a major milestone towards developing a viable atmospheric PEMFC system. To further enhance cell performance (to desired operating conditions of 0.8 V at 400 mA/cm2), optimization of cathode structure and formulation to enhance proton conduction and cathode catalyst utilization is required.
Publications/Presentations
1. C. Yuh, P. Patel, R. Kopp, S. Katikaneni and S. Grot, "Novel Composite Membrane-Electrode Assembly for High-Temperature PEMFC," 3rd International Symposium on Proton Conducting Membrane Fuel Cells, The Electrochemical Society Fall Meeting, Salt Lake City, Utah, October 20-24, 2002.
2. C. Yuh, "R&D on an Ultra Thin Composite Membrane for High-Temperature Operation in
PEMFC," Annual Report to US DOE, for the Period of September 1999 to August 2000.
Figure 1. MEA performance of ~0.6 V at 400 mA/cm2 under realistic system operating conditions (atmospheric, low relative humidity, high utilizations) has been achieved in a 500 h 25-cm2 cell endurance testing.
299


