Page 1
Section VII
Photogrammetric Surveys
Table of Contents
A. General ................................................................................................................. VII-3
1. Photogrammetric Advantages ........................................................................... VII-3
2. Photogrammetric Disadvantages ...................................................................... VII-4
B. Photography......................................................................................................... VII-4
1. General ............................................................................................................. VII-4
2. Photograph Collection ....................................................................................... VII-4
a. Aircraft ......................................................................................................... VII-4
b. Flight Conditions .......................................................................................... VII-4
c. Flight Layout ................................................................................................ VII-5
d. Camera ........................................................................................................ VII-7
e. Scale Calculation ......................................................................................... VII-8
f. Scale Variation ............................................................................................. VII-8
g. True Scale ................................................................................................... VII-9
h. Uniform Scale ............................................................................................ VII-10
i. Vertical Digital Photography........................................................................ VII-10
j. Overlapping Imagery .................................................................................. VII-11
k. Acceptable Tolerances .............................................................................. VII-11
l. Image Post-Processing ............................................................................... VII-12
m. Image Storage .......................................................................................... VII-13
C. Photographic Ground Control .......................................................................... VII-13
1. General ........................................................................................................... VII-13
2. Control Points ................................................................................................. VII-14
a. 4-legged “Cross” Targets ........................................................................... VII-15
b. 3-legged “Tee” Targets .............................................................................. VII-15
c. 3-legged “Wye” Targets ............................................................................. VII-16
D. Photograph Annotation ..................................................................................... VII-18
Page 2
Photogrammetry
VII-2 Revised January, 2013
1. Contact Control Photos ................................................................................... VII-18
2. Annotated Photo Enlargements ...................................................................... VII-18
E. Terrain, Planimetric, and Digital Image Collection .......................................... VII-21
1. General ........................................................................................................... VII-21
2. Collection Format ............................................................................................ VII-21
3. Planimetric Mapping ....................................................................................... VII-21
4. Digital Terrain Model (DTM) ............................................................................ VII-22
5. Data Acquisition .............................................................................................. VII-23
6. Accuracy Standards ........................................................................................ VII-23
7. Accuracy Testing ............................................................................................ VII-24
8. Digital Imagery ................................................................................................ VII-24
Page 3
Section VII
Revised January, 2013 VII-3
VII. Photogrammetry A. General
Photogrammetry can be defined as the science of making reliable measurements by using
photographs or digital photo imagery to locate features on or above the surface of the earth. The
end result produces the coordinate (X, Y, and Z) position of a particular point, planimetric
feature, or graphic representation of the terrain.
Photogrammetry has evolved into a limited substitution for ground surveying. It can relieve
survey crews of the most tedious, time consuming tasks required to produce topographic maps
and Digital Terrain Models (DTMs). Ground survey methods will always remain an
indispensable part of Photogrammetry and are not replaceable by the photogrammetric process.
WYDOT’s Photogrammetry Unit compiles or obtains terrain and planimetric data, then converts
it into useful information for various WYDOT programs. That information may include
photographic mosaics, photo prints and enlargements, planimetric and topographic mapping,
DTMs, ortho-rectified imagery, and various other mapping related tasks to be used for
engineering and design purposes. The data may be obtained through ground survey methods,
photogrammetric methods, or both to produce a complete and accurate representation of the
topography as it exists.
Increased information of existing terrain conditions allows designers to explore alternative
alignments without having to collect additional field information. Surveys collected
photogrammetrically, have both advantages and disadvantages when compared with ground
surveys.
1. Photogrammetric Advantages
Aerial imagery provides a permanent record of the conditions as they existed at the time
the photograph was taken.
Photos can be used to convey information to the general public, other state or federal
agencies, and other WYDOT programs.
Small scale images and/or mosaics can provide a broad overview of a project, identifying
both topographic and cultural features.
Terrain data and mapping features can be extracted from stereo image models with little
effort and at a low cost.
Mapping and digital terrain modeling of large areas can be accomplished quicker and at a
lower cost when compared to ground survey methods.
Photogrammetry can be used in locations that are difficult or impossible to access from
the ground.
An experienced survey crew can quickly target and control a proposed project scheduled
for photogrammetric mapping.
Page 4
Photogrammetry
VII-4 Revised January, 2013
2. Photogrammetric Disadvantages
Seasonal weather patterns that produce increased wind and cloud cover may hamper the
ability to perform the mission.
Solar conditions such as sun angles less than 25° above the horizon will cast long
shadows. Sun angles greater than 45° will produce sun spots on the image.
It may be difficult or not possible, to collect measurements where dark shadows, dense
vegetation, snow, overhangs, and water may exist.
Except for the ground survey, all photogrammetric tasks are performed at the Cheyenne
Headquarters Building. The Photogrammetry Unit has all the equipment (airplane, camera,
mission planning & post-processing software, data management, stereo plotter workstations, PC
editor workstations, and scanners) and personnel (pilot, photographer, image technicians,
photogrammetrists, and map editors) to collect the data.
B. Photography
1. General
This section discusses the equipment, materials, and methods used to obtain the images taken
from an aircraft and used by the Photogrammetry Unit. Generally, black and white images
are used for laying out target locations and determining mapping limits. Color images are
used for mapping and image ortho rectification. Near-infrared images are used to better
identify ground cover, land uses, and geological activity.
2. Photograph Collection
a. Aircraft
The Department’s aircraft used in flying aerial photo missions is currently a Cessna 208
(675 Caravan). It has an approximate maximum flying altitude of 25,000 ft. and a
maximum air speed of 175 knots (200 mph). The aircraft is based out of Cheyenne and is
maintained by WYDOT’s Aeronautics Division. Due to the weather and ground
conditions required to produce quality images, P&S has a full-time pilot and
photographer on staff to allow for the flexibility necessary in scheduling photo missions.
The aircraft is outfitted with a GPS navigation system with a pilot display interface to
assist the pilot to a predetermined location. The display indicates the altitude required for
the mission and flight line the pilot is required to maintain.
b. Flight Conditions
Obtaining a high-quality image depends on several factors, including cloud, snow, or
vegetation cover; wind; sun angle; and equipment. Fortunately, Wyoming has a long
photography season or “window of opportunity.” The following conditions impact the
quality of the image.
(1) Weather
Weather conditions in Wyoming are hard to predict and may cause delays in
acquiring the images. Ideal conditions are clear skies, no winds aloft, and dry ground.
Page 5
Section VII
Revised January, 2013 VII-5
Strong winds cause upper air turbulence that makes it difficult to maintain good
direction.
(2) Seasons
For optimum sun light conditions for engineering photography, the sun’s direction
and angle above the horizon are critical. The optimum sun angle for mapping
imagery is between 25° and 45° above the horizon. Angles above 25° provide
enough reflective light and minimize the effects of long shadows. Sun angles below
45° eliminate shadows and hot spots created by the aircraft. During the winter
months, the sun is lower, so the acceptable light angle is available only for a few
hours around midday. During the summertime there are a couple of hours in the
morning and afternoon where there are “windows of opportunity”, while the midday
sun is unacceptable due to the sun spots and aircraft shadows. These optimal
photography times vary throughout the year and can be found in Table VII-2. Non-
engineering quality images, such as systems, reconnaissance, and snow studies can be
taken with a sun angle greater than 45°.
Early spring is the best time to take mapping images. By then, winter snows have
hopefully melted and left matted down vegetation. Crops and vegetation have not
begun to grow or are in the early stages of growth. This minimizes the
interference in obtaining reliable vertical measurements caused by standing weeds
or grasses.
In areas of deciduous trees, early spring is best before leaves have budded out.
Late autumn can be ideal as well after the leaves have fallen from the trees.
In areas of conifer (evergreen) forests and open prairie, images can be taken
almost any time between spring snow melt and autumn snowfall. Snow study
images have to be taken while there are sufficient accumulations of snowfall.
c. Flight Layout
Once the project limits and the type of project, rural or urban, have been identified, the
appropriate flying height is determined to provide adequate photo coverage for mapping.
The flying height determines the flight line target spacing to be physically laid out by the
survey crew. As the target locations are identified, geographic coordinates for each
location are recorded for use in the mission planning.
Mission planning is conducted using Z/I Mission planning software. Z/I Mission allow
P&S personnel to import the target coordinates onto a digital USGS quad map. The
mission flight paths are then laid out using those targets as a guide while taking into
account the existing terrain features and proposed limits to be collected. When complete
the mission can be exported to a Google Earth file for review and to ensure the project
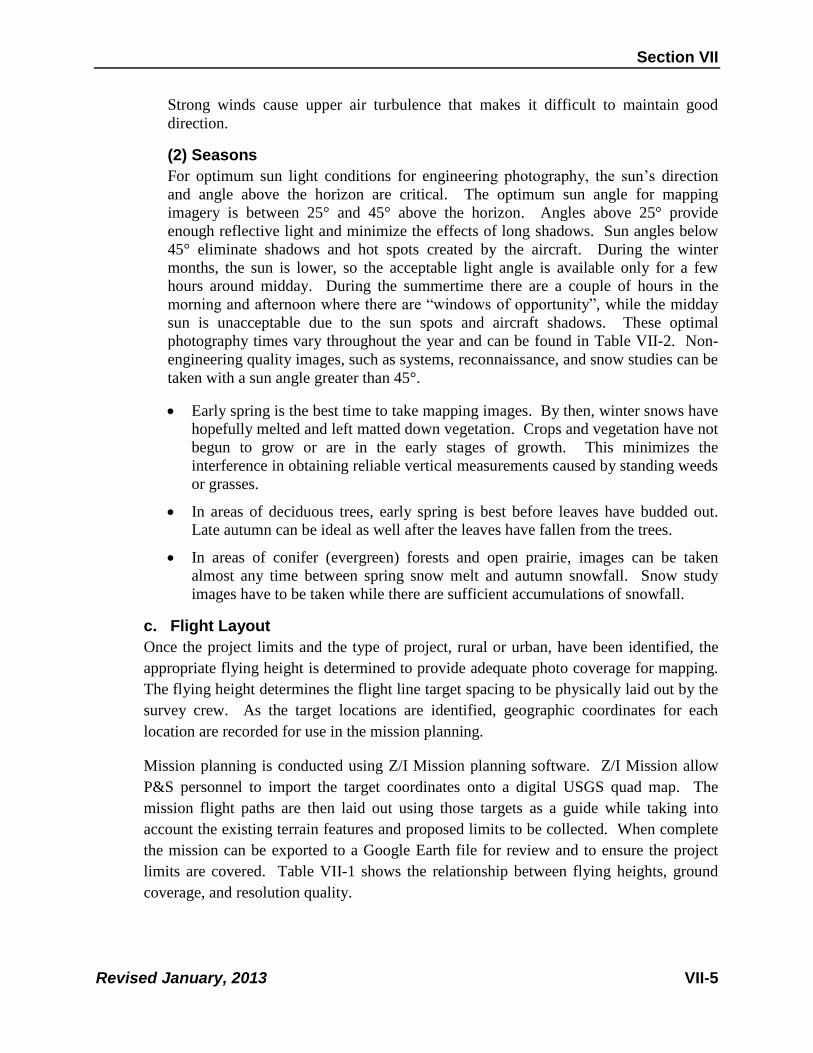
limits are covered. Table VII-1 shows the relationship between flying heights, ground
coverage, and resolution quality.
Page 6
Photogrammetry
VII-6 Revised January, 2013
Project Type
Ground Coverage
Flight Pixel Along Flight Line
Height Resolution Length Width
(ft) (in) (ft) (ft)
Urban Projects 1500 1.8 1152 2074
Rural Projects 2000 2.4 1536 2765
Systems 7075 8.5 5434 9780
Misc. 9450 11.3 7258 13063
Table VII-1. Coverage chart.
After the mission flight lines have been finalized, output files are created and transferred
to the camera in-flight system to assist the pilot and camera operator in the performance
of the image collection process.
Month Day Mountain Daylight Savings Time
April 8 – 14 9:07 a.m. – 11:12 a.m. or 3:17 p.m. – 5:22 p.m.
15 – 30 8:54 a.m. – 10:52 a.m. or 3:32 p.m. – 5:31 p.m.
May 1 – 31 8:31 a.m. – 10:23 a.m. or 3:55 p.m. – 5:48 p.m.
June 1 – 30 8:07 a.m. – 9:56 a.m. or 4:24 p.m. – 6:15 p.m.
July 1 – 31 8:09 a.m. – 9:58 a.m. or 4:43 p.m. – 6:22 p.m.
August 1 – 14 8:30 a.m. – 10:18 a.m. or 4:16 p.m. – 6:07 p.m.
15 – 31 8:42 a.m. – 10:35 a.m. or 3:58 p.m. – 5:51 p.m.
September 1 – 14 8:59 a.m. – 11:01 a.m. or 3:23 p.m. – 5:25 p.m.
15 – 30 9:16 a.m. – 11:34 a.m. or 2:40 p.m. – 4:58 p.m.
October 1 – 14 9:39 a.m. – 4:25 p.m.
15 – 31 10:04 a.m. – 3:51 p.m.
Month Day Mountain Standard Time
November 1 – 14 9:43 a.m. – 2:08 p.m.
15 – 30 10:25 a.m. – 1:27 p.m.
December 1 – 14 11:40 a.m. – 12:22 p.m.
15 – 31 Sun angle less than 25° above horizon
January 1 – 31 Sun angle less than 25° above horizon
February 1 – 14 10:38 a.m. – 2:14 p.m.
15 – 28 10:00 a.m. – 2:53 p.m.
March 1 – 14 9:25 a.m. – 3:24 p.m.
15 – 31 8:53 a.m. – 3:50 p.m.
April 1 – 7 8:18 a.m. – 10:30 a.m. or 2:02 p.m. – 4:14 p.m.
Table VII-2. Aerial photography windows of opportunity.
Time determinations obtained from www.sundesign.com/sunangle. These times are valid at latitude 43°N
latitude and 108° W longitude, and elevation 6000’. For each longitudinal degree east, subtract 4 minutes
from each end of the time interval. For each longitudinal degree west, add 4 minutes from each end of the
time interval.
Page 7
Section VII
Revised January, 2013 VII-7
d. Camera
In 2007 WYDOT purchased Intergraph’s Z/I Imaging Digital Mapping Camera (DMC)
system, to replace the existing film based system. The camera system is comprised of a
DMC main camera assembly, gyro stabilization mount, integrated computer system, and
solid state disk (SSD) for on-board data storage of images. The DMC also has an inertial
measurement unit (IMU) to improve the onboard GPS solution and strengthen the aerial
triangulation results during the bridging process. The Gyro stabilized mount removes the
effects of vibration in the imagery during collection. The gyro mount also compensates
for roll, pitch, and yaw of the aircraft so the principle and nadir points are relatively
equal. An electronic forward motion compensator (FMC) removes blurriness resulting
from the forward motion of the aircraft at the time of the exposure.
The DMC main camera has 8 individual cameras that are autonomous, 4 panchromatic
and 4 multispectral (red, green, blue, and near infrared). These cameras are able to
produce images in black and white, colored, or colored near infrared with a 12 bit
resolution. Each image is approximately 272 megabits and the SSD can store roughly
1200 images.
The camera focal length is 4.72” (120 mm), with a sensor dimension (also known as the
negative in film cameras) of 3.63” x 6.53” (92.16 mm x 165.89 mm). A basic principle
of the optics is that all light rays pass through the nodal point (center of the lens).
Therefore, the center of the lens is the reference point for measuring the distance above
ground. The basic geometric relationship shown in Figure VII-1 is that of similar
triangles.
Figure VII-1. Theoretical camera exposure diagram.
Page 8
Photogrammetry
VII-8 Revised January, 2013
e. Scale Calculation
The similar triangle relationship, as shown in Figure VII-1, is the basis for calculations
involving scale, ground coverage, and flying height. The relative scale of the image can
be calculated in different manners depending upon the requirements. The following
equations can be used for scale calculation:
Scale = D/d = H/f = (H’ - h)/f
d = distance on photograph (a-b) f = focal length of camera lens
D = distance on ground (A-B) H’ = flying height above mean sea level
H = flying height above average ground h = average ground elevation
Scale Calculation Example:
H = 1500 ft. and f = 4.72 in.
1:1 Image Scale = H/f = 1500 ft./4.72 in. = 318 ft./in.
If the flight height is not known, look for objects that are identifiable on the ground and
on the photo. Take a measurement between the objects on both and divide the
photograph measurement into the ground measurement to get the photo scale.
Photo scale can also be expressed as a representative fraction or ratio. A ratio is without
units but can be expressed in any unit of measurement. The units are the same (i.e., a
ratio of 1:24000 or 1/24000 means 1 unit is the same as 24000 units). Applying this to an
aerial image, 1 inch on the photo equals 24000” (or 2000’) on the ground. Flying height
requirements for the desired mapping scales are located in Table VII-3.
Project Type
Flight Photo Scale
Height
(ft) (1” = ___ ’) Ratio
Urban Projects 1500 315 1:3780
Rural Projects 2000 425 1:5100
Systems 7075 1500 1:18000
Misc. 9450 2000 1:24000
Table VII-3. Aerial photography chart.
f. Scale Variation
The hypothetical situation in Figure VII-1 will result in an image that has a uniform scale.
However, there are four reasons why this situation, for practical purposes, will not occur
in the real world. Those situations affecting the scale of the image are shown in Figure
VII-2. Due to changes in ground elevation, tilted optical axis, flying altitude, and earth’s
curvature, the stated scale of a given image is an approximate, non-uniform scale.
Page 9
Section VII
Revised January, 2013 VII-9
Figure VII-2. Scale variations.
g. True Scale
Since WYDOT’s Photogrammetry & Surveys Section (P&S) uses an average ground
elevation in the calculations for flying height, the true scale of a photo print cannot be
determined without making ground measurements between objects that are identifiable
on the image. The ground distance and the distance on the image can be used in the
formula given on page VII-8 to calculate the true scale. This true scale calculation is
semi-accurate only between the two points used. The image will not have a uniform
scale until all the variations have been removed.
Page 10
Photogrammetry
VII-10 Revised January, 2013
h. Uniform Scale
Orthographic projection is the only process that will create a truly uniformly scaled
digital image. These projections are commonly called ortho-photos and are the only
products that can be classified (by definition) as a map. They are created by matching
each individual DTM ground shot with the image location the shot was collected from.
The final ortho-image has been rectified using thousands of ground shots per image
model. If a DTM does not exist, image rectification can be performed at a lesser quality
using photo control points or a USGS Digital Elevation Model (DEM). This type of
rectification process can remove the major effects of scale variations but cannot remove
all the effects.
i. Vertical Digital Photography
Vertical digital photography refers to the direction of the camera’s optical axis, which is
down in the direction of gravity. This is the position of the camera in which the image’s
Principle point and Nadir point are the same during the exposure process. The Principle
point is the point where the perpendicular projection through the center of the
lens intersects the photo image center. The Nadir point is the vertical projection from
the camera center through a point on the photo image as shown in Figure VII-3.
Figure VII-3. Image orientation
The truly vertical situation occurs rarely in the real world, as diagramed in Figure VII-3a,
but it better reflects the situations identified in Figure VII-3b. This is why a point called
the Isocenter and Nadir point play an important role in Photogrammetry. The Isocenter
falls halfway between the Nadir and Principle point and is the location where all tilt
displacement on the image radiates from. The Nadir point is the location where all
elevation displacement radiates from.
Page 11
Section VII
Revised January, 2013 VII-11
j. Overlapping Imagery
Aerial photography taken from above is rarely a single shot event. Multiple photographs
taken along a flight path are generally taken to ensure complete photo coverage of an
area. To achieve this we must have overlap between photo images. The overlapping of
photos end to end is termed end lap. An end lap of 30% will avoid potential missing
areas of coverage due to the effects of turbulence. Imagery collected for use in stereo
viewing, an end lap of 60% is considered ideal.
For block coverage of an area at a specific photo scale, it is often necessary to fly parallel
strips of aerial photography. The adjacent strips also overlap each other. This
overlapping area is termed side lap and is generally specified at 30% to ensure good
coverage.
k. Acceptable Tolerances
The acceptable tolerance for altitude variation during image collection is plus 5% or
minus 2% of the predetermined altitude. Thus, if the desired altitude is 2000’ above
ground (AG), the acceptable range for altitude is between 2100’ AG and 1960’ AG. For
both urban and rural projects, the trigger limit is set to 200’ of either side of the flight line
while the systems imagery is set to 300’. The trigger limit is the planned flight path
corridor the aircraft must maintain during image collection process. If the aircraft strays
beyond that corridor, the camera will disengage from image collection. The incomplete
flight strip will need to be redone.
Image end lap tolerances throughout a flight strip shall average not less than 57% or more
than 62%. No individual end lap within a strip shall be less than 55% or greater than
68%. Side lap may vary from 20% to 40% unless otherwise specified.
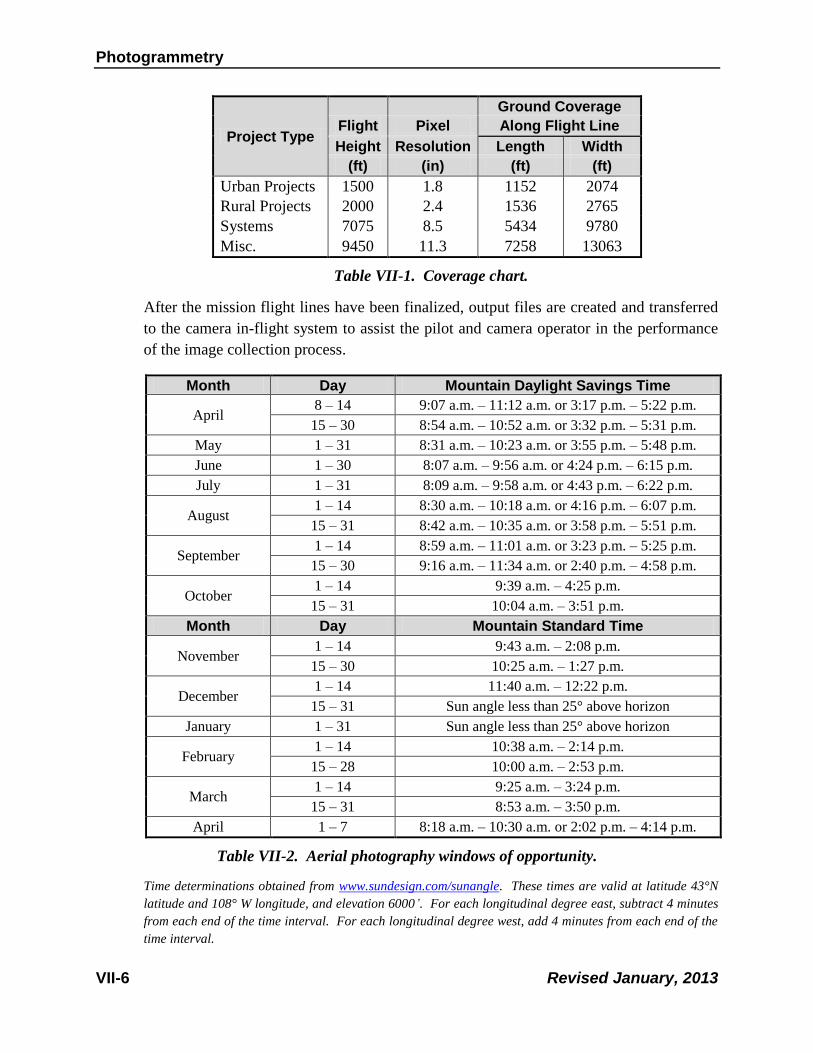
In addition to satisfying altitude, end lap, and side lap requirements, other factors
contributing to the acceptance or rejection of photography are course correction, crab, tilt,
and image quality. The crab and tilt can be somewhat compensated by the gyro stabilized
camera mount. For crab and changes in course correction, the resultant error between
images cannot exceed 3°. The tilt within a single frame may not exceed 4°, nor shall the
difference in tilt between two consecutive frames exceed 4°. See Figure VII-4. The
average tilt for all images of the same scale cannot exceed 1°. The combined effects of
aircraft course correction, crab, and tilt must not result in an apparent crab greater than 5°
on successive images. Apparent crab is defined as the angle between the intended flight
path and the line between adjacent image principal points within the same flight line.
Page 12
Photogrammetry
VII-12 Revised January, 2013
Figure VII-4. Effects of wind and turbulence on aircraft during photo collection.
l. Image Post-Processing
The task of processing the 4 panchromatic and 4 multispectral raw images captured by
the DMC’s 8 individual cameras is performed by Z/I’s Post Processing software (PPS).
The process converts the 8 individual images into a standard central-perspective image.
These images have to be processed to compensate for numerous radiometric factors.
Radiometric correction is a process of assigning pixels a value from 0 to 256 on the
monochromatic scale and up to 16,384 shades of color. The pixel resolution can either be
8 or 12-bit, with 12-bit being the highest quality image. This will produce an image that
is distinguishable from different light intensities and allows the photogrammetrist to
adjust the image contrast to improve data collection. Generally, hundreds of images are
collected during each photo mission. To increase our image processing capability, Z/I’s
distributive software allows PPS the ability to function on multiple computers.
Scale distortion is another issue to address with aerial imagery as it increases the farther
we move away from the image principle point. To resolve this problem, Z/I’s
ImageStation Aerial Triangulation (ISAT) software matches multi-ray tie points between
adjacent images using a robust built-in bundle adjustment that removes distortions to
produce an image with spatial intelligence.
Page 13
Section VII
Revised January, 2013 VII-13
After all these steps, the end result is a geo-referenced colored panchromatic sharpened
image with a size of 13,824 x 7,680 pixels, or a 106 mega-pixel image.
m. Image Storage
In the past P&S was required to store all aerial film photography in a physical location
for future retrieval by the Department or other outside entities. Even though we are now
a fully digital shop, we still must store those images as a record of historical value and
future retrieval. However, they are not kept in a physical location, rather than are stored
on a dedicated server. All newly acquired DMC processed imagery and scanned
historical aerial film photography, are placed on that server. To manage this enormous
amount of data, WYDOT has purchased Intergraph’s Terrashare Image Manager. Image
Manager permits easy search, retrieval and viewing capabilities to those users wishing to
acquire this photography. Meta data stored on a local WYDOT Oracle database, specific
to each photo image is inputted and linked through Terrashare. Access is achieved
through a run time program installed on user PC’s called Terrashare Client. This system
also allows for the development of web based architecture so that outside organizations
can view our imagery over the internet.
C. Photographic Ground Control
1. General
To make precise and meaningful measurements from aerial photographs, it is essential to
relate the photo images to the actual ground surface. This is achieved by physically tying
horizontal and vertical positions of various photo identifiable points or pre-flight targeting
placed within the project photo limits.
Figure VII-5. Two photo stereo model.
Page 14
Photogrammetry
VII-14 Revised January, 2013
Three photo control points are required at the beginning and end of each planned flight strip.
The flight line target spacing is a factor of the flight altitude to insure at least one photo
control target falls within each digital image. Wing points are typically placed on either side
of the flight path, every other flight interval space, at a distance of 75% - 85% of the target
interval spacing.
With the advancements in GPS and digital camera technology, mission planning and in flight
guidance software have greatly reduced flight time, collection problems, and errors due to
misplaced targeting. It has allowed the pilot the ability to concentrate on flying the aircraft
rather than searching for and staying on the correct flight path. Before this technology, P&S
would manually shoot all project photography on target to achieve the 60% overlap required
for stereo viewing. Many missions had to be re-flown due to the human error potential both
on the ground in targeting and in the air during the photo collection. The Mission planning
and in-flight software have all but eliminated these errors. Flight line and altitude, image
overlap, and collection locations are all predetermined in the office using Z/I’s mission
Planning software. Z/I in-flight reads those mission files to guide the pilot over the project
flight line. The camera will automatically cycle over each preset exposure location along the
flight path. Because of the onboard GPS and internal camera IMU, each image has spatial
intelligence at the time of collection. When combined with the ground control, a stronger
bridging solution is achieved during the auto triangulation process.
Images with spatial intelligence reduce the amount of targets required for aerial triangulation
by tying each image together. Aerial triangulation (sometimes referred to as bridging) is
similar in theory to the field survey process of triangulation. It establishes a coordinate
relationship between the project control points and the supplemental bridging points.
Because of the time and labor savings, all photogrammetrically collected projects are
bridged. Bridging also allows for check of the field measurements and the elimination of
some field work in inhospitable areas (adverse terrain and un-trespass able lands).
For some projects only requiring imagery for GIS purposes, it is possible to not have any
established photo control to create this product. A set of GPS base stations, collecting at half
second intervals, positioned over known monuments within in the area are more than
adequate. The rectification process is then accomplished using USGS DEMs, and the GPS
solution created from the on board GPS/IMU and ground base stations. With the limitations
of signal strength and terrain conditions, this process works best on projects located in areas
with open terrain. The advantage of this procedure reduces the man-hours required for
targeting activities to zero.
2. Control Points
Photo pick points can be used, but the potential for error increases. Confusion may occur on
which point for the field to tie or which point P&S should use. It is generally preferred to set
photo control targets for mapping projects prior to image collection. Photo pick points are
sometimes used if a target has been lost.
WYDOT uses three basic target configurations, the 3-legged “tee,” 3-legged “wye,” and 4-
legged “cross” targets. See Figures VII-6, VII-7, and VII-8 for target configuration, layout,
and placement.
Page 15
Section VII
Revised January, 2013 VII-15
a. 4-legged “Cross” Targets
Identify flight line photo control. They are used by the Photogrammetry Unit to assist in
laying out the flight mission. These targets are to be tied vertically and horizontally. The
distance between two cross targets should be no more than 3% longer or 10% shorter
than the designated target spacing. These targets may be placed in the right-of-way or
median, or painted on the roadway surface. When placed on the existing pavement, they
should be painted on the shoulder or in one lane of traffic to reduce the amount of traffic
control required during placement and control activities.
Figure VII-6. Flight line target.
b. 3-legged “Tee” Targets
Identify the location of wing points. Their locations are determined by the mission flight
lines and are to be tied vertically and horizontally. The distance a wing point is to be
placed from the flight line must be 75 to 85% of the 4-legged flight line target spacing. If
permission to survey is not received or access to a location is difficult, flight lines and
wing points will be adjusted to avoid those areas.
Page 16
Photogrammetry
VII-16 Revised January, 2013
Figure VII-7. Wing point target.
c. 3-legged “Wye” Targets
Identify the locations of project control monuments, right-of-way markers, section
corners, etc. They are not generally used for stereo compilation.
Figure VII-8. Additional control target.
Page 17
Section VII
Revised January, 2013 VII-17
Figure VII-9. Photo targeting and flight line diagram.
Project Type
Centerline Wing Point Target
Flight Target Distance off of
Height Spacing Centerline
(ft) (ft) Min. (ft) Max. (ft)
Urban Projects 1500 900 675 775
Rural Projects 2000 1200 900 1025
Systems 7075 4300 3225 3650
Misc. 9450 5800 4350 4925
Table VII-4. Targeting spacing.
Page 18
Photogrammetry
VII-18 Revised January, 2013
Figure VII-10. Obstruction example.
D. Photograph Annotation
1. Contact Control Photos
After the project has been flown and images processed, colored photo mosaics of the project
are created for identification and annotation of project and photo control targets. These
mosaics are also used as reference for all involved programs during the design process. A
mosaic is a collection of images stitched together to create a continuous image. Mosaics are
not considered engineering quality and cannot be used to measure natural or cultural features.
These mosaics will contain all flight line targets, wing points, and project control monument
locations.
2. Annotated Photo Enlargements
A black and white photo mosaic is also created for the purpose of map feature identification
and annotation. This mosaic is created at a large enough scale to provide room for annotation
of all utilities and photo identifiable objects within the project limits. This activity is
conducted by P&S Surveys, resident crew, or survey consultant. Ideally, this should be
completed before map compilation activities begin to aid the plotter operator during
collection. If these annotations are not complete by the time the mapping is complete, paper
prints of the mapping can be used for review and annotation of missing utilities and features.
If care is taken, objects can be measured from identifiable points on the photos or mapping
Page 19
Section VII
Revised January, 2013 VII-19
prints and drawn at their approximate location. Color coding is helpful for locations with a
large number of features requiring identification. Depending on the scope of the project,
some features may require survey ties. As a general rule, utility information or features that
are underground should be located by their owner and then surveyed for accuracy. The
feature code list in Chapter 4 of the Data Collection Manual has all codes and symbols to be
used for feature identification. Symbology for utility and various features can be found on
the plan set title sheet for reference during annotation. Ownership and type of utility should
be included on the annotated photos. Examples of features that should be annotated are:
Buried pipelines (type and size)
Gas lines (type and size)
Buried or overhead power lines (type and number of lines)
Buried or overhead television cables (type and number of lines)
Buried and overhead telephone cables (type and number of lines)
Water lines, buried (type and size)
Well (type)
Sanitary and storm sewers and storm sewer inlets (type and size)
Water valves
Gas and water hook-ups to buildings
Any utilities that are in the right-of-way or cross it
Fences (type and size)
Culverts (type and size)
Drain pipes (type and size)
Irrigation ditches and structures. Include direction of flow.
Street and traffic lights
Signs (type)
Mines
Graves
Underground tanks, etc. Either in-use or abandoned.
Anything pertinent to the project that should be on the permanent plans. Lines should be
drawn to show the direction and/or connections of buried utility lines and overhead
power, telephone, or cable lines.
When annotations are sent to the field, or survey consultant, to be completed, the following
form will accompany them. The form should be filled out by the individual(s) performing
this task and returned to P&S. Care must be taken to insure all annotations are easily
interpretable.
Page 20
Photogrammetry
VII-20 Revised January, 2013
Annotated Photos or Prints
Job # Alignment Number of Photos or Pages
Colors: DO NOT USE: BLACK, YELLOW, WHITE, OR GRAY (they do not show up well).
USE: photo color pencils that show up and are sharp.
Text: See top or bottom indications on photo. Text to be annotated in the direction of the
proposed station alignment.
Utilities: Fiber Optic, Gas, Oil, Power, Sewer, Telephone, TV, Water
1. Show where utilities cross the road or right-of-way above or below ground.
2. Use the survey code or line style (See Legend).
3. Above Ground Utilities:
Only draw overhead lines across the road (labeled with # of wires).
When not crossing the road, show the pole w/ tics indicating the direction of the line.
Labeling in between poles as needed, especially when # of wires changes.
Connect the poles when there are too many to tell direction from the tic marks.
4. Under Ground Utilities: Show complete line.
5. Label utilities with company or owners name as needed at least once per photo.
Fences:
1. Write out description of fence, or use an understandable abbreviation.
(3’ woven wire w/ 3 barb) (3’ WW/3 BW) (3’ barbed wire) (3 BW).
2. Show sizes and types of gates and cattle guards. (25’ steel gate) (15’ cattle guard).
3. Show where fence types change.
Hydrology:
1. Label drainage culverts with size and type (24” CMP) (15” x 30’ x 35’ ARCH CMP).
2. Show and label flared ends on pipes (24” CMP W/ FLARED ENDS).
Roadway:
1. Label guardrail with the type (Box Beam Guardrail) (W-Beam Guardrail).
2. Show Railroad and ownership.
Size:
1. Show if it is: Billboard, Major, Small, or Structural sign (use feature code or symbol from
legend).
2. The information that is on the sign is NOT needed.
Name Photos or Pages Annotated
NOTE: Have someone review your annotations. If they can’t read and understand them, we can’t
either.
Please fill out and return this sheet with the completed annotations.
Figure VII-11. Annotation form.
Page 21
Section VII
Revised January, 2013 VII-21
E. Terrain, Planimetric, and Digital Image Collection
1. General
P&S currently has four Image Station Z-IV stereo plotters for mapping and terrain
compilation and one SSK WorkStation used for both aerial triangulation and quality control
checks. All five machines are PC Workstations running under a Windows XP operating
system.
2. Collection Format
All stereo plotter compiled, field surveyed, and annotated mapping and digital terrain data is
placed and edited into the latest version of Microstation. These files contain both 2-D
planimetric and 3-D terrain data.
When the mapping file is created, the 2-D planimetric details are separated from the 3-D
terrain data and placed into their separate models within the project Microstation file. The 2-
D planimetric data can be found in the mapping model, with elevations set to zero. Three
dimensional terrain data can be found in the DTM model.
All data is compiled with coordinate values to the nearest 1/1000 of a foot.
The working units are set at: The Global Origin is set to:
Master Units = ft X = 0
Sub Units = th Y = 0
Positional Units = 1 Z = 2,147,483.6470
To better inform users of the quality of the mapping and terrain they are using, P&S has
created three separate Microstation levels to help identify the collection type. They are from
highest quality to lowest, field surveyed “S” feature level (PS_X_S_XXXX), stereo plotter
compiled “P” feature level (PS_X_P_XXXX), and annotated “A” feature level
(PS_X_A_XXXX).
3. Planimetric Mapping
All map features are collected as outlined on the WYDOT Feature Code List located in
WYDOT’s Data Collection Manual. Each feature has a corresponding level, color, line code,
line weight, font, symbol, and character assigned to it. Features not specifically included in
the Feature Code List are identified using the most equivalent symbol and descriptor from the
list.
All planimetric features that are visible, identifiable, or interpretable on the aerial photograph
are collected. Particular attention is given to all transportation and transportation-related
features, such as roads, railroads, bridges, canals, streams, dams, utilities, and drainage
ditches, as well as other features along the roadway corridor. Compiled road edges consist of
curves and tangent line segments. The widths of roads and streets are shown as the
separation between curb faces, hard surface edges, or stabilized shoulder lines, as
appropriate.
Page 22
Photogrammetry
VII-22 Revised January, 2013
4. Digital Terrain Model (DTM)
The data collected to build a DTM consists of break lines and mass data point locations. See
Figure VII-13. Break lines identify terrain discontinuities, such as drainage ditch bottoms,
ridges, toe of slopes, roadway berms, and any sharp change in the existing surface.
Figure VII-12. Typical DTM feature collection.
Break lines are essential for the building terrain Triangle Irregular Network (.tin) models,
which are used in the creation of the topographic map. They force the triangle legs to tie into
the break line of the discontinuity. A ditch bottom or terrain irregularity left undefined by a
break line will triangulate across the discontinuity and show the terrain as flat in those areas.
Figure VII-13. Break line example.
Page 23
Section VII
Revised January, 2013 VII-23
5. Data Acquisition
Mass data points identify the XYZ coordinates of a location and are collected in profile or
grid mode. Random mass points may be used when necessary to identify unique terrain
situations, such as a steep irregular hill side with varied vegetation. They are obtained at
locations of significant grade change. The Photogrammetry Unit has established that mass
data points may not be greater than an interval spacing of 15’ inside the corridor width of a
project. Typically the corridor is defined as 150’ either side of centerline of the road. The
corridor may be increased and should be decided during the Surveying Meeting prior to the
collection process. Beyond the corridor limit, terrain data is extracted using Z/I’s
ImageStation Automatic Elevation (ISAE) collection software. ISAE is performed for the
full extent of each model, at a grid spacing of 25’. Although this data is not as reliable as that
physically collected, it does provide design and the Hydraulics’ program with information for
potential borrow or drainage flow patterns. If it is determined an area is critical and in need
of more accurate data, P&S can load the imagery back onto a plotter for collection.
During photogrammetric collection, it may be difficult or impossible for the stereo plotter
operator to accurately collect the terrain data. This may be caused by dark shadows,
buildings, heavy brush, bodies of water, or anything that may be obstructing the ground
significantly. These areas are known as void or obscure areas, and are usually filled by field
supplementation.
6. Accuracy Standards
Ninety percent of all planimetric map features are to be plotted so that their horizontal
positions at the designated map scale are accurate to within 1/40” of their true coordinate
positions. All features cannot be misplaced by more than 1/20” from their true coordinate
positions.
The Digital Terrain Model “Z” coordinate or elevation is governed by the Root-Mean-
Square-Error (RMSE) for all tested points and must not exceed the following ratios for each
terrain condition:
1/6000 of the flight height—for open ground (no interfering ground cover) with uniform
slope.
1/5000 of the flight height—for open ground (no interfering ground cover) with irregular
slopes.
1/3000 of the flight height—for ground with interfering ground cover and irregular
slopes.
No individual error may exceed three times the specified RMSE.
For the purpose of this specification, the RMSE is defined as the square root of the quotient
of the sum of the squares of the errors divided by the number of measurements, or
RMSE = (e²/n)½
Where e is the error at each point (the difference between the value used as a standard and
the value being tested) and n is the total number of points tested.
Page 24
Photogrammetry
VII-24 Revised January, 2013
Table VII-5 relates the different flying heights to our achievable error tolerances.
Project Type
Root-Mean-Square-Error for Stereo Plotters
Flight Open ground w/ Open ground w/ Interfering ground
Height uniform slope irregular slopes w/ irregular slopes
(ft) +/- (ft) +/- (ft) +/- (ft)
Urban Projects 1500 0.250 0.300 0.500
Rural Projects 2000 0.333 0.400 0.667
Systems 7075 1.179 1.415 2.358
Misc. 9450 1.575 1.890 3.150
Table VII-5. Accuracy for various flight heights.
Contour intervals are derived from these accuracies. At least 90% of the elevations shall be
in error by no more than ½ of the contour interval. None shall be in error by more than a full
contour. Table VII-6 shows the contour intervals our maps will have based on Flight Height.
Project Type
Minimum Contour Requirements
Open Interfering Use Use
Open ground ground w/ ground w/ Min. Max.
Flight w/ uniform irregular irregular contour contour
Height slope slopes slopes intervals intervals
(ft) +/- (ft) +/- (ft) +/- (ft) (ft) (ft)
Urban Projects 1500 0.500 0.600 1.000 1 5
Rural Projects 2000 0.667 0.800 1.333 2 10
Systems 7075 2.358 2.830 4.717 5 25
Misc. 9450 3.150 3.780 6.300 10 50
Table VII-6. Mapping contour intervals.
7. Accuracy Testing
After the mapping has been collected, paper prints of the mapping are forwarded to P&S
Surveys, the field or consultant for review. Any corrections are annotated on the mapping
and returned to Photogrammetry for update. Horizontal accuracy of plotted planimetric
features is checked using field survey supplements and/or a stereo plotter. When field survey
supplements are used, angle and distance are measured in the field and compared to the
plotted feature locations.
Vertical accuracies of the DTM may be checked using a field survey and/or a stereo plotter.
Occasionally a random list of photogrammetrically collected spot locations is provided for
crews to physically locate and verify vertical accuracy. That accuracy must meet the RMSE
standards as previously described.
8. Digital Imagery
Technological improvements to computer processing speeds, storage, and software has
provided the Department with an additional avenue for improving the quality of design plans
Page 25
Section VII
Revised January, 2013 VII-25
through coordinately rectified digital photo imagery. The Department can produce image
rectification using photo control or image ortho-rectification using a DTM or USGS DEM of
the photo location.
Image rectification using photo control should not be considered engineering map quality.
This method, termed “rubber sheeting”, stretches the image to the photo control points and
orients the image to its relative position to the ground. It removes some image distortion but
is not sufficient enough to extract reliable measurements. It is, however, very useful for
projects that do not require such accuracies, such as overlays, guardrail improvement, slab
replacement, and roadway enhancements. This type of image rectification is fairly
inexpensive to create and can be produced in a fraction of the time required to collect
mapping and DTM.
Unlike image rectification, which uses four or five photo control points, ortho-rectification
requires a DTM be created or exist. It is a little more time consuming to produce, but the
final product is equivalent to planimetric mapping typically used in design. Ortho-
rectification is created by matching each individual DTM ground shot with the image
location that the shot was generated from. The final ortho-image is rectified using thousands
of shots per image. Reliable measurements can be extracted, but the accuracy of those
measurements is dependent on the scale of photography and the image resolution they are
obtained from.
Both image rectification and ortho-rectification have become useful substitutes or backdrops
to mapping. They help the public understand the intent of the proposed project and may help
avoid confusion or conflict between all parties involved on the project from design through
construction.