31
Stock Idea August 23, 2021 Sector: Consumer Goods Paint your portfolio bright Powered by Sharekhan’s 3R Research Philosophy Indigo Paints Ltd
Stock IdeaAugust 23, 2021Sector: Consumer Goods
Paint your portfolio bright
Powered by Sharekhan’s 3R Research Philosophy
Indigo Paints Ltd

August 23, 2021 2
Company details
Market cap: Rs. 11,564 cr
52-week high/low: Rs. 3,348/2,192
NSE volume: (No of shares)
0.6 lakh
BSE code: 543258
NSE code: INDIGOPNTS
Free float: (No of shares)
2.2 cr
Shareholding (%)
Promoters* 54.0
FII 40.3
DII 3.2
Others 2.52
Sto
ck Id
ea
Price performance
(%) 1m 3m 6m 12m
Absolute -7.4 -1.3 -4.4 -
Relative to Sensex
-13.4 -12.9 -15.6 -
Sharekhan Research, Bloomberg
Reco/View
Reco: Buy
CMP: Rs. 2,431
Price Target: Rs. 3,305
Valuation (standalone) Rs cr
Particulars FY21 FY22E FY23E FY24E
Revenue 723 968 1,258 1,624
OPM (%) 16.9 18.5 21.6 22.3
Adjusted PAT 71 127 191 262
% Y-o-Y growth 48.2 79.8 50.3 36.8
Adjusted EPS (Rs.) 14.9 26.8 40.2 55.0
P/E (x) - 90.8 60.4 44.2
P/B (x) 20.5 16.7 13.1 10.1
EV/EBIDTA (x) 92.0 62.5 41.0 30.1
RoNW (%) 18.6 20.3 24.3 25.8
RoCE (%) 23.3 25.9 31.4 33.6 Source: Company, Sharekhan estimates
Price chart
Consumer Goods Sharekhan code: INDIGOPNTS Initiating Coverage
+ Positive = Neutral - Negative
Indigo Paints Limited (IPL) is an emerging player, which has created a niche for itself in the highly competitive paints industry by launching differentiated products, creating brand equity through one prominent brand ‘Indigo’ and follow bottoms-up approach to expand its distribution in the domestic market. It has market share of 2% but has strong potential to improve it in the coming years. IPL was the first among its competitors to introduce coatings for ceilings, tiles and floors, with competitors entering this space only now. Further, differentiated products helped IPL expand its dealers/distribution network into various markets. Differentiated products contribute ~30% of overall revenues and fetch higher margins compared to other products. IPL has used a bottom-up approach to expand its base in a particular market. To create demand for its differentiated products, IPL initially taps tier-3 and tier-4 cities and rural areas, where brand penetration is easier and dealers have a greater ability to influence customers’ purchase decisions. IPL subsequently leverages on this network to engage with dealers in tier-1/tier-2 cities and metros to expand its base. It has presence in 27 states and is focusing on improving penetration in these states. The company has also introduced tinting machines in target markets to increase sales of emulsions. IPL’s current dealer reach is 16% of the top player and 40% of second-largest paint player in India. Revenue per tinting machine is lowest at Rs. 14.5 lakh versus its peers, indicating a wide scope for growth. Further the company has a unique brand strategy where all products are bundled under one brand ‘Indigo’ which is promoted by brand ambassador – Mahendra Singh Dhoni who has a pan-India appeal. Being an emerging player, the company spends heavily on advertising (~Rs. 77 crore in FY2021, second only to the top player) in the past few years which helped it to establish strong brand equity. This differentiated approach for distribution expansion and higher brand investments will help it to promote conventional paint products in the coming years. A differentiated business model aided the company to achieve strong revenue and PAT growth of 22% and 71% over FY2018-21 with the highest gross margins of ~48% among peers. OPM improved to 16.9% in FY2021 from 6.5% in FY2018 (management targets to achieve OPM of ~18.5% in FY022). Differentiated product portfolio and calibrated pricing strategy helped the company sail through the uncertain business environment caused by second wave of COVID-19 and higher input prices by posting relative stable performance in Q1FY2022. With easing of lockdown norms and raw material prices correcting from its high, the company expects much better performance in the quarters ahead. The rising urbanization, higher willingness to spend behind home improvement in tier 2 and 3 towns, strong traction to differentiate products and market share gains would help IPL to achieve faster recovery in the coming years. Scale up in the business will help the operating margins to further improve and reach at ~22% in FY2024. Better working capital management aided net working capital days standing low at 13-14 days. The operating cash flows (OCF) improved from Rs. 42.8 crore to Rs. 101.4 crore over FY2019-21 and with sustain scale up margins, cash flows are expected to further improve in the coming years.
Our Call
View– Initiate with Buy assigning a Price Target of Rs. 3,305: We expect IPL’s revenue and PAT to grow at a CAGR of 31% and 55% over FY2021-24E driven by strong expansion in dealer network, improving market share and margin expansion. The company has strong balance sheet with stable working capital management and strong operating cash flows (average OCF to EBIDTA ratio stood at 78% for past three years). Moreover, its return ratios are expected to improve strongly in the coming years (RoE and RoCE to stand at 26% and 34% in FY2024). The stock is currently trading at 60.4x its FY2023E EPS and 44.2x its FY2024E EPS (and 41.0x/30.1x its FY2023E/24E EV/EBIDTA). Differentiated business model with industry leading gross margins, sustained focus on improving market share, strong return profile and the structural growth story of the paints industry will keep valuations at a premium as compared to close peers. We initiate our coverage on Indigo Paints with a Buy recommendation and price target (PT) of Rs. 3,305 (valuing the stock at 60x its FY2024E earnings).
Key risk
Late demand recovery or delay in expanding the distribution base or sustained increase in prices of crude oil and crude derivatives would act as a key risk to our earnings estimates.
3R MATRIX + = -
Right Sector (RS) ü
Right Quality (RQ) ü
Right Valuation (RV) ü
Powered by the Sharekhan 3R Research Philosophy
Indigo Paints LtdPaint your portfolio bright
Summary
� We initiate coverage on Indigo Paints Ltd (IPL) with a Buy and assign a target price of Rs. 3,305. Differentiated business model, excellent return profile and strong structural growth outlook will keep valuation at a premium of 60x/44x its FY2023/24E earnings versus peers.
� With a differentiated product portfolio and bottom-up approach, IPL is emerging as one of India’s fastest growing paints companies. Revenues and PAT clocked a CAGR of 22% and 71% over FY2018-21.
� Gross margins are highest among peers at ~48% led by IPL’s locational advantage and healthy mix of revenues from differentiated products.
� Better working capital management has kept net working capital cycle low at 13-14 days. Operating cash flows (OCF) improved from Rs. 42.8 crore to Rs. 101.4 crore over FY2019-21.
2000220024002600280030003200
Feb-
21Fe
b-21
Mar
-21
Mar
-21
Mar
-21
Apr-
21Ap
r-21
May
-21
May
-21
Jun-
21Ju
n-21
Jul-2
1Ju
l-21
Aug-
21Au
g-21
August 23, 2021 3
Sto
ck Id
ea
Powered by the Sharekhan3R Research Philosophy
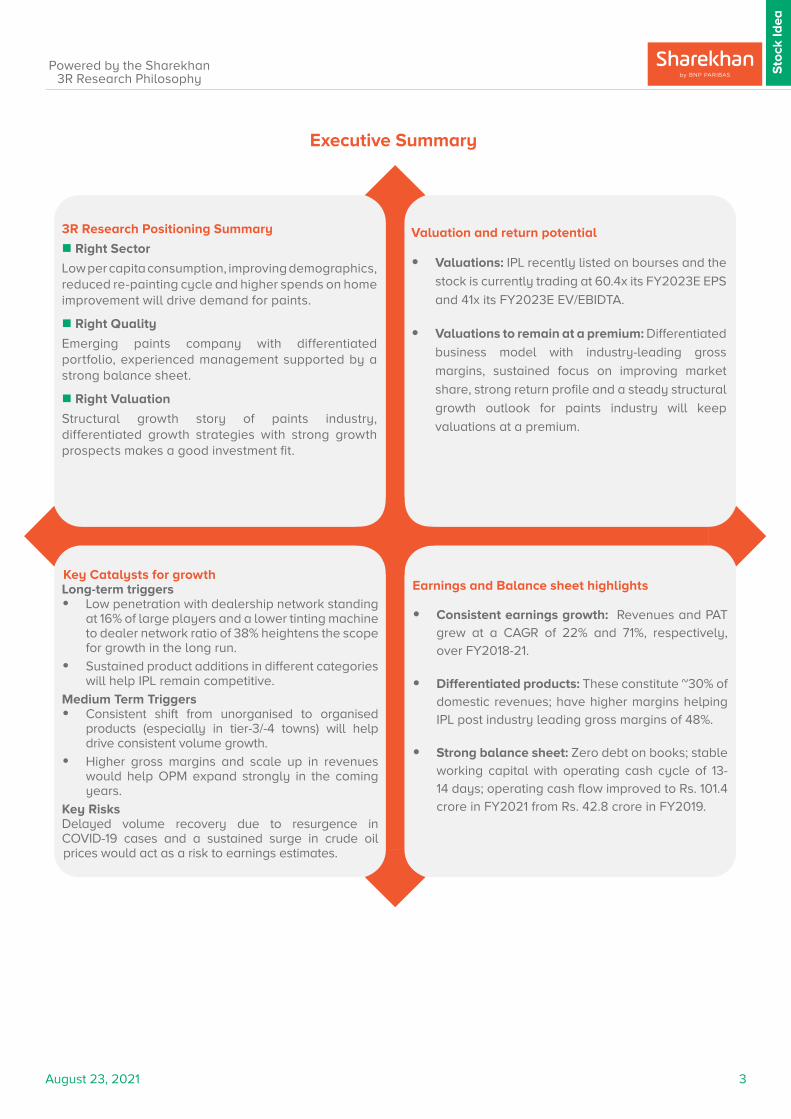
Executive Summary
3R Research Positioning Summary
n Right Sector
Low per capita consumption, improving demographics, reduced re-painting cycle and higher spends on home improvement will drive demand for paints.
n Right Quality
Emerging paints company with differentiated portfolio, experienced management supported by a strong balance sheet.
n Right Valuation
Structural growth story of paints industry, differentiated growth strategies with strong growth prospects makes a good investment fit.
Key Catalysts for growthLong-term triggers• Low penetration with dealership network standing
at 16% of large players and a lower tinting machine to dealer network ratio of 38% heightens the scope for growth in the long run.
• Sustained product additions in different categories will help IPL remain competitive.
Medium Term Triggers• Consistent shift from unorganised to organised
products (especially in tier-3/-4 towns) will help drive consistent volume growth.
• Higher gross margins and scale up in revenues would help OPM expand strongly in the coming years.
Key RisksDelayed volume recovery due to resurgence in COVID-19 cases and a sustained surge in crude oil prices would act as a risk to earnings estimates.
Valuation and return potential
• Valuations: IPL recently listed on bourses and the
stock is currently trading at 60.4x its FY2023E EPS
and 41x its FY2023E EV/EBIDTA.
• Valuations to remain at a premium: Differentiated
business model with industry-leading gross
margins, sustained focus on improving market
share, strong return profile and a steady structural
growth outlook for paints industry will keep
valuations at a premium.
Earnings and Balance sheet highlights
• Consistent earnings growth: Revenues and PAT grew at a CAGR of 22% and 71%, respectively, over FY2018-21.
• Differentiated products: These constitute ~30% of domestic revenues; have higher margins helping IPL post industry leading gross margins of 48%.
• Strong balance sheet: Zero debt on books; stable working capital with operating cash cycle of 13-14 days; operating cash flow improved to Rs. 101.4 crore in FY2021 from Rs. 42.8 crore in FY2019.
August 23, 2021 4
Sto
ck Id
ea
Powered by the Sharekhan3R Research Philosophy
Table of Contents Pages
Right Sector - why we like industry 5
� Paint industry to clock 17% CAGR over FY2020-24 5
� Decorative paint industry grew at CAGR of 11.5% over 2014-19 5
� Key growth drivers for paint industry 6
Right Quality - why we like IPL 13
� Emerging player with distinctive growth strategies 13
� Portfolio of ‘differentiated’ products distinguishes IPL from large peers 13
� Focus on expanding distribution reach 15
� Deepening penetration in existing market; expanding presence in select new geographies 17
� Dependence on Kerala is reducing 18
� Higher investment behind brand building activities to improve brand awareness 18
� Capacity expansion on cards 18
� Revenues to grow at CAGR of 31% over FY2021-24 19
� Industry leading gross margins boosted by locational advantage and differentiated products 20
� Advertisement spends as percentage to sales will reduce in the coming years 21
� OPM to improve to 21-22% by FY2024; PAT to grow at CAGR of 55% 22
� Better working capital management; operating cash flows improved consistently 22
� Experienced management team 22
Financials in charts 24
Right Valuation - Strong growth potential with differentiated business model 25
� Sector Outlook - Structural growth of the paint industry is intact 25
� Company Outlook – growth levers in place 25
� Valuation – Initiate with Buy assigning a Price Target of Rs. 3,305 25
� Peer comparison 25
Key financials 26
� P/L account 26
� Cash Flow Statement 26
� Balance Sheet 27
� Key Ratios 28
IPL snapshot 29
� About company 29
� Investment theme 29
� Key risks 29
� Key management personnel 29
� Top 10 shareholders 29
3R Philosophy definitions 30

August 23, 2021 5
Sto
ck Id
ea
Powered by the Sharekhan3R Research Philosophy
Source: Company; Sharekhan Research
Paints industry to clock 17% CAGR over FY2020-24
Why we like paints industry – Strong demand for decorative paints to be key growth lever
The Indian paints industry is correlated to GDP and is growing at 2x the GDP, led by strong demand in the decorative paints. The industry has registered a CAGR of ~10.4% during FY2008 to FY2020. Rising income levels, rapid urbanisation, shift from unorganised products (especially at the bottom of pyramid) and improving penetration for decorative paints are some of the key growth drivers. The industry size is expected to grow to ~Rs. 971 billion by 2024.
159261
435520
971
0
200
400
600
800
1000
1200
FY2008 FY2012 FY2016 FY2020 FY2024E
Rs. b
n
Decorative paint industry grew at CAGR of 11.5% over 2014-19
The domestic paints industry comprises the decorative and industrial segments. Decorative paints constitute more than 75% of the market and are used mainly in the real estate sector for exterior and interior wall paints, wood finishes, enamels, undercoats such as primers, putties, etc. The industrial segment refers to paints that go into protective coatings largely for varied substrates like iron, galvanised iron, mild steel, aluminium, chimneys, etc. This comprises automotive, marine, packaging, powder, protective, floor and other general industrial coatings and accounts for the balance 25% of the paint market.
Source: Company; Sharekhan Research
Paints industry – Broad structure
Decorative
• Emulsions/Enamals
• Distemper
• Putty
• Wood Coatings
• Cement Paints
• Primers and Thinners
Industrial
• General and Industrial
• Automotive Coating
• Protective Coating
• Powder Coating
• Glass Coating
• Pipe Coating

August 23, 2021 6
Sto
ck Id
ea
Powered by the Sharekhan3R Research Philosophy
Source: Company; Sharekhan Research
Source: Sharekhan Research
Decorative paint industry – Growth path
Indian paints industry - Growth drivers
The decorative paints market clocked a CAGR of 11.5% during 2014 to 2019, led by an increase in consumption of paints in the tier 2, -3 and -4 cities. Going ahead, the market is expected to clock a CAGR of 13% from 2019 to 2024 led by factors such as increase in disposable income of individuals and various housing schemes. The industrial market grew at 9.5% during 2014 to 2019 and going ahead, it is expected to grow at 9.9% from 2019 to 2024.
234
90
403
142
743
228
0
100
200
300
400
500
600
700
800
Decorative Industrial
Rs. b
n
2014 2019 2024E
August 23, 2021 7
Sto
ck Id
ea
Powered by the Sharekhan3R Research Philosophy
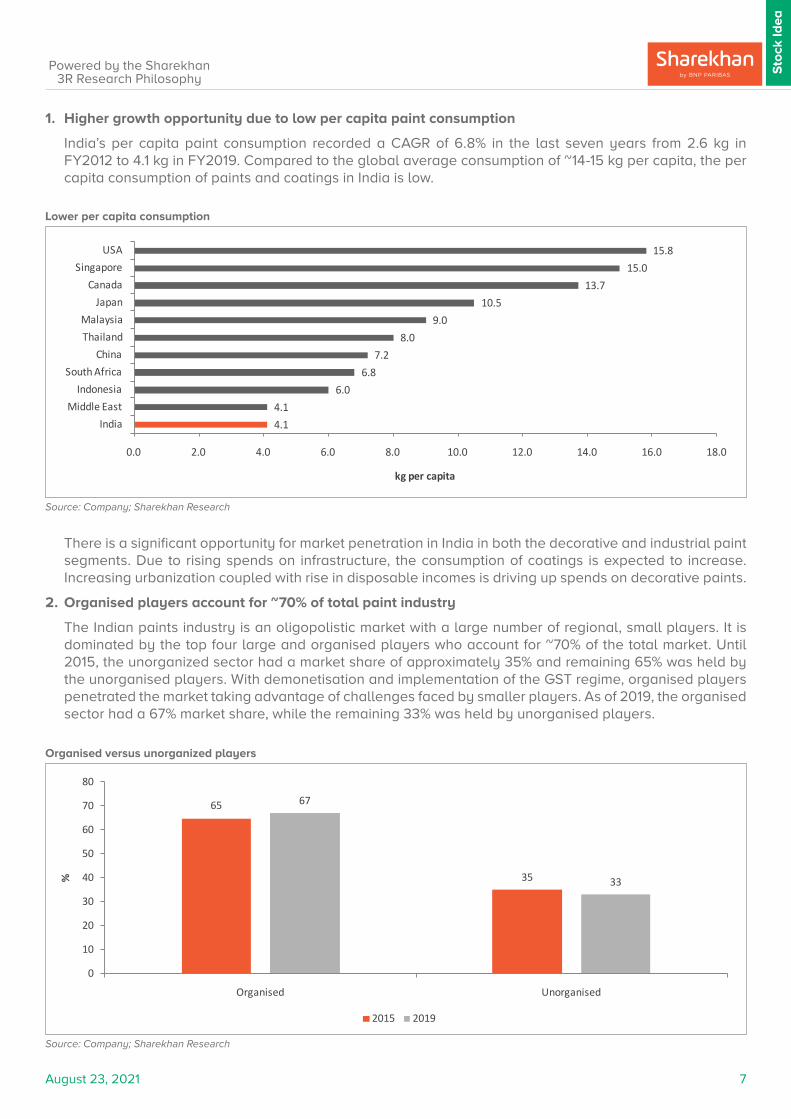
1. Higher growth opportunity due to low per capita paint consumption
India’s per capita paint consumption recorded a CAGR of 6.8% in the last seven years from 2.6 kg in FY2012 to 4.1 kg in FY2019. Compared to the global average consumption of ~14-15 kg per capita, the per capita consumption of paints and coatings in India is low.
Source: Company; Sharekhan Research
Lower per capita consumption
4.14.1
6.06.8
7.28.0
9.010.5
13.715.0
15.8
0.0 2.0 4.0 6.0 8.0 10.0 12.0 14.0 16.0 18.0
IndiaMiddle East
IndonesiaSouth Africa
ChinaThailandMalaysia
JapanCanada
SingaporeUSA
kg per capita
There is a significant opportunity for market penetration in India in both the decorative and industrial paint segments. Due to rising spends on infrastructure, the consumption of coatings is expected to increase. Increasing urbanization coupled with rise in disposable incomes is driving up spends on decorative paints.
2. Organised players account for ~70% of total paint industry
The Indian paints industry is an oligopolistic market with a large number of regional, small players. It is dominated by the top four large and organised players who account for ~70% of the total market. Until 2015, the unorganized sector had a market share of approximately 35% and remaining 65% was held by the unorganised players. With demonetisation and implementation of the GST regime, organised players penetrated the market taking advantage of challenges faced by smaller players. As of 2019, the organised sector had a 67% market share, while the remaining 33% was held by unorganised players.
Source: Company; Sharekhan Research
Organised versus unorganized players
65
35
67
33
0
10
20
30
40
50
60
70
80
Organised Unorganised
%
2015 2019

August 23, 2021 8
Sto
ck Id
ea
Powered by the Sharekhan3R Research Philosophy
3. Reduction in re-painting cycle to boost the decorative paint industry
As of 2019, fresh painting accounted for ~22% of demand for decorative paints, whereas the balance demand was due to the re-painting of households.
Source: Company; Sharekhan Research
Repainting accounts for 78% of decorative paint industry
Fresh Painting22%
Re-painting78%
In the last decade, the average re-painting cycle has gradually shrunk from an interval of 7-8 years in 2010 to 4-5 years in 2019 (mostly interiors). Earlier, repainting was done only when paint withered. However, a change in consumer behaviour with some consumers giving more importance to aesthetics, change in looks and appearance of their premises at regular intervals even while the condition of the existing paint is good, has shortened the re-painting cycle. Rising income levels, increase in number of rented houses (where the owners prefer re-painting to attract tenants) and significant ease of the painting process are few of the factors that have influenced reduction in the re-painting cycle.
4. Urbanisation and nuclearization of families led to increase in demand for paint
In India, the rate of urbanisation has increased from 25.6% in 1990 to 34.5% in 2017. The rise in urbanization, supported by demand for real estate and improved infrastructure, has increased applications for paints. The UN expects that by 2030, ~40% of the population of India will reside in urban areas. Thus, going ahead as well, increasing urbanization will aid growth of the decorative paints industry. Another factor that contributes to the growth of paint industry is the nuclearization of families. With increasing nuclearization of families, there is an increase in the number of households in the country. Further, many state governments in the recent years have undertaken a lot of initiatives to focus on economic growth of smaller towns. This led to strong demand for affordable housing in India.
Source: Industry; Sharekhan Research
Rising Urbanisation
11
29 30
34
0
5
10
15
20
25
30
35
40
C1901 C2001 C2011 C2017
%
Urbanisation (as per Census)

August 23, 2021 9
Sto
ck Id
ea
Powered by the Sharekhan3R Research Philosophy
Source: Industry; Sharekhan Research
More towns to turn into metros by 2030
46
68
0
10
20
30
40
50
60
70
80
2011 2030
Nos
No of metro cities
The government launched the Pradhan Mantri Aawas Yojana Scheme (PMAYS) in 2015 with an aim to build houses for all by 2022. Affordable and mid-segments accounts for 62% of new launches in India. Execution in the first phase was successful and in the phase-II, the government is planning to build 1.95 crore houses for the eligible beneficiaries. The three-year target appears realistic and achievable, considering that more than 1.5 crore rural homes have been completed in the last five years. This will be one of the key revenue drivers for building material companies (including paint manufacturers). Thus, rising demand for housing and rising regulatory pressures on real estate sector (especially on small players) to provide quality construction to the consumer will drive the demand for new painting (22% of overall decorative paints industry).
Source: Industry; Sharekhan Research
Cumulative demand-supply over 2016-2020 in top 8 cities (‘000s) units
717
1457
1982
351
647
25
0 500 1000 1500 2000 2500
HIG
MIG
LIG
Supply Demand
5. GST rate cuts aided demand
The GST rate for paints was earlier at 28%, which has now been reduced to 18%. This has driven up volumes of decorative paints, particularly in the lower-end segments like emulsions, distempers and putty. Further, demand was higher as paint firms passed on the cost benefits to the customers leading to lower prices.

August 23, 2021 10
Sto
ck Id
ea
Powered by the Sharekhan3R Research Philosophy
6. Innovation / differentiated products is the key driver of growth going ahead
In the past few years, the industry has witnessed a gradual change in consumer’s preference with shifts towards 4upgrading/pre-minimisation. For example, there has been a substantial change in focus towards waterproofing over the last decade, this was previously considered as an extra expense in India. A change in trend is observed as consumers are moving from (i) distemper to interior emulsion; (ii) mid-segment to top-end segment; (iii) low-end to top-end segment; (iv) cement paint to exterior emulsions; and (v) unorganized to organized in smaller towns, especially in Tier-3 and -4 cities and rural areas.
Source: Company
Product innovation cycle in the Indian Paint industry
People are now eyeing unique products, which has led to a rise in innovation in the industry with companies coming out with differentiated, unique products to cater to this demand shift. Most companies are now venturing into new product segments and focusing on diversifying their product portfolio. The top-end market is led by the metros and tier-1 and -2 cities, but in the past few years, smaller towns have also indicated increased interest in premium products. This is on the back of increased consciousness of aesthetics and availability of resources to opt for better quality products at higher prices.
Demand for interior and exterior paints has been on the rise owing to customers’ growing preferences to aesthetics. Demand for roofing and flooring paints is also gaining momentum mainly from residential buildings. Paint companies are now promoting products and benefits associated with them, which has heightened consumer awareness and a corresponding rise in sales of roofing and flooring paints.
Source: Company; Sharekhan Research
Interiors & exteriors accounts for ~75% of decorative paints industry
Interior39%
Exterior36%
Roofing6%
Flooring5%
Others14%
August 23, 2021 11
Sto
ck Id
ea
Powered by the Sharekhan3R Research Philosophy
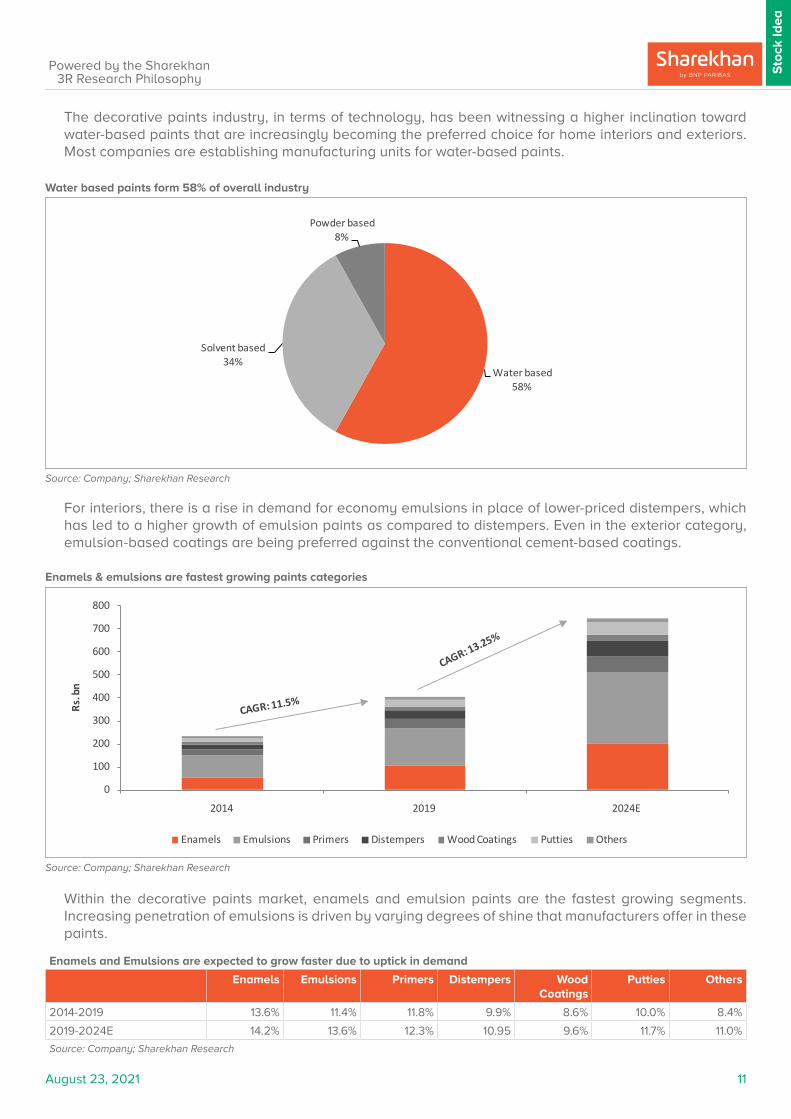
The decorative paints industry, in terms of technology, has been witnessing a higher inclination toward water-based paints that are increasingly becoming the preferred choice for home interiors and exteriors. Most companies are establishing manufacturing units for water-based paints.
Source: Company; Sharekhan Research
Water based paints form 58% of overall industry
Water based58%
Solvent based34%
Powder based8%
For interiors, there is a rise in demand for economy emulsions in place of lower-priced distempers, which has led to a higher growth of emulsion paints as compared to distempers. Even in the exterior category, emulsion-based coatings are being preferred against the conventional cement-based coatings.
Source: Company; Sharekhan Research
Enamels & emulsions are fastest growing paints categories
0
100
200
300
400
500
600
700
800
2014 2019 2024E
Rs. b
n
Enamels Emulsions Primers Distempers Wood Coatings Putties Others
Within the decorative paints market, enamels and emulsion paints are the fastest growing segments. Increasing penetration of emulsions is driven by varying degrees of shine that manufacturers offer in these paints.
Enamels and Emulsions are expected to grow faster due to uptick in demand
Enamels Emulsions Primers Distempers Wood Coatings
Putties Others
2014-2019 13.6% 11.4% 11.8% 9.9% 8.6% 10.0% 8.4%
2019-2024E 14.2% 13.6% 12.3% 10.95 9.6% 11.7% 11.0%
Source: Company; Sharekhan Research

August 23, 2021 12
Sto
ck Id
ea
Powered by the Sharekhan3R Research Philosophy
Another reason behind customers opting for premium variants is inflexible labour cost at all levels, making option of paint variant relatively indifferent. There have currently been fewer options available in the value-added sub-category and mainly in the premium price range. However, with increasing demand for these products, companies are likely to launch specialised variants.
7. Industrial paints constitute 25% of overall paint industry
Industrial paints and auto coating constitute about 25% of the overall Indian paints industry. This is lesser as compared to developed economies where industrial paints constitute 50-75% of overall paint industry. Industrial paint demand is heavily dependent on auto coating/replenish segment (constitutes two-thirds of segment). Auto industry is cyclical in nature and currently reeling under pressure of slowdown and pandemic situation. On the other hand, rapid urbanisation and infrastructure development of roads, ports, refineries, etc. augured well for the industrial paint and protective coatings segment.
Source: Industry, Sharekhan Research
Industrial paints industry is yet to set a grip in India
40
75
28 33 3548
65
60
25
72 67 6552
35
0
10
20
30
40
50
60
70
80
90
100
World India South Korea China Japan USA Britain
%
Decorative paints Industrial paints
August 23, 2021 13
Sto
ck Id
ea
Powered by the Sharekhan3R Research Philosophy
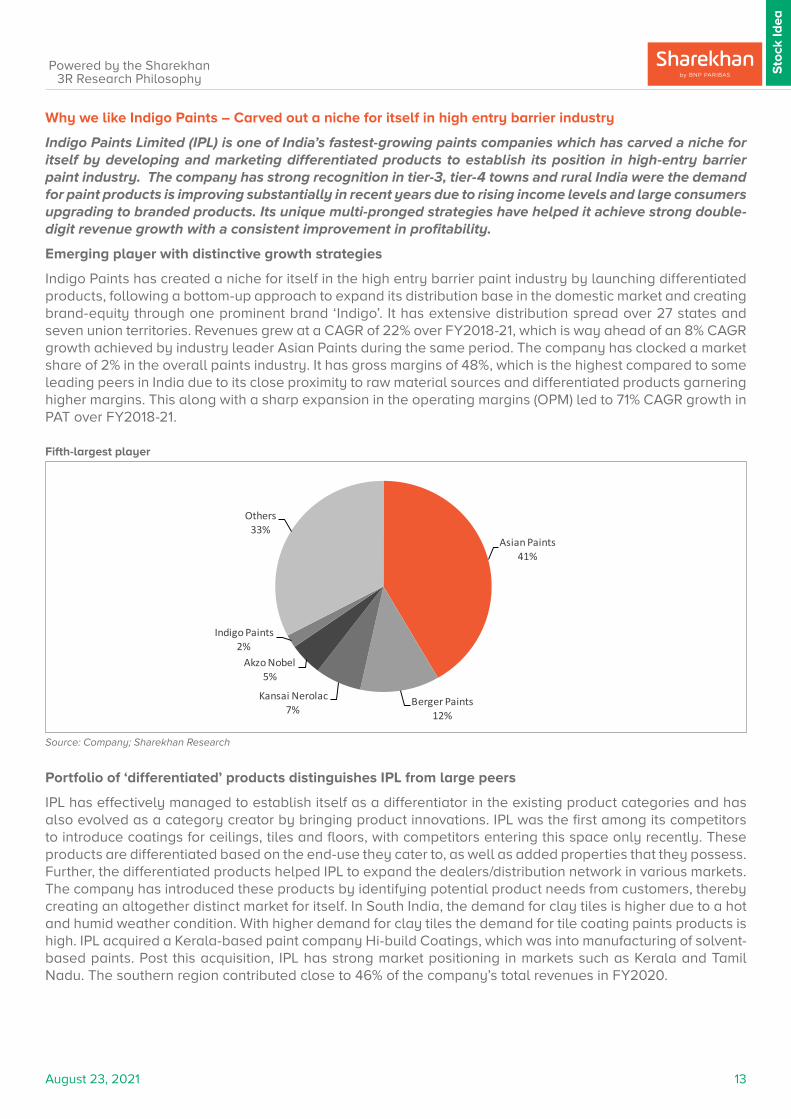
Why we like Indigo Paints – Carved out a niche for itself in high entry barrier industry
Indigo Paints Limited (IPL) is one of India’s fastest-growing paints companies which has carved a niche for itself by developing and marketing differentiated products to establish its position in high-entry barrier paint industry. The company has strong recognition in tier-3, tier-4 towns and rural India were the demand for paint products is improving substantially in recent years due to rising income levels and large consumers upgrading to branded products. Its unique multi-pronged strategies have helped it achieve strong double-digit revenue growth with a consistent improvement in profitability.
Emerging player with distinctive growth strategies
Indigo Paints has created a niche for itself in the high entry barrier paint industry by launching differentiated products, following a bottom-up approach to expand its distribution base in the domestic market and creating brand-equity through one prominent brand ‘Indigo’. It has extensive distribution spread over 27 states and seven union territories. Revenues grew at a CAGR of 22% over FY2018-21, which is way ahead of an 8% CAGR growth achieved by industry leader Asian Paints during the same period. The company has clocked a market share of 2% in the overall paints industry. It has gross margins of 48%, which is the highest compared to some leading peers in India due to its close proximity to raw material sources and differentiated products garnering higher margins. This along with a sharp expansion in the operating margins (OPM) led to 71% CAGR growth in PAT over FY2018-21.
Source: Company; Sharekhan Research
Fifth-largest player
Asian Paints41%
Berger Paints12%
Kansai Nerolac7%
Akzo Nobel5%
Indigo Paints2%
Others33%
Portfolio of ‘differentiated’ products distinguishes IPL from large peers
IPL has effectively managed to establish itself as a differentiator in the existing product categories and has also evolved as a category creator by bringing product innovations. IPL was the first among its competitors to introduce coatings for ceilings, tiles and floors, with competitors entering this space only recently. These products are differentiated based on the end-use they cater to, as well as added properties that they possess. Further, the differentiated products helped IPL to expand the dealers/distribution network in various markets. The company has introduced these products by identifying potential product needs from customers, thereby creating an altogether distinct market for itself. In South India, the demand for clay tiles is higher due to a hot and humid weather condition. With higher demand for clay tiles the demand for tile coating paints products is high. IPL acquired a Kerala-based paint company Hi-build Coatings, which was into manufacturing of solvent-based paints. Post this acquisition, IPL has strong market positioning in markets such as Kerala and Tamil Nadu. The southern region contributed close to 46% of the company’s total revenues in FY2020.
August 23, 2021 14
Sto
ck Id
ea
Powered by the Sharekhan3R Research Philosophy
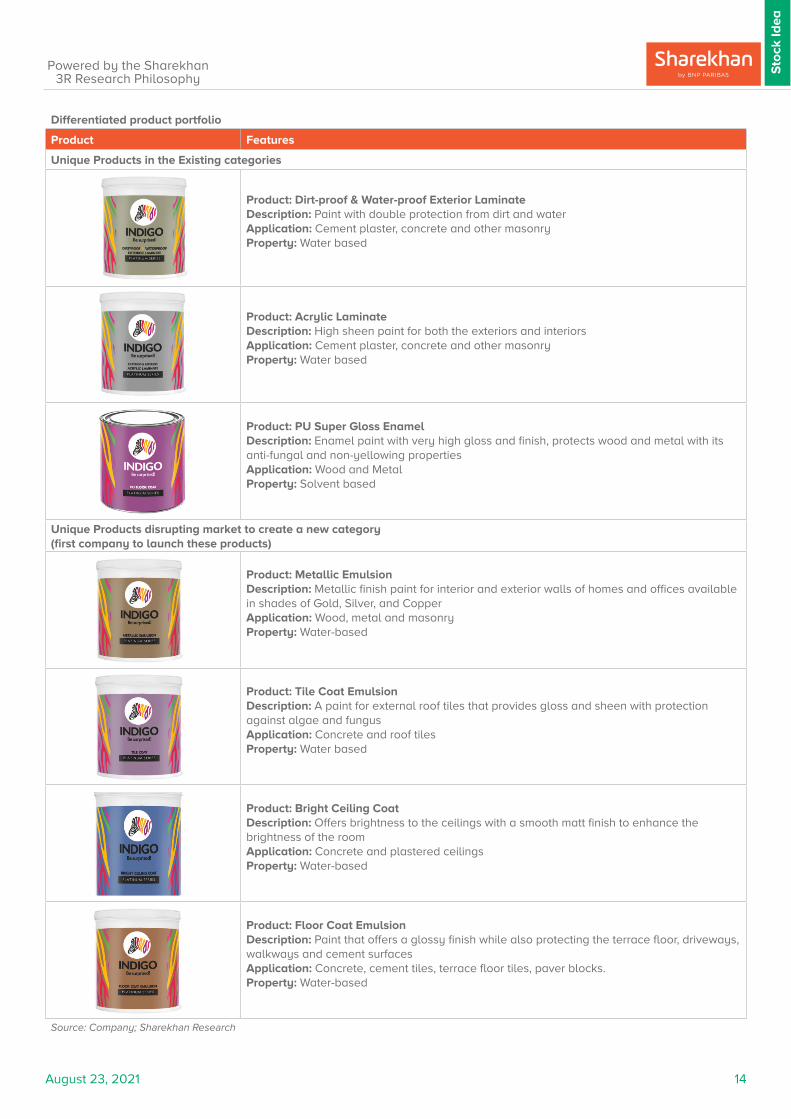
Differentiated product portfolio
Product Features
Unique Products in the Existing categories
Product: Dirt-proof & Water-proof Exterior LaminateDescription: Paint with double protection from dirt and waterApplication: Cement plaster, concrete and other masonryProperty: Water based
Product: Acrylic LaminateDescription: High sheen paint for both the exteriors and interiorsApplication: Cement plaster, concrete and other masonryProperty: Water based
Product: PU Super Gloss EnamelDescription: Enamel paint with very high gloss and finish, protects wood and metal with its anti-fungal and non-yellowing propertiesApplication: Wood and MetalProperty: Solvent based
Unique Products disrupting market to create a new category (first company to launch these products)
Product: Metallic EmulsionDescription: Metallic finish paint for interior and exterior walls of homes and offices available in shades of Gold, Silver, and CopperApplication: Wood, metal and masonryProperty: Water-based
Product: Tile Coat EmulsionDescription: A paint for external roof tiles that provides gloss and sheen with protection against algae and fungusApplication: Concrete and roof tilesProperty: Water based
Product: Bright Ceiling CoatDescription: Offers brightness to the ceilings with a smooth matt finish to enhance the brightness of the roomApplication: Concrete and plastered ceilingsProperty: Water-based
Product: Floor Coat EmulsionDescription: Paint that offers a glossy finish while also protecting the terrace floor, driveways, walkways and cement surfacesApplication: Concrete, cement tiles, terrace floor tiles, paver blocks.Property: Water-based
Source: Company; Sharekhan Research
August 23, 2021 15
Sto
ck Id
ea
Powered by the Sharekhan3R Research Philosophy
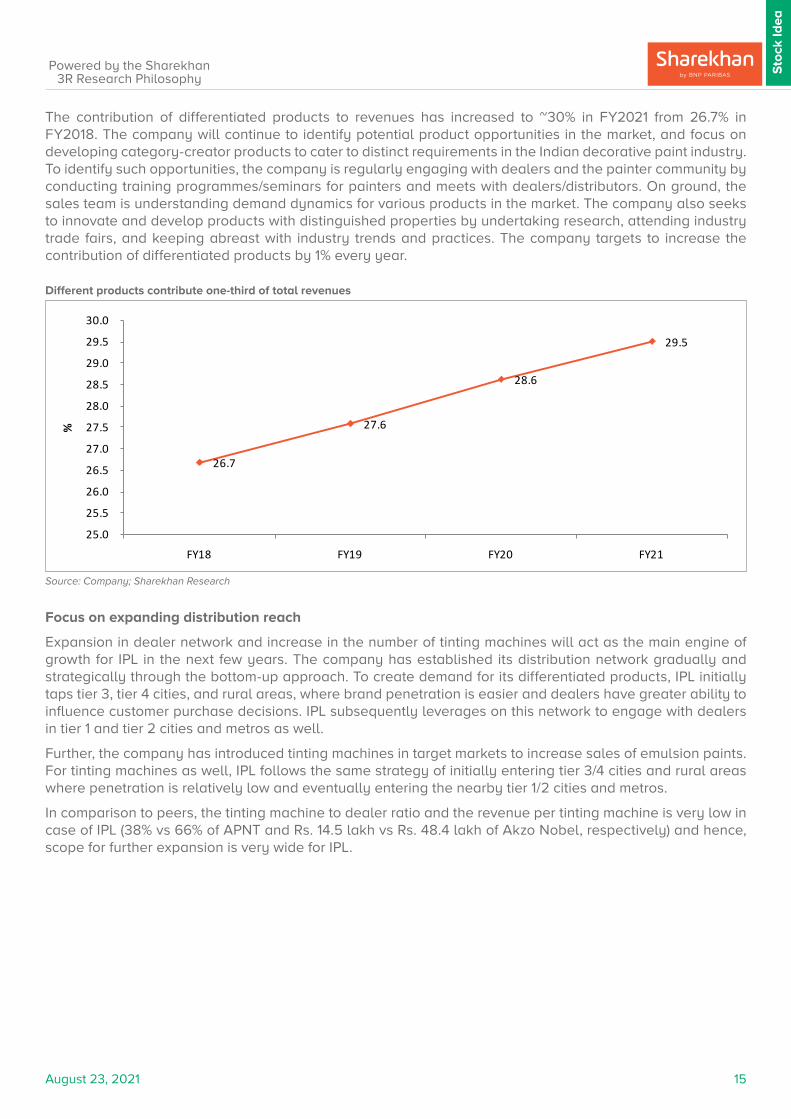
The contribution of differentiated products to revenues has increased to ~30% in FY2021 from 26.7% in FY2018. The company will continue to identify potential product opportunities in the market, and focus on developing category-creator products to cater to distinct requirements in the Indian decorative paint industry. To identify such opportunities, the company is regularly engaging with dealers and the painter community by conducting training programmes/seminars for painters and meets with dealers/distributors. On ground, the sales team is understanding demand dynamics for various products in the market. The company also seeks to innovate and develop products with distinguished properties by undertaking research, attending industry trade fairs, and keeping abreast with industry trends and practices. The company targets to increase the contribution of differentiated products by 1% every year.
Source: Company; Sharekhan Research
Different products contribute one-third of total revenues
26.7
27.6
28.6
29.5
25.0
25.5
26.0
26.5
27.0
27.5
28.0
28.5
29.0
29.5
30.0
FY18 FY19 FY20 FY21
%
Focus on expanding distribution reach
Expansion in dealer network and increase in the number of tinting machines will act as the main engine of growth for IPL in the next few years. The company has established its distribution network gradually and strategically through the bottom-up approach. To create demand for its differentiated products, IPL initially taps tier 3, tier 4 cities, and rural areas, where brand penetration is easier and dealers have greater ability to influence customer purchase decisions. IPL subsequently leverages on this network to engage with dealers in tier 1 and tier 2 cities and metros as well.
Further, the company has introduced tinting machines in target markets to increase sales of emulsion paints. For tinting machines as well, IPL follows the same strategy of initially entering tier 3/4 cities and rural areas where penetration is relatively low and eventually entering the nearby tier 1/2 cities and metros.
In comparison to peers, the tinting machine to dealer ratio and the revenue per tinting machine is very low in case of IPL (38% vs 66% of APNT and Rs. 14.5 lakh vs Rs. 48.4 lakh of Akzo Nobel, respectively) and hence, scope for further expansion is very wide for IPL.
August 23, 2021 16
Sto
ck Id
ea
Powered by the Sharekhan3R Research Philosophy
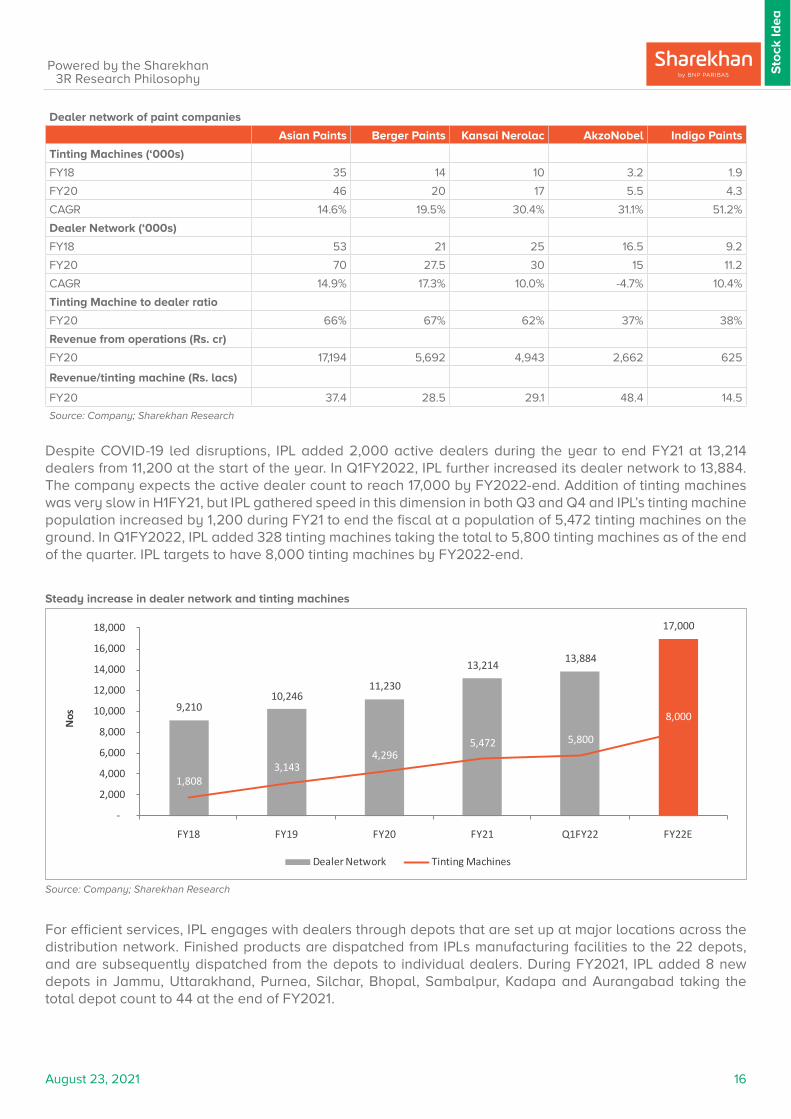
Dealer network of paint companies
Asian Paints Berger Paints Kansai Nerolac AkzoNobel Indigo Paints
Tinting Machines (‘000s)
FY18 35 14 10 3.2 1.9
FY20 46 20 17 5.5 4.3
CAGR 14.6% 19.5% 30.4% 31.1% 51.2%
Dealer Network (‘000s)
FY18 53 21 25 16.5 9.2
FY20 70 27.5 30 15 11.2
CAGR 14.9% 17.3% 10.0% -4.7% 10.4%
Tinting Machine to dealer ratio
FY20 66% 67% 62% 37% 38%
Revenue from operations (Rs. cr)
FY20 17,194 5,692 4,943 2,662 625
Revenue/tinting machine (Rs. lacs)
FY20 37.4 28.5 29.1 48.4 14.5
Source: Company; Sharekhan Research
Despite COVID-19 led disruptions, IPL added 2,000 active dealers during the year to end FY21 at 13,214 dealers from 11,200 at the start of the year. In Q1FY2022, IPL further increased its dealer network to 13,884. The company expects the active dealer count to reach 17,000 by FY2022-end. Addition of tinting machines was very slow in H1FY21, but IPL gathered speed in this dimension in both Q3 and Q4 and IPL’s tinting machine population increased by 1,200 during FY21 to end the fiscal at a population of 5,472 tinting machines on the ground. In Q1FY2022, IPL added 328 tinting machines taking the total to 5,800 tinting machines as of the end of the quarter. IPL targets to have 8,000 tinting machines by FY2022-end.
Source: Company; Sharekhan Research
Steady increase in dealer network and tinting machines
9,210 10,246
11,230
13,214 13,884
17,000
1,808 3,143
4,296 5,472 5,800
8,000
-
2,000
4,000
6,000
8,000
10,000
12,000
14,000
16,000
18,000
FY18 FY19 FY20 FY21 Q1FY22 FY22E
Nos
Dealer Network Tinting Machines
For efficient services, IPL engages with dealers through depots that are set up at major locations across the distribution network. Finished products are dispatched from IPLs manufacturing facilities to the 22 depots, and are subsequently dispatched from the depots to individual dealers. During FY2021, IPL added 8 new depots in Jammu, Uttarakhand, Purnea, Silchar, Bhopal, Sambalpur, Kadapa and Aurangabad taking the total depot count to 44 at the end of FY2021.

August 23, 2021 17
Sto
ck Id
ea
Powered by the Sharekhan3R Research Philosophy
Source: Company; Sharekhan Research
Total number of depots
Deepening penetration in existing market; expanding presence in select new geographies
IPL has maintained its focus on increasing in penetration in the markets where it has attained certain scale by using its bottom-up approach. It has strong presence in states of Kerala, West Bengal, Bihar, Jharkhand, Chhattisgarh, Odisha and Uttar Pradesh. In these states, the company has already expanded its footprints in tier 3, tier 4 cities and rural areas and focusing on expanding its reach in tier-1 and tier-2 cities. For example, IPL has strong presence in larger cities including Kochi (Kerala) and Thiruvananthapuram (Kerala), Patna (Bihar), Ranchi (Jharkhand) and Kanpur (Uttar Pradesh), and intends to continue to expand its network outwards into other tier 1 and 2 cities and metros in these states. Further it has large scope for dealer network expansion in recently entered states like Telangana, Gujarat, Maharashtra, Karnataka and Tamil Nadu. As on March 31, 2020, the company had a network of 3,292 active dealers in these five states, and intends to engage with more dealers to strengthen its existing sales infrastructure and network in these regions. Further, it is also strengthening its network in North India in Punjab, Uttarakhand and J&K. South India contributed ~46% of overall revenues of the company in FY2020, but the contribution has reduced from upwards of 50% in FY2018 as the company’s penetration in other regions is improving.
Source: Company; Sharekhan Research
Region-wise revenue contribution
53.8 46.3
26.729.0
12.013.8
7.6 10.9
0%
10%
20%
30%
40%
50%
60%
70%
80%
90%
100%
FY2018 FY2020
South East West North
130
156
102
4633
138
164
104
5236
0
20
40
60
80
100
120
140
160
180
Asian Paints Berger Paints Kansai Nerolac AkzoNobel Indigo Paints
Nos
FY18 FY20
August 23, 2021 18
Sto
ck Id
ea
Powered by the Sharekhan3R Research Philosophy
Dependence on Kerala is reducing
IPL has relatively higher market share in Kerala, which contributes about 30% of overall revenues (reduced from 35% in FY2020 and from 55% in FY20216). The company acquired Hi-Build Coatings, a Kerala centric company in FY2016 which led to higher contribution from Kerala. Kerala registered a revenue growth in low single digit in FY2021, which affected IPL’s overall revenue growth. With strong distribution expansion in the other states, the company is expecting the dependence on Kerala will further reduce to 15-20% in the coming years. This will reduce the risk of one state not performing well during a particular year. Having said that, Kerala will remain one of the key markets for the company.
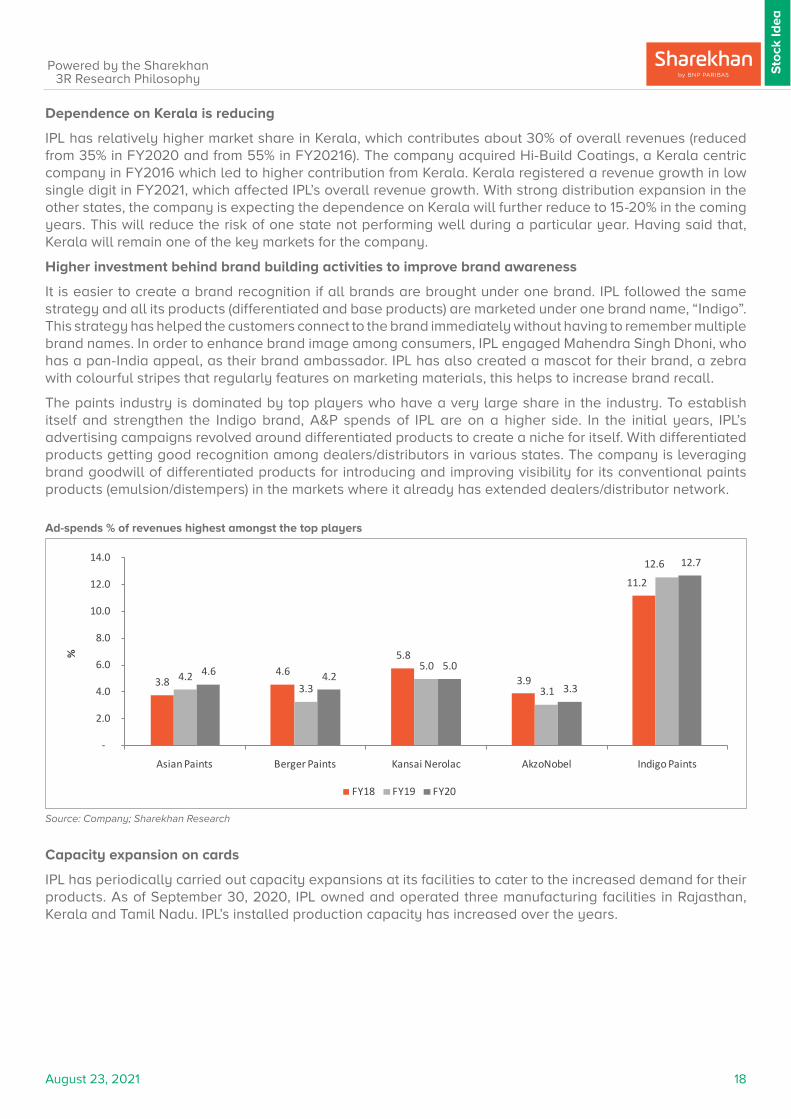
Higher investment behind brand building activities to improve brand awareness
It is easier to create a brand recognition if all brands are brought under one brand. IPL followed the same strategy and all its products (differentiated and base products) are marketed under one brand name, “Indigo”. This strategy has helped the customers connect to the brand immediately without having to remember multiple brand names. In order to enhance brand image among consumers, IPL engaged Mahendra Singh Dhoni, who has a pan-India appeal, as their brand ambassador. IPL has also created a mascot for their brand, a zebra with colourful stripes that regularly features on marketing materials, this helps to increase brand recall.
The paints industry is dominated by top players who have a very large share in the industry. To establish itself and strengthen the Indigo brand, A&P spends of IPL are on a higher side. In the initial years, IPL’s advertising campaigns revolved around differentiated products to create a niche for itself. With differentiated products getting good recognition among dealers/distributors in various states. The company is leveraging brand goodwill of differentiated products for introducing and improving visibility for its conventional paints products (emulsion/distempers) in the markets where it already has extended dealers/distributor network.
Source: Company; Sharekhan Research
Ad-spends % of revenues highest amongst the top players
3.8 4.6
5.8
3.9
11.2
4.2 3.3
5.0
3.1
12.6
4.6 4.2 5.0
3.3
12.7
-
2.0
4.0
6.0
8.0
10.0
12.0
14.0
Asian Paints Berger Paints Kansai Nerolac AkzoNobel Indigo Paints
%
FY18 FY19 FY20
Capacity expansion on cards
IPL has periodically carried out capacity expansions at its facilities to cater to the increased demand for their products. As of September 30, 2020, IPL owned and operated three manufacturing facilities in Rajasthan, Kerala and Tamil Nadu. IPL’s installed production capacity has increased over the years.

August 23, 2021 19
Sto
ck Id
ea
Powered by the Sharekhan3R Research Philosophy
Capacity expansion at regular interval
Mar’2018 Mar’2019 Mar’2020/Sep’2020
Liquid Paints (KLPA)
Jodhpur (Rajasthan) 22,312 39,244 45,544
Kochi (Kerala) 15,640 27,958 42,701
Pudukkottai (Tamil Nadu) 8,656 9,034 13,658
Total 46,608 43,939 101,903
Powder Paints (MTPA)
Jodhpur (Rajasthan) 48,944 48,944 93,118
Source: Company; Sharekhan Research
To capitalise on growing demand for water-based paints, IPL has proposed to expand their manufacturing capacities at their existing facility at Pudukkottai in Tamil Nadu, by setting up an additional unit to manufacture water-based paints. As of September 30, 2020, the Pudukkottai facility had an installed estimated production capacity of 13,658 KLPA. The installed production capacity of the proposed additional unit is 50,000 KLPA and it is expected to be operational during FY2023.
IPL is also in the process of carrying out capacity expansion at its Jodhpur facility. The putty plant’s capacity in Jodhpur was doubled in FY2021. Expansion in water based paint capacities with respect to liquid paints such as emulsions and primers is in progress.
IPL has made and intends to continue investing on expanding capacity of their manufacturing facilities to aid in the company’s growth efforts and consolidate their pan-India presence.
Revenues to grow at CAGR of 31% over FY2021-24
IPL’s revenue growth saw strong pick in the H2FY2021 with revenues growing by 22% and 41% in Q3 and Q4FY2021. Overall revenue growth stood at 16% in FY2021. During Q1FY2022, revenues grew by 49.2% y-o-y on low base of Q1FY2021, sequentially revenues were down by 39% on account of the second wave of COVID-19. However, the company has witnessed good recovery in June-July 2021. The management is confident to grow by 35-40% versus the expected industry growth of 18-20% in FY2022. Going ahead, expansion of the distribution network and strong traction to differentiated products would aid strong double-digit revenue growth in the coming years. We expect IPL’s revenues to grow at CAGR of 31% over FY2021-24 driven by 26% volume growth over the same period.
Source: Company; Sharekhan Research
Strong revenue growth expected
395 536
625 723
968
1,258
1,624
-
200
400
600
800
1,000
1,200
1,400
1,600
1,800
FY18 FY19 FY20 FY21 FY22E FY23E FY24E
Rs. c
rore
August 23, 2021 20
Sto
ck Id
ea
Powered by the Sharekhan3R Research Philosophy
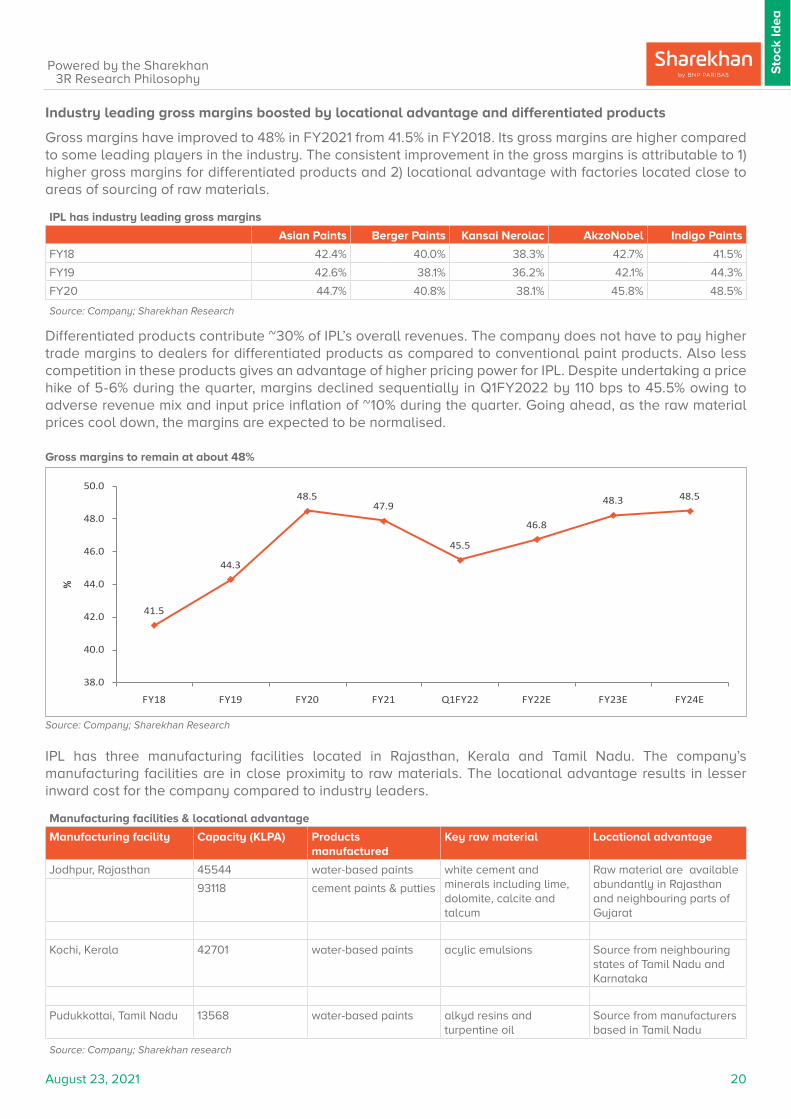
Industry leading gross margins boosted by locational advantage and differentiated products
Gross margins have improved to 48% in FY2021 from 41.5% in FY2018. Its gross margins are higher compared to some leading players in the industry. The consistent improvement in the gross margins is attributable to 1) higher gross margins for differentiated products and 2) locational advantage with factories located close to areas of sourcing of raw materials.
IPL has industry leading gross margins
Asian Paints Berger Paints Kansai Nerolac AkzoNobel Indigo Paints
FY18 42.4% 40.0% 38.3% 42.7% 41.5%
FY19 42.6% 38.1% 36.2% 42.1% 44.3%
FY20 44.7% 40.8% 38.1% 45.8% 48.5%
Source: Company; Sharekhan Research
Differentiated products contribute ~30% of IPL’s overall revenues. The company does not have to pay higher trade margins to dealers for differentiated products as compared to conventional paint products. Also less competition in these products gives an advantage of higher pricing power for IPL. Despite undertaking a price hike of 5-6% during the quarter, margins declined sequentially in Q1FY2022 by 110 bps to 45.5% owing to adverse revenue mix and input price inflation of ~10% during the quarter. Going ahead, as the raw material prices cool down, the margins are expected to be normalised.
Source: Company; Sharekhan Research
Gross margins to remain at about 48%
41.5
44.3
48.547.9
45.5
46.8
48.3 48.5
38.0
40.0
42.0
44.0
46.0
48.0
50.0
FY18 FY19 FY20 FY21 Q1FY22 FY22E FY23E FY24E
%
IPL has three manufacturing facilities located in Rajasthan, Kerala and Tamil Nadu. The company’s manufacturing facilities are in close proximity to raw materials. The locational advantage results in lesser inward cost for the company compared to industry leaders.
Manufacturing facilities & locational advantage
Manufacturing facility Capacity (KLPA) Products manufactured
Key raw material Locational advantage
Jodhpur, Rajasthan 45544 water-based paints white cement and minerals including lime, dolomite, calcite and talcum
Raw material are available abundantly in Rajasthan and neighbouring parts of Gujarat
93118 cement paints & putties
Kochi, Kerala 42701 water-based paints acylic emulsions Source from neighbouring states of Tamil Nadu and Karnataka
Pudukkottai, Tamil Nadu 13568 water-based paints alkyd resins and turpentine oil
Source from manufacturers based in Tamil Nadu
Source: Company; Sharekhan research
August 23, 2021 21
Sto
ck Id
ea
Powered by the Sharekhan3R Research Philosophy
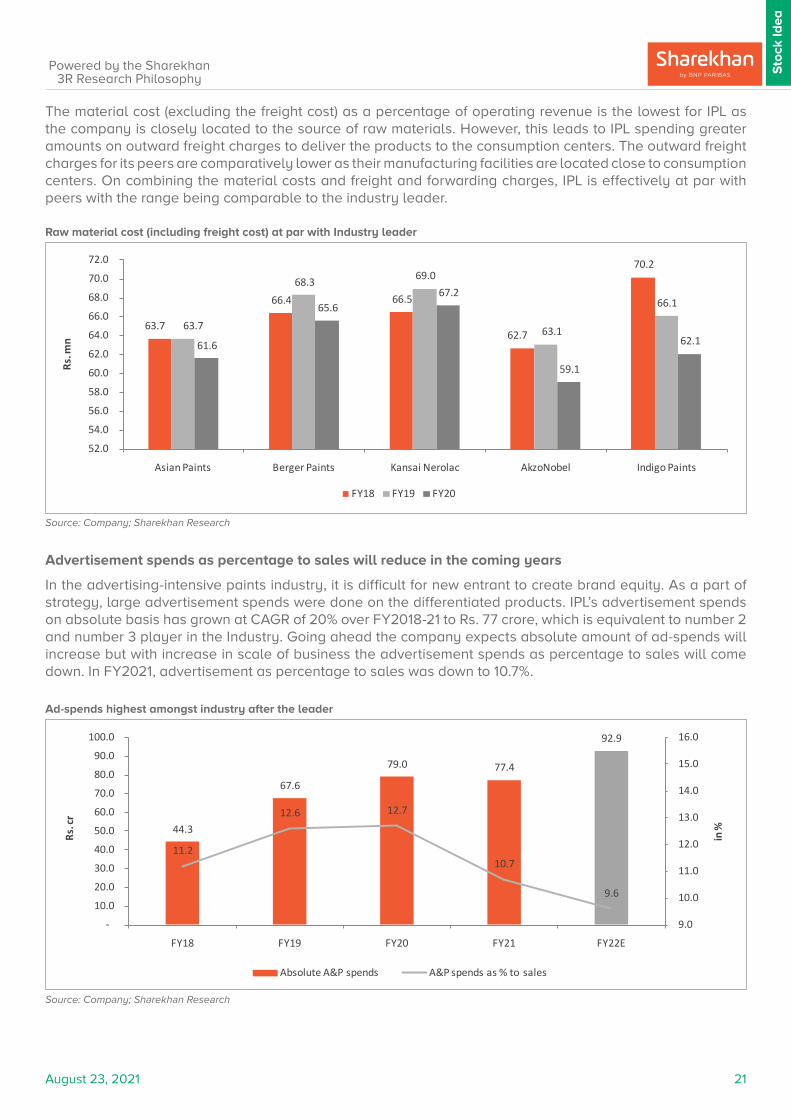
The material cost (excluding the freight cost) as a percentage of operating revenue is the lowest for IPL as the company is closely located to the source of raw materials. However, this leads to IPL spending greater amounts on outward freight charges to deliver the products to the consumption centers. The outward freight charges for its peers are comparatively lower as their manufacturing facilities are located close to consumption centers. On combining the material costs and freight and forwarding charges, IPL is effectively at par with peers with the range being comparable to the industry leader.
Source: Company; Sharekhan Research
Raw material cost (including freight cost) at par with Industry leader
63.7
66.4 66.5
62.7
70.2
63.7
68.3 69.0
63.1
66.1
61.6
65.6 67.2
59.1
62.1
52.0
54.0
56.0
58.0
60.0
62.0
64.0
66.0
68.0
70.0
72.0
Asian Paints Berger Paints Kansai Nerolac AkzoNobel Indigo Paints
Rs. m
n
FY18 FY19 FY20
Advertisement spends as percentage to sales will reduce in the coming years
In the advertising-intensive paints industry, it is difficult for new entrant to create brand equity. As a part of strategy, large advertisement spends were done on the differentiated products. IPL’s advertisement spends on absolute basis has grown at CAGR of 20% over FY2018-21 to Rs. 77 crore, which is equivalent to number 2 and number 3 player in the Industry. Going ahead the company expects absolute amount of ad-spends will increase but with increase in scale of business the advertisement spends as percentage to sales will come down. In FY2021, advertisement as percentage to sales was down to 10.7%.
Source: Company; Sharekhan Research
Ad-spends highest amongst industry after the leader
44.3
67.6
79.0 77.4
92.9
11.2
12.6 12.7
10.7
9.6
9.0
10.0
11.0
12.0
13.0
14.0
15.0
16.0
-
10.0
20.0
30.0
40.0
50.0
60.0
70.0
80.0
90.0
100.0
FY18 FY19 FY20 FY21 FY22E
in %
Rs. c
r
Absolute A&P spends A&P spends as % to sales
August 23, 2021 22
Sto
ck Id
ea
Powered by the Sharekhan3R Research Philosophy
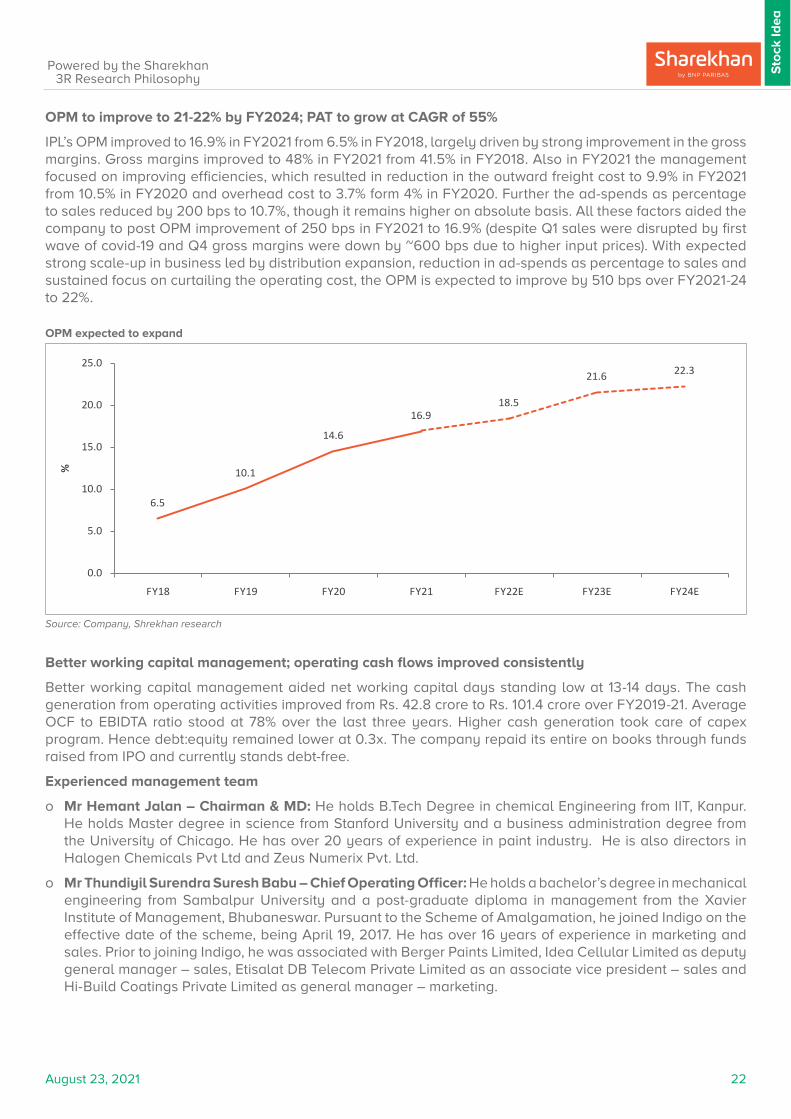
OPM to improve to 21-22% by FY2024; PAT to grow at CAGR of 55%
IPL’s OPM improved to 16.9% in FY2021 from 6.5% in FY2018, largely driven by strong improvement in the gross margins. Gross margins improved to 48% in FY2021 from 41.5% in FY2018. Also in FY2021 the management focused on improving efficiencies, which resulted in reduction in the outward freight cost to 9.9% in FY2021 from 10.5% in FY2020 and overhead cost to 3.7% form 4% in FY2020. Further the ad-spends as percentage to sales reduced by 200 bps to 10.7%, though it remains higher on absolute basis. All these factors aided the company to post OPM improvement of 250 bps in FY2021 to 16.9% (despite Q1 sales were disrupted by first wave of covid-19 and Q4 gross margins were down by ~600 bps due to higher input prices). With expected strong scale-up in business led by distribution expansion, reduction in ad-spends as percentage to sales and sustained focus on curtailing the operating cost, the OPM is expected to improve by 510 bps over FY2021-24 to 22%.
Source: Company, Shrekhan research
OPM expected to expand
6.5
10.1
14.6
16.918.5
21.6 22.3
0.0
5.0
10.0
15.0
20.0
25.0
FY18 FY19 FY20 FY21 FY22E FY23E FY24E
%
Better working capital management; operating cash flows improved consistently
Better working capital management aided net working capital days standing low at 13-14 days. The cash generation from operating activities improved from Rs. 42.8 crore to Rs. 101.4 crore over FY2019-21. Average OCF to EBIDTA ratio stood at 78% over the last three years. Higher cash generation took care of capex program. Hence debt:equity remained lower at 0.3x. The company repaid its entire on books through funds raised from IPO and currently stands debt-free.
Experienced management team
o Mr Hemant Jalan – Chairman & MD: He holds B.Tech Degree in chemical Engineering from IIT, Kanpur. He holds Master degree in science from Stanford University and a business administration degree from the University of Chicago. He has over 20 years of experience in paint industry. He is also directors in Halogen Chemicals Pvt Ltd and Zeus Numerix Pvt. Ltd.
o Mr Thundiyil Surendra Suresh Babu – Chief Operating Officer: He holds a bachelor’s degree in mechanical engineering from Sambalpur University and a post-graduate diploma in management from the Xavier Institute of Management, Bhubaneswar. Pursuant to the Scheme of Amalgamation, he joined Indigo on the effective date of the scheme, being April 19, 2017. He has over 16 years of experience in marketing and sales. Prior to joining Indigo, he was associated with Berger Paints Limited, Idea Cellular Limited as deputy general manager – sales, Etisalat DB Telecom Private Limited as an associate vice president – sales and Hi-Build Coatings Private Limited as general manager – marketing.

August 23, 2021 23
Sto
ck Id
ea
Powered by the Sharekhan3R Research Philosophy
o Mr Chetan Bhalchandra Humane - Chief Financial Officer: He holds a bachelor’s and a master’s degree in commerce from the University of Pune. He joined Indigo with effect from September 10, 2001 and has been appointed as the Chief Financial Officer of the Company with effect from March 11, 2020. He has over 19 years of experience in accounting and finance. Prior to joining Indigo, he was associated with Jenson & Nicholson (I) Ltd as a commercial assistant.
o Mr Varghese Idicula - Vice President; Technical of Indigo: He holds a bachelor’s degree in science and a Master’s Degree in administrative management from the University of Bombay. He has also received a diploma in paint technology from the Colour Society and the Indian Paints Association. Pursuant to the Scheme of Amalgamation, he joined Indigo on the effective date of the scheme, being April 19, 2017. He has over 35 years of experience in research, development and production. Prior to joining Indigo, he was associated with Asian Paints (India) Limited in technical function, Pidilite Industries Limited as head of research & development (paint coating), Sherwin Williams Saudi Arabia Limited as technical and purchase in-charge and Hi-Build Coatings Private Limited as general manager – technical.
August 23, 2021 24
Sto
ck Id
ea
Powered by the Sharekhan3R Research Philosophy
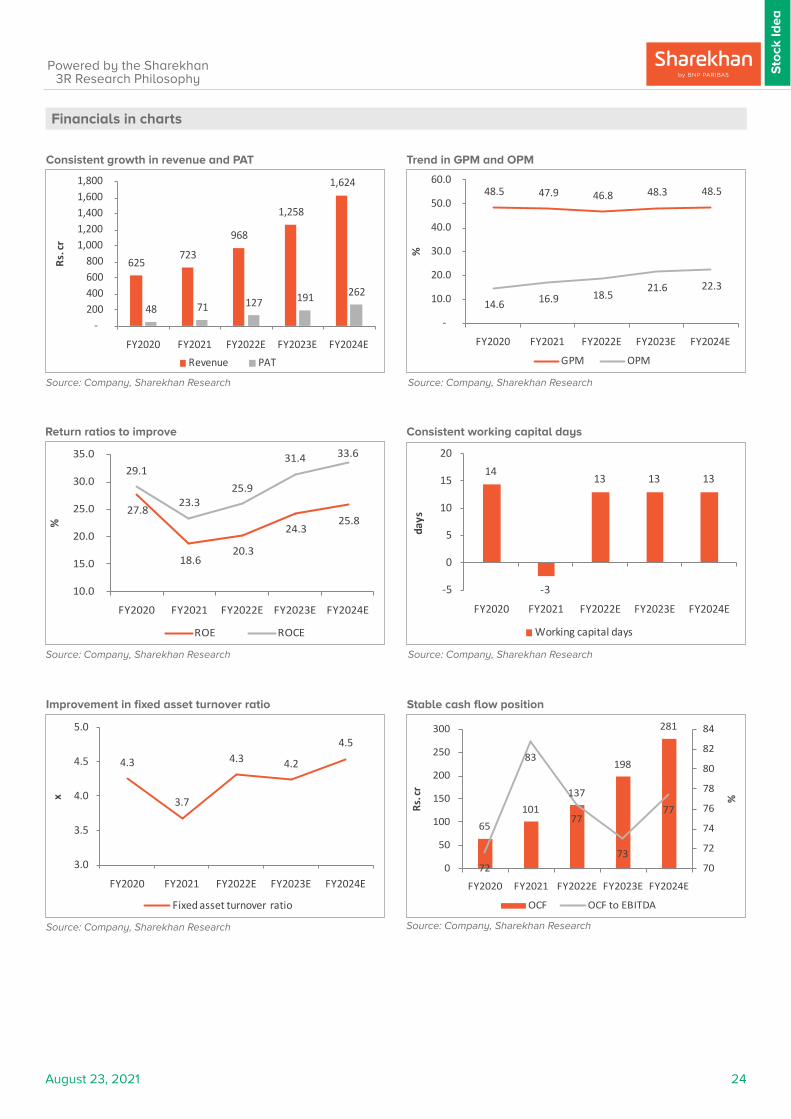
Financials in charts
Source: Company, Sharekhan Research
Return ratios to improve
Source: Company, Sharekhan Research
Trend in GPM and OPM
Consistent working capital days
Source: Company, Sharekhan Research
Consistent growth in revenue and PAT
Source: Company, Sharekhan Research
Improvement in fixed asset turnover ratio
Source: Company, Sharekhan Research
Stable cash flow position
Source: Company, Sharekhan Research
625 723
968
1,258
1,624
48 71 127 191 262
-200 400 600 800
1,000 1,200 1,400 1,600 1,800
FY2020 FY2021 FY2022E FY2023E FY2024E
Rs. c
r
Revenue PAT
48.5 47.9 46.8 48.3 48.5
14.6 16.9 18.5 21.6 22.3
-
10.0
20.0
30.0
40.0
50.0
60.0
FY2020 FY2021 FY2022E FY2023E FY2024E
%
GPM OPM
27.8
18.6 20.3
24.3 25.8
29.1
23.325.9
31.4 33.6
10.0
15.0
20.0
25.0
30.0
35.0
FY2020 FY2021 FY2022E FY2023E FY2024E
%
ROE ROCE
14
-3
13 13 13
-5
0
5
10
15
20
FY2020 FY2021 FY2022E FY2023E FY2024E
days
Working capital days
4.3
3.7
4.3 4.2
4.5
3.0
3.5
4.0
4.5
5.0
FY2020 FY2021 FY2022E FY2023E FY2024E
x
Fixed asset turnover ratio
65101
137
198
281
72
83
77
73
77
70
72
74
76
78
80
82
84
0
50
100
150
200
250
300
FY2020 FY2021 FY2022E FY2023E FY2024E
%
Rs. c
r
OCF OCF to EBITDA

August 23, 2021 25
Sto
ck Id
ea
Powered by the Sharekhan3R Research Philosophy
Valuation – Strong growth potential with differentiated business model
IPL’s differentiated business model would help it to achieve strong scale in the near to medium term. This along with strong balance sheet with strong cash flow (OCF/EBIDTA of 78%) makes it an emerging play in the paints industry. Differentiated business model, excellent return profile and strong structural growth outlook will keep valuation at a premium at 60.4x/44.2 its FY2023/24E EPS.
n Sector View - Structural growth of the paint industry is intact
The Indian paints industry reported an 11% CAGR over FY2011-FY2019 and stood at Rs. 545 billion. The decorative paint segment constitutes around 74% of total paint sales, resulting in the paint sector growing at a robust rate even at the time of an industrial slowdown. April and May (constitute ~25% of total annual sales) are two of the key months for re-painting activities in the domestic market. FY2021 was affected by COVID-19 lockdowns, resulting in almost NIL business in Q1FY2021. Paint industry registered a resilient performance in the second wave of COVID-19 and is expected to post strong performance in the quarters ahead with strong demand for decorative paint products. The decorative paints industry is expected to post a 13% CAGR over FY2019-FY2024, led by reduction in the repainting cycle to 4-5 years (from 7-8 years earlier), acceptance for better paint products in smaller towns, and upgradation of premium brands in cities and large towns.
n Company Outlook - Growth levers in place
A differentiated business model aided the company to achieve strong top and earnings growth of 22% and 71% over FY2018-21 with the highest gross margins of 48% among the peers. The OPM improved to 16.9% in FY2021 from 6.5% in FY2018. Though near term pandemic-led uncertainties would impact the growth, the rising urbanization, willingness to spend behind home improvement, strong traction to differentiate products and market share gains would help IPL to achieve faster recovery in the coming years. A scale-up in the business will help OPM further improve and reach at ~22% in FY2024.
n Valuation - Initiate with Buy assigning a price target of Rs. 3,305
We expect IPL’s revenue and PAT to grow at a CAGR of 31% and 55% over FY2021-24E driven by strong expansion in dealer network, improving market share and margin expansion. The company has strong balance sheet with stable working capital management and strong operating cash flows (average OCF to EBIDTA ratio stood at 78% for past three years). Moreover, its return ratios are expected to improve strongly in the coming years (RoE and RoCE to stand at 26% and 34% in FY2024). The stock is currently trading at 60.4x its FY2023E EPS and 44.2x its FY2024E EPS (and 41.0x/30.1x its FY2023E/24E EV/EBIDTA). Differentiated business model with industry leading gross margins, sustained focus on improving market share, strong return profile and the structural growth story of the paints industry will keep valuations at a premium as compared to close peers. We initiate our coverage on Indigo Paints with a Buy recommendation and price target (PT) of Rs. 3,305 (valuing the stock at 60x its FY2024E earnings).
Peer Comparison
CompaniesCAGR %
(FY21-24)P/E (x) EV/EBIDTA (x) RoCE (%)
Revenue PAT FY21 FY22E FY23E FY21 FY22E FY23E FY21 FY22E FY23E
Asian Paints 16.6 18.8 93.1 75.8 64.1 57.3 48.5 41.2 22.9 23.8 23.7
Berger Paints* 15.6 25.9 110.3 87.8 66.4 66.5 54.4 42.4 20.7 22.3 25.4
Kansai Nerolac* 15 17.8 63.7 55.8 45.4 32.2 29.2 24.6 20.0 22.5 23.7
Pidilite Industries 17.1 20.8 102.6 86.4 69.1 66.2 56.4 45.7 16.7 17.4 19.9
Indigo paints 31.0 54.6 163.2 90.8 60.4 92.0 62.5 41.0 23.3 25.9 31.4
Source: Sharekhan estimates; * Consensus estimates
August 23, 2021 26
Sto
ck Id
ea
Powered by the Sharekhan3R Research Philosophy
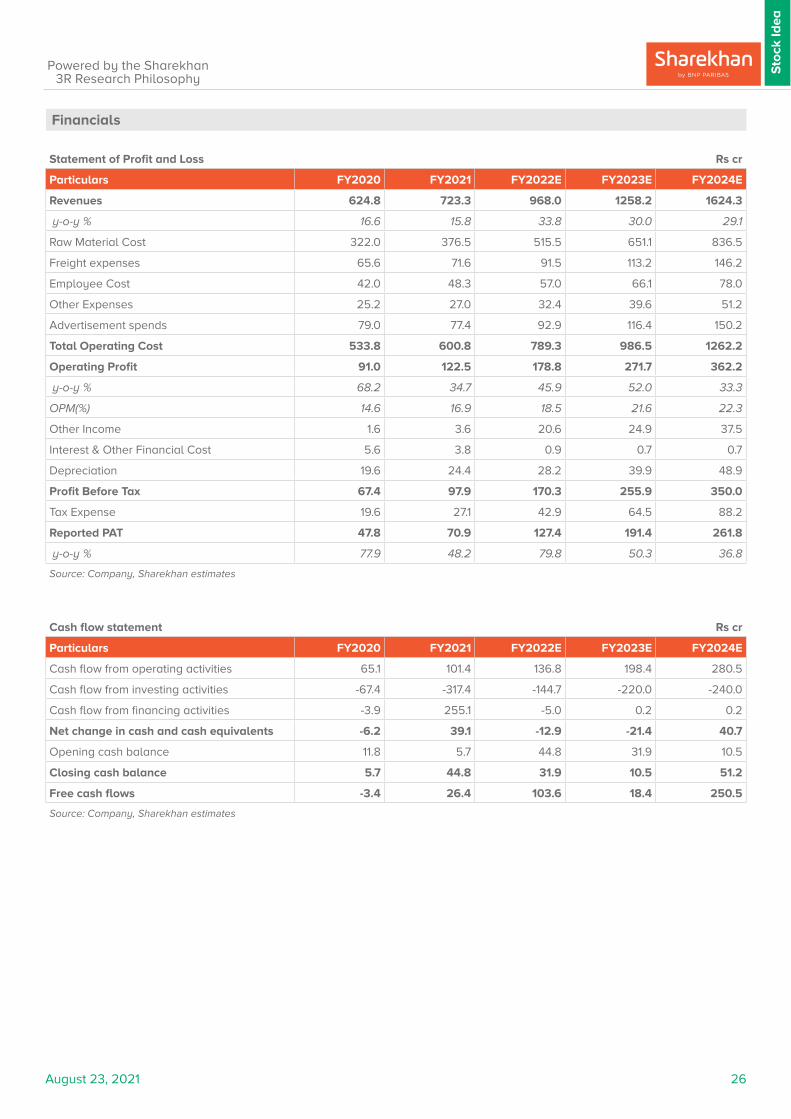
Financials
Statement of Profit and Loss Rs cr
Particulars FY2020 FY2021 FY2022E FY2023E FY2024E
Revenues 624.8 723.3 968.0 1258.2 1624.3
y-o-y % 16.6 15.8 33.8 30.0 29.1
Raw Material Cost 322.0 376.5 515.5 651.1 836.5
Freight expenses 65.6 71.6 91.5 113.2 146.2
Employee Cost 42.0 48.3 57.0 66.1 78.0
Other Expenses 25.2 27.0 32.4 39.6 51.2
Advertisement spends 79.0 77.4 92.9 116.4 150.2
Total Operating Cost 533.8 600.8 789.3 986.5 1262.2
Operating Profit 91.0 122.5 178.8 271.7 362.2
y-o-y % 68.2 34.7 45.9 52.0 33.3
OPM(%) 14.6 16.9 18.5 21.6 22.3
Other Income 1.6 3.6 20.6 24.9 37.5
Interest & Other Financial Cost 5.6 3.8 0.9 0.7 0.7
Depreciation 19.6 24.4 28.2 39.9 48.9
Profit Before Tax 67.4 97.9 170.3 255.9 350.0
Tax Expense 19.6 27.1 42.9 64.5 88.2
Reported PAT 47.8 70.9 127.4 191.4 261.8
y-o-y % 77.9 48.2 79.8 50.3 36.8
Source: Company, Sharekhan estimates
Cash flow statement Rs cr
Particulars FY2020 FY2021 FY2022E FY2023E FY2024E
Cash flow from operating activities 65.1 101.4 136.8 198.4 280.5
Cash flow from investing activities -67.4 -317.4 -144.7 -220.0 -240.0
Cash flow from financing activities -3.9 255.1 -5.0 0.2 0.2
Net change in cash and cash equivalents -6.2 39.1 -12.9 -21.4 40.7
Opening cash balance 11.8 5.7 44.8 31.9 10.5
Closing cash balance 5.7 44.8 31.9 10.5 51.2
Free cash flows -3.4 26.4 103.6 18.4 250.5
Source: Company, Sharekhan estimates
August 23, 2021 27
Sto
ck Id
ea
Powered by the Sharekhan3R Research Philosophy
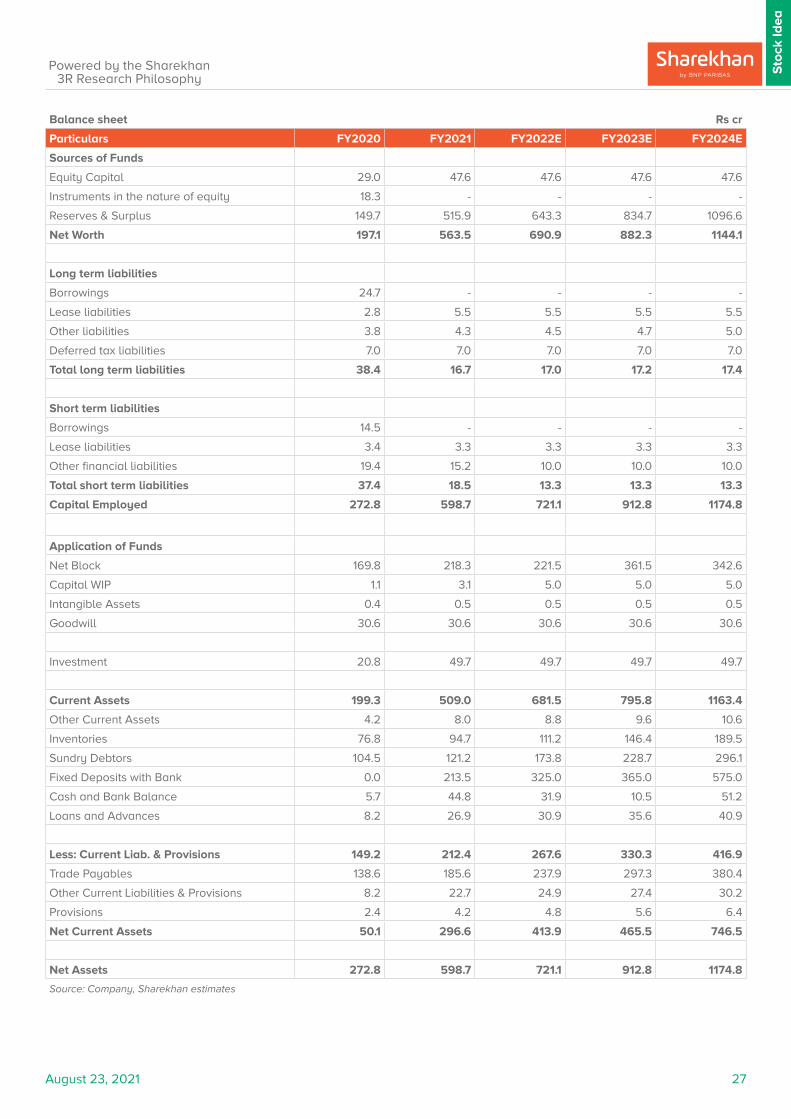
Balance sheet Rs cr
Particulars FY2020 FY2021 FY2022E FY2023E FY2024E
Sources of Funds
Equity Capital 29.0 47.6 47.6 47.6 47.6
Instruments in the nature of equity 18.3 - - - -
Reserves & Surplus 149.7 515.9 643.3 834.7 1096.6
Net Worth 197.1 563.5 690.9 882.3 1144.1
Long term liabilities
Borrowings 24.7 - - - -
Lease liabilities 2.8 5.5 5.5 5.5 5.5
Other liabilities 3.8 4.3 4.5 4.7 5.0
Deferred tax liabilities 7.0 7.0 7.0 7.0 7.0
Total long term liabilities 38.4 16.7 17.0 17.2 17.4
Short term liabilities
Borrowings 14.5 - - - -
Lease liabilities 3.4 3.3 3.3 3.3 3.3
Other financial liabilities 19.4 15.2 10.0 10.0 10.0
Total short term liabilities 37.4 18.5 13.3 13.3 13.3
Capital Employed 272.8 598.7 721.1 912.8 1174.8
Application of Funds
Net Block 169.8 218.3 221.5 361.5 342.6
Capital WIP 1.1 3.1 5.0 5.0 5.0
Intangible Assets 0.4 0.5 0.5 0.5 0.5
Goodwill 30.6 30.6 30.6 30.6 30.6
Investment 20.8 49.7 49.7 49.7 49.7
Current Assets 199.3 509.0 681.5 795.8 1163.4
Other Current Assets 4.2 8.0 8.8 9.6 10.6
Inventories 76.8 94.7 111.2 146.4 189.5
Sundry Debtors 104.5 121.2 173.8 228.7 296.1
Fixed Deposits with Bank 0.0 213.5 325.0 365.0 575.0
Cash and Bank Balance 5.7 44.8 31.9 10.5 51.2
Loans and Advances 8.2 26.9 30.9 35.6 40.9
Less: Current Liab. & Provisions 149.2 212.4 267.6 330.3 416.9
Trade Payables 138.6 185.6 237.9 297.3 380.4
Other Current Liabilities & Provisions 8.2 22.7 24.9 27.4 30.2
Provisions 2.4 4.2 4.8 5.6 6.4
Net Current Assets 50.1 296.6 413.9 465.5 746.5
Net Assets 272.8 598.7 721.1 912.8 1174.8
Source: Company, Sharekhan estimates

August 23, 2021 28
Sto
ck U
pd
ate
Sto
ck Id
ea
Powered by the Sharekhan3R Research Philosophy
Key Ratios
Particulars FY2020 FY2021 FY2022E FY2023E FY2024E
Margins & Tax rate (%)
GPM 48.5 47.9 46.8 48.3 48.5
OPM 14.6 16.9 18.5 21.6 22.3
NPM 7.7 9.8 13.2 15.2 16.1
Tax rate 29.1 27.6 25.2 25.2 25.2
Cost matrix (% of revenues)
Raw material cost 51.5 52.1 53.3 51.8 51.5
Freight cost 10.5 9.9 9.5 9.0 9.0
employee cost 6.7 6.7 5.9 5.3 4.8
Other expenses 4.0 3.7 3.4 3.2 3.2
Advertisement spends 12.7 10.7 9.6 9.3 9.3
Total operating cost 85.4 83.1 81.5 78.4 77.7
Growth ratios (y-o-y %)
Revenues 16.6 15.8 33.8 30.0 29.1
Operating profit 14.6 16.9 18.5 21.6 22.3
PBT 98.2 45.2 74.0 50.3 36.8
Adjusted PAT 75.9 48.2 79.8 50.3 36.8
Reported PAT 77.9 48.2 79.8 50.3 36.8
Per share (Rs.)
CMP 2431.0 2431.0 2431.0 2431.0 2431.0
Adjusted EPS - Diluted 10.1 14.9 26.8 40.2 55.0
Reported EPS - Diluted 10.1 14.9 26.8 40.2 55.0
Cash EPS 23.2 20.0 32.7 48.6 65.3
Book value per share (BVPS) 67.9 118.5 145.2 185.5 240.5
Valuation ratios (x)
P/E - - 90.8 60.4 44.2
Price / Book value (BV) 35.8 20.5 16.7 13.1 10.1
EV / EBIDTA - 92.0 62.5 41.0 30.1
EV / Sales 18.5 15.6 11.5 8.9 6.7
Market cap / Sales 18.5 16.0 11.9 9.2 7.1
Working capital (Days)
Inventory Days 48 51 48 48 48
Debtors Days 66 66 75 75 75
Creditors Days 100 119 110 110 110
Operating cash cycle 14 -3 13 13 13
Financial ratios
Fixed asset turnover ratio (x) 4.3 3.7 4.3 4.2 4.5
Total asset turnover ratio (x) 1.6 1.2 1.1 1.1 1.1
Operating cash flow/EBIDTA (%) 72 83 77 73 77
Debt / Equity (x) 0.2 0.0 0.0 0.0 0.0
RoE (%) 27.8 18.6 20.3 24.3 25.8
RoCE (%) 29.1 23.3 25.9 31.4 33.6
Source: Company, Sharekhan estimates
August 23, 2021 29
Sto
ck U
pd
ate
Sto
ck U
pd
ate
Powered by the Sharekhan3R Research Philosophy
About company
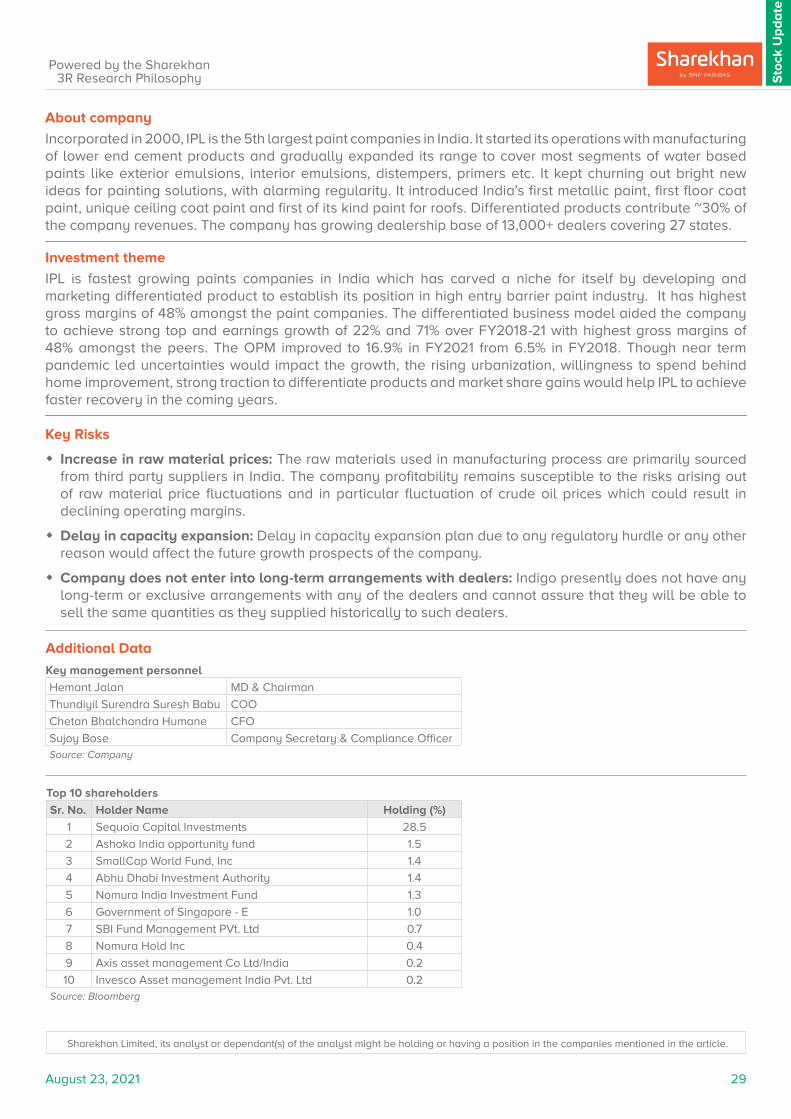
Incorporated in 2000, IPL is the 5th largest paint companies in India. It started its operations with manufacturing of lower end cement products and gradually expanded its range to cover most segments of water based paints like exterior emulsions, interior emulsions, distempers, primers etc. It kept churning out bright new ideas for painting solutions, with alarming regularity. It introduced India’s first metallic paint, first floor coat paint, unique ceiling coat paint and first of its kind paint for roofs. Differentiated products contribute ~30% of the company revenues. The company has growing dealership base of 13,000+ dealers covering 27 states.
Investment theme
IPL is fastest growing paints companies in India which has carved a niche for itself by developing and marketing differentiated product to establish its position in high entry barrier paint industry. It has highest gross margins of 48% amongst the paint companies. The differentiated business model aided the company to achieve strong top and earnings growth of 22% and 71% over FY2018-21 with highest gross margins of 48% amongst the peers. The OPM improved to 16.9% in FY2021 from 6.5% in FY2018. Though near term pandemic led uncertainties would impact the growth, the rising urbanization, willingness to spend behind home improvement, strong traction to differentiate products and market share gains would help IPL to achieve faster recovery in the coming years. Key Risks
� Increase in raw material prices: The raw materials used in manufacturing process are primarily sourced from third party suppliers in India. The company profitability remains susceptible to the risks arising out of raw material price fluctuations and in particular fluctuation of crude oil prices which could result in declining operating margins.
� Delay in capacity expansion: Delay in capacity expansion plan due to any regulatory hurdle or any other reason would affect the future growth prospects of the company.
� Company does not enter into long-term arrangements with dealers: Indigo presently does not have any long-term or exclusive arrangements with any of the dealers and cannot assure that they will be able to sell the same quantities as they supplied historically to such dealers.
Additional Data
Key management personnel
Hemant Jalan MD & Chairman
Thundiyil Surendra Suresh Babu COO
Chetan Bhalchandra Humane CFO
Sujoy Bose Company Secretary & Compliance Officer Source: Company
Top 10 shareholders
Sr. No. Holder Name Holding (%)
1 Sequoia Capital Investments 28.5
2 Ashoka India opportunity fund 1.5
3 SmallCap World Fund, Inc 1.4
4 Abhu Dhabi Investment Authority 1.4
5 Nomura India Investment Fund 1.3
6 Government of Singapore - E 1.0
7 SBI Fund Management PVt. Ltd 0.7
8 Nomura Hold Inc 0.4
9 Axis asset management Co Ltd/India 0.2
10 Invesco Asset management India Pvt. Ltd 0.2Source: Bloomberg
Sharekhan Limited, its analyst or dependant(s) of the analyst might be holding or having a position in the companies mentioned in the article.
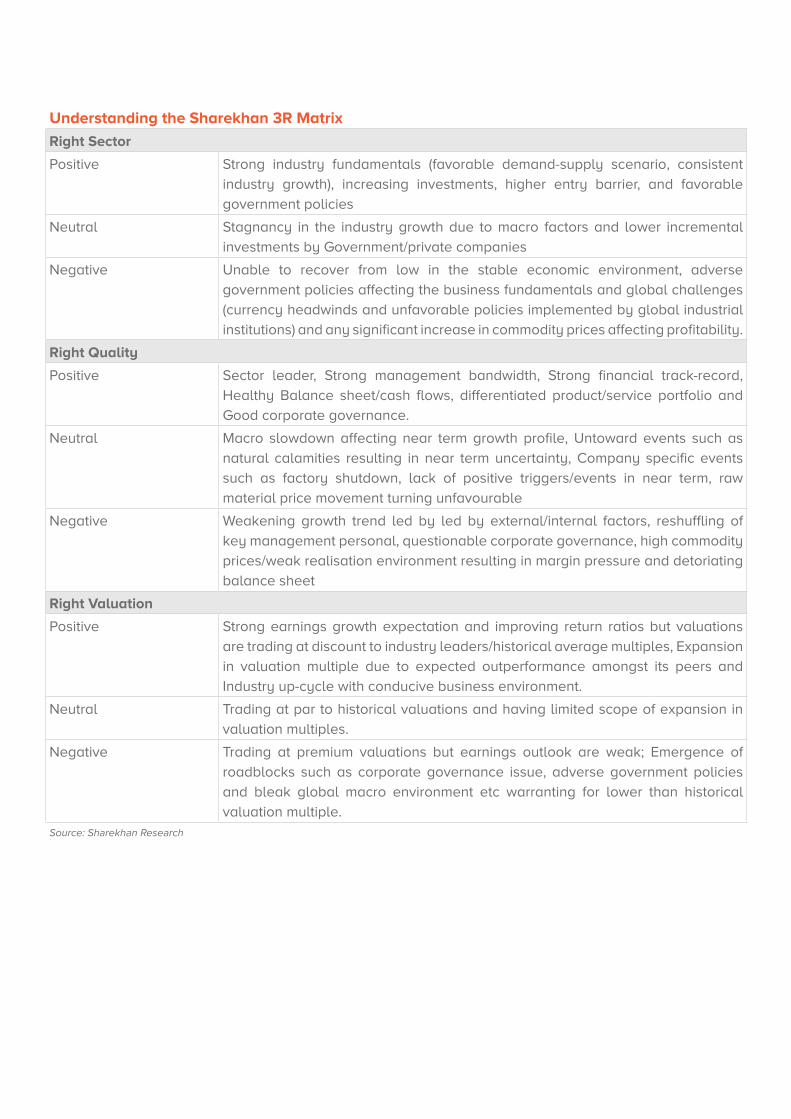
Understanding the Sharekhan 3R Matrix
Right Sector
Positive Strong industry fundamentals (favorable demand-supply scenario, consistent
industry growth), increasing investments, higher entry barrier, and favorable
government policies
Neutral Stagnancy in the industry growth due to macro factors and lower incremental
investments by Government/private companies
Negative Unable to recover from low in the stable economic environment, adverse
government policies affecting the business fundamentals and global challenges
(currency headwinds and unfavorable policies implemented by global industrial
institutions) and any significant increase in commodity prices affecting profitability.
Right Quality
Positive Sector leader, Strong management bandwidth, Strong financial track-record,
Healthy Balance sheet/cash flows, differentiated product/service portfolio and
Good corporate governance.
Neutral Macro slowdown affecting near term growth profile, Untoward events such as
natural calamities resulting in near term uncertainty, Company specific events
such as factory shutdown, lack of positive triggers/events in near term, raw
material price movement turning unfavourable
Negative Weakening growth trend led by led by external/internal factors, reshuffling of
key management personal, questionable corporate governance, high commodity
prices/weak realisation environment resulting in margin pressure and detoriating
balance sheet
Right Valuation
Positive Strong earnings growth expectation and improving return ratios but valuations
are trading at discount to industry leaders/historical average multiples, Expansion
in valuation multiple due to expected outperformance amongst its peers and
Industry up-cycle with conducive business environment.
Neutral Trading at par to historical valuations and having limited scope of expansion in
valuation multiples.
Negative Trading at premium valuations but earnings outlook are weak; Emergence of
roadblocks such as corporate governance issue, adverse government policies
and bleak global macro environment etc warranting for lower than historical
valuation multiple.Source: Sharekhan Research

Disclaimer: This document has been prepared by Sharekhan Ltd. (SHAREKHAN) and is intended for use only by the person or entity to which it is addressed to. This Document may contain confidential and/or privileged material and is not for any type of circulation and any review, retransmission, or any other use is strictly prohibited. This Document is subject to changes without prior notice. This document does not constitute an offer to sell or solicitation for the purchase or sale of any financial instrument or as an official confirmation of any transaction. Though disseminated to all customers who are due to receive the same, not all customers may receive this report at the same time. SHAREKHAN will not treat recipients as customers by virtue of their receiving this report.
The information contained herein is obtained from publicly available data or other sources believed to be reliable and SHAREKHAN has not independently verified the accuracy and completeness of the said data and hence it should not be relied upon as such. While we would endeavour to update the information herein on reasonable basis, SHAREKHAN, its subsidiaries and associated companies, their directors and employees (“SHAREKHAN and affiliates”) are under no obligation to update or keep the information current. Also, there may be regulatory, compliance, or other reasons that may prevent SHAREKHAN and affiliates from doing so. This document is prepared for assistance only and is not intended to be and must not alone be taken as the basis for an investment decision. Recipients of this report should also be aware that past performance is not necessarily a guide to future performance and value of investments can go down as well. The user assumes the entire risk of any use made of this information. Each recipient of this document should make such investigations as it deems necessary to arrive at an independent evaluation of an investment in the securities of companies referred to in this document (including the merits and risks involved), and should consult its own advisors to determine the merits and risks of such an investment. The investment discussed or views expressed may not be suitable for all investors. We do not undertake to advise you as to any change of our views. Affiliates of Sharekhan may have issued other reports that are inconsistent with and reach different conclusions from the information presented in this report.
This report is not directed or intended for distribution to, or use by, any person or entity who is a citizen or resident of or located in any locality, state, country or other jurisdiction, where such distribution, publication, availability or use would be contrary to law, regulation or which would subject SHAREKHAN and affiliates to any registration or licensing requirement within such jurisdiction. The securities described herein may or may not be eligible for sale in all jurisdictions or to certain category of investors. Persons in whose possession this document may come are required to inform themselves of and to observe such restriction.
The analyst certifies that the analyst has not dealt or traded directly or indirectly in securities of the company and that all of the views expressed in this document accurately reflect his or her personal views about the subject company or companies and its or their securities and do not necessarily reflect those of SHAREKHAN. The analyst and SHAREKHAN further certifies that neither he or his relatives or Sharekhan associates has any direct or indirect financial interest nor have actual or beneficial ownership of 1% or more in the securities of the company at the end of the month immediately preceding the date of publication of the research report nor have any material conflict of interest nor has served as officer, director or employee or engaged in market making activity of the company. Further, the analyst has also not been a part of the team which has managed or co-managed the public offerings of the company and no part of the analyst’s compensation was, is or will be, directly or indirectly related to specific recommendations or views expressed in this document. Sharekhan Limited or its associates or analysts have not received any compensation for investment banking, merchant banking, brokerage services or any compensation or other benefits from the subject company or from third party in the past twelve months in connection with the research report.
Either, SHAREKHAN or its affiliates or its directors or employees / representatives / clients or their relatives may have position(s), make market, act as principal or engage in transactions of purchase or sell of securities, from time to time or may be materially interested in any of the securities or related securities referred to in this report and they may have used the information set forth herein before publication. SHAREKHAN may from time to time solicit from, or perform investment banking, or other services for, any company mentioned herein. Without limiting any of the foregoing, in no event shall SHAREKHAN, any of its affiliates or any third party involved in, or related to, computing or compiling the information have any liability for any damages of any kind.
Compliance Officer: Mr. Joby John Meledan; Tel: 022-61150000; email id: [email protected];
For any queries or grievances kindly email [email protected] or contact: [email protected]
Registered Office: Sharekhan Limited, 10th Floor, Beta Building, Lodha iThink Techno Campus, Off. JVLR, Opp. Kanjurmarg Railway Station, Kanjurmarg (East), Mumbai – 400042, Maharashtra. Tel: 022 - 61150000. Sharekhan Ltd.: SEBI Regn. Nos.: BSE / NSE / MSEI (CASH / F&O / CD) / MCX - Commodity: INZ000171337; DP: NSDL/CDSL-IN-DP-365-2018; PMS: INP000005786; Mutual Fund: ARN 20669; Research Analyst: INH000006183;
Disclaimer: Client should read the Risk Disclosure Document issued by SEBI & relevant exchanges and the T&C on www.sharekhan.com; Investment in securities market are subject to market risks, read all the related documents carefully before investing.
Know more about our products and services
For Private Circulation only


