Sector Notebook Project Inorganic Chemicals September 1995 SIC 281 This report is one in a series of volumes published by the U.S. Environmental Protection Agency (EPA) to provide information of general interest regarding environmental issues associated with specific industrial sectors. The documents were developed under contract by Abt Associates (Cambridge, MA), and Booz-Allen & Hamilton, Inc. (McLean, VA). This publication may be purchased from the Superintendent of Documents, U.S. Government Printing Office. A listing of available Sector Notebooks and document numbers is included on the following page. All telephone orders should be directed to: Superintendent of Documents U.S. Government Printing Office Washington, DC 20402 (202) 512-1800 FAX (202) 512-2250 8:00 a.m. to 4:30 p.m., ET, M-F Using the form provided at the end of this document, all mail orders should be directed to: U.S. Government Printing Office P.O. Box 371954 Pittsburgh, PA 15250-7954 Complimentary volumes are available to certain groups or subscribers, such as public and academic libraries, Federal, State, local, and foreign governments, and the media. For further information, and for answers to questions pertaining to these documents, please refer to the contact names and numbers provided within this volume. Electronic versions of all Sector Notebooks are available free of charge at the following web address: www.epa.gov/oeca/sector. Direct technical questions to the “Feedback” button at the bottom of the web page.
Transcript
Sector Notebook Project Inorganic Chemicals
September 1995 SIC 281
This report is one in a series of volumes published by the U.S. Environmental Protection Agency(EPA) to provide information of general interest regarding environmental issues associated withspecific industrial sectors. The documents were developed under contract by Abt Associates(Cambridge, MA), and Booz-Allen & Hamilton, Inc. (McLean, VA). This publication may bepurchased from the Superintendent of Documents, U.S. Government Printing Office. A listing ofavailable Sector Notebooks and document numbers is included on the following page.
All telephone orders should be directed to:
Superintendent of DocumentsU.S. Government Printing OfficeWashington, DC 20402(202) 512-1800FAX (202) 512-22508:00 a.m. to 4:30 p.m., ET, M-F
Using the form provided at the end of this document, all mail orders should be directed to:
U.S. Government Printing OfficeP.O. Box 371954Pittsburgh, PA 15250-7954
Complimentary volumes are available to certain groups or subscribers, such as public andacademic libraries, Federal, State, local, and foreign governments, and the media. For furtherinformation, and for answers to questions pertaining to these documents, please refer to thecontact names and numbers provided within this volume.
Electronic versions of all Sector Notebooks are available free of charge at the following webaddress: www.epa.gov/oeca/sector. Direct technical questions to the “Feedback” button at thebottom of the web page.
Sector Notebook Project Inorganic Chemicals
September 1995 SIC 281
Cover photograph by Steve Delaney, EPA. Photograph courtesy of Vista Chemicals, Baltimore,Maryland. Special thanks to Dave Mahler.
Sector Notebook Project Inorganic Chemicals
September 1995 SIC 281
EPA/310-R-95-004
EPA Office of Compliance Sector Notebook Project
Profile of the Inorganic Chemical Industry
September 1995
Office of ComplianceOffice of Enforcement and Compliance Assurance
U.S. Environmental Protection Agency401 M St., SW (MC 2221-A)
Washington, DC 20460
Sector Notebook Contacts
Sector Notebook Project Inorganic Chemicals
September 1995 SIC 281
The Sector Notebooks were developed by the EPA’s Office of Compliance. Questions relating tothe Sector Notebook Project can be directed to:
Seth Heminway, Coordinator, Sector Notebook ProjectUS EPA Office of Compliance401 M St., SW (2223-A)Washington, DC 20460(202) 564-7017
Questions and comments regarding the individual documents can be directed to the appropriatespecialists listed below.
Document Number Industry Contact Phone (202)EPA/310-R-95-001. Dry Cleaning Industry Joyce Chandler 564-7073EPA/310-R-95-002. Electronics and Computer Industry* Steve Hoover 564-7007EPA/310-R-95-003. Wood Furniture and Fixtures Industry Bob Marshall 564-7021EPA/310-R-95-004. Inorganic Chemical Industry* Walter DeRieux 564-7067EPA/310-R-95-005. Iron and Steel Industry Maria Malave 564-7027EPA/310-R-95-006. Lumber and Wood Products Industry Seth Heminway 564-7017EPA/310-R-95-007. Fabricated Metal Products Industry* Scott Throwe 564-7013EPA/310-R-95-008. Metal Mining Industry Jane Engert 564-5021EPA/310-R-95-009. Motor Vehicle Assembly Industry Anthony Raia 564-6045EPA/310-R-95-010. Nonferrous Metals Industry Jane Engert 564-5021EPA/310-R-95-011. Non-Fuel, Non-Metal Mining Industry Rob Lischinsky 564-2628EPA/310-R-95-012. Organic Chemical Industry* Walter DeRieux 564-7067EPA/310-R-95-013. Petroleum Refining Industry Tom Ripp 564-7003EPA/310-R-95-014. Printing Industry Ginger Gotliffe 564-7072EPA/310-R-95-015. Pulp and Paper Industry Seth Heminway 564-7017EPA/310-R-95-016. Rubber and Plastic Industry Maria Malave 564-7027EPA/310-R-95-017. Stone, Clay, Glass, and Concrete Industry Scott Throwe 564-7013EPA/310-R-95-018. Transportation Equipment Cleaning Ind. Virginia Lathrop 564-7057EPA/310-R-97-001. Air Transportation Industry Virginia Lathrop 564-7057EPA/310-R-97-002. Ground Transportation Industry Virginia Lathrop 564-7057EPA/310-R-97-003. Water Transportation Industry Virginia Lathrop 564-7057EPA/310-R-97-004. Metal Casting Industry Jane Engert 564-5021EPA/310-R-97-005. Pharmaceuticals Industry Emily Chow 564-7071EPA/310-R-97-006. Plastic Resin and Man-made Fiber Ind. Sally Sasnett 564-7074EPA/310-R-97-007. Fossil Fuel Electric Power Generation Ind. Rafael Sanchez 564-7028EPA/310-R-97-008. Shipbuilding and Repair Industry Anthony Raia 564-6045EPA/310-R-97-009. Textile Industry Belinda Breidenbach 564-7022EPA/310-R-97-010. Sector Notebook Data Refresh-1997 Seth Heminway 564-7017EPA/310-R-98-001. Aerospace Industry Anthony Raia 564-6045EPA/310-R-98-002. Agricultural Chemical, Pesticide, and Shruti Sanghavi 564-4158
Fertilizer IndustryEPA/310-R-98-003. Agricultural Crop Production Industry Ginah Mortensen (913)551-7864EPA/310-R-98-004. Agricultural Livestock Production Ind. Ginah Mortensen (913)551-7864
Sector Notebook Project Inorganic Chemicals
September 1995 SIC 281
EPA/310-R-98-005. Oil and Gas Exploration and Production Dan Chadwick 564-7054Industry
EPA/310-R-98-008. Local Government Operations John Dombrowski 564-7036*Spanish Translations Available
Sector Notebook Project Inorganic Chemicals
September 1995 SIC 281i
Industry Sector Notebook Contents: Inorganic Chemicals Manufacturing
AFS - AIRS Facility Subsystem (CAA database)AIRS - Aerometric Information Retrieval System (CAA database)BIFs - Boilers and Industrial Furnaces (RCRA)BOD - Biochemical Oxygen Demand CAA - Clean Air ActCAAA - Clean Air Act Amendments of 1990CERCLA - Comprehensive Environmental Response, Compensation and Liability ActCERCLIS - CERCLA Information SystemCFCs - ChlorofluorocarbonsCO - Carbon Monoxide COD - Chemical Oxygen Demand CSI - Common Sense Initiative CWA - Clean Water ActD&B - Dun and Bradstreet Marketing IndexDSA - Dimensionallly stableELP - Environmental Leadership Program EPA - United States Environmental Protection AgencyEPCRA - Emergency Planning and Community Right-to-Know Act FIFRA - Federal Insecticide, Fungicide, and Rodenticide ActFINDS - Facility Indexing SystemHAPs - Hazardous Air Pollutants (CAA)HSDB - Hazardous Substances Data Bank IDEA - Integrated Data for Enforcement AnalysisLDR - Land Disposal Restrictions (RCRA)LEPCs - Local Emergency Planning Committees MACT - Maximum Achievable Control Technology (CAA)MCLGs - Maximum Contaminant Level Goals MCLs - Maximum Contaminant Levels MEK - Methyl Ethyl KetoneMSDSs - Material Safety Data Sheets NAAQS - National Ambient Air Quality Standards (CAA)NAFTA - North American Free Trade Agreement NCDB - National Compliance Database (for TSCA, FIFRA, EPCRA)NCP - National Oil and Hazardous Substances Pollution Contingency Plan NEIC - National Enforcement Investigation Center NESHAP - National Emission Standards for Hazardous Air PollutantsNO - Nitrogen Dioxide2
NOV - Notice of Violation NO - Nitrogen Oxide X
Sector Notebook Project Inorganic Chemicals
September 1995 SIC 281v
NPDES - National Pollution Discharge Elimination System (CWA)NPL - National Priorities List NRC - National Response Center NSPS - New Source Performance Standards (CAA)OAR - Office of Air and RadiationOECA - Office of Enforcement and Compliance AssuranceOPA - Oil Pollution ActOPPTS - Office of Prevention, Pesticides, and Toxic SubstancesOSHA - Occupational Safety and Health Administration OSW - Office of Solid WasteOSWER - Office of Solid Waste and Emergency ResponseOW - Office of WaterP2 - Pollution PreventionPCS - Permit Compliance System (CWA Database)POTW - Publicly Owned Treatments Works RCRA - Resource Conservation and Recovery ActRCRIS - RCRA Information SystemSARA - Superfund Amendments and Reauthorization Act SDWA - Safe Drinking Water ActSEPs - Supplementary Environmental Projects SERCs - State Emergency Response Commissions SIC - Standard Industrial Classification SO - Sulfur Dioxide 2
SO - Sulfur OxidesX
TOC - Total Organic Carbon TRI - Toxic Release InventoryTRIS - Toxic Release Inventory System TCRIS - Toxic Chemical Release Inventory SystemTSCA - Toxic Substances Control ActTSS - Total Suspended Solids UIC - Underground Injection Control (SDWA)UST - Underground Storage Tanks (RCRA)VOCs - Volatile Organic Compounds
Sector Notebook Project Inorganic Chemicals
September 1995 SIC 2811
I. INTRODUCTION TO THE SECTOR NOTEBOOK PROJECT
I.A. Summary of the Sector Notebook Project
Environmental policies based upon comprehensive analysis of air, water andland pollution are an inevitable and logical supplement to traditional single-media approaches to environmental protection. Environmental regulatoryagencies are beginning to embrace comprehensive, multi-statute solutions tofacility permitting, enforcement and compliance assurance, education/outreach, research, and regulatory development issues. The central conceptsdriving the new policy direction are that pollutant releases to eachenvironmental medium (air, water and land) affect each other, and thatenvironmental strategies must actively identify and address these inter-relationships by designing policies for the "whole" facility. One way toachieve a whole facility focus is to design environmental policies for similarindustrial facilities. By doing so, environmental concerns that are common tothe manufacturing of similar products can be addressed in a comprehensivemanner. Recognition of the need to develop the industrial “sector-based”approach within the EPA Office of Compliance led to the creation of thisdocument.
The Sector Notebook Project was initiated by the Office of Compliance withinthe Office of Enforcement and Compliance Assurance (OECA) to provide itsstaff and managers with summary information for eighteen specific industrialsectors. As other EPA offices, states, the regulated community,environmental groups, and the public became interested in this project, thescope of the original project was expanded. The ability to designcomprehensive, common sense environmental protection measures for specificindustries is dependent on knowledge of several inter-related topics. For thepurposes of this project, the key elements chosen for inclusion are: generalindustry information (economic and geographic); a description of industrialprocesses; pollution outputs; pollution prevention opportunities; Federalstatutory and regulatory framework; compliance history; and a description ofpartnerships that have been formed between regulatory agencies, the regulatedcommunity and the public.
For any given industry, each topic listed above could alone be the subject ofa lengthy volume. However, in order to produce a manageable document, thisproject focuses on providing summary information for each topic. Thisformat provides the reader with a synopsis of each issue, and references wheremore in-depth information is available. Text within each profile wasresearched from a variety of sources, and was usually condensed from moredetailed sources pertaining to specific topics. This approach allows for a widecoverage of activities that can be further explored based upon the citations
Sector Notebook Project Inorganic Chemicals
September 1995 SIC 2812
and references listed at the end of this profile. As a check on the informationincluded, each notebook went through an external review process. The Officeof Compliance appreciates the efforts of all those that participated in thisprocess and enabled us to develop more complete, accurate and up-to-datesummaries.
I.B. Additional Information
Providing Comments
OECA’s Office of Compliance plans to periodically review and update thenotebooks and will make these updates available both in hard copy andelectronically. If you have any comments on the existing notebook, or if youwould like to provide additional information, please send a hard copy andcomputer disk to the EPA Office of Compliance, Sector Notebook Project,401 M St., SW (2223-A), Washington, DC 20460. Comments can also beuploaded to the Enviro$en$e Bulletin Board or the Enviro$en$e World WideWeb for general access to all users of the system. Follow instructions inAppendix A for accessing these data systems. Once you have logged in,procedures for uploading text are available from the on-line Enviro$en$e HelpSystem.
Adapting Notebooks to Particular Needs
The scope of the existing notebooks reflect an approximation of the relativenational occurrence of facility types that occur within each sector. In manyinstances, industries within specific geographic regions or states may haveunique characteristics that are not fully captured in these profiles. For thisreason, the Office of Compliance encourages state and local environmentalagencies and other groups to supplement or re-package the informationincluded in this notebook to include more specific industrial and regulatoryinformation that may be available. Additionally, interested states may wantto supplement the "Summary of Applicable Federal Statutes and Regulations"section with state and local requirements. Compliance or technical assistanceproviders may also want to develop the "Pollution Prevention" section in moredetail. Please contact the appropriate specialist listed on the opening page ofthis notebook if your office is interested in assisting us in the furtherdevelopment of the information or policies addressed within this volume.
If you are interested in assisting in the development of new notebooks forsectors not covered in the original eighteen, please contact the Office ofCompliance at 202-564-2395.
Sector Notebook Project Inorganic Chemicals
September 1995 SIC 2813
II. INTRODUCTION TO THE INORGANIC CHEMICALS INDUSTRY
This section provides background information on the size, geographicdistribution, employment, production, sales, and economic condition of theinorganic chemicals industry. The type of facilities described within thedocument are also described in terms of their Standard IndustrialClassification (SIC) codes. Additionally, this section contains a list of thelargest companies in terms of sales.
II.A. Introduction, Background, and Scope of the Notebook
The inorganic chemical industry manufactures over 300 different chemicalsaccounting for about 10 percent of the total value of chemical shipments in theU.S. This industry categorization corresponds to Standard Industrial1
Classification (SIC) code 281 Industrial Inorganic Chemicals established bythe Bureau of Census to track the flow of goods and services within theeconomy. The 281 category includes alkalies and chlorine (SIC 2812),industrial gases (SIC 2813) (e.g., hydrogen, helium, oxygen, nitrogen, etc.),inorganic pigments (SIC 2816), and industrial inorganic chemicals, notelsewhere classified (SIC 2819). Approximately two-thirds of the value ofshipments for the inorganic chemical industry, including over 200 differentchemicals, are classified under industrial inorganic chemicals, not elsewhereclassified (SIC 2819). The industry does not include those establishmentsprimarily manufacturing organic chemicals, agricultural pesticides, drugs,soaps, or cosmetics. However, the 281 industry group does include asignificant number of integrated firms that are engaged in the manufacture ofother types of chemicals at the same site. Conversely, many manufacturingfacilities not categorized under SIC 281, especially organic chemicals facilities(SIC 286), fertilizer plants (SIC 287), pulp and paper mills (SIC 26), and ironand steel mills (SIC 331), produce and use inorganic chemicals in theirprocesses at the same facility. For example, a significant number of inorganic2
chemical manufacturing processes are part of very large chemicalmanufacturing or pulp manufacturing facilities, making characterizationstrictly by SIC code difficult.
Whenever possible, this notebook describes the entire inorganic chemicalindustry. In many cases, however, specific details relating to some of thetopics covered by the notebook (facility size, economic trends, geographicdistribution, pollutant releases, pollution prevention issues, and applicableregulations) vary depending on the type of inorganic chemical manufacturingprocess. The large number of different industrial processes used in theinorganics industry could not all be covered in this notebook. As a result,most sections of this notebook describe the entire inorganic chemical industryas a whole. These sections are usually augmented with information specific
Sector Notebook Project Inorganic Chemicals
September 1995 SIC 2814
to the largest single industrial process within the industry: chlorine and causticsoda production (SIC 2812). Section III, Industrial Process Description,rather than attempting to describe every inorganic chemical manufacturingprocess, deals solely with the production of chlorine and caustic soda.
II.B. Characterization of the Inorganic Chemical Industry
II.B.1. Product Characterization
Inorganic Chemicals Industry
The inorganic chemical industry manufactures chemicals which are often ofa mineral origin, but not of a basic carbon molecular. Inorganic chemicals areused at some stage in the manufacture of a great variety of other products.The industry's products are used as basic chemicals for industrial processes(i.e., acids, alkalies, salts, oxidizing agents, industrial gases, and halogens);chemical products to be used in manufacturing products (i.e., pigments, drycolors, and alkali metals); and finished products for ultimate consumption(i.e., mineral fertilizers, glass, and construction materials). The largest use ofinorganic chemicals is as processing aids in the manufacture of chemical andnonchemical products. Consequently, inorganic chemicals often do notappear in the final products.3
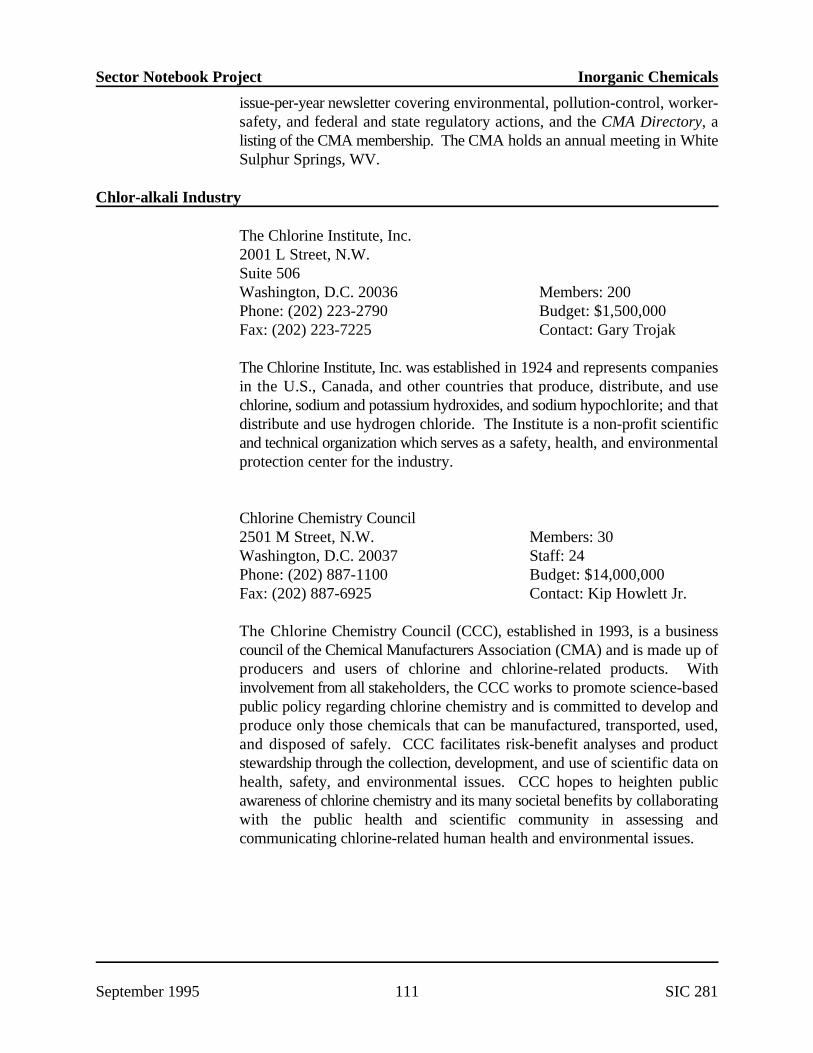
Chlor-alkali Sector
The chlor-alkali industry produces mainly chlorine, caustic soda (sodiumhydroxide), soda ash (sodium carbonate), sodium bicarbonate, potassiumhydroxide, and potassium carbonate. In 1992, chlorine and caustic sodaproduction accounted for about 80 percent of the chlor-alkali industry's valueof shipments and, in terms of weight, were the eighth and ninth largestchemicals produced in the U.S., respectively. Chlorine and caustic soda areco-products produced in about equal amounts primarily through theelectrolysis of salt (brine).4
The majority of domestic chlorine production (70 percent) is used in themanufacturing of organic chemicals including: vinyl chloride monomer,ethylene dichloride, glycerine, glycols, chlorinated solvents, and chlorinatedmethanes. Vinyl chloride, which is used in the production of polyvinylchloride (PVC) and many other organic chemicals, accounts for about 38percent of the total domestic chlorine production. The pulp and paperindustry consumes approximately 15 percent of U.S. chlorine production, andabout eight percent is used in the manufacturing of other inorganic chemicals.Other major uses are disinfection treatment of water, and the production of
Sector Notebook Project Inorganic Chemicals
Variation in facility counts occur across data sources due to many factors including, reporting and definitiona
differences. This notebook does not attempt to reconcile these differences, but rather reports the data as they aremaintained by each source.
September 1995 SIC 2815
hypochlorites. More than two-thirds of all chlorine is consumed in the samemanufacturing plant in the production of chemical intermediates.5
The largest users of caustic soda are the organic chemicals industry (30percent) and the inorganic chemicals industry (20 percent). The primary usesof caustic soda are in industrial processes, neutralization, and off-gasscrubbing; as a catalyst; and in the production of alumina, propylene oxide,polycarbonate resin, epoxies, synthetic fibers, soaps, detergents, rayon, andcellophane. The pulp and paper industry uses about 20 percent of totaldomestic caustic soda production for pulping wood chips, and otherprocesses. Caustic soda is also used in the production of soaps and cleaningproducts, and in the petroleum and natural gas extraction industry as a drillingfluid.6
II.B.2. Industry Size and Geographic Distribution
Inorganic Chemical Industry
The inorganic chemical industry is characterized by a relatively large numberof small facilities. The Bureau of the Census identified 665 companiesoperating 1,429 facilities within SIC 281 in 1992. Most of these facilitiesa
were classified under SIC 2819 -- industrial inorganic chemicals, notelsewhere classified -- which are typically smaller facilities producing specialtyinorganic chemicals. The Bureau of Census employment data for 1992(Exhibit 1) indicated that about 63 percent of inorganic chemical facilitiesemployed fewer than 20 people. A significant portion of inorganic chemicalsare produced and used within the same plant in the manufacturing of organicchemicals. The number of these facilities and the number of people employedin the inorganic chemical production portion of the industrial processes is notincluded in this data.
Sector Notebook Project Inorganic Chemicals
September 1995 SIC 2816
Exhibit 1: Inorganic Chemicals Industry Dominated by a Large Number of Small Facilities
Inorganic Chemicals Chlor-alkali
Employees Number Percentage Number of Percentageper Facility of Facilities of Facilities Facilities of Facilities
1-9 682 48% 12 24%
10-19 212 15% 6 12%
20-49 253 18% 3 6%
50-249 221 15% 23 44%
250-999 51 3% 6 12%
1,000->2,500 10 1% 1 2%
Total 1,429 100% 51 100%
Source: Bureau of the Census, 1992 Census of Manufacturers.
Inorganic chemical facilities are typically located near consumers and to alesser extent raw materials. The largest use of inorganic chemicals is inindustrial processes for the manufacture of chemicals and nonchemicalproducts; therefore, facilities are concentrated in the heavy industrial regionsalong the Gulf Coast, both east and west coasts, and the Great Lakes region.Since a large portion of inorganic chemicals produced are used by the organicchemicals manufacturing industry, the geographical distribution of inorganicfacilities is very similar to that of organic chemicals facilities (Exhibit 2).
u
u
u
uuuuu
uu
uuuuuuuuuuuuuuuuuuuuuuuuuuuuu
u
u
u
uuuuu
uuuuuuuuuuuuuuuuuuuuuuuuuuuuuuuuu
uu
uu
uuuuuu
uu
u
uu
u
uuuuuu
u
uuuuuu
uuu
u
u
uuuuuuuuuuuuuuuuuuuuuuuu
u
u
uu uuu
u
uu
uuuuuuuu
uuuuu
u
uu
uu
u
u
u
u
uuuu
uuu u
uuuu
u
u
uu
u
u
u
u
uu
u
u u
uuu
u
uu
uu
uuuuuuuuuuuuuuuu uuuuuuu u
u
uuuuu
u
uu
uu
u uuu
uu
uu
uu
uuu
u
u
uu
u uuuuuuu
uuuuuuuuu
u
u
uuuuuuuu
u
uuu
uuuuuuuuu
u
uuuuuuuuuu
u
uuuuuu
uu
uu
uuuu uuu
uu
uuuuu
u
uu
uuuuuuuuuu
uuu
uu uuuuu
uuuuuuuuuuuuu u
u uuuu
uuuuuuuuuuuuuuu uuuuuuuuuuuuu
u
uu
u
uuuuu
u
uu
uuuuuuuu uuuuu
uuuuu
uuu
u
uu
uuuuu u
u
uuu
u
uuuuuuuuuu uu
uuuu
uuuuuuuuuuuuuuuuuuuuuuuuuuuuuuuuuuu
uuu
u
uuu
u
uuuuu uuuu
u
uuuuuuuuuuuuuuuuuuuuuuuuuu
uu uuuuuuu
Miles
4003002001000
Sector Notebook Project Inorganic Chemicals
September 1995 SIC 2817
Exhibit 2: Inorganic Chemicals Facilities Distribution
(Source: U.S. EPA Toxic Release Inventory Database, 1993)
Chlor-alkali Sector
The alkali and chlorine industry, however, consists of a relatively smallnumber of medium to large facilities. The Bureau of the Census identified 34companies operating 51 facilities within the SIC 2812 in 1992. According toThe Chlorine Institute (an industry trade group), there were 25 companiesoperating 52 chlorine production plants in 1989. The Bureau of Censusemployment data for 1992 indicated that about 60 percent of those employedin the chlor-alkali industry worked at facilities with over 50 employees(Exhibit 1).7,8
The distribution of the chlor-alkali sector differs from that of the inorganicchemicals industry as a whole. Since chlorine and caustic soda are co-products produced in almost equal amounts, the distribution of the causticsoda manufacturing industry is essentially the same as the chlorinemanufacturing industry. Chlorine is difficult to store and transporteconomically; therefore, chlorine and caustic soda are produced near the
Sector Notebook Project Inorganic Chemicals
September 1995 SIC 2818
chlorine consumers which are primarily chemical manufacturers and pulpingoperations. Consequently, chlor-alkali facilities are concentrated near thechemical industries along the Gulf Coast, followed by the Great Lakes regionas shown in the table below. Other important areas are in the vicinity of thepulp mills of the Southeast and Northwest (Exhibit 3). In 1989, almost halfof the chlorine plants in the U.S. (72 percent of domestic chlorine production)were located along the Gulf Coast. Two states, Louisiana and Texas,accounted for two-thirds of the domestic chlorine production.9
Exhibit 3: Chlorine Capacity Located Primarily Along Gulf Coast,Southeast, Northwest, and Great Lakes Region
State Chlorine Plants per year) CapacityNumber of (thousand tons Operating
Annual Capacity Total U.S.Percent of
Louisiana 9 4,068 37%
Texas 5 3,314 30%
New York 4 652 6%
Alabama 5 592 5%
Washington 4 503 5%
West Virginia 2 392 3%
Georgia 3 246 2%
Tennessee 1 230 2%
Other States (14) 19 1,139 10%
U.S. Total 52 11,136 100%
Source: Kirk-Othmer Encyclopedia of Chemical Technology, 4th ed. Vol. 1, 1993.
Sector Notebook Project Inorganic Chemicals
September 1995 SIC 2819
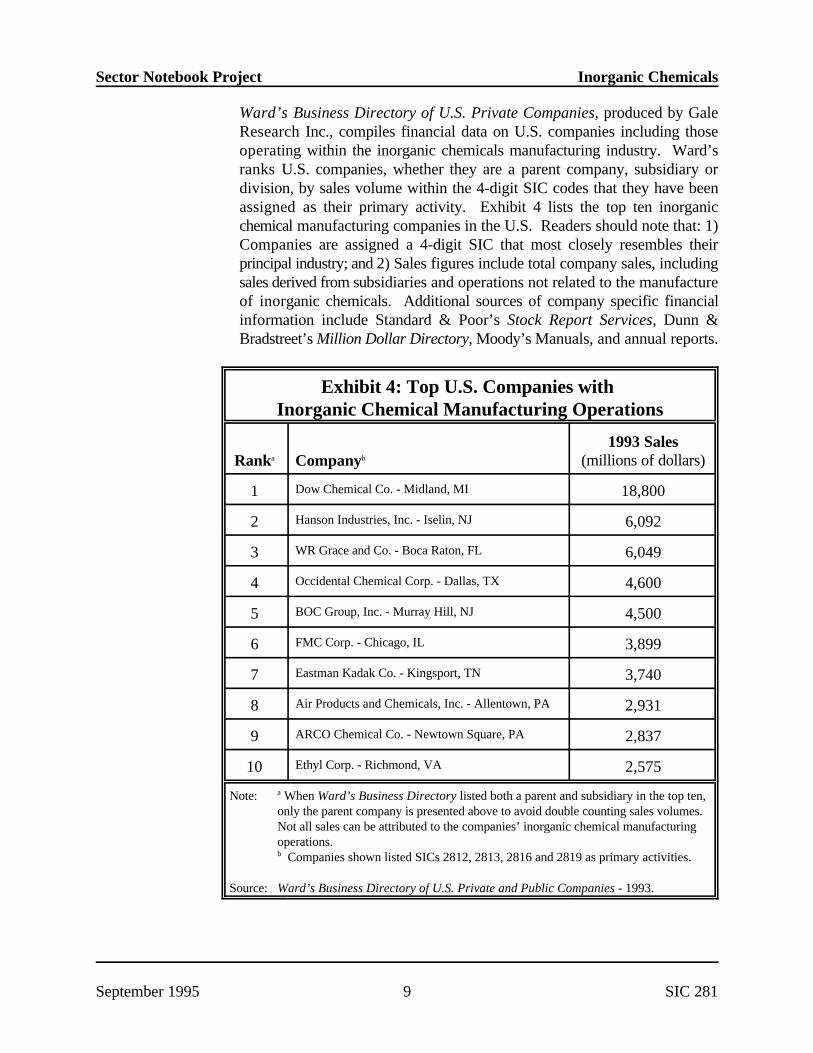
Ward’s Business Directory of U.S. Private Companies, produced by GaleResearch Inc., compiles financial data on U.S. companies including thoseoperating within the inorganic chemicals manufacturing industry. Ward’sranks U.S. companies, whether they are a parent company, subsidiary ordivision, by sales volume within the 4-digit SIC codes that they have beenassigned as their primary activity. Exhibit 4 lists the top ten inorganicchemical manufacturing companies in the U.S. Readers should note that: 1)Companies are assigned a 4-digit SIC that most closely resembles theirprincipal industry; and 2) Sales figures include total company sales, includingsales derived from subsidiaries and operations not related to the manufactureof inorganic chemicals. Additional sources of company specific financialinformation include Standard & Poor’s Stock Report Services, Dunn &Bradstreet’s Million Dollar Directory, Moody’s Manuals, and annual reports.
Exhibit 4: Top U.S. Companies with Inorganic Chemical Manufacturing Operations
Rank Companya b
1993 Sales(millions of dollars)
1 18,800Dow Chemical Co. - Midland, MI
2 6,092Hanson Industries, Inc. - Iselin, NJ
3 6,049WR Grace and Co. - Boca Raton, FL
4 4,600Occidental Chemical Corp. - Dallas, TX
5 4,500BOC Group, Inc. - Murray Hill, NJ
6 3,899FMC Corp. - Chicago, IL
7 3,740Eastman Kadak Co. - Kingsport, TN
8 2,931Air Products and Chemicals, Inc. - Allentown, PA
9 2,837ARCO Chemical Co. - Newtown Square, PA
10 2,575Ethyl Corp. - Richmond, VA
Note: When Ward’s Business Directory listed both a parent and subsidiary in the top ten,a
only the parent company is presented above to avoid double counting sales volumes. Not all sales can be attributed to the companies’ inorganic chemical manufacturingoperations. Companies shown listed SICs 2812, 2813, 2816 and 2819 as primary activities.b
Source: Ward’s Business Directory of U.S. Private and Public Companies - 1993.
Sector Notebook Project Inorganic Chemicals
September 1995 SIC 28110
II.B.3. Economic Trends
Inorganic Chemicals Industry
The Bureau of the Census estimated that there were 1,429 facilities in theinorganic chemical industry in 1992. The industry employed 103,000 peopleand had a total value of shipments of $27.4 billion. The total value ofshipments for the inorganic chemicals industry increased about one percentper year between 1992 and 1994. These values do not include inorganicchemicals manufactured for captive use within a facility nor the value of othernon-industrial inorganic chemical products manufactured by the same facility.It does, however, include intra-company transfers which are significant in thisindustry. The inorganic chemical industry's growth rate is expected tocontinue to increase with the growth of the economy. The U.S. is a netexporter of inorganic chemicals with most exports shipped to the EuropeanCommunity (EC) followed by Canada and Mexico. This positive tradebalance increased significantly in 1993 to $1.7 billion and is expected tocontinue as the European economy improves. By comparison, the 1992Census of Manufactures for Industrial Organic Chemicals reports a 1992value of shipments for organic chemicals of $64.5 billion and a totalemployment of 125,100 people. The 1992 value of shipments for the entirechemical industry (SIC 28) totaled $292.3 billion with an employment of850,000 people.10
Because inorganic chemicals are used in the manufacturing of many products,the industry tends to grow at the same rate as overall industrial production.In the late 1980s, the industry experienced high growth rates and, in the early1990s, the industry saw little real growth in output, as a reflection of the U.S.economy's recession. The industry has historically had low profit marginswhich, in recent years, have decreased further with increasing pollutionabatement costs. 11
Chlor-alkali Sector
The Bureau of the Census data for 1992 shows that there were 51 facilitieswithin the inorganic chemicals industry that manufactured alkalies andchlorine. These chlor-alkali facilities employed 8,000 people and had a totalvalue of shipments of $2.8 billion. This was an increase of 1.7 percent from1991. The chlor-alkali industry as a whole is expected to grow at its past rateof 1.5 times gross domestic product (GDP) growth through the 1990s.Because chlorine and caustic soda are electrolysis co-products, the productionof one product can depend on the demand of the other product. The marketpull has switched several times between caustic soda and chlorine in the pastfew decades. Presently, chlorine demand is controlling production;
Sector Notebook Project Inorganic Chemicals
September 1995 SIC 28111
consequently, there is a current excess availability of caustic soda in the U.S.This excess material is typically exported to fill a significant demand outsidethe U.S. The consumption of caustic soda is growing faster than theconsumption of chlorine, however, and domestic caustic soda demand isexpected to control production in the coming years.12
After reaching record high levels in the late 1970s, chlorine productiondeclined in the early 1980s due in part to the economic recession between1980 and 1982. Chlorine production increased slowly through the 1980s and,as of 1992, had not reached the record high levels and growth rates of the1970s. This is due in part to the relative maturity of the chlorine usageindustries and more recent environmental pressures aimed at curtailingchlorine use. Regulatory restrictions on the production or disposal of someproducts which require large amounts of chlorine to manufacture (i.e.,chlorofluorocarbons, PVC, and chlorinated solvents) have adversely affectedthe market. Chlorine's commercial appeal has been further reduced byinitiatives such as the International Joint Commission of Great Lakes WaterQuality (a Canada-U.S. environmental oversight group) and a number ofenvironmental groups which call for a gradual phaseout or an immediate banof chlorine and chlorinated compounds as industrial feedstocks.13
The production of caustic soda is very dependent on the short term and longterm chlorine demand and production because chlorine cannot be storedeconomically. Increased demand for chlorine must be met immediately byincreased chlorine production via electrolysis of brine and, consequently,caustic soda production. Domestic and export demand for caustic soda wasvery strong in the 1980s with the pick up of the world economy and anincrease in pulp and paper production. In the late 1980s, there was aworldwide shortage of caustic soda due to increased demand and lower U.S.chlorine production. The demand for caustic soda is expected to continue togrow in the coming years; however, there are a number of uncertainties thatmay limit the growth rate. Some industries have begun switching from causticsoda to soda ash where possible to avoid caustic soda shortages. Soda ash,which is extremely plentiful in the U.S., is obtained almost entirely fromnatural sources of trona ore. Demand for caustic soda may also decrease aspulp mills increase their reclamation of caustic soda from spent pulpingliquor.14
Sector Notebook Project Inorganic Chemicals
September 1995 SIC 28113
III. INDUSTRIAL PROCESS DESCRIPTION
This section describes the major industrial processes within the inorganicchemical industry, including the materials and equipment used, and theprocesses employed. The section is designed for those interested in gaininga general understanding of the industry, and for those interested in the inter-relationship between the industrial process and the topics described insubsequent sections of this profile -- pollutant outputs, pollution preventionopportunities, and Federal regulations. This section does not attempt toreplicate published engineering information that is available for this industry.Refer to Section IX for a list of reference documents that are available.
This section specifically contains a description of commonly used productionprocesses, associated raw materials, the byproducts produced or released, andthe materials either recycled or transferred off-site. This discussion, coupledwith schematic drawings of the identified processes, provide a concisedescription of where wastes may be produced in the process. This sectionalso describes the potential fate (via air, water, and soil pathways) of thesewaste products.
III.A. Industrial Processes in the Inorganic Chemical Industry
Chlorine and caustic soda are co-products of electrolysis of saturated aqueoussolutions of sodium chloride, NaCl (salt water or brine). In addition,relatively small amounts (by weight) of hydrogen gas are produced in theprocess. The overall chemical reaction is as follows:
2 NaCl + 2 H O v 2 NaOH + Cl + H2 2 2
Energy, in the form of direct current (d-c) electricity, is supplied to drive thereaction. The amount of electrical energy required depends on the design ofthe electrolytic cell, the voltage used, and the concentration of brine used.For each ton of chlorine produced, 1.1 tons of sodium hydroxide and 28kilograms of hydrogen are produced.
Three types of electrolysis processes are used for the manufacture of chlorine,caustic soda, and hydrogen from brine:
C Mercury Cell ProcessC Diaphragm Cell ProcessC Membrane Cell Process
Virtually all chlorine produced in the U.S. is manufactured by one of thesethree electrolysis processes. Each electrolytic cell consists of an anode and
Sector Notebook Project Inorganic Chemicals
September 1995 SIC 28114
cathode in contact with the brine solution. Exhibit 5 shows the basicelements, inputs and outputs of each type of electrolytic cell. Thedistinguishing feature of each cell type is the method employed to separateand prevent the mixing of the chlorine gas and sodium hydroxide.Consequently, each process produces a different purity of chlorine gas and adifferent concentration of caustic soda. Exhibit 6 is a summary of the majordifferences between each cell type. In 1988, diaphragm cells accounted for76 percent of all domestic chlorine production, followed by mercury cells with17 percent, and membrane cells with five percent. The industry is movingaway from mercury and diaphragm cells and is moving towards the use ofmembrane cells. Membrane cells are a relatively recent development whichhave fewer adverse effects on the environment and produce a higher qualityproduct at a lower cost than the other methods.15,16
Sector Notebook Project Inorganic Chemicals
September 1995 SIC 28115
Exhibit 5: Chlorine Electrolysis Cells
Sector Notebook Project Inorganic Chemicals
September 1995 SIC 28116
(Source: Kirk-Othmer Encyclopedia of Chemical Technology, 4th Edition, 1994.)
Exhibit 6: Main Characteristics of the Different Electrolysis Processes
Cathode Mercury flowing Steel or steel coated Steel or nickel with aover steel with activated nickel nickel based catalytic
coating
Diaphragm/ None Asbestos or polymer Ion-exchangeMembrane modified asbestos membrane
Anode Titanium with RuO Titanium with RuO Titanium with RuO2
or TiO coating or TiO coating or TiO coating2
(DSA anode) (DSA anode) (DSA anode)
2
2
2
2
Cathode Sodium amalgam 10-12% NaOH with 30-33% NaOH andProduct 15-17% NaCl and H
H2
2
Decomposer/ 50% NaOH and H 50% NaOH with 1% 50% NaOH withEvaporator from decomposer NaCl and solid salt very little saltProduct from evaporator
2
Electricity 3,300 kWh per ton 2,750 kWh per ton 2,100-2,450 kWh perConsumption Cl Cl ton NaOH2 2
Source: Kirk-Othmer Encyclopedia of Chemical Technology, 4th Edition, 1994.
III.A.1. Mercury Cell
The mercury cell process consists of slightly inclined steel troughs throughwhich a thin layer of mercury (about three mm) flows over the bottom(Exhibit 7). The cells are operated at 75 to 85 EC and atmospheric pressure.The mercury layer serves as the cathode for the process and the saturatedbrine solution (25.5 percent NaCl by weight) flows through the troughs abovethe mercury. The anodes are usually incorporated into the cell covers and aresuspended horizontally in the brine solution. The height of the anodes withinthe brine is adjusted to the optimal height either manually or through anautomatic computer controlled system.17
Electrolytic cell anodes were made of graphite until the late 1960s whenanodes of titanium coated with ruthenium oxide (RuO2) and titanium oxide(TiO2) were developed. The RuO2 and TiO2 anodes, termed DSA(dimensionally stable) anodes, are more stable than the graphite anodes (i.e.,they do not need to be replaced as frequently) and are more energy efficient.18
Sector Notebook Project Inorganic Chemicals
September 1995 SIC 28117
Exhibit 7: Mercury Electrolysis Cell and Flow Diagram
(Source: Industrial Inorganic Chemistry, Büchner, et al., 1989.)
The chlorine gas is produced at the anodes where it moves upward throughgas extraction slits in the cell covers. Sodium ions are absorbed by themercury layer and the resulting sodium and mercury mixture, called theamalgam, is processed in "decomposer" cells to generate sodium hydroxideand reusable mercury. The amalgam entering the decomposer cell has asodium concentration of approximately 0.2 to 0.5 percent by weight. Thedecomposer consists of a short-circuited electrical cell where graphite servesas the anode and the amalgam serves as the cathode. The amalgam and waterflowing through the cell come into direct contact with the graphite. Thehydrolysis of the water on the graphite in the presence of the amalgam resultsin a strong exothermic reaction generating mercury to be reused in theelectrolytic cell, a 50 percent caustic soda solution, and hydrogen gas.Mercury cells are operated to maintain a 21 to 22 percent by weight NaClconcentration in the depleted brine leaving the cell. The dissolved chlorine isremoved from the depleted brine solution, which is then resaturated with solidsalt and purified for further use. Some facilities purge small amounts of brinesolution and use new brine as make-up in order to prevent the build up ofsulfate impurities in the brine.19,20
Sector Notebook Project Inorganic Chemicals
September 1995 SIC 28118
The mercury process has the advantage over diaphragm and membrane cellsin that it produces a pure chlorine gas with no oxygen, and a pure 50 percentcaustic soda solution without having to further concentrate a more dilutesolution. However, mercury cells operate at a higher voltage than diaphragmand membrane cells and, therefore, use more energy. The process alsorequires a very pure brine solution with little or no metal contaminants.Furthermore, elaborate precautions must be taken to avoid releases ofmercury to the environment.
III.A.2. Diaphragm Cell
In the diaphragm cell process, multiple cells consisting of DSA anode platesand cathodes are mounted vertically and parallel to each other (Exhibit 8).Each cell consists of one anode and cathode pair. The cathodes are typicallyflat hollow steel mesh or perforated steel structures covered with asbestosfibers, which serve as the diaphragm. The asbestos fiber structure of thediaphragm prevents the mixing of hydrogen and chlorine by allowing liquid topass through to the cathode, but not fine bubbles of chlorine gas formed at theanodes. The diaphragm also hinders the back-diffusion to the anode ofhydroxide (OH ) ions formed at the cathode. The cells are operated at 90 to-
95 EC and atmospheric pressure. Brine flows continuously into the anodechamber and, subsequently, through the diaphragm to the cathode. As in themercury cell process, chlorine gas is formed at the anodes; however, in thediaphragm process, caustic soda solution and hydrogen gas are formeddirectly at the cathode. The chlorine gas is drawn off from above the anodesfor further processing. The hydrogen gas is drawn off separately from thecathode chambers.21,22
Two basic types of diaphragm cells are in use today. The first, monopolarcells, have an electrode arrangement in which the anodes and cathodes arearranged in parallel. As a result of this configuration, all cells have the samevoltage of about three to four volts; up to 200 cells can be constructed in onecircuit. The second basic type of diaphragm cell is the bipolar cell, in whichthe anode of one cell is directly connected to the cathode of the next cell unit.This type of arrangement minimizes voltage loss between cells; however, sincethe total voltage across the entire set of cells is the sum of the individual cellvoltages, the number of cells per unit is limited. To compensate for thereduced anode and cathode surface area in the bipolar configuration, bipolarunits tend to be much larger than monopolar units. Production of chlorineand caustic soda by the diaphragm process is split approximately equallybetween monopolar and bipolar systems.23
Sector Notebook Project Inorganic Chemicals
September 1995 SIC 28119
Exhibit 8: Typical Diaphragm Electrolysis Cell and Flow Diagram
(Source: Industrial Inorganic Chemistry, Büchner, et al., 1989)
Diaphragm cells are operated such that about 50 percent of the input NaCl isdecomposed resulting in an effluent mixture of brine and caustic soda solutioncontaining eight to 12 percent NaOH and 12 to 18 percent NaCl by weight.This solution is evaporated to 50 percent NaOH by weight at which point allof the salt, except a residual 1.0 to 1.5 percent by weight, precipitates out.The salt generated is very pure and is typically used to make more brine.Because the brine and caustic soda solution are mixed in a single effluent, afresh brine solution (no recycled brine) is constantly entering the system. Thediaphragm cell process does not, therefore, require a brine purge to preventsulfate build up, or treatment to remove entrained chlorine gas, as in themercury cell process.24
Diaphragms are constructed of asbestos because of its chemical and physicalstability and because it is a relatively inexpensive and abundant material.Beginning in the early 1970s, asbestos diaphragms began to be replaced bydiaphragms containing 75 percent asbestos and 25 percent fibrous
Sector Notebook Project Inorganic Chemicals
September 1995 SIC 28120
polytetrafluoroethylene (PTFE). These diaphragms, trade named ModifiedDiaphragms, are more stable and operate more efficiently than the fullyasbestos diaphragms. Modified Diaphragms are the most commondiaphragms currently in use.25
Diaphragm cells have the advantage of operating at a lower voltage thanmercury cells and, therefore, use less electricity. In addition, the brineentering a diaphragm cell can be less pure than that required by mercury andmembrane cells. The chlorine gas produced by the diaphragm process,however, is not pure and must be processed to remove oxygen, water, salt,and sodium hydroxide. Another disadvantage of the process is that thecaustic soda produced contains chlorides and requires evaporation to bring itto a usable concentration.26
III.A.3. Membrane Cell
In the membrane cell process, the anode and cathode are separated by awater-impermeable ion-conducting membrane (Exhibit 9). Brine solutionflows through the anode compartment where chlorine gas is generated. Thesodium ions migrate through the membrane to the cathode compartmentwhich contains flowing caustic soda solution. Water is hydrolyzed at thecathode, releasing hydrogen gas and hydroxide (OH ) ions. The sodium and-
hydroxide ions combine to produce caustic soda which is typically brought toa concentration of 32 to 35 percent by recirculating the solution before it isdischarged from the cell. The membrane prevents the migration of chlorideions from the anode compartment to the cathode compartment; therefore, thecaustic soda solution produced does not contain salt as in the diaphragm cellprocess. Depleted brine is discharged from the anode compartment andresaturated with salt.27
The cathode material used in membrane cells is either stainless steel or nickel.The cathodes are often coated with a catalyst that is more stable than thesubstrate and that increases surface area and electrical conductivity. Coatingmaterials include Ni-S, Ni-Al, and Ni-NiO mixtures, as well as mixtures ofnickel and platinum group metals. Anodes are typically of the DSA type.28
The most critical components of the membrane cells are the membranesthemselves. The membranes must remain stable while being exposed tochlorine on one side and a strong caustic solution on the other. Furthermore,the membranes must have low electrical resistance, and allow the transport ofsodium ions and not chloride ions and reinforcing fabric, and aperfluorocarboxlate polymer all bonded together.
Sector Notebook Project Inorganic Chemicals
September 1995 SIC 28121
Exhibit 9: Typical Membrane Electrolysis Cell
(Source: Industrial Inorganic Chemistry, Büchner, et al., 1989.)
Membrane cells can be configured either as monopolar or bipolar. As in thecase of the diaphragm cell process, the bipolar cells have less voltage lossbetween the cells than the monopolar cells; however, the number of cellsconnected together in the same circuit is limited.29
Membrane cells have the advantages of producing a very pure caustic sodasolution and of using less electricity than the mercury and diaphragmprocesses. In addition, the membrane process does not use highly toxicmaterials such as mercury and asbestos. Disadvantages of the membraneprocess are that the chlorine gas produced must be processed to removeoxygen and water vapor, and the caustic soda produced must be evaporatedto increase the concentration. Furthermore, the brine entering a membranecell must be of a very high purity, which often requires costly additionalpurification steps prior to electrolysis.30
Sector Notebook Project Inorganic Chemicals
September 1995 SIC 28122
III.A.4. Auxiliary Processes
Brine Purification
Approximately 70 percent of the salt used in chlorine gas production isextracted from natural salt deposits; the remainder is evaporated fromseawater. Salt from natural deposits is either mined in solid form or is leachedfrom the subsurface. Leaching involves the injection of freshwater intosubterranean salt deposits and pumping out brine solution. Brine productionfrom seawater typically occurs by solar evaporation in a series of ponds toconcentrate the seawater, precipitate out impurities, and precipitate out solidsodium chloride. Regardless of the method used to obtain the salt, it willcontain impurities that must be removed before being used in the electrolysisprocess. Impurities primarily consist of calcium, magnesium, barium, iron,aluminum, sulfates, and trace metals. Impurities can significantly reduce theefficiency of the electrolytic cells, by precipitating out and subsequentlyblocking a diaphragm or damaging a membrane depending on the processused. Certain trace metals, such as vanadium, reduce the efficiency ofmercury cells and cause the production of potentially dangerous amounts ofhydrogen gas. Removal of impurities accounts for a significant portion of theoverall costs of chlor-alkali production, especially in the membrane process.31
In addition to the dissolved natural impurities, chlorine must be removed fromthe recycled brine solutions used in mercury and membrane processes.Dissolved chlorine gas entering the anode chamber in the brine solution willreact with hydroxide ions formed at the cathode to form chlorate whichreduces product yields. In addition, chlorine gas in the brine solution willcause corrosion of pipes, pumps, and containers during further processing ofthe brine. In a typical chlorine plant, HCl is added to the brine solutionleaving the cells to liberate the chlorine gas. A vacuum is applied to thesolution to collect the chlorine gas for further treatment. To further reducethe chlorine levels, sodium sulfite or another reducing agent is added toremove the final traces of chlorine. Dechlorinated brine is then resaturatedwith solid salt before further treating to remove impurities.32
Depending on the amount of impurities in the salt and the electrolysis processutilized, different purification steps will be required. Brine solution is typicallyheated before treatment to improve reaction times and precipitation ofimpurities. Calcium carbonate impurities are precipitated out throughtreatment with sodium carbonate; magnesium, iron, and aluminum areprecipitated out through treatment with sodium hydroxide; and sulfates areprecipitated out through the addition of calcium chloride or barium carbonate.Most trace metals are also precipitated out through these processes.Flocculants are sometimes added to the clarifying equipment to improve
Sector Notebook Project Inorganic Chemicals
September 1995 SIC 28123
settling. The sludges generated in this process are washed to recoverentrained sodium chloride. Following the clarification steps, the brine solutionis typically passed through sand filters followed by polishing filters. The brinepassing through these steps will contain less than four parts per million (ppm)calcium and 0.5 ppm magnesium which is sufficient purification for thediaphragm and mercury cell processes. For brine to be used in the membraneprocess, however, requires a combined calcium and magnesium content of lessthan 20 parts per billion (ppb). Brine for the membrane process is, therefore,passed through ion exchange columns to further remove impurities.33
Chlorine Processing
The chlorine gas produced by electrolytic processes is saturated with watervapor. Chlorine gas from the diaphragm process also contains liquid dropletsof sodium hydroxide and salt solution. The first steps in processing thechlorine to a usable product consists of cooling the chlorine to less than tendegrees centigrade and then passing it through demisters or electrostaticprecipitators to remove water and solids. Next the chlorine is passed throughpacked towers with concentrated sulfuric acid flowing countercurrently. Thewater vapor is absorbed by the sulfuric acid and the dry chlorine gas is thenpassed through demisters to remove sulfuric acid mist. If the chlorine is to beliquefied, liquid chlorine is then added to the gas to further purify the chlorineand to prechill it prior to compression. Prechilling is primarily carried out toprevent the temperature from reaching the chlorine-steel ignition point duringcompression.34
Chlorine gas is either used in gaseous form within the facility, transferred tocustomers via pipeline, or liquefied for storage or transport. Liquid chlorineis of a higher purity than gaseous chlorine and is either used within the facilityor is transferred via rail tank car, tank truck, or tank barge. The demand forliquid chlorine has increased in recent years and, in 1987, accounted for about81 percent of chlorine produced in the U.S.35
Chlorine liquefaction processes typically liquefy only about 90-95 percent ofthe chlorine. This gas and the chlorine gas left inside tank truck tanks, rail cartanks, or barges after removal of liquid chlorine is impure and must berecovered in a chlorine recovery unit. The gas is compressed and cooledusing cold water followed by Freon. The chilled gas is fed up through apacked column in which carbon tetrachloride flows downward absorbing thechlorine. The chlorine-rich carbon tetrachloride is fed to a chlorine stripperin which the chlorine and carbon tetrachloride separate as they are heated.The chlorine gas is cooled and scrubbed of carbon tetrachloride using liquidchlorine and the resulting pure chlorine is sent to the chlorine liquefactionsystem.36
Caustic Soda Processing
Sector Notebook Project Inorganic Chemicals
September 1995 SIC 28124
Caustic soda solution generated from chlor-alkali processes is typicallyprocessed to remove impurities and to concentrate it to either a 50 percent or73 percent water-based solution or to anhydrous caustic soda. The causticsoda from the mercury and membrane processes is relatively pure. Productfrom the mercury process requires only filtration to remove mercury droplets.The evaporators used to concentrate the caustic soda solution in thediaphragm process are typically multi-stage forced circulation evaporators.The evaporators have salt settling systems to remove precipitated salt.Sodium borohydride is often added to reduce corrosion of the equipment.Evaporators for the membrane process are usually much simpler than thosefor the diaphragm process because the salt concentration in the membrane cellcaustic solution is very low.37
Hydrogen Processing
The hydrogen produced in all of the electrolytic processes contains smallamounts of water vapor, sodium hydroxide, and salt which is removedthrough cooling. The hydrogen produced during the mercury cell process alsocontains small amounts of mercury which must be removed by cooling thehydrogen gas to condense the mercury and treating with activated carbon.38
III.B. Raw Material Inputs and Pollution Outputs in the Production Line
Inputs and pollutant outputs of the chlor-alkali industry are relatively smallboth in number and volume in comparison to the chemical manufacturingindustry as a whole. The inputs are primarily salt and water as feedstocks;acids and chemical precipitants used to remove impurities in the input brineor output chlorine and caustic soda; and freon used for liquefying andpurifying the chlorine gas produced. The major pollutant outputs from allthree electrolytic processes are chlorine gas emissions (both fugitive and pointsource); spent acids; freon (both fugitive and point source); impuritiesremoved from the input salt or brine; and pollutants originating fromelectrolytic cell materials and other system parts.
Pollutant outputs have decreased in recent years as the industry moves awayfrom the mercury and diaphragm cell processes to the more efficient (in termsof material and energy inputs and outputs) membrane cell process. Inaddition, improved cell part materials have been developed, such as DSAanodes and Modified Diaphragms, which are more stable and create lessundesirable byproducts.
Inputs and pollutant outputs from the auxiliary processes such as brinepurification, chlorine processing, caustic soda processing, and hydrogenprocessing are described in Section III.B.4.
Sector Notebook Project Inorganic Chemicals
September 1995 SIC 28125
III.B.1. Mercury Cell
Wastewater streams from mercury cell facilities arise from the chlorine dryingprocess, brine purge, and miscellaneous sources. Small amounts of mercuryare found in the brine purge and miscellaneous sources which include floorsumps and cell wash water. Before treatment, mercury concentrations(principally in the form of mercuric chloride, HgCl ) typically range from 04
2-
to 20 ppm. Thereby segregating most mercury bearing wastewater streamsfrom non-mercury bearing wastewater streams. Prior to treatment, sodiumhydrosulfide is used to precipitate mercuric sulfide. The mercuric sulfide isremoved through filtration before the water is discharged.39
Air emissions consist of mercury vapor and chlorine gas released in relativelysmall amounts as fugitive emissions from the cells; and in the tail gases of thechlorine processing, caustic soda processing, and hydrogen processing.Process tail gases are wet scrubbed with caustic soda or soda ash solutions toremove chlorine and mercury vapor. Residual chlorine emissions in tail gasesafter treatment are less than one kg per 1,000 kg of chlorine produced andmercury emissions are negligible. The tail gas scrubber water is typicallyreused as brine make-up water.40
Solid wastes containing mercury include: solids generated during brinepurification; spent graphite from decomposer cells; spent caustic filtrationcartridges from the filtration of caustic soda solution; spilled mercury fromfacility sumps; and mercury cell "butters," which are semisolid amalgams ofmercury with barium or iron formed when an excess of barium is used duringsalt purification. Most mercury bearing solid wastes are shipped off-site tooutside reclaimers who recover the mercury. The remaining wastes aredisposed of in secure landfills using either chemical or physical methods torecover maximum feasible amount of mercury.41
III.B.2. Diaphragm Cell
Wastewater streams from the diaphragm cell process originate from thebarometric condenser during caustic soda evaporation, chlorine drying, andfrom purification of salt recovered from the evaporators. These wastewatersand their treatment are described below in Section III.B.4. The use of leadand graphite anodes and asbestos diaphragms generates lead, asbestos, andchlorinated hydrocarbons in the caustic soda and chlorine processing wastestreams. Lead salts and chlorinated hydrocarbons are generated fromcorrosion of the anodes, and asbestos particles are formed by the degradationof the diaphragm with use. Over the past twenty years, all but a fewdiaphragm cell facilities have switched from the use of lead and graphiteanodes with asbestos diaphragms to DSA anodes and Modified Diaphragmswhich resist corrosion and degradation. The lead, asbestos, and chlorinated
Sector Notebook Project Inorganic Chemicals
September 1995 SIC 28126
hydrocarbon contaminants are, therefore, no longer discharged in significantamounts from most diaphragm cell chlor-alkali facilities. Those facilities thatdischarged caustic processing wastewater streams to on-site lagoons may,however, still have significant levels of these contaminants on-site.42
Chlorine is released in relatively small amounts as fugitive emissions from thecells and in the process tail gases. Process tail gases are wet scrubbed withsoda ash or caustic soda solutions to remove chlorine. Residual chlorineemissions in tail gases after treatment are negligible. The spent causticsolution is neutralized prior to discharge.43
Solid wastes generated in the diaphragm process consist primarily of solidsgenerated during brine purification and scrapped cell parts including, cellcovers, piping and used diaphragms. Discarded cell parts are either landfilledon-site, as is typically the case for spent diaphragms, or shipped off-site fordisposal. Used cathodes and DSA anodes are shipped off-site for recovery oftheir titanium content.44
III.B.3. Membrane Cell
Wastewater from the diaphragm cell process originates from the barometriccondenser during caustic soda evaporation, chlorine drying, and wash waterfrom the ion exchange resin used to purify the brine solution. The ionexchange wash water consists of dilute hydrochloric acid with small amountsof dissolved calcium, magnesium, and aluminum chloride. The wastewater iscombined with the other process wastewaters and treated by neutralization.45
Chlorine is released in relatively small amounts as fugitive emissions from thecells and in the process tail gases. Process tail gases are wet scrubbed withsoda ash or caustic soda solutions to remove chlorine. Residual chlorineemissions in tail gases after treatment are negligible. The spent causticsolution is neutralized prior to discharge.46
Solid waste generated in the diaphragm process consists primarily of solidsgenerated during brine purification and used cell parts which includemembranes, cathodes and DSA anodes. The used membranes are typicallyreturned to the supplier and the used cathodes and DSA anodes are shippedoff-site for recovery of their titanium content.47
III.B.4. Auxiliary Processes
Brine Purification
Brine solutions are typically treated with a number of chemicals to removeimpurities prior to input to the electrolytic cells. In the case of mercury and
Sector Notebook Project Inorganic Chemicals
September 1995 SIC 28127
membrane cell systems, the brine is first acidified with HCl to removedissolved chlorine. Next, sodium hydroxide and sodium carbonate are addedto precipitate calcium and magnesium ions as calcium carbonate andmagnesium hydroxide. Barium carbonate is then added to remove sulfateswhich precipitate out as barium sulfate. The precipitants are removed fromthe brine solution by settling and filtration. Pollutant outputs from thisprocess include fugitive chlorine emissions and brine muds.48
Brine muds are one of the largest waste streams of the chlor-alkali industry.On average, about 30 kilograms (kg) of brine mud are generated for every1,000 kg of chlorine produced. The volume of mud will vary, however,depending on the purity of the salt used. Some facilities use pre-purified (i.e.,chemical grade) evaporated salts which will produce only 0.7 to 6.0 kg ofbrine mud per 1,000 kg of chlorine produced. Brine mud typically containsmagnesium hydroxide, calcium carbonate, and, in most cases, barium sulfate.Mercury cell brine muds usually contain mercury either in the elemental formor as the complex ion, mercuric chloride (HgCl ). Mercury- containing brine4
2-
muds are typically disposed of in a RCRA Subtitle C landfill after treatmentwith sodium sulfide which converts the mercury to an insoluble sulfide.49
Brine muds are usually segregated from other process wastes and stored inlagoons on-site. When the lagoons become filled, the brine mud is eitherdredged and landfilled off-site, or drained and covered over. Some plants thatuse brine solution leached from subterranean deposits inject brine muds intothe salt cavities that are no longer being used.50
Chlorine Processing
The chlorine gas recovered from electrolytic cells is cooled to remove watervapor. The condensed water is usually recycled as brine make-up althoughsome facilities combine this waste stream with other waterborne wastestreams prior to treatment. The remaining water vapor is removed byscrubbing the chlorine gas with concentrated sulfuric acid. The chlorine gasis then compressed and cooled to form liquid chlorine. Between six kg and35 kg of 79 percent sulfuric acid wastewater is generated per 1,000 kg ofchlorine produced. The majority of the spent sulfuric acid waste is shippedoff-site for refortification to concentrated sulfuric acid or for use in otherprocesses. The remainder is used to control effluent pH and/or is dischargedto water or land disposed.51
The process of purifying and liquefying impure chlorine gas involves theabsorption of the chlorine in a stream of carbon tetrachloride. The chlorineis subsequently removed in a stripping process in which the carbontetrachloride is either recovered and reused, or is vented to the atmosphere.52
Sector Notebook Project Inorganic Chemicals
September 1995 SIC 28128
Caustic Soda Processing
Caustic soda solution generated from chlor-alkali processes is typicallyprocessed to remove impurities and, in the case of the diaphragm andmembrane processes, is concentrated to either a 50 percent or 73 percentwater-based solution or to anhydrous caustic soda. About five tons of watermust be evaporated per ton of 50 percent caustic soda solution produced.The water vapor from the evaporators is condensed in barometric condensersand, in the case of the diaphragm process, will primarily contain about 15percent caustic soda solution and high concentrations of salt. If sodiumsulfate is not removed during the brine purification process, salt recoveredfrom the evaporators is often recrystallized to avoid sulfate buildup in thebrine. If the salt is recrystallized, the wastewater from sodium hydroxideprocessing will also contain sodium sulfates. Significant levels of copper mayalso be present in the wastewater due to corrosion of pipes and otherequipment. Wastewater from the membrane process contains caustic sodasolution and virtually no salt or sodium sulfates.53
Caustic soda processing wastewater is typically neutralized with hydrochloricacid, lagooned, and then discharged directly to a receiving water or landdisposed. The caustic soda generated from the mercury process only requiresfiltration to remove mercury droplets which are typically recovered for reuse.
Hydrogen Processing
The hydrogen produced in all of the electrolytic processes contains smallamounts of water vapor, sodium hydroxide, and salt which is removedthrough cooling. Condensed salt water and sodium hydroxide solution iseither recycled as brine make-up or treated with other waterborne wastestreams. The hydrogen produced during the mercury cell process, however,also contains small amounts of mercury which must be removed prior toliquefaction. Most of the entrained mercury is extracted by cooling the gas.The condensed mercury is then returned to the electrolytic cells. Somefacilities further purify the hydrogen gas of mercury using activated carbontreatment. Spent activated carbon is typically shipped off-site as a hazardouswaste.54
III.C. Management of Chemicals In Wastestream
The Pollution Prevention Act of 1990 (PPA) requires facilities to reportinformation about the management of TRI chemicals in waste and effortsmade to eliminate or reduce those quantities. These data have been collectedannually in Section 8 of the TRI reporting Form R beginning with the 1991reporting year. The data summarized below cover the years 1992-1995 andis meant to provide a basic understanding of the quantities of waste handled
Sector Notebook Project Inorganic Chemicals
September 1995 SIC 28129
by the industry, the methods typically used to manage this waste, and recenttrends in these methods. TRI waste management data can be used to assesstrends in source reduction within individual industries and facilities, and forspecific TRI chemicals. This information could then be used as a tool inidentifying opportunities for pollution prevention compliance assistanceactivities.
From the yearly data presented below it is apparent that the portion of TRIwastes reported as recycled on-site has increased and the portions treated ormanaged through treatment on-site have decreased between 1992 and 1995(projected). While the quantities reported for 1992 and 1993 are estimates ofquantities already managed, the quantities reported for 1994 and 1995 areprojections only. The PPA requires these projections to encourage facilitiesto consider future waste generation and source reduction of those quantitiesas well as movement up the waste management hierarchy. Future-yearestimates are not commitments that facilities reporting under TRI are requiredto meet.
Exhibit 10 shows that the inorganic chemicals industry managed about 1.7trillion pounds of production-related waste (total quantity of TRI chemicalsin the waste from routine production operations) in 1993 (column B).Column C reveals that of this production-related waste, 15 percent was eithertransferred off-site or released to the environment. Column C is calculated bydividing the total TRI transfers and releases by the total quantity ofproduction-related waste. In other words, about 85 percent of the industry’sTRI wastes were managed on-site through recycling, energy recovery, ortreatment as shown in columns E, F and G, respectively. The majority ofwaste that is released or transferred off-site can be divided into portions thatare recycled off-site, recovered for energy off-site, or treated off-site as shownin columns H, I and J, respectively. The remaining portion of the productionrelated wastes (11 percent), shown in column D, is either released to theenvironment through direct discharges to air, land, water, and undergroundinjection, or it is disposed off-site.
Sector Notebook Project Inorganic Chemicals
September 1995 SIC 28130
Exhibit 10: Source Reduction and Recycling Activity for Inorganic Chemicals Industry (SIC281) as Reported within TRI
A B C DOn-Site Off-Site
Year (10 lbs.) Transferred Off-site
Quantity ofProduction- % Released
Related % Released andWaste and Disposed
6 a b
cE F G H I J
% % Energy % % % Energy %Recycled Recovery Treated Recycled Recovery Treated
1992 1,642 16% 12% 42% 0% 42% <1% <1% 3%
1993 1,712 15% 11% 45% 0% 40% <1% <1% 3%
1994 1,759 --- 11% 47% <1% 39% <1% <1% 3%
1995 1,732 --- 10% 48% 0% 40% <1% <1% 3%
Within this industry sector, non-production related waste is < 1% of production related wastes for 1993.a
Total TRI transfers and releases as reported in Section 5 and 6 of Form R as a percentage of production relatedb
wastes. Percentage of production related waste released to the environment and transferred off-site for disposal.c
Sector Notebook Project Inorganic Chemicals
September 1995 SIC 28131
IV. CHEMICAL RELEASE AND TRANSFER PROFILE
This section is designed to provide background information on the pollutantreleases that are reported by this industry. The best source of comparativepollutant release information is the Toxic Release Inventory System (TRI).Pursuant to the Emergency Planning and Community Right-to-Know Act,TRI includes self-reported facility release and transfer data for over 600 toxicchemicals. Facilities within SIC Codes 20-39 (manufacturing industries) thathave more than 10 employees, and that are above weight-based reportingthresholds are required to report TRI on-site releases and off-site transfers.TRI is not specific to the chemical industry. The information presented withinthe sector notebooks is derived from the most recently available (1993) TRIreporting year (which then included 316 chemicals), and focuses primarily onthe on-site releases reported by each sector. Because TRI requires consistentreporting regardless of sector, it is an excellent tool for drawing comparisonsacross industries.
Although this sector notebook does not present historical informationregarding TRI chemical releases, please note that in general, toxic chemicalreleases across all industries have been declining. In fact, according to the1993 Toxic Release Inventory Data Book, reported releases dropped by 42.7percent between 1988 and 1993. Although on-site releases have decreased,the total amount of reported toxic waste has not declined because the amountof toxic chemicals transferred off-site has increased. Transfers have increasedfrom 3.7 billion pounds in 1991 to 4.7 billion pounds in 1993. Bettermanagement practices have led to increases in off-site transfers of toxicchemicals for recycling. More detailed information can be obtained fromEPA's annual Toxics Release Inventory Public Data Release book (which isavailable through the EPCRA Hotline at 800-535-0202), or directly from theToxic Release Inventory System database (for user support call 202-260-1531).
Wherever possible, the sector notebooks present TRI data as the primaryindicator of chemical release within each industrial category. TRI dataprovide the type, amount and media receptor of each chemical released ortransferred. When other sources of pollutant release data have been obtained,these data have been included to augment the TRI information.
TRI Data Limitations
The reader should keep in mind the following limitations regarding TRI data.Within some sectors, the majority of facilities are not subject to TRI reportingbecause they are not considered manufacturing industries, or because they arebelow TRI reporting thresholds. Examples are the mining, dry cleaning,
Sector Notebook Project Inorganic Chemicals
September 1995 SIC 28132
printing, and transportation equipment cleaning sectors. For these sectors,release information from other sources has been included.
The reader should also be aware that TRI "pounds released" data presentedwithin the notebooks is not equivalent to a "risk" ranking for each industry.Weighting each pound of release equally does not factor in the relativetoxicity of each chemical that is released. The Agency is in the process ofdeveloping an approach to assign toxicological weightings to each chemicalreleased so that one can differentiate between pollutants with significantdifferences in toxicity. As a preliminary indicator of the environmental impactof the industry's most commonly released chemicals, the notebook brieflysummarizes the toxicological properties of the top chemicals (by weight)reported by each industry.
Definitions Associated With Section IV Data Tables
General Definitions
SIC Code -- is the Standard Industrial Classification (SIC) is a statisticalclassification standard used for all establishment-based Federal economicstatistics. The SIC codes facilitate comparisons between facility and industrydata.
TRI Facilities -- are manufacturing facilities that have 10 or more full-timeemployees and are above established chemical throughput thresholds.Manufacturing facilities are defined as facilities in Standard IndustrialClassification primary codes 20-39. Facilities must submit estimates for allchemicals that are on the EPA's defined list and are above throughputthresholds.
Data Table Column Heading Definitions
The following definitions are based upon standard definitions developed byEPA’s Toxic Release Inventory Program. The categories below represent thepossible pollutant destinations that can be reported.
RELEASES -- are an on-site discharge of a toxic chemical to theenvironment. This includes emissions to the air, discharges to bodies ofwater, releases at the facility to land, as well as contained disposal intounderground injection wells.
Releases to Air (Point and Fugitive Air Emissions) -- include all airemissions from industry activity. Point emission occur through confined airstreams as found in stacks, ducts, or pipes. Fugitive emissions include losses
Sector Notebook Project Inorganic Chemicals
September 1995 SIC 28133
from equipment leaks, or evaporative losses from impoundments, spills, orleaks.
Releases to Water (Surface Water Discharges) -- encompass any releasesgoing directly to streams, rivers, lakes, oceans, or other bodies of water. Anyestimates for stormwater runoff and non-point losses must also be included.
Releases to Land -- includes disposal of toxic chemicals in waste to on-sitelandfills, land treated or incorporation into soil, surface impoundments, spills,leaks, or waste piles. These activities must occur within the facility'sboundaries for inclusion in this category.
Underground Injection -- is a contained release of a fluid into a subsurfacewell for the purpose of waste disposal.
TRANSFERS -- is a transfer of toxic chemicals in wastes to a facility that isgeographically or physically separate from the facility reporting under TRI.The quantities reported represent a movement of the chemical away from thereporting facility. Except for off-site transfers for disposal, these quantitiesdo not necessarily represent entry of the chemical into the environment.
Transfers to POTWs -- are wastewaters transferred through pipes or sewersto a publicly owned treatments works (POTW). Treatment and chemicalremoval depend on the chemical's nature and treatment methods used.Chemicals not treated or destroyed by the POTW are generally released tosurface waters or landfilled within the sludge.
Transfers to Recycling -- are sent off-site for the purposes of regeneratingor recovering still valuable materials. Once these chemicals have beenrecycled, they may be returned to the originating facility or sold commercially.
Transfers to Energy Recovery -- are wastes combusted off-site in industrialfurnaces for energy recovery. Treatment of a chemical by incineration is notconsidered to be energy recovery.
Transfers to Treatment -- are wastes moved off-site for either neutralization,incineration, biological destruction, or physical separation. In some cases, thechemicals are not destroyed but prepared for further waste management.
Transfers to Disposal -- are wastes taken to another facility for disposalgenerally as a release to land or as an injection underground.
IV.A. EPA Toxic Release Inventory for the Inorganic Chemical Industry
Sector Notebook Project Inorganic Chemicals
September 1995 SIC 28134
The 1993 TRI data presented in Exhibits 11 and 12 for inorganic chemicalsmanufacturing covers 555 facilities. These facilities listed SIC 281 (industrialinorganic chemicals) as a primary SIC code. The Bureau of Census identified1,429 facilities manufacturing inorganic chemicals. More than half of thesefacilities, however, have fewer than 20 employees, many of which are likelyto be below the TRI reporting thresholds of employment (TRI reportingthreshold is greater than 10 employees) and/or chemical use and, therefore,are not required to report to TRI.
According to TRI data, in 1993 the inorganic chemical industry released(discharged to the air, water, or land without treatment) and transferred(shipped off-site) a total of 250 million pounds of 112 different chemical toxicchemicals. This represents about 10 percent of the TRI releases and transfersof the chemical manufacturing industry and about three percent of the totalreleases and transfers of all manufacturers that year. In comparison, theorganic chemical industry (SIC 286) produced 438 million pounds that year,almost twice that of the inorganic chemical industry.55
The chemical industry's releases have been declining in recent years. Between1988 and 1993 TRI emissions from chemical companies (all those categorizedwithin SIC 28, not just inorganic chemical manufacturers) to air, land, andwater were reduced 44 percent, which is slightly above the average for allmanufacturing sectors reporting to TRI.56
Because the chemical industry (SIC 28) has historically released more TRIchemicals than any other industry, the EPA has worked to improveenvironmental performance within this sector. This has been done through acombination of enforcement actions, regulatory requirements, pollutionprevention projects, and voluntary programs (e.g. 33/50). In addition, thechemical industry has focused on reducing pollutant releases. For example,the Chemical Manufacturers Association’s (CMA’s) Responsible Careinitiative is intended to reduce or eximinate chemical manufacturers’ waste.All 184 members of the CMA, firms that account for the majority of U.S.chemical industry sales and earnings, are required to participate in theprogram. Participation involves demonstrating a commitment to theprogram's mandate of continuous improvement in environment, health, andsafety. In June of 1994, the CMA approved the use of a third-partyverification of management plans to meet these objectives.
Exhibits 11 and 12 present the number and volumes of chemicals released andtransferred by inorganic chemical facilities, respectively. The frequency withwhich chemicals are reported by facilities within a sector is one indication ofthe diversity of operations and processes. Many of the TRI chemicals arereleased or transferred by only a small number of facilities which indicates awide diversity of production processes, particularly for specialty inorganics --
Sector Notebook Project Inorganic Chemicals
September 1995 SIC 28135
over 70 percent of the 110 chemicals reported are released or transferred byfewer than 10 facilities.
The inorganic chemical industry releases 69 percent of its total TRI poundageto the water (including 67 percent to underground injection and two percentto surface waters), 14 percent to the air, and 17 percent to the land. Thisrelease profile differs from other TRI industries which average approximately30 percent to the water, 59 percent to air, and 10 percent to land. Examiningthe inorganic chemical industry's TRI reported toxic chemical releaseshighlights the likely origins of the large water releases for the industry (Exhibit11).
As presented in Exhibit 11, on-site underground injection of essentially onechemical, hydrochloric acid, accounts for the largest portion, 55 percent, ofthe inorganic chemical industry's total releases and transfers as reported inTRI. Only five facilities of the 555 identified facilities reported releasinghydrochloric acid through underground injection. Two of these facilitiesaccounted for over 85 percent of the total hydrochloric acid injected to thesubsurface, or 42 percent of the inorganic chemical industry's total releasesand transfers. Land disposal accounted for the next largest amount, 17percent, of the industry's total releases. The largest single chemical releasedto the air by the inorganic chemical industry, carbonyl sulfide, is only emittedby eleven facilities manufacturing certain inorganic pigments.
Discharges to POTWs accounted for 43 percent of the industry’s totaltransfers of TRI chemicals. Ammonia, hydrochloric acid, and sulfuric acidaccount for over 66 percent of the 70 million pounds transferred off-site.Finally, approximately 22 million pounds, accounting for 31 percent of thetotal, are transferred off-site for treatment (Exhibit 12).
Sector Notebook Project Inorganic Chemicals
September 1995 SIC 28136
Exh
ibit
11:
199
3 R
elea
ses
for
Inor
gani
c C
hem
ical
Man
ufac
turi
ng F
acili
ties
(SI
C 2
81)
in T
RI,
by
Num
ber
of F
acili
ties
Rep
orti
ng(R
elea
ses
repo
rted
in p
ound
s/ye
ar)
CH
EM
ICA
L N
AM
E#
RE
PO
RT
ING
CH
EM
ICA
LF
UG
ITIV
EA
IRP
OIN
TA
IRW
AT
ER
DIS
CH
AR
GE
SU
ND
ER
GR
OU
ND
INJE
CT
ION
LA
ND
DIS
PO
SAL
TO
TA
LR
EL
EA
SES
AV
G. R
EL
EA
SES
PE
R F
AC
ILIT
YSU
LFU
RIC
AC
ID31
147
,743
538,
584
7,48
25
29,5
2062
3,33
42,
004
HY
DR
OC
HL
OR
IC A
CID
167
29,4
281,
420,
262
3,74
812
0,74
5,70
821
3,35
112
2,67
7,35
273
4,59
5A
MM
ON
IA15
21,
984,
440
2,72
6,77
41,
885,
475
01,
162,
987
7,75
9,67
651
,051
CH
LO
RIN
E12
152
,954
3,01
7,39
36,
105
00
3,07
6,45
225
,425
PHO
SPH
OR
IC A
CID
724,
673
417,
181
500
50
422,
359
5,86
6N
ITR
IC A
CID
7113
,211
56,5
3825
05
070
,004
986
AC
ET
ON
E54
40,3
0419
,261
00
059
,565
1,10
3Z
INC
CO
MPO
UN
DS
5339
,171
72,7
0510
4,18
00
86,3
8430
2,44
05,
706
CH
RO
MIU
M C
OM
POU
ND
S41
4,29
413
,008
33,9
350
19,0
36,9
3419
,088
,171
465,
565
CO
PPE
R C
OM
POU
ND
S33
2,31
715
,238
1,82
70
428
19,8
1060
0N
ICK
EL
CO
MPO
UN
DS
291,
253
20,0
008,
872
534
,289
64,4
192,
221
ME
TH
AN
OL
2810
5,22
487
8,23
977
,887
00
1,06
1,35
037
,905
BA
RIU
M C
OM
POU
ND
S27
2,27
98,
176
5,62
90
353,
000
369,
084
13,6
70D
ICH
LO
RO
DIF
LU
OR
OM
ET
HA
NE
2674
1,76
154
,302
00
079
6,06
330
,618
LE
AD
CO
MPO
UN
DS
261,
370
12,7
3028
70
58,0
5372
,440
2,78
6M
AN
GA
NE
SE C
OM
POU
ND
S26
124,
003
146,
393
87,5
480
7,67
2,76
88,
030,
712
308,
874
HY
DR
OG
EN
FL
UO
RID
E24
93,0
4084
,932
50
1017
7,98
77,
416
CO
BA
LT
CO
MPO
UN
DS
211,
001
2,01
899
60
33,4
6037
,475
1,78
5E
TH
YL
EN
E G
LY
CO
L20
543
765
505
070
22,
515
126
TO
LU
EN
E20
84,6
7911
,313
00
495
,996
4,80
0A
NT
IMO
NY
CO
MPO
UN
DS
162,
010
11,4
3927
30
113
,723
858
XY
LE
NE
(M
IXE
D I
SOM
ER
S)16
9,60
87,
998
00
5217
,658
1,10
4PH
OSP
HO
RU
S (Y
EL
LO
W O
R14
1,20
04,
137
50
323,
749
329,
091
23,5
07PR
OPY
LE
NE
1414
,451
2,21
50
00
16,6
661,
190
AM
MO
NIU
M N
ITR
AT
E13
697
8,85
849
6,40
00
599,
028
1,10
4,98
384
,999
AM
MO
NIU
M S
UL
FAT
E11
1,61
34,
935
00
06,
548
595
CA
RB
ON
YL
SU
LFI
DE
1138
09,
676,
486
00
09,
676,
866
879,
715
GL
YC
OL
ET
HE
RS
114,
028
40,6
400
00
44,6
684,
061
TIT
AN
IUM
TE
TR
AC
HL
OR
IDE
117,
900
4,49
20
00
12,3
921,
127
ET
HY
LE
NE
OX
IDE
1042
819
,890
00
020
,318
2,03
2C
OPP
ER
952
31,
250
830
01,
856
206
MO
LY
BD
EN
UM
TR
IOX
IDE
91,
155
12,2
913,
749
550
017
,700
1,96
7FO
RM
AL
DE
HY
DE
849
311
,703
00
012
,196
1,52
5Z
INC
(FU
ME
OR
DU
ST)
825
56,
476
00
06,
731
841
AR
SEN
IC C
OM
POU
ND
S7
260
264
391
050
41,
419
203
ME
RC
UR
Y7
5,90
31,
597
215
01,
519
9,23
41,
319
1,1,
1-T
RIC
HL
OR
OE
TH
AN
E7
1,20
050
50
00
1,70
524
4A
SBE
STO
S (F
RIA
BL
E)
60
10
00
10
CA
RB
ON
TE
TR
AC
HL
OR
IDE
625
,632
259,
791
00
228
5,42
547
,571
CH
RO
MIU
M6
260
520
860
267,
786
268,
652
44,7
75D
ICH
LO
RO
TE
TR
AFL
UO
RO
ET
HA
NE
670
9,95
05
00
070
9,95
511
8,32
6E
TH
YL
EN
E6
527
5,28
70
00
5,81
496
9M
ET
HY
L E
TH
YL
KE
TO
NE
610
,205
2,60
10
041
12,8
472,
141
NA
PHT
HA
LE
NE
681
933
,652
741
05
35,2
175,
870
CA
DM
IUM
CO
MPO
UN
DS
543
14,
237
210
124
4,81
396
3D
ICH
LO
RO
ME
TH
AN
E5
53,1
749,
322
00
062
,496
12,4
99D
IET
HA
NO
LA
MIN
E5
3,32
575
00
00
4,07
581
5A
CE
TO
NIT
RIL
E4
2,08
51,
696
00
03,
781
945
Sector Notebook Project Inorganic Chemicals
September 1995 SIC 28137
Exh
ibit
11
(con
t.):
199
3 R
elea
ses
for
Inor
gani
c C
hem
ical
Man
ufac
turi
ng F
acili
ties
in T
RI,
by
Num
ber
of F
acili
ties
Rep
orti
ng(R
elea
ses
repo
rted
in p
ound
s/ye
ar)
C
HE
MIC
AL
NA
ME
# R
EP
OR
TIN
GC
HE
MIC
AL
FU
GIT
IVE
AIR
PO
INT
AIR
WA
TE
RD
ISC
HA
RG
ES
UN
DE
RG
RO
UN
DIN
JEC
TIO
NL
AN
DD
ISP
OSA
LT
OT
AL
RE
LE
ASE
SA
VG
. RE
LE
ASE
SP
ER
FA
CIL
ITY
CA
RB
ON
DIS
UL
FID
E4
70,0
064,
334
250
00
74,5
9018
,648
CH
LO
RO
FOR
M4
13,2
8227
,017
360
00
40,6
5910
,165
CY
AN
IDE
CO
MPO
UN
DS
45
50
00
103
NIC
KE
L4
3888
05
025
01,
173
293
PHT
HA
LIC
AN
HY
DR
IDE
425
025
00
00
500
125
SEL
EN
IUM
CO
MPO
UN
DS
410
270
870
036
792
TR
ICH
LO
RO
FLU
OR
OM
ET
HA
NE
430
7,25
01,
205
00
030
8,45
577
,114
1,2,
4-T
RIM
ET
HY
LB
EN
ZE
NE
41,
110
1,29
025
00
52,
655
664
AL
UM
INU
M (
FUM
E O
R D
UST
)3
4266
00
00
702
234
BE
NZ
EN
E3
505
50
00
510
170
ET
HY
LB
EN
ZE
NE
350
525
00
00
755
252
FRE
ON
113
330
,954
670
00
31,0
2110
,340
HY
DR
AZ
INE
333
00
330
036
312
1M
AN
GA
NE
SE3
250
316
340
1,18
0,33
51,
180,
935
393,
645
MO
NO
CH
LO
RO
PEN
TA
FLU
OR
OE
HT
AN
E3
402,
000
7,72
10
00
409,
721
136,
574
TR
ICH
LO
RO
ET
HY
LE
NE
325
535
,305
50
035
,565
11,8
55A
CE
TA
LD
EH
YD
E2
63,
100
00
03,
106
1,55
3A
CR
YL
ON
ITR
ILE
225
55
00
026
013
0C
HL
OR
INE
DIO
XID
E2
8617
60
00
262
131
CO
BA
LT
213
251
00
526
913
5C
RE
SOL
(M
IXE
D I
SOM
ER
S)2
276
510
00
078
639
3C
YC
LO
HE
XA
NE
225
55
00
026
013
0H
YD
RO
QU
INO
NE
20
00
00
00
LE
AD
276
09
08,
500
8,58
54,
293
ME
TH
YL
ISO
BU
TY
L K
ET
ON
E2
250
303
00
055
327
7M
ET
HY
L T
ER
T-B
UT
YL
ET
HE
R2
790
50
00
795
398
PHE
NO
L2
264
145
00
040
920
5SI
LV
ER
CO
MPO
UN
DS
20
50
00
53
TE
TR
AC
HL
OR
OE
TH
YL
EN
E2
400
305
00
070
535
3A
CR
YL
IC A
CID
125
05
00
025
525
5A
RSE
NIC
15
00
00
55
BA
RIU
M1
00
00
00
0B
RO
MO
TR
IFL
UO
RO
ME
TH
AN
E1
34,0
000
00
034
,000
34,0
00C
APT
AN
15
00
00
55
CH
LO
RO
BE
NZ
EN
E1
250
50
00
255
255
CH
LO
RO
ET
HA
NE
152
20
00
052
252
2C
HL
OR
OM
ET
HA
NE
150
10
00
050
150
1C
RE
OSO
TE
125
05
00
025
525
5C
UM
EN
E1
750
750
00
01,
500
1,50
0D
I(2-
ET
HY
LH
EX
YL
) PH
TH
AL
AT
E1
250
50
00
255
255
DIB
UT
YL
PH
TH
AL
AT
E1
250
50
00
255
255
DIM
ET
HY
L P
HT
HA
LA
TE
110
00
00
1010
DIM
ET
HY
L S
UL
FAT
E1
00
00
00
0E
TH
YL
AC
RY
LA
TE
125
05
00
025
525
5H
YD
RO
GE
N C
YA
NID
E1
030
00
030
30IS
OPR
OPY
L A
LC
OH
OL
125
025
00
00
500
500
MA
LE
IC A
NH
YD
RID
E1
250
50
00
255
255
ME
RC
UR
Y C
OM
POU
ND
S1
250
250
00
050
050
0
Sector Notebook Project Inorganic Chemicals
September 1995 SIC 28138
Exh
ibit
11
(con
t.):
199
3 R
elea
ses
for
Inor
gani
c C
hem
ical
Man
ufac
turi
ng F
acili
ties
in T
RI,
by
Num
ber
of F
acili
ties
Rep
orti
ng(R
elea
ses
repo
rted
in p
ound
s/ye
ar)
CH
EM
ICA
L N
AM
E#
RE
PO
RT
ING
CH
EM
ICA
LF
UG
ITIV
EA
IRP
OIN
TA
IRW
AT
ER
DIS
CH
AR
GE
SU
ND
ER
GR
OU
ND
INJE
CT
ION
LA
ND
DIS
PO
SAL
TO
TA
LR
EL
EA
SES
AV
G. R
EL
EA
SES
PE
R F
AC
ILIT
YM
ET
HY
L M
ET
HA
CR
YL
AT
E1
250
50
00
255
255
N-B
UT
YL
AL
CO
HO
L1
250
250
00
050
050
0O
-XY
LE
NE
15
00
00
55
P-X
YL
EN
E1
50
00
05
5PE
RA
CE
TIC
AC
ID1
102,
100
420
02,
152
2,15
2PO
LY
CH
LO
RIN
AT
ED
BIP
HE
NY
LS
10
00
00
00
SEL
EN
IUM
15
250
00
025
525
5SI
LV
ER
175
025
00
00
1,00
01,
000
STY
RE
NE
125
025
00
00
500
500
TH
IOU
RE
A1
00
00
00
0V
INY
L A
CE
TA
TE
15
00
00
55
VIN
YL
CH
LO
RID
E1
00
00
00
01,
1,2-
TR
ICH
LO
RO
ET
HA
NE
125
05
00
025
525
51,
2-D
ICH
LO
RO
ET
HA
NE
15
00
00
55
1,2,
4-T
RIC
HL
OR
OB
EN
ZE
NE
15
00
00
55
1,4-
DIO
XA
NE
15
00
00
55
TO
TA
L55
55,
366,
356
19,7
37,6
602,
728,
270
120,
745,
733
31,0
64,2
9617
9,64
2,31
532
3,68
0
Sector Notebook Project Inorganic Chemicals
September 1995 SIC 28139
Exh
ibit
12:
199
3 T
rans
fers
for
Ino
rgan
ic C
hem
ical
Man
ufac
turi
ng F
acili
ties
(SI
C 2
81)
in T
RI,
by
Num
ber
of F
acili
ties
Rep
orti
ng(T
rans
fers
rep
orte
d in
pou
nds/
year
) C
HE
MIC
AL
NA
ME
# R
EP
OR
TIN
GC
HE
MIC
AL
PO
TW
DIS
CH
AR
GE
SD
ISP
OSA
LR
EC
YC
LIN
GT
RE
AT
ME
NT
EN
ER
GY
RE
CO
VE
RY
TO
TA
LT
RA
NSF
ER
SA
VG
. TR
AN
SFE
RS
PE
R F
AC
ILIT
YSU
LFU
RIC
AC
ID31
111
,146
250,
434
1,02
5,24
26,
820,
665
08,
107,
487
26,0
69H
YD
RO
CH
LO
RIC
AC
ID16
752
84,
598,
609
010
,423
,062
015
,022
,199
89,9
53A
MM
ON
IA15
222
,101
,429
371,
669
528,
230
65,3
000
23,0
66,6
2815
1,75
4C
HL
OR
INE
121
561
00
270
088
57
PHO
SPH
OR
IC A
CID
723,
913
2,13
023
,218
132,
065
016
1,32
62,
241
NIT
RIC
AC
ID71
1025
00
438,
614
043
8,87
46,
181
AC
ET
ON
E54
1,65
523
15,7
2611
,249
84,3
6811
3,02
12,
093
ZIN
C C
OM
POU
ND
S53
7,38
250
9,39
515
9,71
330
,265
070
6,75
513
,335
CH
RO
MIU
M C
OM
POU
ND
S41
4,07
812
1,56
947
,843
51,4
520
224,
942
5,48
6C
OPP
ER
CO
MPO
UN
DS
334,
228
321,
517
576,
642
7,73
30
910,
120
27,5
79N
ICK
EL
CO
MPO
UN
DS
299,
840
86,3
7027
8,63
010
6,69
20
481,
532
16,6
05M
ET
HA
NO
L28
16,2
094,
000
291,
354
175
1,80
2,76
52,
114,
503
75,5
18B
AR
IUM
CO
MPO
UN
DS
275,
080
370,
288
012
3,56
00
498,
928
18,4
79D
ICH
LO
RO
DIF
LU
OR
OM
ET
HA
NE
260
020
,600
160
20,6
1679
3L
EA
D C
OM
POU
ND
S26
1,30
189
,660
1,15
3,21
11,
087,
669
02,
331,
841
89,6
86M
AN
GA
NE
SE C
OM
POU
ND
S26
1,44
61,
694,
840
7,30
02,
206,
411
03,
909,
997
150,
385
HY
DR
OG
EN
FL
UO
RID
E24
185
230,
250
77,5
8738
,700
034
6,72
214
,447
CO
BA
LT
CO
MPO
UN
DS
213,
996
13,5
808,
050
10,5
980
36,2
241,
725
ET
HY
LE
NE
GL
YC
OL
203,
951
030
,912
2,24
813
,852
50,9
632,
548
TO
LU
EN
E20
1,37
520
325
,347
32,3
8421
7,97
927
7,28
813
,864
AN
TIM
ON
Y C
OM
POU
ND
S16
3,73
552
,815
16,0
007,
171
079
,721
4,98
3X
YL
EN
E (
MIX
ED
ISO
ME
RS)
160
7325
05,
127
188,
093
193,
543
12,0
96PH
OSP
HO
RU
S (Y
EL
LO
W O
R14
01
026
,000
026
,001
1,85
7PR
OPY
LE
NE
140
00
00
00
AM
MO
NIU
M N
ITR
AT
E13
1,92
3,49
516
060
3,44
00
02,
527,
095
194,
392
AM
MO
NIU
M S
UL
FAT
E11
6,50
6,73
38,
247
06,
092
06,
521,
072
592,
825
CA
RB
ON
YL
SU
LFI
DE
110
00
00
00
GL
YC
OL
ET
HE
RS
1162
850
60
37,3
8713
,405
51,9
264,
721
TIT
AN
IUM
TE
TR
AC
HL
OR
IDE
110
160
489
8659
154
ET
HY
LE
NE
OX
IDE
100
00
00
00
CO
PPE
R9
4693
8,47
70
55,2
610
993,
784
110,
420
MO
LY
BD
EN
UM
TR
IOX
IDE
97,
652
52,4
2461
,220
00
121,
296
13,4
77FO
RM
AL
DE
HY
DE
825
525
00
362
086
710
8Z
INC
(FU
ME
OR
DU
ST)
825
01,
710
250
00
2,21
027
6A
RSE
NIC
CO
MPO
UN
DS
75
59,9
0025
090
40
61,0
598,
723
ME
RC
UR
Y7
03,
486
5,22
21,
010
09,
718
1,38
81,
1,1-
TR
ICH
LO
RO
ET
HA
NE
70
025
05
025
536
ASB
EST
OS
(FR
IAB
LE
)6
033
,070
00
033
,070
5,51
2C
AR
BO
N T
ET
RA
CH
LO
RID
E6
01,
400
034
,107
035
,507
5,91
8C
HR
OM
IUM
60
48,9
302,
763
37,7
650
89,4
5814
,910
DIC
HL
OR
OT
ET
RA
FLU
OR
OE
TH
A6
00
00
00
0E
TH
YL
EN
E6
00
00
00
0M
ET
HY
L E
TH
YL
KE
TO
NE
60
920
443
33,5
6734
,102
5,68
4N
APH
TH
AL
EN
E6
048
088
025
01,
178
196
CA
DM
IUM
CO
MPO
UN
DS
535
585
54,
061
04,
686
937
DIC
HL
OR
OM
ET
HA
NE
50
05,
147
50
5,15
21,
030
DIE
TH
AN
OL
AM
INE
545
00
00
045
090
AC
ET
ON
ITR
ILE
40
00
522
,239
22,2
445,
561
Sector Notebook Project Inorganic Chemicals
September 1995 SIC 28140
Exh
ibit
12
(con
t.):
199
3 T
rans
fers
for
Ino
rgan
ic C
hem
ical
Man
ufac
turi
ng F
acili
ties
in T
RI,
by
Num
ber
of F
acili
ties
Rep
orti
ng(T
rans
fers
rep
orte
d in
pou
nds/
year
)
CH
EM
ICA
L N
AM
E#
RE
PO
RT
ING
CH
EM
ICA
LP
OT
WD
ISC
HA
RG
ES
DIS
PO
SAL
RE
CY
CL
ING
TR
EA
TM
EN
TE
NE
RG
YR
EC
OV
ER
YT
OT
AL
TR
AN
SFE
RS
AV
G. T
RA
NSF
ER
SP
ER
FA
CIL
ITY
CA
RB
ON
DIS
UL
FID
E4
250
100
050
076
019
0C
HL
OR
OFO
RM
40
7,70
00
72,3
110
80,0
1120
,003
CY
AN
IDE
CO
MPO
UN
DS
41
00
40
51
NIC
KE
L4
9750
523
,670
00
24,2
726,
068
PHT
HA
LIC
AN
HY
DR
IDE
45
00
52,
412
2,42
260
6SE
LE
NIU
M C
OM
POU
ND
S4
227
029
50
324
81T
RIC
HL
OR
OFL
UO
RO
ME
TH
AN
E4
00
3,10
01,
705
04,
805
1,20
11,
2,4-
TR
IME
TH
YL
BE
NZ
EN
E4
00
01,
854
3,18
85,
042
1,26
1A
LU
MIN
UM
(FU
ME
OR
DU
ST)
30
00
00
00
BE
NZ
EN
E3
00
05
05
2E
TH
YL
BE
NZ
EN
E3
00
05
05
2FR
EO
N 1
133
00
01,
500
01,
500
500
HY
DR
AZ
INE
30
00
00
00
MA
NG
AN
ESE
30
183,
412
00
018
3,41
261
,137
MO
NO
CH
LO
RO
PEN
TA
FLU
OR
OE
30
00
00
00
TR
ICH
LO
RO
ET
HY
LE
NE
30
00
1,30
50
1,30
543
5A
CE
TA
LD
EH
YD
E2
00
00
00
0A
CR
YL
ON
ITR
ILE
20
00
50
53
CH
LO
RIN
E D
IOX
IDE
213
00
00
013
065
CO
BA
LT
24
52,
300
00
2,30
91,
155
CR
ESO
L (
MIX
ED
ISO
ME
RS)
20
00
50
53
CY
CL
OH
EX
AN
E2
00
05
05
3H
YD
RO
QU
INO
NE
250
00
00
050
025
0L
EA
D2
075
00
660
816
408
ME
TH
YL
ISO
BU
TY
L K
ET
ON
E2
00
05
820
825
413
ME
TH
YL
TE
RT
-BU
TY
L E
TH
ER
20
00
50
53
PHE
NO
L2
00
05
05
3SI
LV
ER
CO
MPO
UN
DS
25
50
00
105
TE
TR
AC
HL
OR
OE
TH
YL
EN
E2
00
05
05
3A
CR
YL
IC A
CID
10
00
50
55
AR
SEN
IC1
00
070
,761
070
,761
70,7
61B
AR
IUM
10
26,2
170
00
26,2
1726
,217
BR
OM
OT
RIF
LU
OR
OM
ET
HA
NE
10
00
00
00
CA
PTA
N1
00
00
00
0C
HL
OR
OB
EN
ZE
NE
10
00
50
55
CH
LO
RO
ET
HA
NE
10
00
00
00
CH
LO
RO
ME
TH
AN
E1
00
00
00
0C
RE
OSO
TE
10
00
50
55
CU
ME
NE
10
00
1,00
00
1,00
01,
000
DI(
2-E
TH
YL
HE
XY
L)
10
00
50
55
DIB
UT
YL
PH
TH
AL
AT
E1
00
05
05
5D
IME
TH
YL
PH
TH
AL
AT
E1
00
00
00
0D
IME
TH
YL
SU
LFA
TE
10
00
00
00
ET
HY
L A
CR
YL
AT
E1
00
05
05
5H
YD
RO
GE
N C
YA
NID
E1
00
00
00
0IS
OPR
OPY
L A
LC
OH
OL
10
00
50
55
MA
LE
IC A
NH
YD
RID
E1
00
05
05
5M
ER
CU
RY
CO
MPO
UN
DS
15
1,52
50
50
1,53
51,
535
Sector Notebook Project Inorganic Chemicals
September 1995 SIC 28141
Exh
ibit
12
(con
t.):
199
3 T
rans
fers
for
Ino
rgan
ic C
hem
ical
Man
ufac
turi
ng F
acili
ties
in T
RI,
by
Num
ber
of F
acili
ties
Rep
orti
ng(T
rans
fers
rep
orte
d in
pou
nds/
year
)
CH
EM
ICA
L N
AM
E#
RE
PO
RT
ING
CH
EM
ICA
LP
OT
WD
ISC
HA
RG
ES
DIS
PO
SAL
RE
CY
CL
ING
TR
EA
TM
EN
TE
NE
RG
YR
EC
OV
ER
YT
OT
AL
TR
AN
SFE
RS
AV
G. T
RA
NSF
ER
SP
ER
FA
CIL
ITY
ME
TH
YL
ME
TH
AC
RY
LA
TE
10
00
50
55
N-B
UT
YL
AL
CO
HO
L1
00
05
05
5O
-XY
LE
NE
10
00
00
00
P-X
YL
EN
E1
00
00
00
0PE
RA
CE
TIC
AC
ID1
00
011
00
110
110
POL
YC
HL
OR
INA
TE
D1
00
00
00
0SE
LE
NIU
M1
00
01,
450
01,
450
1,45
0SI
LV
ER
10
01,
011
00
1,01
11,
011
STY
RE
NE
10
00
50
55
TH
IOU
RE
A1
00
00
00
0V
INY
L A
CE
TA
TE
10
00
00
00
VIN
YL
CH
LO
RID
E1
00
00
00
01,
1,2-
TR
ICH
LO
RO
ET
HA
NE
10
00
50
55
1,2-
DIC
HL
OR
OE
TH
AN
E1
00
00
00
01,
2,4-
TR
ICH
LO
RO
BE
NZ
EN
E1
00
00
00
01,
4-D
IOX
AN
E1
00
00
00
0T
OT
AL
555
30,6
22,0
4010
,087
,743
4,99
4,48
321
,958
,678
2,38
3,52
470
,046
,468
126,
210
Sector Notebook Project Inorganic Chemicals
Being included on this list does not mean that the release is associated with non-compliance with environmental laws.b
September 1995 SIC 28142
The TRI database contains a detailed compilation of self-reported, facility-specific chemical releases. The top reporting facilities for this sector are listedbelow. Facilities that have reported only the SIC codes covered under thisnotebook appear on the first list. The second list contains additional facilitiesthat have reported the SIC code covered within this report, and one or moreSIC codes that are not within the scope of this notebook. Therefore, thesecond list includes facilities that conduct multiple operations -- some that areunder the scope of this notebook, and some that are not. Currently, thefacility-level data do not allow pollutant releases to be broken apart byindustrial process.
Exhibit 13: Top 10 TRI Releasing Inorganic Chemicals Facilitiesb
Rank Facility in Pounds
Total TRIReleases
1 58,875,734Du Pont Delisle Plant - Pass Christian, MS
2 51,215,700Du Pont Johnsonville Plant - New Johnsonville, TN
3 13,926,440Cabot Corp. Cab-O-Sil Div. - Tuscola, IL
4 12,113,360American Chrome & Chemicals Inc. - Corpus Christi, TX
5 6,705,795Occidental Chemical Corp. - Castle Hayne, NC
6 5,684,893Chemetals Inc. - New Johnsonville, TN
7 4,876,348Kaiser Aluminum & Chemical Corp. - Mulberry, FL
8 2,333,175Kerr-McGee Chemical Corp. - Henderson, NV
9 2,238,400SCM Chemicals Americas Plant II - Ashtabula, OH
10 1,465,753Louisiana Pigment Co. L.P. - Westlake, LA
Source: U.S. EPA, Toxics Release Inventory Database, 1993.
Sector Notebook Project Inorganic Chemicals
Being included on this list does not mean that the release is associated with non-compliance with environmental laws.c
Databases included in TOXNET are: CCRIS (Chemical Carcinogenesis Research Information System), DARTd
(Developmental and Reproductive Toxicity Database), DBIR (Directory of Biotechnology Information Resources),EMICBACK (Environmental Mutagen Information Center Backfile), GENE-TOX (Genetic Toxicology), HSDB(Hazardous Substances Data Bank), IRIS (Integrated Risk Information System), RTECS (Registry of Toxic Effects ofChemical Substances), and TRI (Toxic Chemical Release Inventory).
September 1995 SIC 28143
Exhibit 14: Top 10 TRI Releasing Facilities Reporting Inorganic Chemical SIC Codes to TRIc
Rank Reported in TRI Facility PoundsSIC Codes Releases in
Total TRI
1 2819, 2873, 2874 IMC-Agrico Co., Faustina Plant - Saint James, LA 127,912,967
Source: U.S. EPA, Toxics Release Inventory Database, 1993.
IV.B. Summary of Selected Chemicals Released
The brief descriptions provided below were taken from the 1993 ToxicsRelease Inventory Public Data Release (EPA, 1994), and the HazardousSubstances Data Bank (HSDB), accessed via TOXNET. TOXNET is acomputer system run by the National Library of Medicine. It includes anumber of toxicological databases managed by EPA, the National CancerInstitute, and the National Institute for Occupational Safety and Health.d
HSDB contains chemical-specific information on manufacturing and use,chemical and physical properties, safety and handling, toxicity and biomedicaleffects, pharmacology, environmental fate and exposure potential, exposurestandards and regulations, monitoring and analysis methods, and additional
Sector Notebook Project Inorganic Chemicals
September 1995 SIC 28144
references. The information contained below is based upon exposureassumptions that have been conducted using standard scientific procedures.The effects listed below must be taken in context of these exposureassumptions that are more fully explained within the full chemical profiles inHSDB. For more information on TOXNET, contact the TOXNET help lineat 800-231-3766.
Hydrochloric Acid (CAS: 7647-01-1)
Sources. Hydrochloric acid is one of the highest volume chemicals producedby the inorganic chemical industry. Some of its more common uses are as apickling liquor and metal cleaner in the iron and steel industry, as an activatorof petroleum wells, as a boiler scale remover, and as a neutralizer of causticwaste streams. The largest release of hydrochloric acid by the inorganicchemical industry is in the form of underground injection of spenthydrochloric acid used to manufacture chlorosulfonic acid and otherproducts.57
Toxicity. Hydrochloric acid is primarily a concern in its aerosol form. Acidaerosols have been implicated in causing and exacerbating a variety ofrespiratory ailments. Dermal exposure and ingestion of highly concentratedhydrochloric acid can result in corrosivity.
Ecologically, accidental releases of solution forms of hydrochloric acid mayadversely affect aquatic life by including a transient lowering of the pH (i.e.,increasing the acidity) of surface waters.
Carcinogenicity. There is currently no evidence to suggest that this chemicalis carcinogenic.
Environmental Fate. Releases of hydrochloric acid to surface waters andsoils will be neutralized to an extent due to the buffering capacities of bothsystems. The extent of these reactions will depend on the characteristics ofthe specific environment.
Physical Properties. Concentrated hydrochloric acid is highly corrosive.
Chromium and Chromium Compounds (CAS: 7440-47-3; 20-06-4)
Sources. Chrome pigments, chromates, chromic acid, chromium salts, andother inorganic chromium compounds are some of the larger volume productsof the inorganic chemicals industry. Chrome is used as a plating element formetal and plastics to prevent corrosion, and as a constituent of certain steelsand inorganic pigments. Most chromium wastes released to the environment
Sector Notebook Project Inorganic Chemicals
September 1995 SIC 28145
by the inorganic chemicals industry are land disposed in the form of chromiumcontaining sludges.
Toxicity. Although the naturally-occurring form of chromium metal has verylow toxicity, chromium from industrial emissions is highly toxic due to strongoxidation characteristics and cell membrane permeability. The majority of theeffects detailed below are based on Chromium VI (an isomer that is moretoxic than Cr III). Exposure to chromium metal and insoluble chromium saltsaffects the respiratory system. Inhalation exposure to chromium andchromium salts may cause severe irritation of the upper respiratory tract andscarring of lung tissue. Dermal exposure to chromium and chromium saltscan also cause sensitive dermatitis and skin ulcers.
Ecologically, although chromium is present in small quantities in all soils andplants, it is toxic to plants at higher soil concentrations (i.e., 0.2 to 0.4 percentin soil).
Carcinogenicity. Different sources disagree on the carcinogenicity ofchromium. Although an increased incidence in lung cancer among workersin the chromate-producing industry has been reported, data are inadequate toconfirm that chromium is a human carcinogen. Other sources considerchromium VI to be a known human carcinogen based on inhalation exposure.
Environmental Fate. Chromium is a non-volatile metal with very lowsolubility in water. If applied to land, most chromium remains in the upperfive centimeters of soil. Most chromium in surface waters is present inparticulate form as sediment. Airborne chromium particles are relativelyunreactive and are removed from the air through wet and dry deposition. Theprecipitated chromium from the air enters surface water or soil. Chromiumbioaccumulates in plants and animals, with an observed bioaccumulationfactor of 1,000,000 in snails.
Carbonyl Sulfide (CAS: 463-58-1)
Sources. Carbonyl sulfide is the largest volume chemical released to the airby the inorganic chemicals industry. Carbonyl sulfide is primarily generatedby a relatively small number of facilities hydrolyzing ammonium or potassiumthiocyanate during the manufacturing of inorganic pigments and dyes.58
Toxicity. Exposure to low to moderate concentrations of carbonyl sulfidecauses eye and skin irritation and adverse central nervous system effects suchas giddiness, headache, vertigo, amnesia, confusion, and unconsciousness. Ifingested, gastrointestinal effects include profuse salivation, nausea, vomitingand diarrhea. Moderate carbonyl sulfide poisoning also causes rapid breathingand heartbeat, sweating, weakness, and muscle cramps. Exposure to very
Sector Notebook Project Inorganic Chemicals
September 1995 SIC 28146
high concentrations of carbonyl sulfide causes sudden collapse,unconsciousness, and death from sudden respiratory paralysis. Recovery fromsublethal exposure is slow, but generally complete. Degradation products ofcarbonyl sulfide (especially hydrogen sulfide) can result in toxic symptoms anddeath.
Carcinogenicity. There is currently no evidence to suggest that this chemicalis carcinogenic.
Environmental Fate. If released to soil or surface waters, carbonyl sulfidewill rapidly volatilize. It is not expected to adsorb to soil sediments or organicmatter nor is it expected to bioconcentrate in fish and aquatic organisms.Carbonyl sulfide is hydrolyzed in water to carbon dioxide and hydrogensulfide. Carbonyl sulfide is expected to have a long residence time in theatmosphere. Atmospheric removal of carbonyl sulfide may occur by slowreactions with other gases, and may also occur through adsorption by plantsand soil microbes.
Manganese and Manganese Compounds (CAS: 7439-96-5; 20-12-2)
Sources. Manganese is both a product and chemical intermediate of theinorganic chemical industry. Manganese is used as a purifying and scavengingagent in metal production, as an intermediate in aluminum production and asa constituent of non-ferrous alloys to improve corrosion resistance andhardness. 59
Toxicity. There is currently no evidence that human exposure to manganeseat levels commonly observed in ambient atmosphere results in adverse healtheffects. However, recent EPA review of the fuel additive MMT(methylcyclopentadienyl manganese tricarbonyl) concluded that use of MMTin gasoline could lead to ambient exposures to manganese at a level sufficientto cause adverse neurological effects in humans.
Chronic manganese poisoning bears some similarity to chronic lead poisoning.Occurring via inhalation of manganese dust or fumes, it primarily involves thecentral nervous system. Early symptoms include languor, speechdisturbances, sleepiness, and cramping and weakness in legs. A stolid mask-like appearance of face, emotional disturbances such as absolute detachmentbroken by uncontrollable laughter, euphoria, and a spastic gait with atendency to fall while walking are seen in more advanced cases. Chronicmanganese poisoning is reversible if treated early and exposure stopped.Populations at greatest risk of manganese toxicity are the very young andthose with iron deficiencies.
Sector Notebook Project Inorganic Chemicals
September 1995 SIC 28147
Ecologically, although manganese is an essential nutrient for both plants andanimals, in excessive concentrations manganese inhibits plant growth.
Carcinogenicity. There is currently no evidence to suggest that this chemicalis carcinogenic.
Environmental Fate. Manganese is an essential nutrient for plants andanimals. As such, manganese accumulates in the top layers of soil or surfacewater sediments and cycles between the soil and living organisms. It occursmainly as a solid under environmental conditions, though may also betransported in the atmosphere as a vapor or dust
Ammonia (CAS: 7664-41-7)
Sources. Ammonia is used in many chemical manufacturing processes and isthe building block for all synthetic nitrogen products. Its prevalence and itsvolatile and water soluble characteristics allow it to be readily released to theair and water. In the inorganic chemical manufacturing industry, ammonia canbe either a feedstock or a by-product. Some of the more common inorganicchemical industry processes using or producing ammonia include themanufacturing of: ammonium chloride, ammonium hydroxide, ammoniumthiosulfate, ammonium nitrate, hydrazine, and hydrogen cyanide.
Toxicity. Anhydrous ammonia is irritating to the skin, eyes, nose, throat, andupper respiratory system. Ecologically, ammonia is a source of nitrogen (anessential element for aquatic plant growth), and may therefore contribute toeutrophication of standing or slow-moving surface water, particularly innitrogen-limited waters such as the Chesapeake Bay. In addition, aqueousammonia is moderately toxic to aquatic organisms.
Carcinogenicity. There is currently no evidence to suggest that this chemicalis carcinogenic.
Environmental Fate. Ammonia combines with sulfate ions in theatmosphere and is washed out by rainfall, resulting in rapid return of ammoniato the soil and surface waters. Ammonia is a central compound in theenvironmental cycling of nitrogen. Ammonia in lakes, rivers, and streams isconverted to nitrate.
Physical Properties. Ammonia is a corrosive and severely irritating gas witha pungent odor.
IV.C. Other Data Sources
Sector Notebook Project Inorganic Chemicals
September 1995 SIC 28148
In addition to chemicals covered under TRI, many other chemicals arereleased. For example, the EPA Office of Air Quality Planning and Standardshas compiled air pollutant emission factors for determining the total airemissions of priority pollutants (e.g., VOCs, SO , NO , CO, particulates) fromx x
many chemical industry sources.
The EPA Office of Air’s Aerometric Information Retrieval System (AIRS)contains a wide range of information related to stationary sources of airpollution, including the emissions of a number of air pollutants which may beof concern within a particular industry. With the exception of volatile organiccompounds (VOCs), there is little overlap with the TRI chemicals reportedabove. Exhibit 15 summarizes annual releases of carbon monoxide (CO),nitrogen dioxide (NO ), particulate matter of 10 microns or less (PM ), total2 10
particulate (PT), sulfur dioxide (SO2) and volatile organic compounds(VOCs).
Sector Notebook Project Inorganic Chemicals
September 1995 SIC 28149
Exhibit 15: Pollutant Releases (short tons/year)
Industry Sector CO NO PM PT SO VOC 2 10 2
Metal Mining 5,391 28,583 39,359 140,052 84,222 1,283
Electronics and Other 367 1,129 207 293 453 4,854 Electrical Equipment andComponents
Motor Vehicles, Bodies, 35,303 23,725 2,406 12,853 25,462 101,275 Parts and Accessories
Dry Cleaning 101 179 3 28 152 7,310
Source: U.S. EPA Office of Air and Radiation, AIRS Database, May 1995.
Sector Notebook Project Inorganic Chemicals
September 1995 SIC 28150
IV.D. Comparison of Toxic Release Inventory Between Selected Industries
The following information is presented as a comparison of pollutant releaseand transfer data across industrial categories. It is provided to give a generalsense as to the relative scale of releases and transfers within each sectorprofiled under this project. Please note that the following figure and table donot contain releases and transfers for industrial categories that are notincluded in this project, and thus cannot be used to draw conclusionsregarding the total release and transfer amounts that are reported to TRI.Similar information is available within the annual TRI Public Data ReleaseBook.
Exhibit 16 is a graphical representation of a summary of the 1993 TRI data forthe inorganic chemicals industry and the other sectors profiled in separatenotebooks. The bar graph presents the total TRI releases and total transferson the left axis and the triangle points show the average releases per facilityon the right axis. Industry sectors are presented in the order of increasingtotal TRI releases. The graph is based on the data shown in Exhibit 17 andis meant to facilitate comparisons between the relative amounts of releases,transfers, and releases per facility both within and between these sectors. Thereader should note, however, that differences in the proportion of facilitiescaptured by TRI exist between industry sectors. This can be a factor of poorSIC matching and relative differences in the number of facilities reporting toTRI from the various sectors. In the case of the inorganic chemicals, the 1993TRI data presented here covers 555 facilities. These facilities listed SIC 2812-2819 (inorganic chemicals) as a primary SIC code.
0
100
200
300
400
500
600
700
Tot
al P
ound
s (m
illio
ns)
0
200,000
400,000
600,000
800,000
1,000,000
Ave
rage
Rel
ease
s pe
r Fa
cilit
y (l
bs.)
3624
3227
252911
34371
33130
28626
281333, 334
Total Releases Total Transfers Avg. Releases/Facility
Sector Notebook Project Inorganic Chemicals
September 1995 SIC 28151
Exhibit 16: Summary of 1993 TRI Data: Releases and Transfers by Industry
SIC Industry Sector SIC Industry Sector SIC Industry SectorRange Range Range
36 Electronic Equipment and 2911 Petroleum Refining 286 Organic Chemical Mfg.Components
24 Lumber and Wood Products 34 Fabricated Metals 26 Pulp and Paper
32 Stone, Clay, and Concrete 371 Motor Vehicles, Bodies, 281 Inorganic Chemical Mfg.Parts, and Accessories
27 Printing 331 Iron and Steel 333,334 Nonferrous Metals
25 Wood Furniture and Fixtures 30 Rubber and Misc. Plastics
Sector Notebook Project Inorganic Chemicals
September 1995 SIC 28152
Exh
ibit
17:
Tox
ics
Rel
ease
Inv
ento
ry D
ata
for
Sele
cted
Ind
ustr
ies
1993
TR
I R
elea
ses
1993
TR
I T
rans
fers
Indu
stry
Sec
tor
SIC
Ran
ge
# T
RI
Fac
iliti
es
Tot
alR
elea
ses
(mill
ion
lbs.
)
Ave
rage
Rel
ease
spe
r F
acili
ty(p
ound
s)
Tot
alT
rans
fers
(mill
ion
lbs.
)
Ave
rage
Tra
nsfe
rspe
r F
acili
ty(p
ound
s)
Tot
al R
elea
ses
+ T
rans
fers
(mill
ion
lbs.
)
Ave
rage
Rel
ease
s+
Tra
nsfe
rs p
erF
acili
ty (
poun
ds)
Ston
e, C
lay,
and
Con
cret
e32
634
26.6
42,0
002.
24,
000
28.8
46,0
00
Lum
ber
and
Woo
d Pr
oduc
ts24
491
8.4
17,0
003.
57,
000
11.9
24,0
00
Furn
iture
and
Fix
ture
s25
313
42.2
135,
000
4.2
13,0
0046
.414
8,00
0
Prin
ting
2711
-278
931
836
.511
5,00
010
.232
,000
46.7
147,
000
Ele
ctro
nic
Equ
ip. a
ndC
ompo
nent
s36
406
6.7
17,0
0047
.111
6,00
053
.713
3,00
0
Rub
ber
and
Mis
c. P
last
ics
301,
579
118.
475
,000
4529
,000
163.
410
4,00
0
Mot
or V
ehic
les,
Bod
ies,
Part
s, a
nd A
cces
sori
es37
160
979
.313
0,00
014
5.5
239,
000
224.
836
9,00
0
Pulp
and
Pap
er26
11-2
631
309
169.
754
9,00
048
.415
7,00
021
8.1
706,
000
Inor
gani
c C
hem
. Mfg
.28
12-2
819
555
179.
632
4,00
070
126,
000
249.
745
0,00
0
Petr
oleu
m R
efin
ing
2911
156
64.3
412,
000
417.
52,
676,
000
481.
93,
088,
000
Fabr
icat
ed M
etal
s34
2,36
372
30,0
0019
5.7
83,0
0026
7.7
123,
000
Iron
and
Ste
el33
138
185
.822
5,00
060
9.5
1,60
0,00
069
5.3
1,82
5,00
0
Non
ferr
ous
Met
als
333,
334
208
182.
587
7,00
098
.247
2,00
028
0.7
1,34
9,00
0
Org
anic
Che
mic
al M
fg.
2861
-286
941
715
1.6
364,
000
286.
768
8,00
043
8.4
1,05
2,00
0
Met
al M
inin
g10
Indu
stry
sec
tor
not s
ubje
ct to
TR
I re
port
ing.
Non
met
al M
inin
g14
Indu
stry
sec
tor
not s
ubje
ct to
TR
I re
port
ing.
Dry
Cle
anin
g72
16In
dust
ry s
ecto
r no
t sub
ject
to T
RI
repo
rtin
g.
Sou
rce:
U.S
. EPA
, Tox
ics
Rel
ease
Inv
ento
ry D
atab
ase,
199
3.
Sector Notebook Project Inorganic Chemicals
September 1995 SIC 28153
V. POLLUTION PREVENTION OPPORTUNITIES
The best way to reduce pollution is to prevent it in the first place. Somecompanies have creatively implemented pollution prevention techniques thatimprove efficiency and increase profits while at the same time minimizeenvironmental impacts. This can be done in many ways such as reducingmaterial inputs, re-engineering processes to reuse by-products, improvingmanagement practices, and employing substitute toxic chemicals. Somesmaller facilities are able to actually get below regulatory thresholds just byreducing pollutant releases through aggressive pollution prevention policies.
In order to encourage these approaches, this section provides both generaland company-specific descriptions of some pollution prevention advances thathave been implemented within the inorganic chemical manufacturing industry.While the list is not exhaustive, it does provide core information that can beused as the starting point for facilities interested in beginning their ownpollution prevention projects. When possible, this section providesinformation from real activities that can, or are being implemented by thissector -- including a discussion of associated costs, time frames, and expectedrates of return. This section also provides the context (in terms of type ofindustry and/or type of process affected) in which the pollution preventiontechnique can effectively be used.
There have been numerous cases have where the chemical industry hassimultaneously reduced pollutant outputs and operating costs throughpollution prevention techniques. In the inorganic chemicals manufacturingsector, however, economically viable pollution prevention opportunities arenot as easily identified as in other sectors. The relatively small size and limitedresources of a typical inorganic chemical facility limits the number of feasiblepollution prevention options. The limited resources available to the industryeliminates many pollution prevention options that require significant capitalexpenditures such as process modifications and process redesign. In addition,the inorganic chemicals industry's products are primarily commodity chemicalsfor which the manufacturing processes have been developed over many years.Commodity chemical manufacturers redesign their processes infrequently sothat redesign of the reaction process or equipment is unlikely in the shortterm. In addition, the industry's process equipment has been amortized overlong periods of time making cost-effective process equipment improvementsscarce. As a result, pollution prevention in the inorganic chemicals industryis somewhat restricted to the less costly options, such as minor processmodifications, operational changes, raw material substitutions, and recycling.
Pollution prevention in the chemical industry in process specific. As such itis difficult to generalize about the relative merits of different pollutionprevention strategies. The age and size of the facility, and the type and
Sector Notebook Project Inorganic Chemicals
September 1995 SIC 28154
number of its processes will determine the most effective pollution preventionstrategy. Brief descriptions of some of the more widespread, general pollutionprevention techniques found to be effective at inorganic chemicals facilitiesare provided below. Many of these pollution prevention opportunities can beapplied to the petrochemical industry as a whole due to the many similarprocesses found throughout the industry. It should be noted that many of theideas identified below as pollution prevention opportunities, aimed at reducingwastes and reducing materials use, have been carried out by the chemicalsmanufacturing industry for many years as the primary means of improvingprocess efficiencies and increasing profits.
In chlor-alkali production, pollution prevention options have beendemonstrated for both the mercury cell and diaphragm cell processes;however, the best opportunity to reduce pollutant outputs, conserve energy,and reduce costs in the chlor-alkali industry are in the conversion to themembrane cell process. In terms of energy consumption, the membrane cellprocess uses only about 77 percent of that of the mercury cell process andabout 90 percent of that of the diaphragm cell process. The membrane cellprocess also generates significantly less airborne and waterborne pollutantsand solid wastes (see Section III.B. - Raw Material Inputs and PollutionOutputs).
Substitute raw materials. The substitution or elimination of some of the rawmaterials used in the manufacturing of inorganic chemicals can result insubstantial waste reductions and cost savings. Because impurities in the feedstream can be a major contributor to waste generation, one of the mostcommon substitutions is to use a higher purity feedstock. This can beaccomplished either by working with suppliers to get a higher quality feed orby installing purification equipment. Raw materials can also be substitutedwith less toxic and less water soluble materials to reduce water contamination,and with less volatile materials to reduce fugitive emissions. Sometimescertain raw materials can be eliminated all together. The need for rawmaterials that end up as wastes should be reexamined to determine if rawmaterials can be eliminated by modifying the process and improving control.
Improve reactor efficiencies. Since the chemical products are primarilycreated inside the process reactor, it can be the primary source for waste (off-spec) materials. One of the most important parameters dictating the reactorefficiency is the quality of mixing. A number of techniques can be used toimprove mixing, such as installing baffles in the reactor, a higher rpm motorfor the agitator, a different mixing blade design, multiple impellers, and pumprecirculation. The method used to introduce feed to the reactor can also havean effect on the quality of mixing. A feed distributor can be added to equalizeresidence time through the reactor, and feed streams can be added at a point
Sector Notebook Project Inorganic Chemicals
September 1995 SIC 28155
in time closer to the ideal reactant concentration. This will avoid secondaryreactions which form unwanted by-products.
Improve catalyst. The catalyst plays a critical role in the effectiveness ofchemical conversion in the reactor. Alternative chemical makeups andphysical characteristics can lead to substantial improvements in theeffectiveness and life of a catalyst. Different catalysts can also eliminate by-product formation. Noble metal catalysts can replace heavy metal catalyststo eliminate wastewater contaminated with heavy metals. The consumptionof catalysts can be reduced by using a more active form and emissions andeffluents generated during catalyst activation can be eliminated by obtainingthe catalyst in the active form.
Optimize processes. Process changes that optimize reactions and rawmaterials use can reduce waste generation and releases. Many larger facilitiesare using computer controlled systems which analyze the process continuouslyand respond more quickly and accurately than manual control systems. Thesesystems are often capable of automatic startups, shutdowns, and productchangeover which can bring the process to stable conditions quickly,minimizing the generation of off-spec wastes. Other process optimizationtechniques include: equalizing the reactor and storage tank vent lines duringbatch filling to minimize vent gas losses; sequencing the addition of reactantsand reagents to optimize yields and lower emissions; and optimizingsequences to minimize washing operations and cross-contamination ofsubsequent batches.
Reduce heat exchanger wastes and inefficiencies. Heat exchangers areoften the source of significant off-spec product wastes generated byoverheating the product closest to the tube walls. The best way to reduce off-spec product from overheating is by reducing the heat exchanger tube walltemperature. This can be accomplished through a number of techniqueswhich do not reduce the overall heat transferred such as: reducing the tubewall temperature and increasing the effective surface area of the heatexchanger; using staged heating by first heating with waste heat, then lowpressure steam, followed by superheated high pressure steam; monitor andprevent fouling of the heat exchanger tubes so that lower temperature heatsources can be used; using noncorroding tubes which will foul less quicklythan tubes that corrode.
Improve wastewater treatment and recycling. A large portion of theinorganic chemical industry's pollutants leave the facilities as wastewater orwastewater treatment system sludge. Improved treatment and minimizationof wastewater are effective pollution prevention opportunities that often donot require significant changes to the industrial processes. Modernwastewater treatment technologies such as ion exchange, electrolytic cells,
Sector Notebook Project Inorganic Chemicals
September 1995 SIC 28156
reverse osmosis, and improved distillation, evaporation, and dewatering canoften be added to existing treatment systems. Wastewater streams containingacids or metals can be concentrated enough to be sold commercially as aproduct by slightly altering the manufacturing process, adding processingsteps, and segregating wastewater streams. Furthermore, many wastewaterstreams can be reused within the same or different processes, significantlyreducing discharges to the wastewater treatment system. An ion exchangesystem installed in a mercury cell chlor-alkali plant reduced mercury by 99percent in the facility's effluent. An inorganic chemicals plant makingphotochemistry solution generated a wastewater containing silver.Electrolytic cells were installed that recovered 98 percent of the silver and anevaporator was added that concentrated the remaining liquid for disposalresulting in a 90 percent reduction in waste volume.
Prevent leaks and spills. The elimination of sources of leaks and spills canbe a very cost effective pollution prevention opportunity. Leaks and spills canbe prevented by installing seamless pumps and other "leakless" components,maintaining a preventative maintenance program, and maintaining a leakdetection program.
Improve inventory management and storage. Good inventorymanagement can reduce the generation of wastes by preventing materials fromexceeding their shelf life, preventing materials from being left over or notneeded, and reducing the likelihood of accidental releases of stored material.Designating a materials storage area, limiting traffic through the area, andgiving one person the responsibility to maintain and distribute materials canreduce materials use, and the contamination and dispersal of materials.
Exhibit 18 summarizes the above pollution prevention opportunities andprovides additional examples provided by the Chemical ManufacturersAssociation.
P Process inefficiencies result in the P Increase product yield to reduce by-generation of undesired by-products and product and co-product generation andco-products. Inefficiencies will require raw material requirements.larger volumes of raw materials andresult in additional secondary products. Inefficiencies can also increase fugitiveemissions and wastes generated throughmaterial handling.
P By-products and co-products are notfully utilized, generating material or P Identify uses and develop a saleswaste that must be managed. outlet. Collect information necessary to
firm up a purchase commitment such asminimum quality criteria, maximumimpurity levels that can be tolerated,and performance criteria.
Catalysts
Composition
Preparation and Handling
P The presence of heavy metals in P Catalysts comprised of noble metals,catalysts can result in contaminated because of their cost, are generallyprocess wastewater from catalyst recycled by both onsite and offsitehandling and separation. These wastes reclaimers.may require special treatment anddisposal procedures or facilities. Heavymetals can be inhibitory or toxic tobiological wastewater treatment units. Sludge from wastewater treatment unitsmay be classified as hazardous due toheavy metals content. Heavy metalsgenerally exhibit low toxicity thresholdsin aquatic environments and maybioaccumulate.
P Emissions or effluents are generated P Obtain catalyst in the active form.with catalyst activation or regeneration.
P Catalyst attrition and carry over P Develop a more robust catalyst or into product requires de-ashing support. facilities which are a likely source ofwastewater and solid waste.
P Provide in situ activation withappropriate processing/activationfacilities.
P Catalyst is spent and needs to be P In situ regeneration eliminatesreplaced. unloading/loading emissions and
P Pyrophoric catalyst needs to be kept P Use a nonpryrophoric catalyst. wet, resulting in liquid contaminated Minimize amount of water required towith metals. handle and store safely.
P Short catalyst life. P Study and identify catalyst
effluents versus offsite regeneration ordisposal.
deactivation mechanisms. Avoidconditions which promote thermal orchemical deactivation. By extendingcatalyst life, emissions and effluentsassociated with catalyst handling andregeneration can be reduced.
Effectiveness P Catalyzed reaction has by-product P Reduce catalyst consumption with aformation, incomplete conversion and more active form. A higherless-than-perfect yield. concentration of active ingredient or
P Catalyzed reaction has by-product P Improve reactor mixing/contacting toformation, incomplete conversion and increase catalyst effectiveness.less-than perfect yield.
increased surface area can reducecatalyst loadings.
P Use a more selective catalyst whichwill reduce the yield of undesired by-products.
P Develop a thorough understanding ofreaction to allow optimization of reactordesign. Include in the optimization,catalyst consumption and by-productyield.
Intermediate Products
Quantity and Quality P Intermediate reaction products or P Modify reaction sequence to reducechemical species, including trace levels amount or change composition ofof toxic constituents, may contribute to intermediates.process waste under both normal andupset conditions.
P Intermediates may contain toxic P Modify reaction sequence to changeconstituents or have characteristics that intermediate properties.are harmful to the environment. P Use equipment design and process
Temperature P High heat exchange tube temperatures P Select operating temperatures at orcause thermal cracking/decomposition of near ambient temperature whenevermany chemicals. These lower molecular possible.weight by-products are a source of "lightends" and fugitive emissions. High P Use lower pressure steam to lowerlocalized temperature gives rise to temperatures.polymerization of reactive monomers,resulting in "heavies" or "tars." such P Use intermediate exchangers to avoidmaterials can foul heat exchange contact with furnace tubes and walls.equipment or plug fixed-bed reactors,thereby requiring costly equipment P Use staged heating to minimizecleaning and production outage. product degradation and unwanted side
P Higher operating temperatures imply P Explore heat integration opportunities"heat input" usually via combustion (e.g., use waste heat to preheat materialswhich generates emissions. and reduce the amount of combustion
P Heat sources such as furnaces and P Use thermocompressor to upgradeboilers are a source of combustion low-pressure steam to avoid the needemissions. for additional boilers and furnaces.
P Vapor pressure increases with P If possible, cool materials beforeincreasing temperature. Loading/ sending to storage.unloading, tankage and fugitiveemissions generally increase with P Use hot process streams to reheatincreasing vapor pressure. feeds.
reactions.
P Use a super heat of high-pressuresteam in place of furnace.
P Monitor exchanger fouling tocorrelate process conditions whichincrease fouling, avoid conditions whichrapidly foul exchangers.
P Use online tube cleaning technologiesto keep tube surfaces clean to increaseheat transfer.
P Use scraped wall exchangers inviscous service.
P Use falling film reboiler, pumpedrecirculation reboiler or high-flux tubes.
P Water solubility of most chemicals P Use lower temperature (vacuumincreases with increasing temperature. processing).
P Add vent condensers to recovervapors in storage tanks or process.
P Add closed dome loading with vaporrecovery condensers.
Pressure P Fugitive emissions from equipment. P Equipment operating in vacuum
P Seal leakage potential due to pressure P Minimize operating pressure.differential.
P Gas solubility increases with higher P Determine whether gases can bepressures. recovered, compressed, and reused or
service is not a source of fugitives;however, leaks into the process requirecontrol when system is degassed.
require controls.
Corrosive Environment P Material contamination occurs from P Improve metallurgy or providecorrosion products. Equipment failures coating or lining.result in spills, leaks, and increasedmaintenance costs. P Neutralize corrosivity of materials
P Increased waste generation due to P Improve metallurgy or provideaddition of corrosion inhibitors or coating or lining or operate in a lessneutralization. corrosive environment.
contacting equipment.
P Use corrosion inhibitors.
P Improve metallurgy or providecoating or lining.
Batch vs. ContinuousOperations
P Vent gas lost during batch fill. PEqualize reactor and storage tank vent
P Waste generated by cleaning/purging P Use materials with low viscosity. of process equipment between Minimize equipment roughness.production batches.
P Process inefficiencies lower yield and P Sequence addition of reactants andincrease emissions. reagents to optimize yields and lower
P Continuous process fugitive emissions PDesign facility to readily allowand waste increase over time due to maintenance so as to avoid unexpectedequipment failure through a lack of equipment failure and resultant release.maintenance between turnarounds.
P Optimize product manufacturingsequence to minimize washingoperations and cross-contamination ofsubsequent batches.
emissions.
Process Operation/Design P Numerous processing steps create P Keep it simple. Make sure allwastes and opportunities for errors. operations are necessary. More
P Nonreactant materials (solvents, P Evaluate unit operation orabsorbents, etc.) create wastes. Each technologies (e.g., separation) that dochemical (including water) employed not require the addition of solvents orwithin the process introduces additional other nonreactant chemicals.potential waste sources; the compositiongenerated wastes also tends to becomemore complex.
operations and complexity only tend toincrease potential emission and wastesources.
P High conversion with low yield results P Recycle operations generally improvein wastes. overall use of raw materials and
chemicals, thereby increasing the yieldof desired products while at the sametime reducing the generation of wastes. A case-in-point is to operate at a lowerconversion per reaction cycle byreducing catalyst consumption,temperature, or residence time. Manytimes, this can result in a higherselectivity to desired products. The neteffect upon recycle of unreactedreagents is an increase in product yield,while at the same time reducing thequantities of spent catalyst and lessdesirable by-products.
Process Operation/Design P Non-regenerative treatment systems P Regenerative fixed bed treating orresult in increased waste versus desiccant operation (e.g., aluminumregenerative systems. oxide, silica, activated carbon,
molecular sieves, etc.) will generate lessquantities of solid or liquid waste thannonregenerative units (e.g., calciumchloride or activated clay). Withregenerative units though, emissionsduring bed activation and regenerationcan be significant. Further, sidereactions during activation/regenerationcan give rise to problematic pollutants.
Product
Process Chemistry
Product Formulation
P Insufficient R&D into alternative P R&D during process conception andreaction pathways may miss pollution laboratory studies should thoroughlyopportunities such as reducing waste or investigate alternatives in processeliminating a hazardous constituent. chemistry that affect pollution
P Product based on end-use performance P Reformulate products by substitutingmay have undesirable environmental different material or using a mixture ofimpacts or use raw materials or individual chemicals that meet end-usecomponents that generate excessive or performance specifications.hazardous wastes.
prevention.
Raw Materials
Purity P Impurities may produce unwanted by- P Use higher purity materials.products and waste. Toxic impurities,even in trace amounts, can make a waste P Purify materials before use and reusehazardous and therefore subject to strict if practical.and costly regulation.
P Excessive impurities may require more P Achieve balance between feed purity,processing and equipment to meet processing steps, product quality, andproduct specifications, increasing costs waste generation.and potential for fugitive emissions,leaks, and spills.
Purity (cont’d) P Specifying a purity greater than needed P Specify a purity no greater than whatby the process increases costs and can the process needs.generate more waste generation by thesupplier.
P Impurities in clean air can increase PUse pure oxygen.inert purges.
P Impurities may poison catalyst PInstall guard beds to protect catalysts.prematurely resulting in increasedwastes due to yield loss and morefrequent catalyst replacement.
Vapor Pressure P Higher vapor pressures increase P Use material with lower vaporfugitive emissions in material handling pressure.and storage. P High vapor pressure with low odor P Use materials with lower vaporthreshold materials can cause nuisance pressure and higher odor threshold.odors.
Water Solubility P Toxic or nonbiodegradable materials P Use less toxic or more biodegradablethat are water soluble may affect materials.wastewater treatment operation,efficiency, and cost.
P Higher solubility may increase P Use less soluble materials.potential for surface and groundwatercontamination and may require morecareful spill prevention, containment,and cleanup (SPCC) plans.
P Higher solubility may increase P Use less soluble materials.potential for storm water contaminationin open areas. P Prevent direct contact with storm
P Process wastewater associated with P Minimize water usage.water washing or hydrocarbon/waterphase separation will be impacted by P Reuse wash water.containment solubility in water. Appropriate wastewater treatment will P Determine optimum processbe impacted. conditions for phase separation.
water by diking or covering areas.
P Evaluate alternative separationtechnologies (coalescers, membranes,distillation, etc.)
Toxicity P Community and worker safety and P Use less toxic materials.health concerns result from routine andnonroutine emissions. Emissions P Reduce exposure through equipmentsources include vents, equipment leaks, design and process control. Usewastewater emissions, emergency systems which are passive forpressure relief, etc. emergency containment of toxic
P Surges or higher than normal P Use less toxic material.continuous levels of toxic materials canshock or miss wastewater biological P Reduce spills, leaks, and upsettreatment systems resulting in possible conditions through equipment andfines and possible toxicity in the process control.receiving water.
releases.
P Consider effect of chemicals onbiological treatment; provide unitpretreatment or diversion capacity toremove toxicity.
P Install surge capacity for flow andconcentration equalization.
Regulatory P Hazardous or toxic materials are P Use materials which are less toxic orstringently regulated. They may require hazardous.enhanced control and monitoring;increased compliance issues and P Use better equipment and processpaperwork for permits and record design to minimize or control releases;keeping; stricter control for handling, in some cases, meeting certainshipping, and disposal; higher sampling regulatory criteria will exempt a systemand analytical costs; and increased health from permitting or other regulatoryand safety costs. requirements.
Form of Supply P Small containers increase shipping P Use bulk supply, ship by pipeline, orfrequency which increases chances of use “jumbo” drums or sacks.material releases and waste residuesfrom shipping containers (including P In some cases, product may bewash waters). shipped out in the same containers the
P Nonreturnable containers may increase P Use returnable shipping containers orwaste. drums.
material supply was shipped in withoutwashing.
Handling and Storage P Physical state (solid, liquid, gaseous) P Use equipment and controlsmay raise unique environmental, safety, appropriate to the type of materials toand health issues with unloading control releases.operations and transfer to processequipment.
P Large inventories can lead to spills, P Minimize inventory by utilizing just-inherent safety issues and material in-time delivery.expiration.
Waste Streams
Quantity and Quality P Characteristics and sources of waste P Document sources and quantities ofstreams are unknown. waste streams prior to pollution
P Wastes are generated as part of the P Determine what changes in processprocess. conditions would lower waste
prevention assessment.
generation of toxicity.
P Determine if wastes can be recycledback into the process.
Composition P Hazardous or toxic constituents are P Evaluate whether different processfound in waste streams. Examples are: conditions, routes, or reagent chemicalssulfides, heavy metals, halogenated (e.g., solvent catalysts) can behydrocarbons, and polynuclear substituted or changed to reduce oraromatics. eliminate hazardous or toxic
compounds.
Properties P Environmental fate and waste P Evaluate waste characteristics usingproperties are not known or understood. the following type properties:
corrosivity, ignitability, reactivity, BTUcontent (energy recovery),biodegradability, aquatic toxicity, andbioaccumulation potential of the wasteand of its degradable products, andwhether it is a solid, liquid, or gas.
Disposal P Ability to treat and manage hazardous P Consider and evaluate all onsite andand toxic waste unknown or limited. offsite recycle, reuse, treatment, and
disposal options available. Determineavailability of facilities to treat ormanage wastes generated.
Source: Chemical Manufacturers Association. Designing Pollution Prevention into the Process, Research, Development andEngineering.
Sector Notebook Project Inorganic Chemicals
September 1995 SIC 28166
Exhibit 19: Modifications to Equipment Can Also Prevent Pollution
Possible Approach
Equipment Environment Problem Related RelatedPotential Design Operational
Compressors, P Shaft seal leaks P Seal-less designs P Preventive maintenanceblowers, fans Piston rod seal leaks (diaphragmatic, hermetic or program
Vent streams magnetics)
P Design for low emissions(internal balancing, doubleinlet, gland eductors)
P Shaft seal designs (carbonrings, double mechanicalseals, buffered seals)
P Double seal with barrierfluid vented to control device
Concrete pads, P Leaks to groundwater P Water stops P Reduce unnecessaryfloors, sumps purges, transfers, and
P Embedded metal plates sampling
P Epoxy sealing
P Other impervious sealing necessaryP Use drip pans where
Controls P Shutdowns and Start-ups P Improve on-line controls P Continuous versus batchgenerate waste and releases
P On-line instrumentation P Optimize on-line run time
P Automatic start-up and P Optimize shutdownshutdown interlock inspection
P On-line vibration analysis P Identify safety and
P Use "consensus" systems instruments and equipment(e.g., shutdown trip requirestwo out of three affirmativeresponses)
frequency
environment critical
Distillation P Impurities remain in P Increase reflux ratio P Change column operatingprocess streams conditions
P Add section to column - reflux ratio
P Column intervals - temperature
P Change feed tray - etc.
- feed tray
- pressure
Sector Notebook Project Inorganic Chemicals
September 1995 SIC 28167
Exhibit 19 (cont.): Modifications to Equipment Can Also Prevent Pollution
Possible Approach
Equipment Environment Problem Related RelatedPotential Design Operational
Distillation P Impurities remain in P Insulate to prevent heat loss P Clean column to reduce(cont’d) process streams (cont’d) fouling
P Preheat column feed
P Increase vapor line size tolower pressure drop
P Large amounts of stripping agents steamcontaminated watercondensage from streamstripping
P Use reboilers or inert gas P Use higher temperature
General P Contaminated rainwater P Provide roof over process P Return samples to processmanufacturing facilitiesequipment areas
P Contaminated sprinkler P Seal floorsand fire water
P Leaks and emissions P Design for cleaning P Use drip pans forduring cleaning maintenance activities
P Segregate process sewer P Monitor stormwaterfrom storm sewer (diking) discharge
P Hard-pipe process streamsto process sewer
P Drain to sump
P Route to waste treatment
P Design for minimum rinsing
P Design for minimum sludge
P Provide vapor enclosure
P Drain to process
P Rinse to sump
P Reuse cleaning solutions
Sector Notebook Project Inorganic Chemicals
September 1995 SIC 28168
Exhibit 19 (cont.): Modifications to Equipment Can Also Prevent Pollution
Possible Approach
Equipment Environment Problem Related RelatedPotential Design Operational
Heat exchangers P Increased waste due to P Use intermediate P Select operatinghigh localized temperatures exchangers to avoid contact temperatures at or near
with furnace tubes and walls ambient temperature when-
P Use staged heating to generally most desirableminimize product degradation from a pollution preventionand unwanted side reactions. standpoint(waste heat >>low pressuresteam >>high pressure steam) P Use lower pressure steam
ever possible. These are
to lower temperatures
Piping P Leaks to groundwater P Design equipment layout so P Monitor for corrosion and
P Contaminated materials surfaces cleandue to tubes leaking at tubesheets P Use welded tubes or double P Monitor for leaks
P Furnace emissions Mount vertically
Fugitive emissions as to minimize pipe run erosion
P Use scraped wall P Monitor exchangerexchangers in viscous service fouling to correlate process
P Using falling film reboiler, fouling, avoid conditionspiped recirculation reboiler or which rapidly foulhigh-flux tubes exchangers
P Use lowest pressure steam P Use on-line tube cleaningpossible techniques to keep tube
tube sheets with inert purge.
P Use super heat of high-pressure steam in place of afurnace
length
P Eliminate underground P Paint to prevent externalpiping or design for cathodic corrosionprotection if necessary toinstall piping underground
P Use welded fittings
P Reduce number of flangesand valves
conditions which increase
Sector Notebook Project Inorganic Chemicals
September 1995 SIC 28169
Exhibit 19 (cont.): Modifications to Equipment Can Also Prevent Pollution
Possible Approach
Equipment Environment Problem Related RelatedPotential Design Operational
Piping (cont’d) P Leaks to groundwater P Use all welded pipeFugitive emissions (cont’d)
P Releases when cleaning P Use "pigs" for cleaning P Flush to product storageor purging lines tank
P Use secondary containment
P Use spiral-wound gaskets
P Use plugs and doublevalves for open end lines
P Change metallurgy
P Use lined pipe
P Slope to low point drain
P Use heat tracing andinsulation to prevent freezing
P Install equalizer lines
Pumps P Fugitive emissions from P Mechanical seal in lieu of P Seal installation practicesshaft seal leaks packing
P Fugitive emissions from P Use pressure transfer toshaft seal leaks eliminate pump
P Residual "heel" of liquid P Low point drain on pump P Flush casing to processduring pump maintenance casing sewer for treatment
P Double mechanical sealwith inert barrier fluid
P Double machined seal withbarrier fluid vented to controldevice
P Seal-less pump (cannedmotor magnetic drive)
P Vertical pump
P Monitor for leaks
Sector Notebook Project Inorganic Chemicals
September 1995 SIC 28170
Exhibit 19 (cont.): Modifications to Equipment Can Also Prevent Pollution
Possible Approach
Equipment Environment Problem Related RelatedPotential Design Operational
Pumps (cont’d) P Injection of seal flush P Use double mechanical seal P Increase the mean time
Reactors P Poor conversion or P Static mixing P Add ingredients with
fluid into process stream with inert barrier fluid where between pump failures by:
performance due to optimum sequenceinadequate mixing P Add baffles
practical - selecting proper seal
P Change impellers
material;- aligning well;- reducing pipe-induced stress;- maintaining seal lubrication
P Waste by-product P Provide separate reactor for P Optimize reactionformation converting recycle streams to conditions (temperature,
P Add horsepower P Allow proper head space
P Add distributor effect
usable products pressure, etc.)
in reactor to enhance vortex
Relief Valve P Leaks P Provide upstream rupture
P Fugitive emissions P Vent to control or recovery P Monitor for leaks and for
P Discharge to environment P Pump discharges to suction P Monitor for leaksfrom over pressure of pump
P Frequent relief P Use pilot operated relief P Reduce operating
disc
device control efficiency
P Thermal relief to tanks
P Avoid discharge to roofareas to preventcontamination of rainwater
valve pressure
P Increase margin between P Review systemdesign and operating pressure performance
Exhibit 19 (cont.): Modifications to Equipment Can Also Prevent Pollution
Sector Notebook Project Inorganic Chemicals
September 1995 SIC 28171
Possible Approach
Equipment Environment Problem Related RelatedPotential Design Operational
Sampling P Waste generation due to P On line in situ analyzers P Reduce number and sizesampling (disposal, of samples requiredcontainers, leaks, fugitives, P System for return to processetc.) P Sample at the lowest
P Closed loop possible temperature
P Drain to sump P Cool before sampling
Tanks P Tank breathing and P Cool materials before P Optimize storageworking losses storage conditions to reduce losses
P Insulate tanks
P Vent to control device(flare, condenser, etc.)
P Vapor balancing
P Floating roof
P Leak to groundwater P All aboveground (situated P Monitor for leaks and
P Large waste heel P Design for 100 percent de- P Recycle to process if
P Floating roof
P Higher design pressure
so bottom can routinely be corrosionchecked for leads)
P Secondary containment
P Improve corrosionresistance
inventory practical
Vacuum Systems P Waste discharge from jets P Substitute mechanical P Monitor for air leaksvacuum pump
P Evaluate using process fluid P Recycle condensate tofor powering jet process
Sector Notebook Project Inorganic Chemicals
September 1995 SIC 28172
Exhibit 19 (cont.): Modifications to Equipment Can Also Prevent Pollution
Possible Approach
Equipment Environment Problem Related RelatedPotential Design Operational
Valves P Fugitive emissions from P Bellow seals P Stringent adherence toleaks packing procedures
P Reduce number wherepractical
P Special packing sets
Vents P Release to environment P Route to control or recovery P Monitor performancedevice
Source: Chemical Manufacturers Association. Designing Pollution Prevention into the Process, Research, Development andEngineering.
It is critical to emphasize that pollution prevention in the chemical industry isprocess specific and oftentimes constrained by site-specific considerations.As such, it is difficult to generalize about the relative merits of differentpollution prevention strategies. The age, size, and purpose of the plant willinfluence the most effective pollution prevention strategy. Commoditychemical manufacturers redesign their processes infrequently so that redesignof the reaction process or equipment is unlikely in the short term. Here,operational changes are the most feasible response. Specialty chemicalmanufacturers are making a greater variety of chemicals and have moreprocess and design flexibility. Incorporating changes at the earlier researchand development phases may be possible for them.
Sector Notebook Project Inorganic Chemicals
September 1995 SIC 28173
VI. SUMMARY OF APPLICABLE FEDERAL STATUTES AND REGULATIONS
This section discusses the Federal regulations that may apply to this sector.The purpose of this section is to highlight, and briefly describe the applicableFederal requirements, and to provide citations for more detailed information.The three following sections are included.
C Section VI.A. contains a general overview of major statutesC Section VI.B. contains a list of regulations specific to this industryC Section VI.C. contains a list of pending and proposed regulations
The descriptions within Section VI are intended solely for generalinformation. Depending upon the nature or scope of the activities at aparticular facility, these summaries may or may not necessarily describe allapplicable environmental requirements. Moreover, they do not constituteformal interpretations or clarifications of the statutes and regulations. Forfurther information, readers should consult the Code of Federal Regulationsand other state or local agencies. EPA Hotline contacts are also provided foreach major statute.
VI.A. General Description of Major Statutes
Resource Conservation And Recovery Act
The Resource Conservation And Recovery Act (RCRA) of 1976 whichamended the Solid Waste Disposal Act, addresses solid (Subtitle D) andhazardous (Subtitle C) waste management activities. The Hazardous andSolid Waste Amendments (HSWA) of 1984 strengthened RCRA’s wastemanagement provisions and added Subtitle I, which governs undergroundstorage tanks (USTs).
Regulations promulgated pursuant to Subtitle C of RCRA (40 CFR Parts260-299) establish a “cradle-to-grave” system governing hazardous wastefrom the point of generation to disposal. RCRA hazardous wastes include thespecific materials listed in the regulations (commercial chemical products,designated with the code "P" or "U"; hazardous wastes from specificindustries/sources, designated with the code "K"; or hazardous wastes fromnon-specific sources, designated with the code "F") or materials which exhibita hazardous waste characteristic (ignitability, corrosivity, reactivity, or toxicityand designated with the code "D").
Regulated entities that generate hazardous waste are subject to wasteaccumulation, manifesting, and record keeping standards. Facilities that treat,store, or dispose of hazardous waste must obtain a permit, either from EPAor from a State agency which EPA has authorized to implement the permittingprogram. Subtitle C permits contain general facility standards such as
Sector Notebook Project Inorganic Chemicals
September 1995 SIC 28174
contingency plans, emergency procedures, record keeping and reportingrequirements, financial assurance mechanisms, and unit-specific standards.RCRA also contains provisions (40 CFR Part 264 Subpart S and §264.10) forconducting corrective actions which govern the cleanup of releases ofhazardous waste or constituents from solid waste management units atRCRA-regulated facilities.
Although RCRA is a Federal statute, many States implement the RCRAprogram. Currently, EPA has delegated its authority to implement variousprovisions of RCRA to 46 of the 50 States.
Most RCRA requirements are not industry specific but apply to any companythat transports, treats, stores, or disposes of hazardous waste. Here are someimportant RCRA regulatory requirements:
C Identification of Solid and Hazardous Wastes (40 CFR Part 261)lays out the procedure every generator should follow to determinewhether the material created is considered a hazardous waste, solidwaste, or is exempted from regulation.
C Standards for Generators of Hazardous Waste (40 CFR Part 262)establishes the responsibilities of hazardous waste generators includingobtaining an ID number, preparing a manifest, ensuring properpackaging and labeling, meeting standards for waste accumulationunits, and record keeping and reporting requirements. Generators canaccumulate hazardous waste for up to 90 days (or 180 days dependingon the amount of waste generated) without obtaining a permit.
C Land Disposal Restrictions (LDRs) are regulations prohibiting thedisposal of hazardous waste on land without prior treatment. Underthe LDRs (40 CFR 268), materials must meet land disposal restriction(LDR) treatment standards prior to placement in a RCRA landdisposal unit (landfill, land treatment unit, waste pile, or surfaceimpoundment). Wastes subject to the LDRs include solvents,electroplating wastes, heavy metals, and acids. Generators of wastesubject to the LDRs must provide notification of such to thedesignated TSD facility to ensure proper treatment prior to disposal.
C Used Oil storage and disposal regulations (40 CFR Part 279) do notdefine Used Oil Management Standards impose managementrequirements affecting the storage, transportation, burning,processing, and re-refining of the used oil. For parties that merelygenerate used oil, regulations establish storage standards. For a partyconsidered a used oil marketer (one who generates and sells
Sector Notebook Project Inorganic Chemicals
September 1995 SIC 28175
off-specification used oil directly to a used oil burner), additionaltracking and paperwork requirements must be satisfied.
C Tanks and Containers used to store hazardous waste with a highvolatile organic concentration must meet emission standards underRCRA. Regulations (40 CFR Part 264-265, Subpart CC) requiregenerators to test the waste to determine the concentration of thewaste, to satisfy tank and container emissions standards, and toinspect and monitor regulated units. These regulations apply to allfacilities who store such waste, including generators operating underthe 90-day accumulation rule.
C Underground Storage Tanks (USTs) containing petroleum andhazardous substance are regulated under Subtitle I of RCRA. SubtitleI regulations (40 CFR Part 280) contain tank design and releasedetection requirements, as well as financial responsibility andcorrective action standards for USTs. The UST program alsoestablishes increasingly stringent standards, including upgraderequirements for existing tanks, that must be met by 1998.
C Boilers and Industrial Furnaces (BIFs) that use or burn fuelcontaining hazardous waste must comply with strict design andoperating standards. BIF regulations (40 CFR Part 266, Subpart H)address unit design, provide performance standards, require emissionsmonitoring, and restrict the type of waste that may be burned.
EPA's RCRA/Superfund/UST Hotline, at (800) 424-9346, responds toquestions and distributes guidance regarding all RCRA regulations. TheRCRA Hotline operates weekdays from 8:30 a.m. to 7:30 p.m., ET, excludingFederal holidays.
Comprehensive Environmental Response, Compensation, And Liability Act
The Comprehensive Environmental Response, Compensation, and LiabilityAct (CERCLA), a 1980 law commonly known as Superfund, authorizes EPAto respond to releases, or threatened releases, of hazardous substances thatmay endanger public health, welfare, or the environment. CERCLA alsoenables EPA to force parties responsible for environmental contamination toclean it up or to reimburse the Superfund for response costs incurred by EPA.The Superfund Amendments and Reauthorization Act (SARA) of 1986revised various sections of CERCLA, extended the taxing authority for theSuperfund, and created a free-standing law, SARA Title III, also known as theEmergency Planning and Community Right-to-Know Act (EPCRA).
The CERCLA hazardous substance release reporting regulations (40 CFRPart 302) direct the person in charge of a facility to report to the National
Sector Notebook Project Inorganic Chemicals
September 1995 SIC 28176
Response Center (NRC) any environmental release of a hazardous substancewhich exceeds a reportable quantity. Reportable quantities are defined andlisted in 40 CFR §302.4. A release report may trigger a response by EPA, orby one or more Federal or State emergency response authorities.
EPA implements hazardous substance responses according to proceduresoutlined in the National Oil and Hazardous Substances Pollution ContingencyPlan (NCP) (40 CFR Part 300). The NCP includes provisions for permanentcleanups, known as remedial actions, and other cleanups referred to as"removals." EPA generally takes remedial actions only at sites on theNational Priorities List (NPL), which currently includes approximately 1300sites. Both EPA and states can act at other sites; however, EPA providesresponsible parties the opportunity to conduct removal and remedial actionsand encourages community involvement throughout the Superfund responseprocess.
EPA's RCRA/Superfund/UST Hotline, at (800) 424-9346, answers questionsand references guidance pertaining to the Superfund program. The CERCLAHotline operates weekdays from 8:30 a.m. to 7:30 p.m., ET, excludingFederal holidays.
Emergency Planning And Community Right-To-Know Act
The Superfund Amendments and Reauthorization Act (SARA) of 1986created the Emergency Planning and Community Right-to-Know Act(EPCRA, also known as SARA Title III), a statute designed to improvecommunity access to information about chemical hazards and to facilitate thedevelopment of chemical emergency response plans by State and localgovernments. EPCRA required the establishment of State emergencyresponse commissions (SERCs), responsible for coordinating certainemergency response activities and for appointing local emergency planningcommittees (LEPCs).
EPCRA and the EPCRA regulations (40 CFR Parts 350-372) establish fourtypes of reporting obligations for facilities which store or manage specifiedchemicals:
C EPCRA §302 requires facilities to notify the SERC and LEPC of thepresence of any "extremely hazardous substance" (the list of suchsubstances is in 40 CFR Part 355, Appendices A and B) if it has suchsubstance in excess of the substance's threshold planning quantity, anddirects the facility to appoint an emergency response coordinator.
C EPCRA §304 requires the facility to notify the SERC and the LEPCin the event of a release exceeding the reportable quantity of a
Sector Notebook Project Inorganic Chemicals
September 1995 SIC 28177
CERCLA hazardous substance or an EPCRA extremely hazardoussubstance.
C EPCRA §311 and §312 require a facility at which a hazardouschemical, as defined by the Occupational Safety and Health Act, ispresent in an amount exceeding a specified threshold to submit to theSERC, LEPC and local fire department material safety data sheets(MSDSs) or lists of MSDS's and hazardous chemical inventory forms(also known as Tier I and II forms). This information helps the localgovernment respond in the event of a spill or release of the chemical.
C EPCRA §313 requires manufacturing facilities included in SIC codes20 through 39, which have ten or more employees, and whichmanufacture, process, or use specified chemicals in amounts greaterthan threshold quantities, to submit an annual toxic chemical releasereport. This report, commonly known as the Form R, covers releasesand transfers of toxic chemicals to various facilities and environmentalmedia, and allows EPA to compile the national Toxic ReleaseInventory (TRI) database.
All information submitted pursuant to EPCRA regulations is publiclyaccessible, unless protected by a trade secret claim.
EPA's EPCRA Hotline, at (800) 535-0202, answers questions and distributesguidance regarding the emergency planning and community right-to-knowregulations. The EPCRA Hotline operates weekdays from 8:30 a.m. to 7:30p.m., ET, excluding Federal holidays.
Clean Water Act
The primary objective of the Federal Water Pollution Control Act, commonlyreferred to as the Clean Water Act (CWA), is to restore and maintain thechemical, physical, and biological integrity of the nation's surface waters.Pollutants regulated under the CWA include "priority" pollutants, includingvarious toxic pollutants; "conventional" pollutants, such as biochemicaloxygen demand (BOD), total suspended solids (TSS), fecal coliform, oil andgrease, and pH; and "non-conventional" pollutants, including any pollutant notidentified as either conventional or priority.
The CWA regulates both direct and indirect discharges. The NationalPollutant Discharge Elimination System (NPDES) program (CWA §402)controls direct discharges into navigable waters. Direct discharges or "pointsource" discharges are from sources such as pipes and sewers. NPDESpermits, issued by either EPA or an authorized State (EPA has authorizedapproximately forty States to administer the NPDES program), containindustry-specific, technology-based and/or water quality-based limits, and
Sector Notebook Project Inorganic Chemicals
September 1995 SIC 28178
establish pollutant monitoring requirements. A facility that intends todischarge into the nation's waters must obtain a permit prior to initiating itsdischarge. A permit applicant must provide quantitative analytical dataidentifying the types of pollutants present in the facility's effluent. The permitwill then set forth the conditions and effluent limitations under which a facilitymay make a discharge.
A NPDES permit may also include discharge limits based on Federal or Statewater quality criteria or standards, that were designed to protect designateduses of surface waters, such as supporting aquatic life or recreation. Thesestandards, unlike the technological standards, generally do not take intoaccount technological feasibility or costs. Water quality criteria and standardsvary from State to State, and site to site, depending on the use classificationof the receiving body of water. Most States follow EPA guidelines whichpropose aquatic life and human health criteria for many of the 126 prioritypollutants.
Storm Water Discharges
In 1987 the CWA was amended to require EPA to establish a program toaddress storm water discharges. In response, EPA promulgated the NPDESstorm water permit application regulations. Storm water discharge associatedwith industrial activity means the discharge from any conveyance which isused for collecting and conveying storm water and which is directly related tomanufacturing, processing, or raw materials storage areas at an industrialplant (40 CFR 122.26(b)(14)). These regulations require that facilities withthe following storm water discharges apply for an NPDES permit: (1) adischarge associated with industrial activity; (2) a discharge from a large ormedium municipal storm sewer system; or (3) a discharge which EPA or theState determines to contribute to a violation of a water quality standard or isa significant contributor of pollutants to waters of the United States.
The term "storm water discharge associated with industrial activity" means astorm water discharge from one of 11 categories of industrial activity definedat 40 CFR 122.26. Six of the categories are defined by SIC codes while theother five are identified through narrative descriptions of the regulatedindustrial activity. If the primary SIC code of the facility is one of thoseidentified in the regulations, the facility is subject to the storm water permitapplication requirements. If any activity at a facility is covered by one of thefive narrative categories, storm water discharges from those areas where theactivities occur are subject to storm water discharge permit applicationrequirements.Those facilities/activities that are subject to storm water discharge permitapplication requirements are identified below. To determine whether aparticular facility falls within one of these categories, the regulation should beconsulted.
Sector Notebook Project Inorganic Chemicals
September 1995 SIC 28179
Category i: Facilities subject to storm water effluent guidelines, new sourceperformance standards, or toxic pollutant effluent standards.
Category ii: Facilities classified as SIC 24-lumber and wood products(except wood kitchen cabinets); SIC 26-paper and allied products (exceptpaperboard containers and products); SIC 28-chemicals and allied products(except drugs and paints); SIC 291-petroleum refining; and SIC 311-leathertanning and finishing.
Category iii: Facilities classified as SIC 10-metal mining; SIC 12-coalmining; SIC 13-oil and gas extraction; and SIC 14-nonmetallic mineral mining.
Category iv: Hazardous waste treatment, storage, or disposal facilities.
Category v: Landfills, land application sites, and open dumps that receive orhave received industrial wastes.
Category vi: Facilities classified as SIC 5015-used motor vehicle parts; andSIC 5093-automotive scrap and waste material recycling facilities.
Category vii: Steam electric power generating facilities.
Category viii: Facilities classified as SIC 40-railroad transportation; SIC 41-local passenger transportation; SIC 42-trucking and warehousing (exceptpublic warehousing and storage); SIC 43-U.S. Postal Service; SIC 44-watertransportation; SIC 45-transportation by air; and SIC 5171-petroleum bulkstorage stations and terminals.
Category ix: Sewage treatment works.
Category x: Construction activities except operations that result in thedisturbance of less than five acres of total land area.
Category xi: Facilities classified as SIC 20-food and kindred products; SIC21-tobacco products; SIC 22-textile mill products; SIC 23-apparel relatedproducts; SIC 2434-wood kitchen cabinets manufacturing; SIC 25-furnitureand fixtures; SIC 265-paperboard containers and boxes; SIC 267-convertedpaper and paperboard products; SIC 27-printing, publishing, and alliedindustries; SIC 283-drugs; SIC 285-paints, varnishes, lacquer, enamels, andallied products; SIC 30-rubber and plastics; SIC 31-leather and leatherproducts (except leather and tanning and finishing); SIC 323-glass products;SIC 34-fabricated metal products (except fabricated structural metal); SIC 35-industrial and commercial machinery and computer equipment; SIC 36-electronic and other electrical equipment and components; SIC 37-
Sector Notebook Project Inorganic Chemicals
September 1995 SIC 28180
transportation equipment (except ship and boat building and repairing); SIC38-measuring, analyzing, and controlling instruments; SIC 39-miscellaneousmanufacturing industries; and SIC 4221-4225-public warehousing andstorage.
Pretreatment Program
Another type of discharge that is regulated by the CWA is one that goes to apublicly-owned treatment works (POTWs). The national pretreatmentprogram (CWA §307(b)) controls the indirect discharge of pollutants toPOTWs by "industrial users." Facilities regulated under §307(b) must meetcertain pretreatment standards. The goal of the pretreatment program is toprotect municipal wastewater treatment plants from damage that may occurwhen hazardous, toxic, or other wastes are discharged into a sewer systemand to protect the quality of sludge generated by these plants. Discharges toa POTW are regulated primarily by the POTW itself, rather than the State orEPA.
EPA has developed technology-based standards for industrial users ofPOTWs. Different standards apply to existing and new sources within eachcategory. "Categorical" pretreatment standards applicable to an industry ona nationwide basis are developed by EPA. In addition, another kind ofpretreatment standard, "local limits," are developed by the POTW in order toassist the POTW in achieving the effluent limitations in its NPDES permit.
Regardless of whether a State is authorized to implement either the NPDESor the pretreatment program, if it develops its own program, it may enforcerequirements more stringent than Federal standards.
EPA’s Office of Water, at (202) 260-5700, will direct callers with questionsabout the CWA to the appropriate EPA office. EPA also maintains abibliographic database of Office of Water publications which can beaccessed through the Ground Water and Drinking Water resource center, at(202) 260-7786.
Safe Drinking Water Act
The Safe Drinking Water Act (SDWA) mandates that EPA establishregulations to protect human health from contaminants in drinking water. Thelaw authorizes EPA to develop national drinking water standards and tocreate a joint Federal-State system to ensure compliance with these standards.The SDWA also directs EPA to protect underground sources of drinkingwater through the control of underground injection of liquid wastes.
EPA has developed primary and secondary drinking water standards under itsSDWA authority. EPA and authorized States enforce the primary drinking
Sector Notebook Project Inorganic Chemicals
September 1995 SIC 28181
water standards, which are, contaminant-specific concentration limits thatapply to certain public drinking water supplies. Primary drinking waterstandards consist of maximum contaminant level goals (MCLGs), which arenon-enforceable health-based goals, and maximum contaminant levels(MCLs), which are enforceable limits set as close to MCLGs as possible,considering cost and feasibility of attainment.
The SDWA Underground Injection Control (UIC) program (40 CFR Parts144-148) is a permit program which protects underground sources of drinkingwater by regulating five classes of injection wells. UIC permits includedesign, operating, inspection, and monitoring requirements. Wells used toinject hazardous wastes must also comply with RCRA corrective actionstandards in order to be granted a RCRA permit, and must meet applicableRCRA land disposal restrictions standards. The UIC permit program isprimarily State-enforced, since EPA has authorized all but a few States toadminister the program.
The SDWA also provides for a Federally-implemented Sole Source Aquiferprogram, which prohibits Federal funds from being expended on projects thatmay contaminate the sole or principal source of drinking water for a givenarea, and for a State-implemented Wellhead Protection program, designed toprotect drinking water wells and drinking water recharge areas.
EPA’s Safe Drinking Water Hotline, at (800) 426-4791, answers questionsand distributes guidance pertaining to SDWA standards. The Hotlineoperates from 9:00 a.m. through 5:30 p.m., ET, excluding Federal holidays.
Toxic Substances Control Act
The Toxic Substances Control Act (TSCA) granted EPA authority to createa regulatory framework to collect data on chemicals in order to evaluate,assess, mitigate, and control risks which may be posed by their manufacture,processing, and use. TSCA provides a variety of control methods to preventchemicals from posing unreasonable risk.
TSCA standards may apply at any point during a chemical’s life cycle. UnderTSCA §5, EPA has established an inventory of chemical substances. If achemical is not already on the inventory, and has not been excluded by TSCA,a premanufacture notice (PMN) must be submitted to EPA prior tomanufacture or import. The PMN must identify the chemical and provideavailable information on health and environmental effects. If available data arenot sufficient to evaluate the chemicals effects, EPA can impose restrictionspending the development of information on its health and environmentaleffects. EPA can also restrict significant new uses of chemicals based uponfactors such as the projected volume and use of the chemical.
Sector Notebook Project Inorganic Chemicals
September 1995 SIC 28182
Under TSCA §6, EPA can ban the manufacture or distribution in commerce,limit the use, require labeling, or place other restrictions on chemicals thatpose unreasonable risks. Among the chemicals EPA regulates under §6authority are asbestos, chlorofluorocarbons (CFCs), and polychlorinatedbiphenyls (PCBs).
EPA’s TSCA Assistance Information Service, at (202) 554-1404, answersquestions and distributes guidance pertaining to Toxic Substances ControlAct standards. The Service operates from 8:30 a.m. through 4:30 p.m., ET,excluding Federal holidays.
Clean Air Act
The Clean Air Act (CAA) and its amendments, including the Clean Air ActAmendments (CAAA) of 1990, are designed to “protect and enhance thenation's air resources so as to promote the public health and welfare and theproductive capacity of the population.” The CAA consists of six sections,known as Titles, which direct EPA to establish national standards for ambientair quality and for EPA and the States to implement, maintain, and enforcethese standards through a variety of mechanisms. Under the CAAA, manyfacilities will be required to obtain permits for the first time. State and localgovernments oversee, manage, and enforce many of the requirements of theCAAA. CAA regulations appear at 40 CFR Parts 50 through 99.
Pursuant to Title I of the CAA, EPA has established national ambient airquality standards (NAAQSs) to limit levels of "criteria pollutants," includingcarbon monoxide, lead, nitrogen dioxide, particulate matter, ozone, and sulfurdioxide. Geographic areas that meet NAAQSs for a given pollutant areclassified as attainment areas; those that do not meet NAAQSs are classifiedas non-attainment areas. Under §110 of the CAA, each State must developa State Implementation Plan (SIP) to identify sources of air pollution and todetermine what reductions are required to meet Federal air quality standards.
Title I also authorizes EPA to establish New Source Performance Standards(NSPSs), which are nationally uniform emission standards for new stationarysources falling within particular industrial categories. NSPSs are based on thepollution control technology available to that category of industrial source butallow the affected industries the flexibility to devise a cost-effective means ofreducing emissions.
Under Title I, EPA establishes and enforces National Emission Standards forHazardous Air Pollutants (NESHAPs), nationally uniform standards orientedtowards controlling particular hazardous air pollutants (HAPs). Title III ofthe CAAA further directed EPA to develop a list of sources that emit any of189 HAPs, and to develop regulations for these categories of sources. Todate EPA has listed 174 categories and developed a schedule for the
Sector Notebook Project Inorganic Chemicals
September 1995 SIC 28183
establishment of emission standards. The emission standards will bedeveloped for both new and existing sources based on "maximum achievablecontrol technology" (MACT). The MACT is defined as the controltechnology achieving the maximum degree of reduction in the emission of theHAPs, taking into account cost and other factors.
Title II of the CAA pertains to mobile sources, such as cars, trucks, buses,and planes. Reformulated gasoline, automobile pollution control devices, andvapor recovery nozzles on gas pumps are a few of the mechanisms EPA usesto regulate mobile air emission sources.
Title IV establishes a sulfur dioxide emissions program designed to reduce theformation of acid rain. Reduction of sulfur dioxide releases will be obtainedby granting to certain sources limited emissions allowances, which, beginningin 1995, will be set below previous levels of sulfur dioxide releases.
Title V of the CAAA of 1990 created a permit program for all "majorsources" (and certain other sources) regulated under the CAA. One purposeof the operating permit is to include in a single document all air emissionsrequirements that apply to a given facility. States are developing the permitprograms in accordance with guidance and regulations from EPA. Once aState program is approved by EPA, permits will be issued and monitored bythat State.
Title VI is intended to protect stratospheric ozone by phasing out themanufacture of ozone-depleting chemicals and restrict their use anddistribution. Production of Class I substances, including 15 kinds ofchlorofluorocarbons (CFCs), will be phased out entirely by the year 2000,while certain hydrochlorofluorocarbons (HCFCs) will be phased out by 2030.
EPA's Control Technology Center, at (919) 541-0800, provides generalassistance and information on CAA standards. The Stratospheric OzoneInformation Hotline, at (800) 296-1996, provides general information aboutregulations promulgated under Title VI of the CAA, and EPA's EPCRAHotline, at (800) 535-0202, answers questions about accidental releaseprevention under CAA §112(r). In addition, the Technology TransferNetwork Bulletin Board System (modem access (919) 541-5742)) includesrecent CAA rules, EPA guidance documents, and updates of EPA activities.
VI.B. Industry Specific Requirements
The inorganic chemical industry is affected by nearly all federal environmentalstatutes. In addition, the industry is subject to numerous laws and regulationsfrom state and local governments designed to protect and improve health,safety, and the environment. A summary of the major federal regulationsaffecting the chemical industry follows.
Sector Notebook Project Inorganic Chemicals
September 1995 SIC 28184
Federal Statutes
Toxic Substances Control Act
The Toxic Substances Control Act (TSCA), passed in 1976, gives theEnvironmental Protection Agency comprehensive authority to regulate anychemical substance whose manufacture, processing, distribution in commerce,use, or disposal may present an unreasonable risk of injury to health or theenvironment. Three sections are of primary importance to the inorganicchemical industry. Section 5 mandates that chemical companies submit toEPA pre-manufacture notices that provide information on health andenvironmental effects for each new product and test existing products forthese effects. To date, over 20,000 premanufacturing notices have been filed.Section 4 authorizes the EPA to require testing of certain substances. Section6 gives the EPA authority to prohibit, limit, or ban the manufacture, process,and use of chemicals. Under Section 6 of TSCA, EPA has banned most usesof asbestos. In 1990, however, the chlor-alkali industry was able to show thatit did not have difficulty meeting the required exposure limits for asbestosfibers, and the use of asbestos as a diaphragm material was exempted from theTSCA ban.
Clean Air Act
The Clean Air Act Amendments of 1990 set National Emission Standards forHazardous Air Pollutants (NESHAP) from industrial sources for 41 pollutantsto be met by 1995 and for 148 other pollutants to be reached by 2003.Several provisions affect the inorganic chemical industry. The EPA willpromulgate maximum achievable control technology (MACT) standards andLowest Achievable Emission Rates will be required in NAAQS non-attainment areas (Iliam Rosario, U.S. EPA, OAQPS, WAM for ChlorineProduction NESHAP (919)-541-5308). An information collection requestsurvey was sent out to the chlor-alkali industry in 1992. The data obtainedfrom the survey will be analyzed and, based on the results, EPA will proposeMACT standards (or EPA may propose that no new standards are necessary)for the chlor-alkali industry by 1997. For any subject facility, a six yearextension of MACT requirements is available if they can demonstrate earlyemission reductions.
The Clean Air Act Amendments of 1990 contain provisions to phase out theuse of ozone depleting chemicals such as chlorofluorocarbons, halons, carbontetrachloride, and methyl chloroform, as required by the Montreal Protocolon Substances that Deplete the Ozone Layer. The chlor-alkali industry hasbeen and will continue to be significantly affected by these provisions due todecreases in the demand for chlorine as a feedstock in manufacturing thesechemicals. In addition, many of these chemicals are used extensively by theindustry to process chlorine.
Sector Notebook Project Inorganic Chemicals
September 1995 SIC 28185
Clean Water Act
The Clean Water Act, first passed in 1972 and amended in 1977 and 1987,gives EPA the authority to regulate effluents from sewage treatment works,chemical plants, and other industrial sources into waters. The act sets "bestavailable technology" standards for treatment of wastes for both direct andindirect (to a Publicly Owned Treatment Works) discharges. Effluentguidelines for the chlor-alkali industry were last updated in 1984 (40 CFRSection 415). EPA is currently conducting a study to assess the need for neweffluent guidelines. (Contact: George Zipf, U.S. EPA, Office of Water, 202-260-2275)
Restrictions on dioxin emissions in the wastewater from pulp mills are havingsignificant effects on the chlor-alkali industry. Dioxins are formed during thechlorine bleaching process and are subsequently released to rivers andstreams. Many mills are switching from chlorine to alternative bleachingagents in response to the effluent restrictions. Pulp mills accounted for about15 percent of the chlorine demand in the U.S. in 1982 and 11 percent in 1992.The demand for chlorine for pulp bleaching is expected to continue todecrease through the 1990s.
Resource Conservation and Recovery Act
The Resource Conservation and Recovery Act (RCRA) of 1976 gives theEPA authority to establish a list of solid and hazardous wastes, and toestablish standards and regulations for handling and disposing of these wastes.New wastes specific to the inorganic chemical industry have not been addedto the RCRA list since the original waste listings in 1980. EPA is currentlyunder a consent order, however, to propose new hazardous waste listings forthe industry by March 1997, and to finalize by March 1998. (Contact: RickBrandes, U.S. EPA, Office of Solid Waste, 202-260-4770) The Act alsorequires companies to establish programs to reduce the volume and toxicityof hazardous wastes. It was last amended in 1984 when Congress mandatedsome 70 new programs for the hazardous waste (Subtitle C) program.Included were tighter standards for handling and disposing of hazardouswastes, land disposal prohibitions, corrective action (or remediation)regulations, and regulations for underground storage tanks. The inorganicchemical industry is strongly affected by the RCRA regulations because of thedisposal costs for hazardous waste and the record keeping requirements.
Occupational Safety and Health Act
The Occupational Safety and Health Act gave the Department of Labor theauthority to set comprehensive workplace safety and health standardsincluding permissible exposures to chemical in the workplace and authority toconduct inspections and issue citations for violations of safety and health
Sector Notebook Project Inorganic Chemicals
September 1995 SIC 28186
regulations. The chemical industry is subject to hazard identificationstandards established by OSHA, which require extensive documentation ofchemicals in trade and in the workplace and mandate warning labels oncontainers. The industry is also subject to OSHA's Hazard CommunicationStandard and various state and local laws, which give workers the right toknow about hazardous chemicals in the workplace.
Hazardous Materials Transportation Act
The Hazardous Materials Transportation Act (HMTA) gives the Departmentof Transportation authority to regulate the movement of hazardous materials.Chemical manufacturers must comply with regulations governing shipmentpreparation, including packaging, labeling and shipping papers; handling,loading and unloading; routing emergency and security planning; incidentnotifications; and liability insurance. The chemical manufacturers must alsocomply with operating requirements for vehicle, vessel, and carriertransportation of hazardous materials by road, rail, air, and sea. Thechemicals covered by the HMTA span a broad list of substances, includinghazardous wastes normally regulated by RCRA and hazardous materials thatDOT designates as hazardous for the purposes of transportation that may notbe considered hazardous under RCRA. These regulations especially apply tochlorine gas which can cause significant risk during transport.
Pollution Prevention Act
The Pollution Prevention Act makes it a national policy of the United Statesto reduce or eliminate the generation of waste at the source whenever feasible.The EPA is directed to undertake a multi-media program of informationcollection, technology transfer, and financial assistance to enable the states toimplement this policy and to promote the use of source reduction techniques.The reorganization of the Office of Compliance by industry sector is part ofEPA's response to this act.
State Statutes
Toxics Use Reduction Act, Massachusetts
The Massachusetts Toxics Use Reduction Act affects those facilities that use,manufacture, or process more than a specified amount of substances that areon the Massachusetts toxic or hazardous substances list. Facilities mustsubmit annual reports on the amounts of substances used, manufactured, orprocessed and must pay annual fees based on these amounts. In addition,facilities must prepare toxics use reduction plans which show in-plant changesin production processes or raw materials that would reduce, avoid, oreliminate the use or generation of toxic or hazardous substances. TheMassachusetts toxic or hazardous substance list initially consists of those
Sector Notebook Project Inorganic Chemicals
September 1995 SIC 28187
substances listed under §313 of EPCRA and will eventually include thosesubstances listed under CERCLA. New Jersey has recently passed a similaract.
VI.C. Pending and Proposed Regulatory Requirements
Resource Conservation and Recovery Act (RCRA)
The Resource Conservation and Recovery Act (RCRA) listed waste streamsspecific to the inorganic chemical industry have not been updated since theoriginal RCRA hazardous wastes list developed in 1980. EPA is under acourt-ordered deadline to propose and finalize additional waste listings for theindustry by March 1997 and March 1988, respectively. The Office of SolidWaste will begin assessing the need for new listings by early 1996. (Contact:Rick Brandes, U.S. EPA, Office of Solid Waste, 202-260-4770)
Clean Air Act
The new NESHAP standards for the inorganic chemical industry arescheduled to be promulgated by EPA by 1997. (Contact: Iliam Rosario, U.S.EPA, OAQPS, WAM for Chlorine Production NESHAP, 919-541-5308) Thestandards required will, in most cases, be in the form of MACT standards.Lowest Achievable Emission Rates will be required in NAAQS non-attainment areas. An information collection request survey was sent out tothe chlor-alkali industry in 1992. The data obtained will be analyzed and usedto assess the need for NESHAP standards in the chlor-alkali industry.
The chlor-alkali industry will continue to be affected by the provisions tophase out the use of ozone depleting chemicals as required by the MontrealProtocol on Substances that Deplete the Ozone Layer. The demand forchlorine as a feedstock in manufacturing these chemicals, which accounted forabout 15 percent of total domestic demand in 1990, will continue to declinethrough the 1990s. In addition, costs of purifying and liquefying chlorine gasmay increase as the cost of carbon tetrachloride and refrigerants increases, andas alternative processes are introduced.
Sector Notebook Project Inorganic Chemicals
September 1995 SIC 28188
VII. COMPLIANCE AND ENFORCEMENT HISTORY
Background
To date, EPA has focused much of its attention on measuring compliance withspecific environmental statutes. This approach allows the Agency to trackcompliance with the Clean Air Act, the Resource Conservation and RecoveryAct, the Clean Water Act, and other environmental statutes. Within the lastseveral years, the Agency has begun to supplement single-media complianceindicators with facility-specific, multimedia indicators of compliance. In doingso, EPA is in a better position to track compliance with all statutes at thefacility level, and within specific industrial sectors.
A major step in building the capacity to compile multimedia data for industrialsectors was the creation of EPA's Integrated Data for Enforcement Analysis(IDEA) system. IDEA has the capacity to "read into" the Agency's single-media databases, extract compliance records, and match the records toindividual facilities. The IDEA system can match Air, Water, Waste,Toxics/Pesticides/EPCRA, TRI, and Enforcement Docket records for a givenfacility, and generate a list of historical permit, inspection, and enforcementactivity. IDEA also has the capability to analyze data by geographic area andcorporate holder.
Compliance and Enforcement Profile Description
Using inspection, violation, and enforcement data from the IDEA system, thissection provides information regarding the historical compliance andenforcement activity of this sector. In order to mirror the facility universereported in the Toxic Chemical Profile, the data reported within this sectionconsists of records only from the TRI reporting universe. With this decision,the selection criteria are consistent across sectors with certain exceptions. Forthe sectors that do not normally report to the TRI program, data have beenprovided from EPA's Facility Indexing System (FINDS) which tracks facilitiesin all media databases. Please note, in this section, EPA does not attempt todefine the actual number of facilities that fall within each sector. Instead, thesection portrays the records of a subset of facilities within the sector that arewell defined within EPA databases.
As a check on the relative size of the full sector universe, most notebookscontain an estimated number of facilities within the sector according to theBureau of Census (See Section II). With sectors dominated by smallbusinesses, such as metal finishers and printers, the reporting universe withinthe EPA databases may be small in comparison to Census data. However, thegroup selected for inclusion in this data analysis section should be consistentwith this sector's general make-up.
Sector Notebook Project Inorganic Chemicals
EPA Regions include the following states: I (CT, MA, ME, RI, NH, VT);II (NJ, NY, PR, VI); III (DC, DE, MD, PA,e
VA, WV); IV (AL, FL, GA, KY, MS, NC, SC, TN); V (IL, IN, MI, MN, OH, WI); VI (AR, LA, NM, OK, TX); VII(IA, KS, MO, NE); VIII (CO, MT, ND, SD, UT, WY); IX (AZ, CA, HI, NV, Pacific Trust Territories); X (AK, ID, OR,WA).
September 1995 SIC 28189
Following this introduction is a list defining each data column presentedwithin this section. These values represent a retrospective summary ofinspections or enforcement actions, and solely reflect EPA, state, and localcompliance assurance activity that have been entered into EPA databases. Toidentify any changes in trends, the EPA ran two data queries, one for the pastfive calendar years (August 10, 1990 to August 9, 1995) and the other for themost recent twelve-month period (August 10, 1994 to August 9, 1995). Thefive-year analysis gives an average level of activity for that period forcomparison to the more recent activity.
Because most inspections focus on single-media requirements, the dataqueries presented in this section are taken from single media databases. Thesedatabases do not provide data on whether inspections are state/local or EPA-led. However, the table breaking down the universe of violations does give thereader a crude measurement of the EPA's and states' efforts within each mediaprogram. The presented data illustrate the variations across regions forcertain sectors. This variation may be attributable to state/local data entrye
variations, specific geographic concentrations, proximity to populationcenters, sensitive ecosystems, highly toxic chemicals used in production, orhistorical noncompliance. Hence, the exhibited data do not rank regionalperformance or necessarily reflect which regions may have the mostcompliance problems.
Compliance and Enforcement Data Definitions
General Definitions
Facility Indexing System (FINDS) -- this system assigns a common facilitynumber to EPA single-media permit records. The FINDS identificationnumber allows EPA to compile and review all permit, compliance,enforcement and pollutant release data for any given regulated facility.
Integrated Data for Enforcement Analysis (IDEA) -- is a data integrationsystem that can retrieve information from the major EPA program officedatabases. IDEA uses the FINDS identification number to ?glue together”separate data records from EPA’s databases. This is done to create a ?masterlist” of data records for any given facility. Some of the data systemsaccessible through IDEA are: AIRS (Air Facility Indexing and RetrievalSystem, Office of Air and Radiation), PCS (Permit Compliance System, Officeof Water), RCRIS (Resource Conservation and Recovery InformationSystem, Office of Solid Waste), NCDB (National Compliance Data Base,
Sector Notebook Project Inorganic Chemicals
September 1995 SIC 28190
Office of Prevention, Pesticides, and Toxic Substances), CERCLIS(Comprehensive Environmental and Liability Information System, Superfund),and TRIS (Toxic Release Inventory System). IDEA also contains informationfrom outside sources such as Dun and Bradstreet and the Occupational Safetyand Health Administration (OSHA). Most data queries displayed in notebooksections IV and VII were conducted using IDEA.
Data Table Column Heading Definitions
Facilities in Search -- are based on the universe of TRI reporters within thelisted SIC code range. For industries not covered under TRI reportingrequirements, the notebook uses the FINDS universe for executing dataqueries. The SIC code range selected for each search is defined by eachnotebook's selected SIC code coverage described in Section II.
Facilities Inspected -- indicates the level of EPA and state agency facilityinspections for the facilities in this data search. These values show whatpercentage of the facility universe is inspected in a 12 or 60 month period.This column does not count non-inspectional compliance activities such as thereview of facility-reported discharge reports.
Number of Inspections -- measures the total number of inspectionsconducted in this sector. An inspection event is counted each time it isentered into a single media database.
Average Time Between Inspections -- provides an average length of time,expressed in months, that a compliance inspection occurs at a facility withinthe defined universe.
Facilities with One or More Enforcement Actions -- expresses the numberof facilities that were party to at least one enforcement action within thedefined time period. This category is broken down further into federal andstate actions. Data are obtained for administrative, civil/judicial, and criminalenforcement actions. Administrative actions include Notices of Violation(NOVs). A facility with multiple enforcement actions is only counted once inthis column (facility with three enforcement actions counts as one). Allpercentages that appear are referenced to the number of facilities inspected.
Total Enforcement Actions -- describes the total number of enforcementactions identified for an industrial sector across all environmental statutes. Afacility with multiple enforcement actions is counted multiple times (a facilitywith three enforcement actions counts as three). State Lead Actions -- shows what percentage of the total enforcementactions are taken by state and local environmental agencies. Varying levelsof use by states of EPA data systems may limit the volume of actions
Sector Notebook Project Inorganic Chemicals
September 1995 SIC 28191
accorded state enforcement activity. Some states extensively reportenforcement activities into EPA data systems, while other states may use theirown data systems.
Federal Lead Actions -- shows what percentage of the total enforcementactions are taken by the United States Environmental Protection Agency.This value includes referrals from state agencies. Many of these actions resultfrom coordinated or joint state/federal efforts.
Enforcement to Inspection Rate -- expresses how often enforcement actionsresult from inspections. This value is a ratio of enforcement actions toinspections, and is presented for comparative purposes only. This measure isa rough indicator of the relationship between inspections and enforcement.Reported inspections and enforcement actions under the Clean Water Act(PCS), the Clean Air Act (AFS) and the Resource Conservation and RecoveryAct (RCRA) are included in this ratio. Inspections and actions from theTSCA/FIFRA/EPCRA database are not factored into this ratio because mostof the actions taken under these programs are not the result of facilityinspections. This ratio does not account for enforcement actions arising fromnon-inspection compliance monitoring activities (e.g., self-reported waterdischarges) that can result in enforcement action within the CAA, CWA andRCRA.
Facilities with One or More Violations Identified -- indicates the numberand percentage of inspected facilities having a violation identified in one of thefollowing data categories: In Violation or Significant Violation Status (CAA);Reportable Noncompliance, Current Year Noncompliance, SignificantNoncompliance (CWA); Noncompliance and Significant Noncompliance(FIFRA, TSCA, and EPCRA); Unresolved Violation and Unresolved HighPriority Violation (RCRA). The values presented for this column reflect theextent of noncompliance within the measured time frame, but do notdistinguish between the severity of the noncompliance. Percentages withinthis column may exceed 100 percent because facilities can be in violationstatus without being inspected. Violation status may be a precursor to anenforcement action, but does not necessarily indicate that an enforcementaction will occur.
Media Breakdown of Enforcement Actions and Inspections -- fourcolumns identify the proportion of total inspections and enforcement actionswithin EPA Air, Water, Waste, and TSCA/FIFRA/EPCRA databases. Eachcolumn is a percentage of either the ?Total Inspections,” or the ?TotalActions” column.
Sector Notebook Project Inorganic Chemicals
September 1995 SIC 28192
VII.A. Inorganic Chemical Industry Compliance History
Exhibit 20 provides an overview of the reported compliance and enforcementdata for the inorganic chemical industry over the past five years (August 1990to August 1995). These data are also broken out by EPA Region therebypermitting geographical comparisons. A few points evident from the data arelisted below.
C Slightly more than half of the TRI reporting inorganic chemicalfacilities in the EPA databases were inspected over the five yearperiod resulting in an average of 11 months between inspections ofthese facilities.
C On average, the states carried out three times the number ofinspections as the Regions; however, the percentage of state ledactions varied across the Regions from 44 percent to 96 percent.
C The enforcement to inspection rate varied significantly from Regionto Region. Region IX had the highest enforcement to inspection rateas well as the highest percentage of state led actions.
Sector Notebook Project Inorganic Chemicals
September 1995 SIC 28193
Exh
ibit
20:
Fiv
e-Y
ear
Enf
orce
men
t an
d C
ompl
ianc
e Su
mm
ary
for
Inor
gani
c C
hem
ical
s M
anuf
actu
ring
AB
CD
EF
GH
IJ
Reg
ion
Fac
iliti
esin
Sea
rch
Fac
iliti
esIn
spec
ted
Num
ber
ofIn
spec
tion
s
Ave
rage
Mon
ths
Bet
wee
nIn
spec
tion
s
Fac
iliti
es w
ith
1or
Mor
eE
nfor
cem
ent
Act
ions
Tot
alE
nfor
cem
ent
Act
ions
Per
cent
Stat
e L
ead
Act
ions
Per
cent
Fed
eral
Lea
d A
ctio
nsE
nfor
cem
ent
to I
nspe
ctio
nR
ate
I10
516
380
0--
----
II46
2935
48
1229
72%
28%
0.0
8
III
6041
544
712
38 8
9% 1
1% 0
.07
IV10
554
916
721
113
89%
11%
0.1
2
V10
862
469
1411
42 4
5% 5
5% 0
.09
VI
9340
401
1424
106
61%
39%
0.2
6
VII
1912
6218
29
44%
56%
0.1
5
VII
I17
938
274
5 8
0% 2
0% 0
.13
IX70
3517
125
953
96%
4%
0.3
1
X20
1163
194
7 8
6% 1
4% 0
.11
TO
TA
L54
829
83,
034
1199
402
76%
24%
0.1
3
Sector Notebook Project Inorganic Chemicals
September 1995 SIC 28194
VII.B. Comparison of Enforcement Activity Between Selected Industries
Exhibits 21 and 22 allow the compliance history of the inorganic chemicalmanufacturing sector to be compared to the other industries covered by theindustry sector notebooks. Comparisons between Exhibits 21 and 22 permitthe identification of trends in compliance and enforcement records of theindustry by comparing data covering the last five years to that of the past year.Some points evident from the data are listed below.
C The inorganic chemicals industry has a relatively low frequency ofinspections compared to most of the other sectors shown. Onaverage, the number of months between inspections at inorganicchemicals facilities has been only about twice that of organicchemicals facilities.
C Over the past five years the inorganic chemical industry has had a ratioof enforcement actions to inspections lower than most of the othersectors listed including the organic chemicals sector. This differencehas continued over the past year.
C Enforcement actions are brought against only about 10 percent of thefacilities with violations; lower than most other sectors listed.
Exhibits 23 and 24 provide a more in-depth comparison between the inorganicchemicals industry and other sectors by breaking out the compliance andenforcement data by environmental statute. As in the previous Exhibits (21and 22), the data cover the last five years (Exhibit 23) and the last one year(Exhibit 24) to facilitate the identification of recent trends. A few pointsevident from the data are listed below.
C Inspections of inorganic chemical facilities are split relatively evenlybetween Clean Air Act, Clean Water Act, and RCRA, although RCRAaccounts for a significantly larger portion of the total actions broughtagainst the inorganic chemicals industry over the past five years.
C Significantly more Clean Water Act inspections are carried out atinorganic chemicals facilities in comparison to the organic chemicalsindustry, although the Clean Water Act accounts for a smaller portionof the total actions brought against inorganic chemicals facilities.
C Over the past year RCRA inspections have accounted for asignificantly smaller portion of the enforcement actions broughtagainst the industry and the Clean Air Act has taken a far greatershare.
Sector Notebook Project Inorganic Chemicals
September 1995 SIC 28195
Exh
ibit
21:
Fiv
e-Y
ear
Enf
orce
men
t an
d C
ompl
ianc
e Su
mm
ary
for
Sele
cted
Ind
ustr
ies
AB
CD
EF
GH
IJ
Indu
stry
Sec
tor
Fac
iliti
esin
Sea
rch
Fac
iliti
esIn
spec
ted
Num
ber
ofIn
spec
tion
s
Ave
rage
Mon
ths
Bet
wee
nIn
spec
tion
s
Fac
iliti
es w
ith
1 or
Mor
eE
nfor
cem
ent
Act
ions
Tot
alE
nfor
cem
ent
Act
ions
Per
cent
Stat
e L
ead
Act
ions
Per
cent
Fed
eral
Lea
dA
ctio
ns
Enf
orce
men
tto
Insp
ecti
onR
ate
Pulp
and
Pap
er30
626
53,
766
511
550
278
%22
%0.
13
Prin
ting
4,10
61,
035
4,72
352
176
514
85%
15%
0.11
Inor
gani
c C
hem
ical
s54
829
83,
034
1199
402
76%
24%
0.13
Org
anic
Che
mic
als
412
316
3,86
46
152
726
66%
34%
0.19
Petr
oleu
m R
efin
ing
156
145
3,25
73
110
797
66%
34%
0.25
Iron
and
Ste
el37
427
53,
555
611
549
972
%28
%0.
14
Dry
Cle
anin
g93
324
563
388
2910
399
%1%
0.16
Met
al M
inin
g87
333
91,
519
3467
155
47%
53%
0.10
Non
-Met
allic
Min
eral
Min
ing
1,14
363
13,
422
2084
192
76%
24%
0.06
Lum
ber
and
Woo
d46
430
11,
891
1578
232
79%
21%
0.12
Furn
iture
293
213
1,53
411
3491
91%
9%0.
06
Rub
ber
and
Plas
tic1,
665
739
3,38
630
146
391
78%
22%
0.12
Ston
e, C
lay,
and
Gla
ss46
826
82,
475
1173
301
70%
30%
0.12
Fabr
icat
ed M
etal
2,34
61,
340
5,50
926
280
840
80%
20%
0.15
Non
ferr
ous
Met
al84
447
43,
097
1614
547
076
%24
%0.
15
Ele
ctro
nics
405
222
777
3168
212
79%
21%
0.27
Aut
omob
iles
598
390
2,21
616
8124
080
%20
%0.
11
Sector Notebook Project Inorganic Chemicals
September 1995 SIC 28196
Exh
ibit
22:
One
-Yea
r In
spec
tion
and
Enf
orce
men
t Su
mm
ary
for
Sele
cted
Ind
ustr
ies
AB
CD
EF
GH
Fac
iliti
es w
ith
1 or
Mor
e V
iola
tion
sF
acili
ties
wit
h 1
or m
ore
Enf
orce
men
t A
ctio
nsT
otal
Enf
orce
men
tA
ctio
nsIn
dust
ry S
ecto
rF
acili
ties
inSe
arch
Fac
iliti
esIn
spec
ted
Num
ber
ofIn
spec
tion
sN
umbe
rP
erce
nt*
Num
ber
Per
cent
*E
nfor
cem
ent
toIn
spec
tion
Rat
e
Pulp
and
Pap
er30
618
957
616
286
%28
15%
880.
15
Prin
ting
4,10
639
767
625
163
%25
6%72
0.11
Inor
gani
c C
hem
ical
s54
815
842
716
710
6%19
12%
490.
12
Org
anic
Che
mic
als
412
195
545
197
101%
3920
%11
80.
22
Petr
oleu
m R
efin
ing
156
109
437
109
100%
3936
%11
40.
26
Iron
and
Ste
el37
416
748
816
599
%20
12%
460.
09
Dry
Cle
anin
g93
380
111
2126
%5
6%11
0.10
Met
al M
inin
g87
311
419
482
72%
1614
%24
0.13
Non
-met
allic
Min
eral
Min
ing
1,14
325
342
575
30%
2811
%54
0.13
Lum
ber
and
Woo
d46
414
226
810
977
%18
13%
420.
58
Furn
iture
293
160
113
6641
%3
2%5
0.55
Rub
ber
and
Plas
tic1,
665
271
435
289
107%
197%
590.
14
Ston
e, C
lay,
and
Gla
ss46
814
633
011
679
%20
14%
660.
20
Non
ferr
ous
Met
als
844
202
402
282
104%
2211
%72
0.18
Fabr
icat
ed M
etal
2,34
647
774
652
511
0%46
10%
114
0.15
Ele
ctro
nics
405
6087
8013
3%8
13%
210.
24
Aut
omob
iles
598
169
284
162
96%
148%
280.
10
* Pe
rcen
tage
s in
Col
umns
E a
nd F
are
bas
ed o
n th
e nu
mbe
r of
fac
ilitie
s in
spec
ted
(Col
umn
C).
Per
cent
ages
can
exc
eed
100%
bec
ause
vio
latio
ns a
nd a
ctio
ns c
an o
ccur
with
out a
fac
ility
insp
ectio
n.
Sector Notebook Project Inorganic Chemicals
September 1995 SIC 28197
Exh
ibit
23:
Fiv
e-Y
ear
Insp
ecti
on a
nd E
nfor
cem
ent
Sum
mar
y by
Sta
tute
for
Sel
ecte
d In
dust
ries
Cle
an A
ir A
ctC
lean
Wat
er A
ct
Res
ourc
eC
onse
rvat
ion
and
Rec
over
y A
ctF
IFR
A/T
SCA
/E
PC
RA
/Oth
er
Indu
stry
Sec
tor
Fac
iliti
esIn
spec
ted
Tot
alIn
spec
tion
s
Tot
alE
nfor
cem
ent
Act
ions
% o
f T
otal
Insp
ecti
ons
% o
fT
otal
Act
ions
% o
f T
otal
Insp
ecti
ons
% o
fT
otal
Act
ions
% o
f T
otal
Insp
ecti
ons
% o
fT
otal
Act
ions
% o
f T
otal
Insp
ecti
ons
% o
f T
otal
Act
ions
Pulp
and
Pap
er26
53,
766
502
51%
48%
38%
30%
9%18
%2%
3%
Prin
ting
1,03
54,
723
514
49%
31%
6%3%
43%
62%
2%4%
Inor
gani
c C
hem
ical
s29
83,
034
402
29%
26%
29%
17%
39%
53%
3%4%
Org
anic
Che
mic
als
316
3,86
472
633
%30
%16
%21
%46
%44
%5%
5%
Petr
oleu
m R
efin
ing
145
3,23
779
744
%32
%19
%12
%35
%52
%2%
5%
Iron
and
Ste
el27
53,
555
499
32%
20%
30%
18%
37%
58%
2%5%
Dry
Cle
anin
g24
563
310
315
%1%
3%4%
83%
93%
0%1%
Met
al M
inin
g33
91,
519
155
35%
17%
57%
60%
6%14
%1%
9%
Non
-met
allic
Min
eral
Min
ing
631
3,42
219
265
%46
%31
%24
%3%
27%
0%4%
Lum
ber
and
Woo
d30
11,
891
232
31%
21%
8%7%
59%
67%
2%5%
Furn
iture
293
1,53
491
52%
27%
1%1%
45%
64%
1%8%
Rub
ber
and
Plas
tic73
93,
386
391
39%
15%
13%
7%44
%68
%3%
10%
Ston
e, C
lay,
and
Gla
ss26
82,
475
301
45%
39%
15%
5%39
%51
%2%
5%
Non
ferr
ous
Met
als
474
3,09
747
036
%22
%22
%13
%38
%54
%4%
10%
Fabr
icat
ed M
etal
1,34
05,
509
840
25%
11%
15%
6%56
%76
%4%
7%
Ele
ctro
nics
222
777
212
16%
2%14
%3%
66%
90%
3%5%
Aut
omob
iles
390
2,21
624
035
%15
%9%
4%54
%75
%2%
6%
Sector Notebook Project Inorganic Chemicals
September 1995 SIC 28198
Exh
ibit
24:
One
-Yea
r In
spec
tion
and
Enf
orce
men
t Su
mm
ary
by S
tatu
te f
or S
elec
ted
Indu
stri
es
Cle
an A
ir A
ctC
lean
Wat
er A
ct
Res
ourc
eC
onse
rvat
ion
and
Rec
over
y A
ctF
IFR
A/T
SCA
/E
PC
RA
/Oth
er
Indu
stry
Sec
tor
Fac
iliti
esIn
spec
ted
Tot
alIn
spec
tion
s
Tot
alE
nfor
cem
ent
Act
ions
% o
f T
otal
Insp
ecti
ons
% o
fT
otal
Act
ions
% o
f T
otal
Insp
ecti
ons
% o
fT
otal
Act
ions
% o
f T
otal
Insp
ecti
ons
% o
fT
otal
Act
ions
% o
f T
otal
Insp
ecti
ons
% o
fT
otal
Act
ions
Pulp
and
Pap
er18
957
688
56%
69%
35%
21%
10%
7%0%
3%
Prin
ting
397
676
7250
%27
%5%
3%44
%66
%0%
4%
Inor
gani
c C
hem
ical
s15
842
749
26%
38%
29%
21%
45%
36%
0%6%
Org
anic
Che
mic
als
195
545
118
36%
34%
13%
16%
50%
49%
1%1%
Petr
oleu
m R
efin
ing
109
437
114
50%
31%
19%
16%
30%
47%
1%6%
Iron
and
Ste
el16
748
846
29%
18%
35%
26%
36%
50%
0%6%
Dry
Cle
anin
g80
111
1121
%4%
1%22
%78
%67
%0%
7%
Met
al M
inin
g11
419
424
47%
42%
43%
34%
10%
6%0%
19%
Non
-met
allic
Min
eral
Min
ing
253
425
5469
%58
%26
%16
%5%
16%
0%11
%
Lum
ber
and
Woo
d14
226
842
29%
20%
8%13
%63
%61
%0%
6%
Furn
iture
293
160
558
%67
%1%
10%
41%
10%
0%13
%
Rub
ber
and
Plas
tic27
143
559
39%
14%
14%
4%46
%71
%1%
11%
Ston
e, C
lay,
and
Gla
ss14
633
066
45%
52%
18%
8%38
%37
%0%
3%
Non
ferr
ous
Met
als
202
402
7233
%24
%21
%3%
44%
69%
1%4%
Fabr
icat
ed M
etal
477
746
114
25%
14%
14%
8%61
%77
%0%
2%
Ele
ctro
nics
6087
2117
%2%
14%
7%69
%87
%0%
4%
Aut
omob
iles
169
284
2834
%16
%10
%9%
56%
69%
1%6%
Sector Notebook Project Inorganic Chemicals
September 1995 SIC 28199
VII.C. Review of Major Legal Actions
Major Cases/Supplemental Environmental Projects
This section provides summary information about major cases that haveaffected this sector, and a list of Supplementary Environmental Projects(SEPs). SEPs are compliance agreements that reduce a facility's stipulatedpenalty in return for an environmental project that exceeds the value of thereduction. Often, these projects fund pollution prevention activities that cansignificantly reduce the future pollutant loadings of a facility.
VII.C.1. Review of Major Cases
Historically, OECA’s Enforcement Capacity and Outreach Office does notregularly compile information related to major cases and pending litigationwithin an industry sector. The staff are willing to pass along such informationto Agency staff as requests are made. In addition, summaries of completedenforcement actions are published each fiscal year in the EnforcementAccomplishments Report. To date, these summaries are not organized byindustry sector. (Contact: Office of Enforcement Capacity and Outreach 202-260-4140)
VII.C.2. Supplementary Environmental Projects
Supplemental environmental projects (SEPs) are an enforcement option thatrequires the non-compliant facility to complete specific projects. Regionalsummaries of SEPs undertaken in the 1993 and 1994 federal fiscal years werereviewed. Five SEPs were undertaken that involved inorganic chemicalmanufacturing facilities, as shown in Exhibit 25.
CERCLA violations engendered three out of the five SEPs identified; thefourth and fifth were due to a CAA violation and a TSCA violation. Due toregional reporting methods, the specifics of the original violations are notknown and, for one SEP, details of the actual project were not available.
One of the five projects was conducted at a facility that manufactures bothinorganic and organic chemicals. This project has been included in bothindustry sector project summaries. The FY 1993 and 1994 SEPs for inorganicchemical manufacturers fall into four categories: process related projects;control and recovery technology inprovement or installation; leak prevention;and donations to the community.
Sector Notebook Project Inorganic Chemicals
September 1995 SIC 281100
•Process related projectsA Region IV project carried out in 1993 entailed specific processchanges intended to reduce chlorinated wastes at the facility. Inconjunction with other non-process components of the project, theimplementation cost was $93,000.
•Control and recovery technology improvement/installationA Louisiana facility, the combined organic and inorganic chemicalmanufacturer, implemented a SEP to reduce emissions from returnedgas canisters. The SEP involved the installation of recoverytechnologies to reduce emissions of residual CFC and HCFC from theused canisters. The cost to the company was $158,400.
•Leak preventionA Region IV facility constructed retaining walls around undergroundstorage tanks to prevent hazardous leachate from reachinggroundwater. The cost to the company was $46,200.
•Donations to CommunityFollowing a CERCLA violation, a facility in Texas donated emergencyand computer equipment to the Local Emergency PlanningCommission (LEPC) which could be used in the planning andresponding to potential chemical emergencies. The facility also agreedto participate in LEPC activities and to provide technical assistance.
Sector Notebook Project Inorganic Chemicals
September 1995 SIC 281101
Exh
ibit
25:
FY
-199
3-19
94 S
uppl
emen
tal E
nvir
onm
enta
l Pro
ject
s O
verv
iew
: In
orga
nic
Che
mic
al M
anuf
actu
re
Gen
eral
Inf
orm
atio
nV
iola
tion
Info
rmat
ion
Pollu
tant
Red
uctio
n
FYD
ocke
t#
Com
pany
Nam
eSt
ate/
Reg
ion
Typ
eIn
itial
Pena
ltyFi
nal
Pena
ltySE
PC
redi
tSE
P C
ost
to Com
pany
Pollu
tant
of
Con
cern
Pollu
tant
Red
uctio
nSu
pple
men
tal E
nvir
onm
enta
l Pro
ject
sD
escr
iptio
n
93--
-L
aRoc
he*
Che
mic
als,
Inc.
LA
CA
A$8
8,36
0 $2
5,00
0 --
-$1
58,4
00
CFC
/HC
FC--
-C
ompa
ny p
urch
ased
, ins
talle
d, a
ndop
erat
ed e
quip
men
t for
rec
over
y of
resi
dual
CFC
s an
d H
CFC
s in
use
d ga
scy
linde
rs r
etur
ned
by c
usto
mer
s
93--
-C
oast
alC
hem
ical
sR
eg. 4
CE
RC
LA
103/
EPC
RA
304
$90,
000
$2,0
00
---
$93,
000
chlo
rina
ted
was
te--
-A
ltere
d pr
oces
s to
red
uce
chlo
rina
ted
was
tes,
pro
vide
d co
mpu
ter
and
Cam
eotr
aini
ng f
or c
ount
y E
MA
, don
ated
fun
dsto
LE
PC f
or h
azar
ds a
naly
sis,
and
hel
dre
spon
se e
xerc
ises
at p
lant
93--
-Sc
holle
Cor
p.R
eg. 4
CE
RC
LA
,E
PCR
A$4
0,00
0$1
0,00
0--
-$4
6,20
0--
---
-C
onst
ruct
ed r
etai
ning
wal
ls a
roun
dun
derg
roun
d st
orag
e ta
nks
to p
reve
ntha
zard
ous
mat
eria
l lea
chat
e fr
omre
achi
ng g
roun
dwat
er
936-
93-1
6A
LC
OA
TX
CE
RC
LA
103(
a)$2
5,00
0 $3
,000
--
-$1
0,00
0 --
---
-D
onat
ed e
mer
genc
y an
d/or
com
pute
req
uipm
ent t
o L
EPC
for
res
pons
e/pl
anni
ngfo
r ch
emic
al e
mer
genc
ies,
agr
eed
topa
rtic
ipat
e in
LE
PC a
ctiv
ities
and
topr
ovid
e te
chni
cal a
ssis
tanc
e
94--
-A
nzon
, Inc
.R
eg.I
IIT
SCA
N/A
N/A
N/A
$198
,000
---
---
N/A
Faci
litie
s id
entif
ied
as c
ombi
ned
inor
gani
c an
d or
gani
c ch
emic
al m
anuf
actu
rers
* Vio
lati
on I
nfor
mat
ion
Ter
ms
Initi
al p
enal
ty: I
nitia
l pro
pose
d ca
sh p
enal
ty f
or v
iola
tion
Fina
l pen
alty
: Tot
al p
enal
ty a
fter
SE
P ne
gotia
tion
SEP
cred
it: C
ash
cred
it gi
ven
for
SEP
so th
at, F
inal
pen
alty
- S
EP
cred
it =
Fin
al c
ash
pena
ltySE
P co
st to
com
pany
: Act
ual c
ost t
o co
mpa
ny o
f SE
P im
plem
enta
tion
NO
TE
: Due
to d
iffe
renc
es in
term
inol
ogy
and
leve
l of
deta
il be
twee
n re
gion
al S
EP
info
rmat
ion,
in s
ome
case
s th
e fi
gure
list
ed a
s Fi
nal p
enal
ty m
ay b
e th
e Fi
nal c
ash
pena
lty a
fter
ded
uctio
nfo
r SE
P cr
edit
Sector Notebook Project Inorganic Chemicals
September 1995 SIC 281102
VIII. COMPLIANCE ASSURANCE ACTIVITIES AND INITIATIVES
This section highlights the activities undertaken by this industry sector andpublic agencies to voluntarily improve the sector's environmentalperformance. These activities include those independently initiated byindustrial trade associations. In this section, the notebook also contains alisting and description of national and regional trade associations.
VIII.A. Sector-related Environmental Programs and Activities
None identified.
VIII.B. EPA Voluntary Programs
33/50 Program
The "33/50 Program" is EPA's voluntary program to reduce toxic chemicalreleases and transfers of seventeen chemicals from manufacturing facilities.Participating companies pledge to reduce their toxic chemical releases andtransfers by 33 percent as of 1992 and by 50 percent as of 1995 from the 1988baseline year. Certificates of Appreciation have been given out to participantsmeeting their 1992 goals. The list of chemicals includes seventeen high-usechemicals reported in the Toxics Release Inventory. Exhibit 26 lists thosecompanies participating in the 33/50 program that reported the SIC code 281to TRI. Many of the companies shown listed multiple SIC codes and,therefore, are likely to carry out operations in addition to inorganic chemicalsmanufacturing. The SIC codes reported by each company are listed in noparticular order. In addition, the number of facilities within each companythat are participating in the 33/50 program and that report SIC 281 to TRI isshown. Finally, each company’s total 1993 releases and transfers of 33/50chemicals and the percent reduction in these chemicals since 1988 arepresented.
The inorganic chemicals industry as a whole used, generated or processedalmost all of the seventeen target TRI chemicals. Of the target chemicals,chromium and chromium compounds, lead and lead compounds, and nickeland nickel compounds are released and transferred most frequently and insimilar quantities. These three toxic chemicals account for about nine percentof TRI releases and transfers from inorganic chemical facilities. Seventy-fivecompanies, representing 168 facilities, listed under SIC 281 (inorganicchemicals) are currently participating in the 33/50 program. This accounts for30 percent of the facilities reporting to SIC code 281 to TRI which issignificantly higher than the average for all industries of 14 percentparticipation. (Contact: Mike Burns, 202-260-6394 or the 33/50 Program,202-260-6907)
Sector Notebook Project Inorganic Chemicals
September 1995 SIC 281103
Exhibit 26: 33/50 Program Participants Reporting SIC 281 (Inorganic Chemicals)
Parent Company City, State Reported Facilities 1988 to 1993SIC Codes ing (lbs.) % Reduction
# of 1993 ReleasesParticipat- and Transfers
3M MINNESOTA MINING & MFG CO. ST. PAUL, MN 2821, 2816, 2899 1 16,481,098 70AIR PRODUCTS AND CHEMICALS ALLENTOWN, PA 2819, 2869 5 144,876 50AKZO NOBEL INC. CHICAGO, IL 2819, 2869 1 930,189 13ALBEMARLE CORP. RICHMOND, VA 2869, 2819 1 1,005,108 51ALLIED-SIGNAL INC. MORRISTOWN, NJ 2819, 2869 4 2,080,501 50ASHLAND OIL INC. RUSSELL, KY 2819 1 723,562 50B F GOODRICH COMPANY AKRON, OH 2812, 2821, 2869 1 621,207 50BASF CORP. PARSIPPANY, NJ 2869, 2865, 2819 1 1,157,548 50BENJAMIN MOORE & CO. MONTVALE, NJ 2851, 2812, 7 20,635 *BORDEN CHEM & PLAS LTD PARTNR COLUMBUS, OH 2813, 2821, 2869 1 12,662 ***CABOT CORP. BOSTON, MA 3339, 2819 2 2,407,581 50CALGON CARBON CORP. PITTSBURGH, PA 2819 1 14,845 50CIBA-GEIGY CORP. ARDSLEY, NY 2819, 2865, 2869 2 1,875,028 50CITGO PETROLEUM CORP. TULSA, OK 2911, 2819, 2869 1 1,164,354 20CONKLIN COMPANY INC. SHAKOPEE, MN 2819, 2952, 2992 1 2,977 *CORNING INC. CORNING, NY 3339, 2819 1 1,521,528 14CRITERION CATALYST LTD PARTNR HOUSTON, TX 28190 3 3,716 *CYTEC INDUSTRIES WEST PATERSON, NJ 2819, 2869 2 1,074,646 50DEGUSSA CORP. RIDGEFIELD PARK,
NJ2819, 2869, 2879 1 676,418 ***
DOW CHEMICAL COMPANY MIDLAND, MI 2800, 2819, 2821 4 2,769,363 50E. I. DU PONT DE NEMOURS & CO. WILMINGTON, DE 2816 9 11,740,853 50EAGLE CHEMICALS INC. HAMILTON, OH 2899, 2819, 2841 1 500 33EAGLE-PICHER INDUSTRIES INC. CINCINNATI, OH 2816 1 227,242 50ELF AQUITAINE INC. NEW YORK, NY 2812 7 273,274 43ENGELHARD CORP. ISELIN, NJ 3714, 2819 6 236,302 50ETHYL CORP. RICHMOND, VA 2869, 2819, 1 251,519 46FERRO CORP. CLEVELAND, OH 2819, 2869 5 165,529 50FMC CORP. CHICAGO, IL 2812, 2819 4 502,318 50GENERAL ELECTRIC COMPANY FAIRFIELD, CT 2821, 2812, 2869 2 5,010,856 50GEORGIA GULF CORP. ATLANTA, GA 2865, 2812, 2819 1 39,480 80GEORGIA-PACIFIC CORP. ATLANTA, GA 2611, 2621, 2812 1 2,722,182 50HANLIN GROUP INC. EDISON, NJ 2812, 2819 3 6,174 75HM ANGLO-AMERICAN LTD. NEW YORK, NY 2816 4 1,265,741 2HOECHST CELANESE CORP. SOMERVILLE, NJ 2819, 2869, 2873 1 2,603,661 50INTERNATIONAL PAPER COMPANY PURCHASE, NY 28190 1 2,784,831 50ISK AMERICAS INC. SAN FRANCISCO, CA 2879, 2819 2 300,088 50KEMIRA HOLDINGS INC. SAVANNAH, GA 2816, 2819 1 394,070 *KERR-MCGEE CORP. OKLAHOMA CITY,
OK2819 3 374,098 35
LAIDLAW ENVIRONMENTAL COLUMBIA, SCSERVICES
2819, 2869 1 8,167 ***
LAROCHE HOLDINGS INC. ATLANTA, GA 2812, 2869 1 81,470 *MALLINCKRODT GROUP INC. SAINT LOUIS, MO 2869, 2833, 2819 3 775,206 50
Sector Notebook Project Inorganic Chemicals
Parent Company City, State Reported Facilities 1988 to 1993SIC Codes ing (lbs.) % Reduction
# of 1993 ReleasesParticipat- and Transfers
September 1995 SIC 281104
MAYO CHEMICAL CO. INC. SMYRNA, GA 2819 2 15 67MILES INC. PITTSBURGH, PA 2819 3 1,095,504 40MOBIL CORP. FAIRFAX, VA 2869, 2819, 2821 1 4,263,284 50MONSANTO COMPANY SAINT LOUIS, MO 2865, 2869, 2819 3 1,683,580 23MORTON INTERNATIONAL INC. CHICAGO, IL 2819, 2869 1 721,216 20NALCO CHEMICAL COMPANY NAPERVILLE, IL 2899, 2819, 2843 2 107,651 50OCCIDENTAL PETROLEUM CORP. LOS ANGELES, CA 2812, 2819 8 8,896,126 19OLIN CORP. STAMFORD, CT 2819 4 574,673 70PHILLIPS PETROLEUM COMPANY BARTLESVILLE, OK 2911, 2819 2 2,367,877 50PPG INDUSTRIES INC. PITTSBURGH, PA 2812, 2816, 2869 3 2,772,331 50PQ CORP. VALLEY FORGE, PA 2819 3 19 50PROCTER & GAMBLE COMPANY CINCINNATI, OH 28190 1 612,520 *RHONE-POULENC INC. MONMOUTH
JUNCTION, NJ2821, 2819, 2841 6 1,437,778 50
ROHM AND HAAS COMPANY PHILADELPHIA, PA 2819, 2869 1 1,210,244 50SHELL PETROLEUM INC. HOUSTON, TX 2869, 2819 1 3,240,716 55SHEPHERD CHEMICAL CO. CINCINNATI, OH 2819, 2869 1 828 72SHERWIN-WILLIAMS COMPANY CLEVELAND, OH 2816, 2851 1 1,352,412 50STANDARD CHLORINE CHEM. CO. KEARNY, NJ 2865, 2819 1 48,246 ***STAR ENTERPRISE HOUSTON, TX 2911, 2819, 4463 1 601,640 50STERLING CHEMICALS INC. HOUSTON, TX 2869, 2865, 2819 1 182,216 65SUD-CHEMIE NORTH AMERICA DE LOUISVILLE, KY 2819 2 196,438 16TEXACO INC. WHITE PLAINS, NY 2869, 2865, 2819 1 514,803 50TEXAS INSTRUMENTS INC. DALLAS, TX 3674, 3812, 2819 2 344,225 25UNILEVER UNITED STATES INC. NEW YORK, NY 2819 1 164,034 50UNIROYAL CHEMICAL CORP. MIDDLEBURY, CT 2821, 2879, 2813 1 1,970,357 20UNOCAL CORP. LOS ANGELES, CA 2819 1 238,520 50UOP DES PLAINES, IL 2819, 2869 2 14,169 50US DEPARTMENT OF ENERGY WASHINGTON, DC 2819 4 148,198 50VELSICOL CHEMICAL CORP. ROSEMONT, IL 2865, 2819, 2869 1 224,664 50VISTA CHEMICAL COMPANY HOUSTON, TX 2869, 2865, 2819 2 106,497 50VULCAN MATERIALS COMPANY BIRMINGHAM, AL 2869, 2812 2 679,566 85W R GRACE & CO INC. BOCA RATON, FL 2819 2 615,509 50WEYERHAEUSER COMPANY TACOMA, WA 2621, 2611, 2812 1 1,006,356 *WITCO CORP. NEW YORK, NY 2819, 2869 1 327,611 50
* = not quantifiable against 1988 data. ** = use reduction goal only. *** = no numerical goal.
Source: U.S. EPA, Toxic Release Inventory, 1993.
Sector Notebook Project Inorganic Chemicals
September 1995 SIC 281105
Environmental Leadership Program
The Environmental Leadership Program (ELP) is a national initiative pilotedby EPA and state agencies in which facilities have volunteered to demonstrateinnovative approaches to environmental management and compliance. EPAhas selected 12 pilot projects at industrial facilities and federal installationswhich will demonstrate the principles of the ELP program. These principlesinclude: environmental management systems, multimedia complianceassurance, third-party verification of compliance, public measures ofaccountability, community involvement, and mentoring programs. In returnfor participating, pilot participants receive public recognition and are given aperiod of time to correct violations discovered during these experimentalprojects. Forty proposals were received from companies, trade associations,and federal facilities representing many manufacturing and service sectors.Two chemical companies (Ciba Geigy of St. Gabriel, LA and Akzo Chemicalsof Edison, NJ), one pharmaceutical manufacturer (Schering Plough ofKenilworth, NJ), and one manufacturer of agricultural chemicals (GowanMilling of Yuma, AZ) submitted proposals. (Contact: Tai-ming Chang, ELPDirector, 202-564-5081 or Robert Fentress 202-564-7023)
Project XL
Project XL was initiated in March 1995 as a part of President Clinton’sReinventing Environmental Regulation initiative. The projects seek toachieve cost effective environmental benefits by allowing participants toreplace or modify existing regulatory requirements on the condition that theyproduce greater environmental benefits. EPA and program participants willnegotiate and sign a final Project Agreement, detailing specific objectives thatthe regulated entity shall satisfy. In exchange, EPA will allow the participanta certain degree of regulatory flexibility and may seek changes in underlyingregulations or statutes. Participants are encouraged to seek stakeholdersupport from local governments, businesses, and environmental groups. EPAhopes to implement fifty pilot projects in four categories including facilities,sectors, communities, and government agencies regulated by EPA.Applications will be accepted on a rolling basis and projects will move toimplementation within six months of their selection. For additionalinformation regarding XL Projects, including application procedures andcriteria, see the May 23, 1995 Federal Register Notice. (Contact: Jon Kessler,Office of Policy Analysis, 202-260-4034)
Green Lights Program
EPA’s Green Lights program was initiated in 1991 and has the goal ofpreventing pollution by encouraging U.S. institutions to use energy-efficientlighting technologies. The program has over 1,500 participants which includemajor corporations; small and medium sized businesses; federal, state and
Sector Notebook Project Inorganic Chemicals
September 1995 SIC 281106
local governments; non-profit groups; schools; universities; and health carefacilities. Each participant is required to survey their facilities and upgradelighting wherever it is profitable. EPA provides technical assistance to theparticipants through a decision support software package, workshops andmanuals, and a financing registry. EPA’s Office of Air and Radiation isresponsible for operating the Green Lights Program. (Contact: Maria Tikoff202-233-9178 or the Green Light/Energy Star Hotline, 202-775-6650)
WasteWi$e Program
The WasteWi$e Program was started in 1994 by EPA’s Office of Solid Wasteand Emergency Response. The program is aimed at reducing municipal solidwastes by promoting waste minimization, recycling collection, and themanufacturing and purchase of recycled products. As of 1994, the programhad about 300 companies as members, including a number of majorcorporations. Members agree to identify and implement actions to reducetheir solid wastes and must provide EPA with their waste reduction goalsalong with yearly progress reports. EPA, in turn, provides technicalassistance to member companies and allows the use of the WasteWi$e logofor promotional purposes. (Contact: Lynda Wynn 202-260-0700 or theWasteWi$e Hotline, 800-372-9473)
Climate Wise Recognition Program
The Climate Change Action Plan was initiated in response to the U.S.commitment to reduce greenhouse gas emissions in accordance with theClimate Change Convention of the 1990 Earth Summit. As part of theClimate Change Action Plan, the Climate Wise Recognition Program is apartnership initiative run jointly by EPA and the Department of Energy. Theprogram is designed to reduce greenhouse gas emissions by encouragingreductions across all sectors of the economy, encouraging participation in thefull range of Climate Change Action Plan initiatives, and fostering innovation.Participants in the program are required to identify and commit to actions thatreduce greenhouse gas emissions. The program, in turn, gives organizationsearly recognition for their reduction commitments; provides technicalassistance through consulting services, workshops, and guides; and providesaccess to the program’s centralized information system. At EPA, the programis operated by the Air and Energy Policy Division within the Office of PolicyPlanning and Evaluation. (Contact: Pamela Herman 202-260-4407)
Sector Notebook Project Inorganic Chemicals
September 1995 SIC 281107
NICE3
The U.S. Department of Energy and EPA’s Office of Pollution Prevention arejointly administering a grant program called The National IndustrialCompetitiveness through Energy, Environment, and Economics (NICE ). By3
providing grants of up to 50 percent of the total project cost, the programencourages industry to reduce industrial waste at its source and become moreenergy-efficient and cost-competitive through waste minimization efforts.Grants are used by industry to design, test, demonstrate, and assess thefeasibility of new processes and/or equipment with the potential to reducepollution and increase energy efficiency. The program is open to allindustries; however, priority is given to proposals from participants in the pulpand paper, chemicals, primary metals, and petroleum and coal productssectors. (Contact: DOE’s Golden Field Office, 303-275-4729)
The Global Environmental Management Initiative (GEMI) is made up of agroup of leading companies dedicated to fostering environmental excellenceby business. GEMI promotes a worldwide business ethic for environmentalmanagement and sustainable development to improve the environmentalperformance of business through example and leadership. In 1994, GEMI’smembership consisted of about 30 major corporations including AmocoCorporation.
National Pollution Prevention Roundtable
The National Pollution Prevention Roundtable published The PollutionPrevention Yellow Pages in September 1994. It is a compilation ofinformation collected from mail and telephone surveys of state and localgovernment pollution prevention programs. (Contact: Natalie Roy 202-543-7272) The following state programs listed themselves as having expertise inpollution prevention related to inorganic chemical manufacture and use. Thecontacts listed below (Exhibit 27) are also likely to be aware of various state-and local-level initiatives affecting the inorganic chemical industry.
Sector Notebook Project Inorganic Chemicals
September 1995 SIC 281108
Exhibit 27: Contacts for State and Local Pollution Prevention Programs
State Program Contact Telephone
Alabama AL Dept. of Env. Protection, Ombudsman and Blake Roper, (800) 533-2336Small Business Assistance Program Michael Sherman (205) 271-7861
AL WRATT Foundation Roy Nicholson (205) 386-3633
California CA State Dept. of Toxic Substances Control David Harley, Kim (916) 322-3670Wilhelm, KathyBarwick
County Sanitation Districts of LA Michelle Mische (310) 699-7411
Colorado Region VIII HW Minimization Program Marie Zanowich (303) 294-1065
Illinois IL HW Research and Information Center David Thomas (217) 333-8940
Indiana IN Dept. of Env. Mgmt. Tom Neltner (317) 232-8172
Iowa IA Dept. of Natural Resources Larry Gibson (515) 281-8941
Kentucky KY Partners, State Waste Reduction Center Joyce St. Clair (502) 852-7260
Massachusetts Toxics Use Reduction Institute Janet Clark (508) 934-3346
Michigan University of Detroit Mercy Daniel Klempner (313) 993-3385
New Mexico Waste Management Education and Research Ron Bhada (505) 646-1510Consortium
North Dakota Energy and Env. Research Center Gerald Groenewold (701) 777-5000
Ohio Institute of Advanced Manufacturing Sciences Harry Stone, Sally (513) 948-2050Clement
Pennsylvania Center for Hazardous Materials Research Roger Price, Steven (412) 826-5320Ostheim
Rhode Island RI Center for P2, URI Stanley Barnett (401) 792-2443
South Clemson University Eric Snider (803) 656-0985Carolina
Texas TX Natural Resource Conservation Commission Andrew Neblett (512) 239-3100
Vermont Retired Engineers and Professionals Program Muriel Durgin (802) 879-4703
Washington WA State Dept. of Ecology Peggy Morgan (206) 407-6705
Wisconsin WI Dept. of Natural Resources, Robert Baggot (608) 267-3136Small Business Assistance Program
Wyoming WY Dept. of Env. Quality Charles Raffelson (307) 777-7391
Center for Waste Reduction Technologies
Sector Notebook Project Inorganic Chemicals
September 1995 SIC 281109
Center for Waste Reduction Technologies, under the aegis of the AmericanInstitute of Chemical Engineers, sponsors research on innovative technologiesto reduce waste in the chemical processing industries. The primarymechanism is through funding of academic research.
National Science Foundation and the Office of Pollution Prevention and Toxics
The National Science Foundation and EPA's Office of Pollution Preventionand Toxics signed an agreement in January of 1994 to coordinate the twoagencies' programs of basic research related to pollution prevention. Thecollaboration will stress research in the use of less toxic chemical andsynthetic feedstocks, use of photochemical processes instead of traditionalones that employ toxic reagents, use of recyclable catalysts to reduce metalcontamination, and use of natural feedstocks when synthesizing chemicals inlarge quantities.
Chemical Manufacturers Association
The Chemical Manufacturers Association funds research on issues ofinterest to their members particularly in support of their positions on proposedor possible legislation. They recently funded a study to characterize theenvironmental fate of organochlorine compounds.
Responsible Care Program
The Responsible Care Program of the Chemical Manufacturers Associationrequires members to pledge commitment to six codes that identify 106management practices that companies must carry out in the areas ofcommunity awareness and emergency response, pollution prevention, processsafety, distribution, employee health and safety, and product stewardship.
ISO 9000
ISO 9000 is a series of international total quality management guidelines.After a successful independent audit of their management plans, firms arequalified to be ISO 9000 registered. In June of 1993, the InternationalStandards Organization created a technical committee to begin work on newstandards for environmental management systems. The new standards arecalled ISO 14000 and are expected to be issued in 1996.
Sector Notebook Project Inorganic Chemicals
September 1995 SIC 281110
VII.C.2. Summary of Trade Associations
Chemical Industry
American Chemical Society1155 16th Street, NW Washington, D.C. 20036 Members: 145,000Phone: (202) 872-8724 Staff: 1700Fax: (202) 872-6206 Budget: $192,000,000
The American Chemical Society (ACS) has an educational and research focus.The ACS produces approximately thirty different industry periodicals andresearch journals, including Environmental Science and Technology andChemical Research in Toxicology. In addition to publishing, the ACSpresently conducts studies and surveys; legislation monitoring, analysis, andreporting; and operates a variety of educational programs. The ACS libraryand on-line information services are extensive. Some available on-lineservices are Chemical Journals Online, containing the full text of 18 ACSjournals, 10 Royal Society of Chemistry journals, and five polymer journals,and the Chemical Abstracts Service (CAS), which provides a variety ofinformation on chemical compounds. Founded in 1876, the ACS is presentlycomprised of 184 local groups and 843 student groups nationwide.
Chemical Manufacturers Association2501 M St., NW Members: 185Washington, D.C. 20037 Staff: 246Phone: (202) 887-1164 Budget: $36,000,000Fax: (202) 887-1237 Contact: Joseph Mayhew
Presently, the principle focus of the Chemical Manufacturers Association(CMA) is on regulatory issues facing chemical manufacturers at the local,state, and federal level. At its inception in 1872, the focus of the CMA wason serving chemical manufacturers through research. Research is still ongoingat the CMA, however, as the CHEMSTAR program illustrates. CHEMSTARconsists of a variety of self-funded panels working on single-chemical researchagendas. This research fits in with the overall regulatory focus of the CMA;CHEMSTAR study results are provided to both CMA membership andregulatory agencies. Other initiatives include the "responsible care" program.Membership in the CMA is contingent upon enrollment in the "responsiblecare" program, which includes six codes of management practice (includingpollution prevention) that attempt to "go beyond simple regulatorycompliance.” The CMA also conducts workshops and technical symposia,promotes in-plant safety, operates a chemical emergency center(CHEMTREC) which offers guidance in chemical emergency situations, andoperates the Chemical Referral Center which provides chemical health andsafety information to the public. Publications include: ChemEcology, a 10-
Sector Notebook Project Inorganic Chemicals
September 1995 SIC 281111
issue-per-year newsletter covering environmental, pollution-control, worker-safety, and federal and state regulatory actions, and the CMA Directory, alisting of the CMA membership. The CMA holds an annual meeting in WhiteSulphur Springs, WV.
Chlor-alkali Industry
The Chlorine Institute, Inc.2001 L Street, N.W. Suite 506Washington, D.C. 20036 Members: 200Phone: (202) 223-2790 Budget: $1,500,000Fax: (202) 223-7225 Contact: Gary Trojak
The Chlorine Institute, Inc. was established in 1924 and represents companiesin the U.S., Canada, and other countries that produce, distribute, and usechlorine, sodium and potassium hydroxides, and sodium hypochlorite; and thatdistribute and use hydrogen chloride. The Institute is a non-profit scientificand technical organization which serves as a safety, health, and environmentalprotection center for the industry.
The Chlorine Chemistry Council (CCC), established in 1993, is a businesscouncil of the Chemical Manufacturers Association (CMA) and is made up ofproducers and users of chlorine and chlorine-related products. Withinvolvement from all stakeholders, the CCC works to promote science-basedpublic policy regarding chlorine chemistry and is committed to develop andproduce only those chemicals that can be manufactured, transported, used,and disposed of safely. CCC facilitates risk-benefit analyses and productstewardship through the collection, development, and use of scientific data onhealth, safety, and environmental issues. CCC hopes to heighten publicawareness of chlorine chemistry and its many societal benefits by collaboratingwith the public health and scientific community in assessing andcommunicating chlorine-related human health and environmental issues.
Sector Notebook Project Inorganic Chemicals
Many of the contacts listed above have provided valuable background information and comments during thef
development of this document. EPA appreciates this support and acknowledges that the individuals listed do notnecessarily endorse all statements make within this notebook.
September 1995 SIC 281112
IX. CONTACTS/ACKNOWLEDGMENTS/RESOURCE MATERIALS/BIBLIOGRAPHY
For further information on selected topics within the inorganic chemicalsindustry a list of contacts and publications are provided below:
Contactsf
Name Organization Telephone Subject
Walter DeRieux EPA/OECA (202) 564-7067 Regulatory requirements and complianceassistance
Sergio Siao EPA/NEIC (303) 236-3636 Industrial processes and regulatoryrequirements
George Zipf EPA/OW (202) 260-2275 Regulatory requirements (Water)
Rick Brandes EPA/OSWER (202) 260-4770 Regulatory requirements (Solid waste)
Ed Burks EPA/Region IV (404) 347-5205 Inspections, regulatory requirements(RCRA)
Jim Gold EPA/Region VI (713) 983-2153 Inspections and regulatory requirements(Water, AIR and TSCA)
OECA: Office of Enforcement and Compliance AssistanceNEIC: National Enforcement Investigations CenterOAQPS: Office of Air Quality Planning and StandardsOW: Office of WaterOSWER: Office of Solid Waste and Emergency Response
General Profile
U.S. Industrial Outlook 1994, Department of Commerce
1987 Census of Manufacturers, Industry Series, Industrial Inorganic Chemicals, Bureau of theCensus [Published every five years the next version will be available in September of 1994]
1992 Census of Manufacturers, Preliminary Report Industry Series, Industrial Inorganic Chemicals,Bureau of the Census [Data will be superseded by a more comprehensive report in September of1994]
Sector Notebook Project Inorganic Chemicals
September 1995 SIC 281113
Chlorine and Its Derivatives: A World Survey of Supply, Demand, and Trade to 1992, TecnonConsulting Group, London, 1988.
North American Chlor-Alkali Industry Plants and Production Data Book, Pamphlet 10, The ChlorineInstitute, Washington, D.C., January, 1989.
Process Descriptions and Chemical Use Profiles
Riegel’s Handbook of Industrial Chemistry, 9th ed., Kent, James A., Ph.D., editor, Van NostrandReinhold, New York, 1993.
Kirk-Othmer Encyclopedia of Chemical Technology, Fourth edition, volume 1, John Wiley and Sons,New York, 1994.
Multi-media Assessment of the Inorganic Chemicals Industry, Chapter 12-Salt Derivatives, Preparedfor U.S. EPA Industrial Environmental Research Laboratory by Verser, Inc., Springfield, Virginia,1980.
Recommendations To Chlor-alkali Manufacturing Facilities for the Prevention of ChlorineReleases, The Chlorine Institute, First Edition, October, 1990.
Assessment of Solid Waste Management Problems and Practices in the Inorganic ChemicalsIndustry, Final Report, Versar, Inc. for U.S. Environmental Protection Agency, IndustrialEnvironmental Research Laboratory, Cincinnati, Ohio, April 1979.
Chlorine, Its Manufacture, Properties, and Uses, J.S. Sconce, Reinhold Publishing Corp., New York,1962.
Electrolytic Manufacture of Chemicals from Salt, D.W.F. Hardie and W.W. Smith, The ChlorineInstitute, New York, 1975.
Modern Chlor-Alkali Technology, Vol. 4, N.M. Prout and J.S. Moorhouse, eds., Elsevier AppliedScience, 1990.
Regulatory Profile
Sustainable Environmental Law, Environmental Law Institute, West Publishing Co., St. Paul, Minn.,1993.
Development Document for Effluent Limitations Guidelines and New Source Performance Standardsfor the Major Inorganic Products Segment of the Inorganic Chemicals Point Source Category, U.S.Environmental Protection Agency, Washington, D.C., March 1974. Report No. EPA-440/1-74-007a.
Sector Notebook Project Inorganic Chemicals
September 1995 SIC 281114
1. U.S. Department of Commerce. U.S. Industrial Outlook 1994. January 1994.
2. U.S. Department of Commerce, Bureau of the Census. 1994 Census of Manufacturers,Industrial Inorganic Chemicals. April 1995.
3. U.S. Department of Commerce. U.S. Industrial Outlook 1994. January 1994.
4. U.S. Department of Commerce, Bureau of the Census. 1994 Census of Manufacturers,Industrial Inorganic Chemicals. April 1995.
31. Kirk-Othmer Encyclopedia of Chemical Technology, Fourth Ed. New York: John Wiley andSons, 1994.
32. Ibid.
33. Ibid.
34. Ibid.
35. Ibid.
36. Ibid.
37. Ibid.
38. Ibid.
39. Versar, Inc. Multi-Media Assessment of the Inorganic Chemicals Industry. Ch. 12.Cincinnati, Ohio: U.S. EPA Industrial Environmental Research Laboratory, August, 1980.
40. Versar, Inc. Multi-Media Assessment of the Inorganic Chemicals Industry. Ch. 12.Cincinnati, Ohio: U.S. EPA Industrial Environmental Research Laboratory, August, 1980.
Sector Notebook Project Inorganic Chemicals
September 1995 SIC 281116
41. Ibid.
42. Ibid.
43. Ibid.
44. Ibid.
45. Ibid.
46. Ibid.
47. Ibid.
48. Ibid.
49. Ibid.
50. Ibid.
51. Ibid.
52. Ibid.
53. Ibid.
54. Ibid.
55. U.S. EPA Office of Pollution Prevention and Toxics. 1993 Toxics Release Inventory PublicData Release. May 1994.
56. Ibid.
57. Kent, James A. Ph.D., editor. Riegel’s Handbook of Industrial Chemistry, 9th ed. New York:Van Nostrand Reinhold, 1993.