+ All Categories
Home > Documents > Sector Report Pharmaceuticals f

Sector Report Pharmaceuticals f

Date post: 20-Feb-2022
Category:
Upload: others
View: 5 times
Download: 0 times
Share this document with a friend
103
October 2021 Edelweiss Securities Limited Sector Report Pharmaceuticals Resetting Expectations f cus Kunal Randeria +91 22 6620 3040 Kunal.Randeria@edelweissfin.com Aashita Jain +91 22 6623 3463 Aashita.Jain m @edelweissfin.co
Transcript

October 2021

Edelweiss Securities Limited

Sector Report

Pharmaceuticals

Resetting Expectations

fcus

Kunal Randeria+91 22 6620 [email protected]

Aashita Jain+91 22 6623 3463Aashita.Jain [email protected]

Edelweiss Research is also available on www.edelweissresearch.com, Bloomberg - EDEL, Thomson Reuters, and Factset Edelweiss Securities Limited

Pharmaceuticals

Contents

Executive Summary ...................................................................................... 2

Story in charts ............................................................................................... 5

US: Prefer players with healthy pipeline ...................................................... 7

Biosimilars: No white knight....................................................................... 17

Domestic – Too early to panic .................................................................... 22

Right capital allocation to drive returns ..................................................... 30

What’s in store for covid portfolio? ........................................................... 35

Valuations: Expensive but not prohibitive ................................................. 40

Companies

Ajanta Pharma ............................................................................................ 44

Alkem Laboratories .................................................................................... 48

Aurobindo Pharma ..................................................................................... 52

Biocon ......................................................................................................... 56

Cadila Healthcare ....................................................................................... 60

Cipla ............................................................................................................ 64

Divi’s Laboratories ...................................................................................... 68

Dr. Reddy’s Laboratories ............................................................................ 72

Glenmark Pharmaceuticals ........................................................................ 76

Ipca Laboratories ........................................................................................ 80

Lupin ........................................................................................................... 84

Natco Pharma ............................................................................................. 88

Sun Pharmaceuticals .................................................................................. 92

Torrent Pharmaceuticals ............................................................................ 96

Pharmaceuticals

Edelweiss Securities Limited

2 Edelweiss Research is also available on www.edelweissresearch.com, Bloomberg - EDEL, Thomson Reuters, and Factset

Executive Summary

The Indian pharma sector had an exceptional performance with Nifty Pharma index delivering ~100% return in the last 18 months. But with covid-related tailwinds receding, we believe it’s time to refocus on the basics for the sector considering: i) challenging near-term US outlook as companies contend with high single-digit price erosion and crowded P-4 opportunities; ii) secondary data show IPM is recovering to normalcy, but sustained volume recovery is key; iii) a more prudent R&D approach, focus on profit-oriented growth, and debt and working

capital improvement would lift RoCE ~150bp annually; and iv) leaner balance sheets may spur inorganic moves.

Not on steroids, but the sector is trading at a six-year high, and therefore the next cycle makes a compelling case of bottom-up analysis. Greater divergence in stock performance would be visible and companies with efficient business models, de-risked approach

and more pronounced RoCEs and earnings growth are likely to fetch a premium. We anticipate a ‘revert to fundamentals’, and argue that stocks with greater branded footprint, a sticky US portfolio, diversified geographical presence and proven execution would outperform. Top

picks: SUNP: play on specialty; CIPLA: branded play with a sticky US portfolio; and AJP and ALKM: branded plays with proven execution.

Evolving business model to assist profitable growth

Even prior to the pandemic, the pharma industry had started showing signs of

recovery—cleaning up of balance sheets by aggressively retiring debt, cost-

optimisation programs and divestment of non-core assets. Most heartening though,

in our view, is realigning of capital allocation decisions and concentrating on areas

of strength—targeted investments in certain therapies (Sun Pharma:

oncology/derma; Cipla: respiratory; Lupin: respiratory/women’s health) or certain

businesses (Aurobindo and Dr. Reddy’s in injectables).

We particularly like the strategy that a few players such as Cipla have adopted—to

venture into specialty, which entails a small upfront payment and the rest is based

on milestones. This keeps balance sheet and P&L unharmed, even in case of an

adverse outcome.

We acknowledge innovation is critical to survive; the focus though is not on trying

to get a toehold in everything, but a foothold in preferred niches. On the whole, the

pharma sector is healthier than it was two years ago, but strong earnings

momentum is needed to keep the pharma rally going.

US: Targeted investments to ensure growth

Price erosion, innovator aggression and less profitable shared exclusivities are the

bugbears for Indian pharma players. But we note: i) ongoing drug shortages in the US

are near an all-time high, which should limit further price pressure (from high single-

digit level today); ii) US generic majors such as Teva, Amneal and Mylan have scaled

down their oral solids presence, focusing more on complex products and diversifying

outside the US; iii) several Para IV or limited competition opportunities should keep

the US ticking for Indian players; and iv) large players are exploiting M&A/partnerships,

targeting selective therapy areas/delivery systems/product forms.

Companies are exhibiting prudent capital

allocation decision and concentrating on

core areas of strength

Edelweiss Securities Limited

Pharmaceuticals

Edelweiss Research is also available on www.edelweissresearch.com, Bloomberg - EDEL, Thomson Reuters, and Factset 3

Furthermore, market participants with cost arbitrage – backward integrated – and

successful US FDA inspection track records have a better chance to succeed.

Biosimilars: Next growth engine; no white knight

Investments in biosimilars have been increasing given high entry barriers, a

USD200bn market, limited competition and a stickier revenue stream. However,

faster-than-expected price erosion and lower-than-expected biosimilar penetration,

especially in the US, have limited its commercial potential so far. The big players

ruling the roost and innovators getting aggressive on pricing further add to

challenges.

Domestic market: Too early to panic

Even before the lockdown, Indian Pharmaceutical Market (IPM) volumes were

strained. Volume revival is hence critical for sustainable growth. However, India’s

disease profile, fewer incentives for Jan Aushadhi, and possible enforcement of

margin capping on trade generics should see a beginning of volume revival in brands,

in our view.

While covid-influenced drugs drove supernormal growth in April and May, growth

settled around 14% in June and July, and 18% in August. Covid influenced drugs are

still playing a role, but recovery in therapies such as pain management, neuro and

opthal show other parts of IPM are coming back to life. We expect price growth to

remain steady and launches to help offset volume decline.

Overall, we project IPM would grow 10–11% for the next few years. If the recent

National List of Essential Medicines (NLEM) is anything to go by, DPCO impact [Drug

Pricing Control Order] is likely to pose a limited risk to the sector.

Valuations: Expensive, but not prohibitive

The pharma sector multiples are trading at a six year high with Nifty Pharma at 27x

PE and ~17x EV/EBITDA one-year forward. However, a re-rating in the broader

market has compressed the pharma premium to Nifty to 20%, which is below the

10-year average (~37%).

We believe some premium would endure (although it may not be at previous highs)

as the sector enters the cycle of more secure RoCEs, efficient business models and

de-risked approach.

FDA inspections: False sense of security?

Over the last 18 months, FDA inspections have been conspicuous by their absence.

This has lulled investors into a fall sense of comfort, in our view. Barring Alembic

Pharma, Lupin (US and Goa plants) and recently Aurobindo’s Unit-1 and Biocon

(Malaysia plant) inspections, physical inspections are yet to take place.

While regulatory outcomes are a zero-sum game from a sectoral perspective (loss in

revenue for one company is gain for another), it could undermine multiples for the

sector at large. Considering Indian pharma companies are differently positioned to

tackle the upcoming inspection cycle, it remains a key overhang for the sector as the

risk perception would likely spike.

Biosimilars, while appealing, have limited

commercial potential so far on account of

faster-than-expected price erosion, lower-

than-expected biosimilar penetration and

innovators aggression.

IPM has shown glimpses of recovery post-

covid as key impacted therapies have

rebounded sharply

Pharmaceuticals

Edelweiss Securities Limited

4 Edelweiss Research is also available on www.edelweissresearch.com, Bloomberg - EDEL, Thomson Reuters, and Factset

What’s a healthy pick? Prefer stocks with greater earnings visibility

We prescribe stocks that offer earnings visibility and a business moat that can help

tide over business cycles. Our top picks are therefore SUNP and Cipla among large-

caps, and AJP and ALKM in mid-caps.

SUNP: Acceleration in specialty should drive up margin. But the stock’s current

multiple does not account for near-term specialty losses in our view; hence, we value

its core portfolio at a discount to peers. ‘BUY’ with TP of INR970.

Cipla: Another preferred large-cap pick as it has a robust domestic business with and

an improving US business. This is complemented by steady launches, complex

generics visibility, better execution as seen with gProventil and gSensipar and a low-

risk specialty foray. ‘BUY’ with TP of INR1,140.

Ajanta Pharma is a mid-cap pick that offers a high-quality proven branded franchise

and top-notch execution in the US. ‘BUY’ with TP of INR2,885.

Alkem’s strong brand equity across therapies, domestic execution and operating

leverage are the key investment rationale. That its investments are largely done is a

key source of comfort on this mid-cap. ‘BUY’ with TP of INR4,600.

Key risks

US FDA inspection: The issuance of form 483 with observations remains one of the

key risks for US exposed players. Also, it may result in failure or delay in approvals

for key products

Deeper-than-expected price erosion in the US: Increased competition in the US,

resolution of drug shortages and excessive supply may even lead to deeper-than-

expected price erosion, which may impact profitability of the US business.

Returns-dilutive acquisitions: As balance sheets are becoming leaner, it may spur

inorganic moves. Such acquisitions may be returns-dilutive.

Price control risk in India: Addition of drugs to the National List of Essential

Medicines may limit drug price increase and hurt profitability.

Currency risk: Given exposure to exports markets, unfavourable exchange rate

movements may impact sales and profitability.

Pharma valuation table - Edelweiss coverage

Source: Company, Edelweiss Research

CMP Target Reco Mcap

(USD bn)

CAGR (%)

(FY21-24E)

INR mn INR Price FY21 FY22E FY23E FY24E FY21 FY22E FY23E FY24E FY21 FY22E FY23E FY24E FY21 FY22E FY23E FY21 FY22E FY23E

Sun Pharma 827 970 BUY 26.76 3,34,981 3,80,384 4,29,455 4,97,458 84,833 1,01,442 1,25,834 1,62,404 24.7 28.0 36.6 48.7 20.2 33.4 29.5 22.6 23.0 18.8 14.1

Dr. Reddy's 4,956 5,150 HOLD 11.08 1,89,722 2,23,099 2,52,347 2,90,567 44,682 48,189 65,105 85,427 142.9 179.7 256.1 346.4 24.4 34.7 27.6 19.4 18.3 16.6 11.5

Cipla 986 1,140 BUY 10.72 1,91,596 2,15,232 2,35,579 2,69,662 42,524 48,700 59,120 69,536 29.8 37.2 46.7 55.6 14.4 33.0 26.5 21.1 18.2 15.7 12.3

Biocon 365 335 REDUCE 5.91 71,058 83,183 1,13,237 1,41,945 16,526 22,350 32,557 44,018 6.1 7.0 13.1 18.9 39.0 59.6 52.0 27.9 27.7 20.7 13.7

Aurobindo 717 990 BUY 5.67 2,47,747 2,48,204 2,66,774 3,00,258 53,335 53,161 59,474 73,509 55.0 57.2 62.6 79.0 11.4 13.0 12.5 11.5 7.8 7.9 6.2

Torrent Pharma 3,081 2,850 REDUCE 7.04 80,050 87,170 1,00,306 1,12,785 24,850 27,191 31,928 36,664 74.0 75.6 95.2 114.3 14.8 41.7 40.8 32.4 22.7 20.2 16.3

Lupin 966 1,060 HOLD 5.92 1,51,630 1,67,492 1,92,119 2,32,074 25,669 30,122 39,663 53,692 26.8 34.1 49.0 71.0 27.7 36.0 28.4 19.7 17.4 14.8 10.8

Cadila 556 515 REDUCE 7.67 1,51,022 1,60,907 1,71,267 1,95,481 33,410 35,903 38,406 47,719 22.7 21.5 23.4 30.3 12.1 24.5 25.8 23.7 18.7 16.0 14.6

Large Cap ####### 3,67,059 4,52,087 5,72,969 382 463 463 463 24.0 34.1 29.8 22.3 18.6 16.1 12.3

Alkem 3,990 4,600 BUY 6.44 88,765 1,05,517 1,16,632 1,31,405 19,539 21,602 25,248 28,709 132.6 140.7 170.0 189.8 12.7 30.1 28.4 23.5 24.3 21.6 17.6

Ipca 2,424 2,800 BUY 4.15 54,199 60,511 69,055 77,681 15,443 15,697 18,864 21,329 90.0 91.5 112.1 118.2 9.5 26.9 26.5 21.6 19.5 19.1 15.0

Ajanta 2,260 2,885 BUY 2.67 28,896 32,973 37,773 42,138 9,985 10,621 12,439 13,887 74.5 88.8 105.8 121.9 17.8 30.3 25.5 21.4 19.5 17.9 14.4

Glenmark 513 570 HOLD 1.95 1,09,440 1,22,107 1,26,199 1,36,061 20,845 22,486 22,315 24,281 33.3 34.4 34.2 38.3 4.7 15.4 14.9 15.0 8.6 7.4 7.0

Natco 903 970 HOLD 2.17 20,521 22,286 29,830 40,048 6,062 7,243 13,275 21,025 24.7 30.8 57.3 91.7 54.9 36.6 29.3 15.8 26.3 21.8 10.5

Mid Cap 71,873 77,648 92,141 1,09,231 33 29 29 29 18.4 28.5 26.1 20.8 18.2 16.5 13.0

Overall - Generics ####### 4,44,707 5,44,228 6,82,200 #DIV/0! 33.1 29.2 22.0 18.5 16.2 12.5

Divi's Labs 4,832 5,410 HOLD 17.3 69,694 88,733 1,11,173 1,30,465 28,599 38,253 49,185 58,204 74.9 104.4 135.3 160.4 28.9 64.5 46.3 35.7 44.1 33.0 25.1

Overall ####### 4,82,960 5,93,413 7,40,404 415 492 492 492 37.8 31.7 24.1 20.2 17.5 13.5

Sales (INR mn) EBITDA (INR mn) EV/ EBITDA (x) EPS (INR) P/E (x)

Prefer stocks with earnings visibility and a

business moat to tide over business cycles

Edelweiss Securities Limited

Pharmaceuticals

Edelweiss Research is also available on www.edelweissresearch.com, Bloomberg - EDEL, Thomson Reuters, and Factset 5

Story in charts US generic pricing, which eased to mid-single digit, has reverted to high single-digit erosion

Source: IQVIA, Edelweiss Research

Drug shortages to keep price erosion under check

Source: FDA, Edelweiss Research

Sector RoCEs to improve ~340bps over FY21–23E

Source: Company, Edelweiss Research

Volume GR impacted before covid seeing revival

Source: AIOCD; Note: GR= growth

Acute therapies worst hit have started to recover

Source: AIOCD

0

25

50

75

100

125

-15

-7

1

9

17

25

Oct

-14

Feb-

15

Jun-

15

Oct

-15

Feb-

16

Jun-

16

Oct

-16

Feb-

17

Jun-

17

Oct

-17

Feb-

18

Jun-

18

Oct

-18

Feb-

19

Jun-

19

Oct

-19

Feb-

20

Jun-

20

Oct

-20

Feb-

21

Jun-

21

Gen

eric

YoY

pri

cing

cha

nge

Generic pricing FDA approvals

CAH expectes inflation to decelerate

FDA approvals ramp considerably

ABC states generic inflation has slowed significantly

MCK reduced FY17 inflation outlook to a range that includes zero

ClarusONE sourcingagreement announced

Endo: Consortiumpressure reason

for pricing pressure

Teva finalisesClarusONE contract

FDA approvals ramp further

Teva, Sandoz, Mylan announce portfolio

rationlisation

Generic Injectables help to offset

persistent deflation in generic Oral Solids

Erosion easing on demand shortages

Erosion to settle around high single digit

0

25

50

75

100

125

20

13

20

14

20

15

20

16

20

17

20

18

20

19

20

20

Au

g-2

1

No

s.

No. of ongoing drug shortages

5

10.4

15.8

21.2

26.6

32FY

13

FY14

FY15

FY16

FY17

FY18

FY19

FY20

FY2

1E

FY2

2E

FY2

3E

(%)

RoCE (%) RoCE ex-domestic

RoCE bottomed to 11% (ex-domestic 6%) in FY20 from its peak of ~27% (ex-domestic 22%) in FY14

Increasing investments and declining profitability impacted RoCEs

RoCEs expected to increase ~340bs over FY21-23E

5.7 5.4 4.2 2.7 2.3 1.6

-5.4

4.59.0

2.3 4.12.1

-0.7

3.5 5.34.8

5.7

5.95.4

5.0

3.5

3.3

3.4 2.72.6

3.5

2.9

-6

-1

4

9

14

19

FY1

5

FY1

6

FY1

7

FY1

8

FY1

9

FY2

0

FY2

1

Jul'2

1

Au

g'2

1

Volume GR Price GR New Introduction GR

-18

-7

4

15

26

37

FY1

9

FY2

0

FY2

1

Au

g'2

1

FY1

9

FY2

0

FY2

1

Au

g'2

1

FY1

9

FY2

0

FY2

1

Au

g'2

1

Anti-infective Respiratory Pain

Volume GR (%) Price GR (%) NI GR (%)

Pharmaceuticals

Edelweiss Securities Limited

6 Edelweiss Research is also available on www.edelweissresearch.com, Bloomberg - EDEL, Thomson Reuters, and Factset

Sector debt to remain at comfortable levels

Source: Company, Edelweiss Research

Lower capex and high value launches to propel FCF

Source: Company, Edelweiss Research

Pharma index trading at 26.7x 1 year forward; ~20% premium to Nifty

Source: Bloomberg, Edelweiss Research

0

0.4

0.8

1.2

1.6

2

FY1

7

FY1

8

FY1

9

FY2

0

FY2

1E

FY2

2E

FY2

3E

FY2

4E

Sector Debt/EBITDA

-250

-150

-50

50

150

250

FY1

7

FY1

8

FY1

9

FY2

0

FY2

1E

FY2

2E

FY2

3E

FY2

4E

INR

bn

Sector FCF Capex

-15

5

25

45

65

85

Jan

-14

Oct

-14

Jul-

15

Ap

r-1

6

Jan

-17

Oct

-17

Jul-

18

Ap

r-1

9

Jan

-20

Oct

-20

Jul-

21

Nifty Index PE Nifty Pharma Index PE Relative Premium

Pharma index is trading at 26.7x (~20% premiumto Nifty)

Edelweiss Securities Limited

Pharmaceuticals

Edelweiss Research is also available on www.edelweissresearch.com, Bloomberg - EDEL, Thomson Reuters, and Factset 7

US: Prefer players with healthy pipeline

The bulk of investments in the US by Indian pharma players have gravitated towards complex generics and biosimilars as US generics market faced multiple headwinds over the last five years—commoditisation of oral solids, pricing pressure and intensifying competition, among others.

The complex opportunity looks promising, but Indian players have had a mixed bag so far. Meanwhile, sole exclusivities for the first-to-file in

the US for large opportunities are giving way to less profitable shared exclusivities, not to mention heightened aggression by innovators to hold onto their market shares.

Challenges aside, Indian players have opportunities to capture. We note: i) ongoing drug shortages in the US are at an all-time high, which should ensure price erosion does not breach into double-digits; ii) Indian pharma companies have started milking their investments and are present in several Para IV or limited competition areas in the near term and this should keep the US ticking for them; and iii) large players are exploiting M&A/partnerships, targeting selective therapy

areas/ delivery systems/product forms.

Overall, sector RoCEs, which bottomed out to 11% (ex-domestic 6%) in FY20 from peak of ~27% (ex-domestic 22%) in FY14, are likely to rise ~150bps annually. Furthermore, pharma players with cost arbitrage, especially those that are backward integrated and have successful FDA inspection track record, stand a better chance to succeed.

US – Balancing expectations

The US generics market has faced multiple headwinds in the last five years:

commoditisation of oral solids and buyer consolidation resulting in pricing pressure.

Top 8 Indian companies’ revenue in the US

Source: Company, Edelweiss Research

1000

1200

1400

1600

1800

2000

Q1

FY1

4

Q3

FY1

4

Q1

FY1

5

Q3

FY1

5

Q1

FY1

6

Q3

FY1

6

Q1

FY1

7

Q3

FY1

7

Q1

FY1

8

Q3

FY1

8

Q1

FY1

9

Q3

FY1

9

Q1

FY2

0

Q3

FY2

0

Q1

FY2

1

Q3

FY2

1

Q1

FY2

2

(USD

mn

)

Top 8 Indian companies US revenue

Average 8% YoY decline

Average 5% YoY increase

Pharma players with cost arbitrage,

especially those that are backward

integrated, healthy launch pipeline and have

successful FDA inspection track record,

stand a better chance to succeed.

Pharmaceuticals

Edelweiss Securities Limited

8 Edelweiss Research is also available on www.edelweissresearch.com, Bloomberg - EDEL, Thomson Reuters, and Factset

RoCE: Set to improve ~340bps over FY21–23E

Source: Company, Edelweiss Research

Complex generics – A mixed bag: While Indian pharma companies are trying to

move up the value chain and target complex/specialty opportunity, their success has

been a mixed bag so far- Successful: mesalamines, metformin XR, respiratory such

as albuterol, doxorubicin. Moderate success- gSuboxone; Setbacks- gNuvaring (GNP,

DRRD), gCopaxone (Biocon, DRRD), long acting injectables such as Sandostatin LAR,

Iron sucrose, Invega sustenna, Lupron depot.

Success in complex generics? A mixed bag so far

Drug Company

Successful Mesalamines Cadila

Metformin XR Sun Pharma, Lupin, Glenmark, ARBP, AJP, Granules

Albuterol Cipla, Lupin

Doxil liposome Sun Pharma, Dr. Reddy's, Cadila

Concerta Sun Pharma, Dr. Reddy's

Moderate success Suboxone Dr. Reddy's (18% market share)

Biosimilars Biocon

Non-so-successful Nuvaring Glenmark withdrew; Dr. Reddy's

Copaxone Dr. Reddy's, Biocon (CRL)

Sandostatin LAR Sun Pharma, Dr. Reddy's, Aurobindo

Lupron Depot Sun Pharma, Dr. Reddy's, Lupin, Aurobindo

Venofer (Iron Sucrose) Sun Pharma, Dr. Reddy's

Invega sustenna Dr. Reddy's, Aurobindo

Invega Trinza Dr. Reddy's

Source: Edelweiss Research

Indian pharma companies will continue to invest in building their respective

capabilities. In the last one and half year, the companies have started milking their

investments by identifying pocket of opportunities such as Para IV or differentiated

products with limited competition. This is evident from the recent filings/approvals:

Cipla (albuterol and Advair), Lupin (albuterol), Dr. Reddy’s (gCiprodex, gSuboxone,

Kuvan), Cadila (mesalamine) and Glenmark (gBrovana). This coupled with the key

near-term opportunities should keep the US ticking for Indian players.

5

10.4

15.8

21.2

26.6

32

FY1

3

FY1

4

FY1

5

FY1

6

FY1

7

FY1

8

FY1

9

FY2

0

FY2

1E

FY2

2E

FY2

3E

(%)

RoCE (%) RoCE ex-domestic

RoCE bottomed to 11% (ex-domestic 6%) in FY20 from its peak of ~27% (ex-domestic 22%) in FY14

Increasing investments and declining profitability impacted RoCEs RoCEs expected to

increase ~340bs over FY21-23E

Edelweiss Securities Limited

Pharmaceuticals

Edelweiss Research is also available on www.edelweissresearch.com, Bloomberg - EDEL, Thomson Reuters, and Factset 9

Improving revenue mix to ease pricing pressure…

While oral solids continue to be key cogs due to their sheer volumes every year, the

approval of other product forms is fast catching up. Comparing the 2010–14 period

to 2019, while the oral solids approvals have increased ~75%, approvals for

injectables have shot up 105%, topicals by ~300% and ophthal by ~175%. Higher

complexity, R&D requirements and lower probability of success means that fewer

companies are going along this route. However, we expect new entrants over

coming years due to sticky revenue and better margin profile.

Approval pie changing rapidly

Source: FDA, PharmForward, Edelweiss Research

…and so for the Indian formulation players

Likewise, the pie of Indian formulators has also shifted toward complex generics.

They are targeting opportunities in topicals, injectables, derma and inhalation,

among others.

Indian players targeting differentiated products

Source: FDA, PharmForward, Edelweiss Research

8 12 31

413

16 84 101

1314

29 25 80

840

42

323149

2343

0

60

120

180

240

300

0

500

1000

1500

2000

2500

Transdermal Inhalation Opthalmic Injectable Otherspecialty

Topical Oral Liquids Oral solids

(%)

No

. of

AN

DA

ap

pro

vals

2010-2014 2015-2019 % growth in no. of approvals % growth in no. of companies

Pharmaceuticals

Edelweiss Securities Limited

10 Edelweiss Research is also available on www.edelweissresearch.com, Bloomberg - EDEL, Thomson Reuters, and Factset

Players quick to adapt can endure evolving complex landscape

While the overall opportunity looks promising, success has been a mixed bag so far

for Indian players. Meanwhile, sole exclusivities for first-to-file in the US in large

opportunities are giving way to less profitable shared exclusivities, not to mention

heightened aggression by innovators to hold onto their market share once their

products go off patent.

This is indeed a challenge to Indian players, but we believe players that are quick to

adapt will be able to endure through this rapidly evolving generics landscape.

We see that: i) Indian generic companies are present in several Para-IV or limited

competition opportunities in the near- to mid-term that provide revenue visibility in

the US; ii) large players are exploiting M&A and partnership opportunities, targeting

particular therapy areas or manufacturing skill sets—such as SUNP (derma, ophthal)

and LPC (respiratory).

Key respiratory opportunities in 2021–24

Brand Compound Innovator USD

mn

Expected

launch date Known players Comments

Brovana Arformoterol

tartrate Sunovion 500 FY22

Cipla, Teva, Lupin, Glenmark;

Mylan

Glenmark has launched own generic and Lupin has

launched AG. Expect Cipla in Q3FY22

Advair (US)

DPI

Fluticasone +

Salmeterol GSK

110

0 FY23

1 AG, Mylan (launched in

Feb'19), Hikma (relaunced

Apr-21), Cipla (filed), Lannett

(filed)

Lannett TAD 31-Jan-22 but approval unlikely

Lupin failed Pk studies twice

Flovent

(US) Fluticasone GSK 450 FY23

Teva (Armon Air Digihaler-

Feb'20), Cipla, Lupin

Dulera Formoterol +

Mometasone Merck 260 FY23 Lupin (filed), Cipla Lupin likely to be ahead of Cipla

Spiriva Tiotropium Bromide

(Handihaler) Boehringer

168

0 FY23 Lupin FTF, Cipla

Lupin likely to launch in Q2FY23. Cipla could be FY24

or later

Symbicort Budenoside +

Formoterol Astrazeneca

130

0 FY24

Mylan, Teva, Cipla, Prasco

(AG), Lupin (launch post

Spiriva i.e. 2022)

Key patent to expire in 2023, device patent in 2026

Qvar Beclomethasone

dipropionate Teva 200 FY24

Cipla (filed in Aug-20),

Aurobindo Patent expiry in May 2031

Source: Company, Edelweiss Research

Edelweiss Securities Limited

Pharmaceuticals

Edelweiss Research is also available on www.edelweissresearch.com, Bloomberg - EDEL, Thomson Reuters, and Factset 11

Key opportunities in 2021–24

Brand Compound Innovator USD

mn

Launch

date Competition Comments

Kaletra Lopinavir + Ritanovir Abbvie 115 FY22 5 Cipla only one to have approval in pellets

Vascepa Icosapent Ethyl Amarin 750 FY22 3

Dr. Reddy’s launched in end-Q1FY22. Hikma sole

other launcher. Teva and Apotex could be likely

launchers.

Atripla Emtricitabine + Tenofovir + Efavirenz Gilead 500 Q2FY22 6 Auro and Cipla have FA; others yet to get

Fosrenol Lanthanum carbonate Takeda 80 H2FY22 2 Lupin/Natco are the sole players currently

Sutent Sunitinib Pfizer 225 H2FY22 4-6 Sun has final approval; could see 3–4 other players

Remodulin Treprostinil

United

Therepeut

ic

350 FY22 4-5 Sandoz launched in Mar'19; Settlement with all 5

generics; Original market size- USD650mn.

Dexilant Dexlansoprazole Takeda 450 FY22 6

Nasonex mometasone furoate Merck 450 FY22 3 Apotex & Amneal launched. Expect Cipla to supply to

Teva (yet to receive approval).

Asacol HD Mesalamine Allergan 400 3QFY22 2-3 Asacol HD is one of the key product for Cadila, going

off patent in Nov'21

Abraxane Paclitaxel 100mg/vial injection Abraxis/Ce

lgene 800 Sep-22 5

Abraxis dismissed patent infringement complaint

against SPARC in Dec-19; Actavis (Mar-22

settlement), Cipla (27-Sep-22), HBT Labs (Sep-22),

Nuvaring Ethinyl Estradiol Merck 550 FY22-

FY23 4

Amneal (sole generic) and Prasco (AG) launch

Original market size- USD800mn.

Copaxone

40mg Glatiramer Acetate Teva 800

FY22-

FY23 7

Natco & Sandoz launched, Biocon received CRL in

Sep'20

Venofer Iron sucrose Regent 200 FY23 3-4 Reddy's could beat its Indian peers. US generic

players also developing

Revlimid Lenalidomide Celgene 7500 Sep-22

Initially 5,

increasing

every year

Natco, settled for Mar 22 launch. Dr.Reddy's, Cipla

and Alvogen to launch some time after Mar-22. To

sell unlimited quantities from 2026

Viibryd vilazodone Allergan 450 FY23 FA- Alembic (settled, shared FTF), Teva; TA- Accord

(TA); Filers- Cipla, Apotex

Alimta Pemetrexed Eli Lilly 1300 H1FY23 10+

Eagle Pharma (settled for Feb 22 launch; unlimited

qty from Apr -22); May 2022 patent upheld in Dr.

Reddy's case

Amitiza Lubiprostone Mallinckro

dt/ Takeda 450 2HFY23 6

Par - launched AG in Jan-21; Sun (after Jan 23); Dr.

Reddy’s will be 6 years after Nov-16.

Source: Company, Edelweiss Research

Pharmaceuticals

Edelweiss Securities Limited

12 Edelweiss Research is also available on www.edelweissresearch.com, Bloomberg - EDEL, Thomson Reuters, and Factset

Targeted acquisitions made by Indian players

Company Acquisition Access/Therapy Specialty/Complex/Generic

Sun Pharma Ocular Technologies Opthalmology Specialty

Insite vision Opthalmology Specialty

Pharmalucence Injectables Complex

Dusa Dermatology Specialty

Dr. Reddy's Habitrol (Novartis) OTC-Transdermal Complex

Aurobindo 4 brands from TL Pharma Biosimilar Complex

Spectrum Onco injectables Complex

Cipla Avenue Therepeutics IV Tramadol- Pain Complex

Pulmatrix Pulmazole - Respiratory Complex

Lupin Symbiomix Women’s Health Specialty

Celon Respiratory Complex

InspiRX Respiratory Complex

Laboratories Grin Ophthalmology Complex

Cadila Sentynl Pain Specialty

Glenmark Uno Ciclo (Biochimico) Hormonal Contraceptive Complex

Bouwer Bartlett Dermatology Complex

Source: Company, Edelweiss Research

Price erosion reverting to high single digit, but not to CY17 levels

We note management commentaries around increased price erosion, which was not

unexpected considering supply normalisation. On the positive side, ongoing drug

shortages in the US are near all-time highs, and that should keep price erosion within

10% as opposed to deeper cuts seen in 2016–18.

US generics players have also reduced their footprint over last three years—either

US contribution has fallen, or they have transitioned to other dosage forms that are

susceptible to minimal price erosion. US majors are gradually reducing their

footprint through product withdrawals and niche launches, and by moving away

from plain-vanilla products. This underpins the steeper decline in their US growth

than Indian counterparts.

Another factor is the rise in the US FDA’s approval rate since CY15 has directly

impacted prices of generic drugs. On top of it, consolidation in distributors &

pharmacies and formation of buying consortiums amplified the pricing pressure. The

top-3 generic purchasers command 90% share of generic purchases, whereas top 4

generic companies have a 38% USD share and 34% TRx share.

Immune to buyer consolidation threat: Wholesaler consolidation, which impacted

margins in 2017–18, has been largely digested with new emerging channels such as

Amazon yet to show any impact.

Big pharma pulling out: US continues to remain a key market for global generic players.

Indian pharma firms benefitted from portfolio rationalisation by key global generic

players; their market share thus shot up from ~38% in mid-2018 to ~45% by mid-2019.

Many global MNC players, owing to persistent pricing pressure in the US,

restructured their portfolios and exited many molecules with low profitability.

Mylan and Teva accounted for 75% of those withdrawals. To date, Mylan has

rationalised 350 SKUs. Recently, Viatris (Mylan + Upjohn) laid out plans to close,

downsize or divest up to 15 facilities – including the Morgantown plant, which

produces oral solids – as part of a restructuring exercise announced in 2019.

Global companies such as Teva, Hikma have

indicated that price erosion is along

expected lines and as seen during pre-covid

days, i.e. around mid-to-high single digits;

do not expect it to revert to double-digits

Edelweiss Securities Limited

Pharmaceuticals

Edelweiss Research is also available on www.edelweissresearch.com, Bloomberg - EDEL, Thomson Reuters, and Factset 13

US major generics performance

Source: Company, Edelweiss Research

NA: North America

…has resulted in aggravating drug shortages: While new drug shortages, i.e. new

cases added every year do not indicate there is a problem, we note the number of

ongoing shortages is higher. This indicates that previous years’ shortages are yet to

be addressed and would thus throw up opportunities.

The US FDA mentioned, for the first time, in 2019 that pricing dynamics in the

generic market lead to shortages and that this mechanism needs to be addressed.

The watchdog even recommended suppliers with consistent quality record should

get longer-term contracts at “fair value” from customers.

Covid-19 related disruptions further aggravated the shortages. But, with easing of

the situation, price erosion has reverted to mid-high single digit and is likely to

remain at those levels.

US generic pricing, which eased to mid-single digit, has reverted to high single-digit erosion

Source: IQVIA, Edelweiss Research

-16%

-12%

-8%

-4%

0%

4%

0

8

16

24

32

40

Teva Mylan SandozU

S/N

A a

s %

of

reve

nu

e

CY17-20 US/NA CAGR CY17-20 overall CAGR

US/NA - % of revenue (LHS)

0

25

50

75

100

125

-15

-7

1

9

17

25

Oct

-14

Feb

-15

Jun

-15

Oct

-15

Feb

-16

Jun

-16

Oct

-16

Feb

-17

Jun

-17

Oct

-17

Feb

-18

Jun

-18

Oct

-18

Feb

-19

Jun

-19

Oct

-19

Feb

-20

Jun

-20

Oct

-20

Feb

-21

Jun

-21

Gen

eric

Yo

Y p

rici

ng

chan

ge

Generic pricing FDA approvals

CAH expectes inflation to decelerate

FDA approvals ramp considerably

ABC states generic inflation has slowed significantly

MCK reduced FY17 inflation outlook to a range that includes zero

ClarusONE sourcingagreement announced

Endo: Consortiumpressure reason

for pricing pressure

Teva finalisesClarusONE contract

FDA approvals ramp further

Teva, Sandoz, Mylan announce portfolio

rationlisation

Generic Injectables help to offset

persistent deflation in generic Oral Solids

Erosion easing on demand shortages

Erosion to settle around high single digit

Pharmaceuticals

Edelweiss Securities Limited

14 Edelweiss Research is also available on www.edelweissresearch.com, Bloomberg - EDEL, Thomson Reuters, and Factset

Number of ongoing drug shortages at all-time highs

Source: FDA, Edelweiss Research *as on 31 Aug 21

Approval trend picked up in later part of 2020

Source: FDA, Edelweiss Research

US FDA inspection cycle on a temporary hold

CY20 saw the lowest number of inspections in the wake of the covid-19-related

lockdowns. And the second covid wave in India is likely to push further the timelines

for physical inspection.

Recently, the US FDA issued guidelines detailing how it will conduct ‘voluntary

remote interactive evaluations’ (meaning: desktop audit) at pharma plants until the

time the covid-19 emergency declared by HHS stays in place. We believe the

guidelines intend to ease the FDA’s inspection backlog once the physical inspection

resumes while at the same time ensuring that compliant facilities are still able to

churn out new approvals. This puts the US FDA inspection cycle on a pause.

Inspection intensity to pick up from end-FY22…

We do not believe that existing warning letters/import alerts will be lifted after

remote evaluation as this may require a physical inspection. Hence, several Indian

plants that are due for inspections/re-inspections, including Torrent’s Dahej and

Indrad facilities, Lupin’s Goa, Mandideep and Pithampur plants, Cadila’s Moraiya,

Sun’s Halol, and Cipla’s Goa and Aurobindo’s Unit-7, among other plants may take

further time to clear. Once the covid cases ease and inspections outside the US

resume, we expect the intensity to pick up.

0

25

50

75

100

125

2013 2014 2015 2016 2017 2018 2019 2020 Aug-21N

os.

No. of ongoing drug shortages

130 167 201304 290 336 293

291

413429

539 520500

461

0

9

18

27

36

45

0

180

360

540

720

900

2014 2015 2016 2017 2018 2019 2020

(%)

No

s.

Indian cos. Others Share of India cos. (%)

Edelweiss Securities Limited

Pharmaceuticals

Edelweiss Research is also available on www.edelweissresearch.com, Bloomberg - EDEL, Thomson Reuters, and Factset 15

…but not a cause for concern – it’s a zero-sum game for the sector

The US FDA’s Centre for Drug Evaluation and Research (CDER) oversees prescription

and OTC drugs, including biological therapeutics and generic drugs. It is the body

also responsible for monitoring compliance and carrying out inspection at drug

manufacturing plants.

As Exhibit 13 shows, 2015–19 marked a ramp-up in FDA inspections in India. This

was a direct outcome of: i) capacity expansion during this period for the US markets

with companies such as Ajanta, Alembic, Cadila and Strides building new plants; ii)

GDUFA-2 regime saw more regular inspections with every plant getting inspected at

least once in two years and some inspected virtually almost every year; and iii)

India’s contribution to US generics (by volume) increased from ~33% to ~45%.

Rise in US FDA inspections in India: In line with contribution to US

2013 2014 2015 2016 2017 2018 2019 2020

India 114 102 206 176 152 203 230 76

China 86 96 133 165 126 119 117 2

Others 1532 1641 1547 1558 1389 1261 1152 279

Total 1732 1839 1886 1899 1667 1583 1499 357

India inspections (%) 7% 6% 11% 9% 9% 13% 15% 21%

Source: FDA, Edelweiss Research

Exhbit 14 shows Indian companies are gradually learning to meet the FDA’s

requirements. While we acknowledge that rising inspections have led to higher

number of Form 483s, the proportion of OAIs has actually gone down over the last

six years. That said, with the FDA tightening regulatory norms, the bar for the

industry has gone further up, but the Indian pharma industry is in pole position to

pass muster vis-à-vis peers.

Proportion of OAIs to Indian players down in last six years

Source: FDA

We also flag that while a Form 483/Warning Letter poses earnings risk for the

company in question, it can turn out to be earnings neutral—or in some cases even

earnings-accretive for the industry. In the past Cadila’s and Sun’s warning letters led

to larger-than-expected windfalls for Torrent and Alembic in gAbilify. Similarly, Ipca’s

import alert generated substantial sales for Cadila in HCQs and Sandoz’s issues at a

partner’s fill-finish plant helped Natco gain a lead in gCopaxone 40mg/ml.

0

5

10

15

20

25

30

0

50

100

150

200

250

2013 2014 2015 2016 2017 2018 2019 2020

OAI VAI NAI % of OAI (RHS)

Pharmaceuticals

Edelweiss Securities Limited

16 Edelweiss Research is also available on www.edelweissresearch.com, Bloomberg - EDEL, Thomson Reuters, and Factset

FDA’s remote 'evaluations': Sets out physical inspection timelines?

The US FDA has issued guidelines describing how it will conduct ‘voluntary remote

interactive evaluations’ (meaning: desktop audit) at pharma plants until the time the

covid-19 emergency declared by Health and Human Services (HHS) stays in place.

Policy applicability

The scope of this policy is fairly wide as it covers CGMP as well as follow-ups (post

483/WL) inspections. Remote evaluation will take place only when the FDA believes

it would help in assessing all risks related to the application (i.e. it can help in making

a final decision).

Pre-Approval or Pre-License Inspections: Only if there is no data integrity or any

other issue that requires a physical inspection.

Post-Approval Inspections: Only if the facility has an ‘acceptable inspection

history’ with no data integrity or any other issue that requires a physical

inspection.

Surveillance Inspections: To be determined based on established criteria for

normal CGMP inspections.

Follow-up Inspections: Completely facility dependant and will take into

considerations like data integrity and inspection history.

Bioresearch Monitoring Inspections: No data integrity; evaluation only if data can

be made available by company/plant that aids decision-making.

Key points to note

The FDA has categorically stated that remote interactive evaluations do not

replace inspections.

The FDA will not accept requests from companies to conduce remote

evaluations, but will determine itself the facilities that can be evaluated.

Companies/plants that qualify have to give their approval to the FDA to allow

them to conduct virtual evaluation.

The FDA will ask for records and documents prior to the remote evaluation.

The FDA will issue a list of observations, but will not issue a Form 483.

Observations must be responded to within 15 days.

Edelweiss Securities Limited

Pharmaceuticals

Edelweiss Research is also available on www.edelweissresearch.com, Bloomberg - EDEL, Thomson Reuters, and Factset 17

Biosimilars: No white knight

A crowded plain-vanilla generics market, uncertainty around complex generics and lack of M&A opportunities have led to global generic companies investing in biosimilars as the next growth engine. Strategically, biosimilars make the cut: high entry barriers, USD200bn market, limited competition and stickier revenue stream. However, faster-than-expected price erosion and lower-than-expected biosimilar penetration, especially in the US, have soured its commercial potential.

Current US regulations too do not favour interchangeability, and this has put generic players at a disadvantage to big pharma, which have a big salesforce, better traction with specialist doctors and larger portfolios of branded drugs that incentivise wholesalers.

The long-term opportunity in biosimilars notwithstanding, challenges at hand such as price erosion and the need to gain market share are real. Among Indian players, BIocon is head and shoulders above others. Aurobindo, Lupin and Dr. Reddy’s follow.

Market size and scale remain healthy

Eight out of world’s top-10 selling molecules are biologics and in the US ~45% of the

manufacturer net revenues (after discounts and rebates) are biologics, as per IQVIA.

Spending on biologics is increasing faster than small molecules—despite

competition from biosimilars, spending on biologics is expanding at a CAGR of 14%

versus. 2% for small molecules. Exhibit 15 shows that, barring trastuzumab, all other

molecules have shown healthy growth in recent quarters despite the covid impact.

US biologics/biosimilars growth

Brand Molecule Market size

pre-genericisation (USD mn) YoY growth

Q4FY20 Q1FY21 Q2FY21 Q3FY21 Q4FY21 Q1FY22

Neulasta pegfilgrastim 4100 8% 4% -2% 9% 8% 10%

Remicade infliximab 4800 4% -1% 3% 6% 7% 13%

Herceptin trastuzumab 1900 -18% -25% -27% -32% -29% -25%

Avastin bevacizumab 3000 13% 11% 15% 25% 20% 24%

Rituxan rituximab 4500 4% -10% 1% 9% 6% 28%

Neupogen filgrastim 3500 4% -10% -3% -2% -9% 9%

Procrit epoetin alfa 1500 17% 2% 2% 2% -7% 2%

Lantus insulin glargine 2500 6% -2% -6% -7% -11% -4%

Source: Edelweiss Research

Limited uptick seen so far

Among the biosimilars launched in the US, Neupogen has the highest penetration at

~73% almost five years after its first launch, followed by Avastin at ~67%.

Pharmaceuticals

Edelweiss Securities Limited

18 Edelweiss Research is also available on www.edelweissresearch.com, Bloomberg - EDEL, Thomson Reuters, and Factset

US biosimilar penetration

Biologic Biosimilar #yrs biosimilar # biosimilar players

Neulasta 65% 35% 3 4

Remicade 72% 29% 5 3

Herceptin 45% 55% 3 5

Avastin 33% 67% 2 2

Rituxan 39% 61% 4 3

Neupogen 27% 73% 5 2

Procrit 54% 46% 3 2

Lantus 70% 30% 5 2

Source: Edelweiss Research

Varying biosimilar penetration for different biologics can be explained by:

Large pharma companies, often with existing innovative biologics portfolios,

have dominated the marketing of biosimilars to date. In biosimilars where

Amgen and Pfizer are present, they hold industry-leading market share.

Amgen, Pfizer rule the roost

# biosimilar players Biologic share Amgen Pfizer Other biosimilars

Neulasta 4 65% 65% 2% 33%

Herceptin 5 45% 30% 9% 17%

Avastin 2 33% 47% 20% n/a

Rituxan 3 39% n/a 34% 27%

Source: Edelweiss Research

Follow-on biologics have led to smaller biosimilar accessible markets. New

generation of medicines introduced and marketed by innovators has put volume

pressure on incumbent treatment, e.g. Neulasta (pegfilgrastim) followed

Neupogen (filgrastim); Perjeta (pertuzumab) and Kadcyla (Trastuzumab

emtansine) followed Herceptin (trastuzumab). As a result of lower promotions

and fewer doctor visits for older generation of medicines, prescriptions and

usage of these molecules came down.

As Exhibits 27 and 28 show, filgrastim and trastuzumab have the highest volume

pressure among biosimilars. The charts below show pegfilgrastim has

continuously taken share from filgrastim—while this has benefitted players such

as Biocon that have pegfilgrastim biosimilars, in trastuzumab’s case, the outcome

has been different wherein Biocon volumes are struggling due to follow-on

biologics.

Edelweiss Securities Limited

Pharmaceuticals

Edelweiss Research is also available on www.edelweissresearch.com, Bloomberg - EDEL, Thomson Reuters, and Factset 19

Pegfilgrastim gaining at the expense of filgrastim

Source: Edelweiss Research, Symphony

Trastuzumab losing share to follow-on biologics

Source: Edelweiss Research, Symphony

Biosimilar penetration is influenced by patient access, which is in turn influenced

by incentives given to stakeholders such as insurance companies and pharmacy

benefit managers (PBMs). In the US, PBMs are the key decision makers in the

negotiation process to include/exclude or give preferred access to biosimilars or

biologics depending on the financial incentives provided by the manufacturers.

A case in point is Lantus (insulin glargine) and Humalog (insulin lispro) wherein

within first 18 months of biosimilar launches, biosimilar penetration was 23% for

glargine and only 10% for lispro. Interestingly, in the federal programs like

Medicare and Medicaid, both achieved 65–70% penetration but in Medicare Part

D (pharmacy), lispro penetration was <10%. Also launch of an Authorised Generic

in lispro prevented biosimilar uptake as it became attractive to some plans,

wherein patient price sensitivity was an issue.

Price erosion sharper than expected

The US Centre for Medicare and Medicaid Services’ (CMS) average sales prices (ASP)

for Medicare Part B drugs are a better indicator of actual prices as they indicate the

price point at which manufacturers are willing to supply. Medicare Part B is part of

US national health insurance programme that covers outpatient care and preventive

services, among others. Some of the key takeaways are:

QoQ price decline in biosimilars has steepened in a few molecules. In fact, it’s

not just biosimilar,s but also innovator biologics that have been aggressive with

pricing.

Neulasta and biosimilars: Innovator Amgen’s prices have declined 12% QoQ

(following a 9% QoQ decline last quarter) and 40% YoY; this is the second-highest

decline since biosimilars entered this molecule. This also widens the discount

(7.5%) of Neulasta to other biosimilars. Coherus’s prices have been flat; Biocon

has seen a 5% QoQ decline and Sandoz ~2%.

Herceptin and biosimilars: The pace of price decline intensified for the ‘more

expensive’ biosimilars. Biocon’s Ogivri price increased 5% QoQ. However, prices

of other biosimilars such as Teva’s and Merck’s, which were among the more

expensive biosimilars, dipped 19% QoQ and 10% QoQ, respectively, thereby

narrowing the gap to other biosimilars. Amgen is now the cheapest biosimilar as

it saw a sharp 10% QoQ cut.

0%

20%

40%

60%

80%

100%

Feb

-06

Feb

-07

Feb

-08

Feb

-09

Feb

-10

Feb

-11

Feb

-12

Feb

-13

Feb

-14

Feb

-15

Feb

-16

Feb

-17

Feb

-18

Feb

-19

Feb

-20

Feb

-21

Pegfilgrastim Filgrastim

0%

20%

40%

60%

80%

100%

Jun

-12

Jun

-13

Jun

-14

Jun

-15

Jun

-16

Jun

-17

Jun

-18

Jun

-19

Jun

-20

Jun

-21

Herceptin Herceptin biosims Kadcyla Enhertu Perjeta

Pharmaceuticals

Edelweiss Securities Limited

20 Edelweiss Research is also available on www.edelweissresearch.com, Bloomberg - EDEL, Thomson Reuters, and Factset

Other molecules: Remicade and biosimilars saw lower QoQ declines than

previous quarters while Avastin saw a similar decline. Biocon is expected to get

approval/launch bAvastin after plant inspection.

As we have been flagging in our previous reports, intensifying competition has led

to continual price declines in biosimilars. In several cases, prices have been declining

4–6% QoQ even though no new players have entered. Amgen, in particular, has been

aggressive on pricing; this quarter, it effected steepest price declines in all the

molecules it has a presence in, thereby making it the lowest cost supplier.

In our recent analysis of US and EU pharma companies,, we note players such as

Amgen have seen revenue declining in bHerceptin despite higher market share while

Coherus is expecting its bNeulasta revenue to go down YoY in CY21 despite steady-

to-increasing market share. Also note that bHerceptin Rx have been declining at

~30% YoY over the last few months—while part of it can be explained by covid-

related slowdowns, the molecule class has been facing double-digit volume pressure

even prior to covid.

Average selling price (ASP) in Medicare Part B in USD

ASP Medicare Part B reimbursement

Sep-18 Dec-18 Mar-19 Jun-19 Sep-19 Dec-19 Mar-20 Jun-20 Sep-20 Dec-20 Mar-21 Jun-21 Sep-21 Dec-21

Neulasta (pegfilgrastim) reimbursement price for 0.5mg

Amgen (innovator) 393 391 390 388 377 369 355 332 317 298 257 234 206 185

Biocon 369 358 350 333 327 312 308 294 269 248 237 222 211

Coherus 358 359 347 337 322 302 287 268 251 252 222

Sandoz 317 306 298 277 271 245

Pfizer 337 314 285

Herceptin (trastuzumab) reimbursement price for 10mg

Roche (innovator) 104 104 107 107 107 107 106 104 102 100 98 94 91 90

Roche - Hylecta (innovator) 80 82 79 78 77 75 75 72 72 72

Amgen 91 91 82 81 79 72 66 59 53

Biocon 91 91 93 76 73 61 63 60

Pfizer 83 83 83 74 68 65 60

Teva 96 92 86 82 67 57

Merck 91 92 88 80 72 67

Remicade (infliximab) reimbursement price for 10mg

Remicade 84 79 77 72 65 63 57 56 51 48 45 42 41 40

Pfizer (Inflectra) 65 61 57 54 51 49 48 48 47 44 43 41 40 41

Merck (Renflexis) 69 64 62 59 55 53 52 50 49 45 42 41 40 39

Amgen (Avsola) 52 52 50 49 47

Avastin (bevacizumab) reimbursement price for 10mg

Roche (Avastin) 81 81 81 81 81 80 78 76 75 73 71 70

Amgen (Mvasi) 70 70 63 62 61 57 53 49 45

Pfizer (Zirabev) 63 63 62 59 57 55 52

Source: CMS, Edelweiss Research

Edelweiss Securities Limited

Pharmaceuticals

Edelweiss Research is also available on www.edelweissresearch.com, Bloomberg - EDEL, Thomson Reuters, and Factset 21

Price erosion (QoQ) in Medicare Part B

ASP Medicare Part B reimbursement ASP Medicare Part B reimbursement (QoQ price decline)

Sep-18 Dec-18 Mar-19 Jun-19 Sep-19 Dec-19 Mar-20 Jun-20 Sep-20 Dec-20 Mar-21 Jun-21 Sep-21 Dec-21

Neulasta (pegfilgrastim)

Amgen (innovator) 5% -1% 0% -1% -3% -2% -4% -6% -4% -6% -14% -9% -12% -10%

Biocon n/a n/a -3% -2% -5% -2% -5% -1% -4% -9% -8% -5% -6% -5%

Coherus n/a n/a n/a n/a 0% -3% -3% -4% -6% -5% -7% -6% 0% -12%

Sandoz n/a n/a n/a n/a n/a n/a n/a n/a n/a -4% -2% -7% -2% -9%

Pfizer

Herceptin (trastuzumab)

Roche (innovator) 3% 0% 3% 0% 0% 0% -1% -2% -2% -3% -2% -4% -3% -1%

Roche - Hylecta (innovator) n/a n/a n/a n/a n/a 2% -3% -2% -1% -3% -1% -3% 0% -1%

Amgen n/a n/a n/a n/a n/a n/a 0% -10% -1% -3% -8% -9% -10% -10%

Biocon n/a n/a n/a n/a n/a n/a n/a 0% 3% -18% -4% -17% 5% -6%

Pfizer n/a n/a n/a n/a n/a n/a n/a n/a 0% 0% -11% -8% -5% -7%

Teva n/a n/a n/a n/a n/a n/a n/a n/a n/a -5% -6% -5% -19% -14%

Merck n/a n/a n/a n/a n/a n/a n/a n/a n/a 1% -4% -9% -10% -8%

Remicade (infliximab)

Remicade 1% -6% -3% -6% -10% -2% -10% -3% -8% -7% -6% -7% -2% -4%

Pfizer (Inflectra) -7% -6% -7% -5% -6% -4% -3% 0% -1% -7% -2% -6% -1% 3%

Merck (Renflexis) -2% -7% -4% -4% -8% -2% -3% -4% -2% -8% -6% -3% -3% -2%

Amgen (Avsola) n/a n/a n/a n/a n/a 0% -3% -2% -4%

Avastin (bevacizumab)

Roche (Avastin) n/a n/a n/a 0% 0% 0% -1% -1% -1% -3% -2% -4% -3% 0%

Amgen (Mvasi) n/a n/a n/a n/a n/a n/a 0% -10% 0% -2% -7% -7% -8% -9%

Pfizer (Zirabev) n/a n/a n/a n/a n/a n/a n/a n/a 0% -1% -4% -4% -4% -5%

Source: CMS, Edelweiss Research

Partnership needed for success?

While it is well known that large pharma companies (including US generics) are

developing biosimilars, they have collaborated with several relatively small players

such as Merck with Samsung, Teva with Celltrion and Amgen with Allergan. The

complexity and costs involved in marketing biosimilars, especially under the current

regulatory regime that doesn’t yet provide a pathway for interchangeability, is likely

to filter out smaller players in the marketing process. We expect innovators with a

biosimilar portfolio to continue developing and marketing their own products while

other players with smaller balance sheets could continue partnering to de-risk

potential failures.

Pharmaceuticals

Edelweiss Securities Limited

22 Edelweiss Research is also available on www.edelweissresearch.com, Bloomberg - EDEL, Thomson Reuters, and Factset

Domestic – Too early to panic

Growth in the ~USD20bn domestic market had slowed to sub-10% (prior to covid) from 13.5% in 2015 and further bore the brunt of covid-19-led disruptions. A large part of domestic growth is pricing-led and an uptick in volume growth is still not visible.

Even before the lockdown was imposed, IPM volumes flagged, and we believe this issue may persist for a few more quarters before branded volume growth reverts to 2–4%. Disease profile in India, fewer

incentives for JanAushadi and enforcement of margin capping on trade generics should see a beginning of volume revival in brands.

While the covid-influenced drugs led to supernormal growth in Apr-21 and May-21, growth settled around 14% in June and July. Covid-influenced drugs are still playing a role, but recovery in therapies such as pain management and neuro shows other parts of IPM are also recovering. We expect price growth to remain steady and launches to help offset volume erosion. IPM would thus grow 10–11% for the next few years. However, NLEM expansion poses risk to the industry.

Volume revival critical in post-covid scenario

Volume growth had been tepid for several quarters even before covid-19. Industry

growth led by volumes is more sustainable in our view; hence, revival of volume

growth is critical.

The supernormal growth of 52% and 48% in Apr-21 and May-21, respectively, was largely

led by covid drugs as well as covid-influenced drugs such as insulins, anti-coagulants and

corticosteroids. Jun-21 and Jul-21 settled at ~14%, and August saw 18% growth.

Acute therapies drove the growth and chronic was subdued, growing in mid-single

digit. The analysis by AIOCD AWACS shows that IPM volume growth without covid-

influenced drugs stood at -0.7% in Jul-21.

IPM volume performance without covid drugs yet to recover

Contribution MAT July'21 Month July'21

Value GR (%) Unit GR (%) Value GR (%) Unit GR (%)

IPM 100% 12.8 4.2 13.7 4.9

With covid influence 37% 26.3 10.6 27.1 10.6

Without covid influence 63% 6.2 -0.7 7.1 -0.7

Source: AIOCD

Volumes were impacted even before covid

A deep-dive into IPM’s main growth drivers shows that: i) volume growth slowed by

~300bps largely due to penetration of unbranded generics and government push via

Jan Aushadhi; ii) pricing, while impacted by NPPA’s regulatory actions, has now

reverted to its 5% growth level; ii) new introductions (NI) slowed as approvals for

irrational combinations and new product innovations declined, impacting IPM

growth by ~200bps. While the risk of deceleration in pricing-led domestic growth

poses a challenge, we expect pricing growth to remain steady in the near term. The

volumes are expected to revert back to 2-4% as field force activity opens up and

patients take their elective surgeries.

Edelweiss Securities Limited

Pharmaceuticals

Edelweiss Research is also available on www.edelweissresearch.com, Bloomberg - EDEL, Thomson Reuters, and Factset 23

Volume and NI growth impacted even before lockdown

Source: AIOCD

Deciphering domestic growth in the aftermath of covid

Chronic therapies steady; acute can surprise positively

The overall IPM volumes further bore the brunt of covid-19-induced lockdown,

which led to restricted field force activity and postponement of elective surgeries.

This in turn dragged acute therapy growth, while chronic therapies continued to

perform well.

Growth of chronic therapies has been steady over the last four years, and we expect

it to continue to do well given rising incidence of chronic cases, molecules going off

patents, innovations and MNC introductions. On the other hand, the growth has

been lumpy in case of acute therapies and may surprise positively once the covid

situation eases.

Therapies such as anti-infective, gastro, vitamin and respiratory had significant

contribution from covid-influenced drugs, which led to strong double-digit growth

in revenues during the second covid wave. While covid influenced drugs continue to

aid volume growth, growth in therapies such as pain, neuro and ophthal show that

other parts of the IPM are seeing signs of revival.

Performance of top 10 therapies

MAT July'21 Month July'21

Value growth

(%)

Unit growth

(%)

Value growth

(%)

Unit growth

(%)

Covid

ratio

Anti-infective 21.3 0.7 30.2 16.8 73%

Cardiac 13.5 2.9 4.1 -4.3 23%

Gastro 17.9 11.7 19.6 9.8 64%

Anti-diabetic 6.8 1.9 3.3 -3.1 18%

Vitamin 21.5 13.9 10.5 -6.3 48%

Respiratory 3.2 -7.3 22.8 9.7 70%

Pain 11.9 8.4 24.1 16.9 32%

Derma 10.7 1.1 9.7 -5.6 3%

Neuro/CNS 7.8 1.8 8.2 0.0 3%

Gynaecological 10.8 5.3 15.4 6.5 13%

Source: AIOCD

MAT- Moving Annual Turnover

5.7 5.4 4.22.7 2.3 1.6

-5.4

2.3 4.1

2.1

-0.7

3.5 5.3

4.8

5.45.0

3.5

3.3

3.42.7

2.6

FY15 FY16 FY17 FY18 FY19 FY20 FY21

Volume GR Price GR New Introduction GR

13.414.5

9.8

5.3

9.1 9.7

2.1

Pharmaceuticals

Edelweiss Securities Limited

24 Edelweiss Research is also available on www.edelweissresearch.com, Bloomberg - EDEL, Thomson Reuters, and Factset

Cardiovascular has been clocking an 11% CAGR over the past five years with 11.2%

growth as of MAT March 2021 and steady volume growth of about 5%. Major players

include Sun, Torrent, Lupin, USV and Glenmark. The anti-diabetic therapy accounts for

~10% of the IPM, or ~INR149bn. The therapy logged a ~17% CAGR over FY13–18 with

growth slowing to ~12%. This further came off to 6% in FY21, but is likely to pick up with

rising incidence of chronic cases. Major players include Abbott, Lupin, Sun and Sanofi.

Cardiac growth steady at ~11% over the years

Source: AIOCD

Anti-diabetic growth down from 11% to 6% in FY21

Source: AIOCD

Anti-infective is IPM’s largest therapy area, accounting for ~13% of the IPM. It is a seasonal

therapy that used to grow at 10–12%, but has moderated in recent times, and has settled

at mid to high single digit. Volume hit was worst seen in this therapy in the wake of low

incidence of anti-infective cases as people stayed indoors for most part of FY21.

Pain/analgesics account for ~6% of the IPM and has been clocking ~8% CAGR over

the past five years, with growth slowing to -2.7% as of MAT March 2021.

Vitamin/Mineral/Nutrients is a fast growing therapy, which could expand into a

tremendous opportunity with increasing diagnosis of vitamin deficiencies and an

overall focus on consumer health. The therapy accounts for ~9% of the IPM and has

been clocking a CAGR of ~8.5% over the past five years.

Worst volume hit seen in acute therapies; growth likely to recover as covid-19 situation eases

Source: AIOCD

-5

-1

3

7

11

15

FY18 FY19 FY20 FY21

CARDIAC

Volume GR Price GR NI GR Total GR

-5

-1

3

7

11

15

FY18 FY19 FY20 FY21

ANTI-DIABETIC

Volume GR Price GR NI GR Total GR

-18

-13

-8

-3

2

7

12

FY18 FY19 FY20 FY21 FY18 FY19 FY20 FY21 FY18 FY19 FY20 FY21

Anti-infective (13% of IPM) Respiratory (7% of IPM) Pain (6% of IPM)

Volume GR Price GR NI GR

Edelweiss Securities Limited

Pharmaceuticals

Edelweiss Research is also available on www.edelweissresearch.com, Bloomberg - EDEL, Thomson Reuters, and Factset 25

Growth drivers by company

Total GR (%) Volume GR (%) Price GR (%) NI GR (%)

Corporate Sales

(INR, bn)

Acute

(%)

% under

NLEM Mar-19 Mar-20 Mar-21 Mar-19 Mar-20 Mar-21 Mar-19 Mar-20 Mar-21 Mar-19 Mar-20 Mar-21

IPM 1,445 9.1 9.7 2.1 2.3 1.6 -5.4 3.5 5.3 4.8 3.4 2.7 2.6

Sun 117 39% 14% 4.3 9.2 2.7 -0.3 0.7 -4.4 2.3 6.4 5.7 2.3 2.1 1.4

Cipla 68 42% 25% 9.1 7.9 7.5 1.6 -0.1 -2.8 4.6 5.2 5.6 2.9 2.8 4.7

Mankind 61 52% 12% 7.5 14.4 2.9 3.1 5.8 -5.1 2.5 6.5 4.4 1.9 2.1 3.6

Cadila 60 54% 25% 8.8 12.7 3.7 2.9 5.6 -6.1 2.5 5.2 5.0 3.4 1.9 4.8

Lupin 55 25% 17% 14.4 12.3 1.9 4.4 1.9 -5.7 5.4 6.3 5.6 4.6 4.1 2.0

Alkem 50 58% 26% 10.8 11.9 1.5 3.4 3.6 -4.6 4.8 5.8 4.0 2.6 2.5 2.1

Torrent 44 24% 10% 10.6 12.0 4.1 0.4 2.1 -5.1 5.9 8.2 6.8 4.3 1.7 2.4

Dr. Reddy's 43 54% 18% 6.1 10.5 0.1 -0.6 0.5 -8.3 3.8 7.0 5.6 2.9 3.0 2.8

Glenmark 32 42% 12% 12.6 11.1 15.2 1.9 -0.4 -6.1 4.9 6.0 5.2 5.8 5.5 16.1

Ipca 21 65% 22% 22.5 10.0 11.1 14.0 2.7 4.6 6.4 5.2 5.0 2.1 2.1 1.5

Abbott 90 38% 21% 10.4 9.2 3.9 2.3 -2.0 -3.1 4.9 7.2 6.0 3.2 4.0 1.0

GSK 41 70% 26% 5.9 9.6 -5.7 -1.2 1.9 -12.7 4.4 6.2 6.7 2.7 1.5 0.3

Pfizer 33 57% 14% 6.6 10.8 4.9 3.2 3.8 -1.5 2.7 5.7 5.1 0.7 1.3 1.3

Sanofi India 32 43% 21% 10.4 7.8 2.6 4.9 -0.5 -5.1 3.0 5.7 6.5 2.5 2.6 1.2

Source: AIOCD

Pharmaceuticals

Edelweiss Securities Limited

26 Edelweiss Research is also available on www.edelweissresearch.com, Bloomberg - EDEL, Thomson Reuters, and Factset

Ajanta, Ipca and Alkem show recovery in non-covid portfolio

Contribution MAT July'21 Month July'21

Value GR (%) Unit GR (%) Value GR (%) Unit GR (%)

Sun Pharma Total 100% 10.5 1.1 17.1 3.8

Covid 25% 23.3 8.7 43.2 26.7

Non-covid 75% 6.8 -0.9 9.9 -1.8

Cipla Total 100% 19.4 -1.3 5.7 1.3

Covid 53% 33.9 -1.7 15.6 8.3

Non-covid 47% 6.3 -0.6 -3.0 -9.6

Zydus Total 100% 13.0 0.0 8.8 -6.7

Covid 39% 34.1 0.4 24.6 -7.6

Non-covid 61% 2.9 -0.6 0.8 -5.2

Lupin Total 100% 11.8 1 14.2 6.1

Covid 35% 20.8 4 32.8 29.6

Non-covid 65% 7.4 -0.2 5.9 -1.6

Alkem Total 100% 15.8 7.4 18.3 11.1

Covid 66% 18.9 9.1 20 13.6

Non-covid 34% 10.4 3.4 15 4.9

Torrent Total 100% 11.1 2 16.6 3.3

Covid 21% 23.1 13.7 36.3 22.4

Non-covid 79% 8.3 -1 12.1 -1.6

Dr. Reddy's Total 100% 12.7 3.1 19.6 5.7

Covid 33% 20.6 5.1 36.4 15

Non-covid 67% 9.3 1.9 12.8 0.8

Glenmark Total 100% 33.9 0.6 -14.4 -13.4

Covid 43% 122.3 11.2 -14.5 5

Non-covid 57% 2.8 -4.3 -14.3 -20.4

Ipca Total 100% 20 10.3 25.4 16.4

Covid 24% 26.9 9.8 47.8 25.2

Non-covid 76% 18 10.7 19.8 10.1

Ajanta Total 100% 19.7 4.9 23 14

Covid 22% 25.7 8.5 27.8 16.3

Non-covid 78% 18.1 4.2 21.7 13.5

Source: AIOCD

Trade generics to complement branded drugs

As we argue in this report, a large part of domestic growth is pricing-led and an

uptick in volume growth is still not visible. Even before the first lockdown last year,

IPM volumes flagged. Growing awareness about cheaper alternatives to branded

and an increasing number of channels providing access to them has started eating

into volume growth of branded generics in the IPM.

Moreover, trade generics portfolio performed well during covid when lockdown

restricted the field force activity. A large part of country still remains untapped

wherein these channel drugs help. Hence, trade generics are here to stay and likely

to co-exist with branded drugs.

That said, we do not think the generics impact would be substantial as: i) Incentives

dry down unless there is any PE backing to disrupt the market. ii) Branded drugs are

Edelweiss Securities Limited

Pharmaceuticals

Edelweiss Research is also available on www.edelweissresearch.com, Bloomberg - EDEL, Thomson Reuters, and Factset 27

preferred in metro and Tier 1/2 cities because of their perception of higher quality. iii)

Potential margin capping on trade generics to bring down viability of this business. No

major incentives for chemists to push. iv) Digital channels of marketing with on-ground

field force enable companies to reach far more physicians in tier2/3 cities as well. Thus,

a hybrid model could help in tapping the underpenetrated market.

The largest impact has been from the government push towards Jan Aushadhi stores,

counting 5,800+ so far. The scheme itself is expected to top revenue of INR4bn in FY20

and could potentially disrupt 1.35% of the total IPM. State government schemes such

as those in Rajasthan and Tamil Nadu, as well as hyperlocal chains like Generico are

playing their part in improving access to trade generics.

Jan Aushadhi impacts roughly 1.3% of IPM sales

Source: BPPI, Edelweiss Research

NLEM expansion seems more benign than expected

According to media articles, the Indian government has brought 39 molecules under

the NLEM. The government also deleted ~16 drugs, some of which have been

discontinued.

Our view: First impressions seem benign and large part of industry unscathed;

GSK/Sanofi/Natco could be hit

Note that this is the list of essential medicine that the Ministry of Health has

prepared and which will be forwarded to NPPA (National Pharmaceutical Pricing

Authority) that works under the Ministry of Chemicals. Once the NPPA decides, only

then will the drugs from this list be added to the price control list. Also, there is no

compulsion that all drugs will be added to DPCO.

As seen in the table below, molecules that have the highest sales that could

potentially come under DPCO are itraconazole (INR9.2bn), insulin glargine

(INR7.5bn), cefuroxime (INR7.4bn), amikacin (INR5.3bn) and teneligliptin (INR4.3bn)

among others. GSK (brands: Ceftum, T-Bact), Sanofi (Lantus) and Natco (Lenalid,

Fulvenat, Dabgat) are the ones most vulnerable to price cuts if the drugs get included

in DPCO. To reiterate, we are yet to get our hands on the government document that

will list SKUs, which in turn will determine the resultant impact.

Another factor to consider is that some combinations already needed pricing

permission from the government prior to launch, e.g. in teneligliptin+metformin

combo, metformin was already under price control. Hence, all companies launching

this combo had taken prior permission from government authorities before launching

the product. Thus, we believe the impact of NLEM expansion to be fairly benign.

0.0

0.3

0.6

0.9

1.2

1.5

0

800

1600

2400

3200

4000

FY16 FY17 FY18 FY19 FY20

(IN

R m

n)

Sales Proportion of IPM impacted (base)

Pharmaceuticals

Edelweiss Securities Limited

28 Edelweiss Research is also available on www.edelweissresearch.com, Bloomberg - EDEL, Thomson Reuters, and Factset

We caution that some critical details are still missing and we await clarification from

the Ministry of Health

Combinations: Whether these 39 molecules are the only ones to come under the

NLEM or will it include combinations too?

SKUs: When drugs go on the NLEM, it’s not a blanket price control, e.g. in a

molecule, an injection may be under price control but a tablet need not be.

Likewise, certain strengths could be under price control and others may not be

Extent of price cuts needed: The extent of price cuts for various brands (assuming

they are added in DPCO) will be different depending on their market share and

current price.

NLEM expansion list

Source: Edelweiss Research.

Note: Several products, especially oncology ones are ‘hospital’ or sold through institutional channels; hence market size could be much greater.

Compound Market size (INR mn)

Company  Brand Sales (INR mn) Rank Comments

Amikacin 5,338 Cipla Omnikacin 777 2

Zydus Cadila Amicin 696 3

Alkem Amitax 285 5

Azacitidine 90 N/A Cadila has ~INR 12.5mn sales

Bedaquiline

Bendamustine 114 Natco Bendit 16 2 Dr.Reddy has ~INR15mn sales

Buprenorphine 159 No major companies

Bupenorphine + Naloxone

Cefuroxime 7,390 GSK Ceftum 2,050 1

Alkem Zocef 617 3

Lupin Cetil 594 4

Glenmark Altacef 214 10

Dabigatran 1,944 Lupin Dabistar 600 2

Torrent Afogatran 366 3

Alkem Dabiclot 219 4

Sun Dabigo 200 5

Natco Dabigat 117 7

Glenmark Dabigza 87 8

Daclatasvir 456 Natco Natdac 137 2

Dr.Reddy Hepcfix 63 3

Cipla Hepcdac 25 4 Cadila <INR20mn

Darunavir + Ritonavir 40 No major companies

Delamanid

Dolutegravir 379 Emcure is the only player

Fludarbine 6

Fludrocortisone 73 No major companies

Fomepizole

Fulvestrant 255 Natco Fulvenat 160 1

Insulin glargine 7,535 Sanofi Lantus 5,630 1

Biocon Basalog 867 2

Sanofi Toujeo 387 3

Wockhardt Glaritus 227 4

Cipla Basaglar 113 5 Lupin has ~INR20mn sales

Irinoteccan HCl trihydrate 79 Dr.Reddy Irnocam 22 2 Cadila has <INR20mn sales

Major players

Edelweiss Securities Limited

Pharmaceuticals

Edelweiss Research is also available on www.edelweissresearch.com, Bloomberg - EDEL, Thomson Reuters, and Factset 29

NLEM expansion list (Contd.)

Source: Edelweiss Research.

Note: Several products, especially oncology ones are ‘hospital’ or sold through institutional channels; hence market size could be much greater.

Compound Market size (INR mn)

Company  Brand Sales (INR mn) Rank Comments

Itraconazole 9,243 Glenmark Canditral 512 3

Glenmark Syntran 388 4

Alkem Itratuf 315 6

Sun Iwin 297 7

Sun Alcros 240 10

Ivermectin 2,568 Sun Ivermectol 843 1 Market is 10x usual run-rate

Ajanta Ivrea 121 5

Lamivudine 41 Cipla Lamivir 32 1 Cipla has 80% share

Latanoprise 484 Sun Latoprost/Rt 243 1

Pfizer Xalatan 164 2

Ajanta Lacoma Pf 40 5 Cadila <INR20mn

Lenalidomide 832 Natco Lenalid 742 1 Natco is 89% of retail market

Dr.Reddy Lenangio 53 2

Leuprolide acetate 595 Sun Lupride 268 1

Montelukast 737 Cipla Montair 375 1

Sun Montek 96 2

Mupirocin 3,248 GSK T Bact 2,386 1

Glenmark Supirocin 67 5

Nicotine replacement therapy 1,003 Cipla Nicotex Plus 417 1

Cipla Nicogum 298 2

Cipla Nicotex 277 3

Nitazoxanide 108 Lupin Nizonide 71 1

Ormeloxifene (Centchroman) 163 Torrent Sevista 105 1

Phenoxymethyl penicillin

Procaine benzyl penicillin

Rotavirus vaccine 735 GSK Rotarix 181 2

Secnidazole 84 Abbott Satrogyl 84 1

Tenecteplase 945 EmcureEmcure holds 95% of the

market. Abbott and Cipla ~5%

Teneligliptin* 4,303 Zydus Cadila Tenglyn 343 3

Glenmark Zita Plus 284 4

Eris Tendia 282 5

Glenmark Ziten 238 8

Alkem Olymprix 178 9

Torrent Afoglip 110 11

Torrent Teneza 97 13

Tenofovir+Lamivudine+Dolutegravir 329 EmcureEmcure holds 99% of the

market; Cipla ~1%

Terbinafine 2,004 Sun Sebifin 248 2

GSK Zimig 152 3

Dr.Reddy Gris-ODT 140 4

Glenmark Ifin 98 6

Valganciclovir 46 Cipla Valgan 27 1

Major players

Pharmaceuticals

Edelweiss Securities Limited

30 Edelweiss Research is also available on www.edelweissresearch.com, Bloomberg - EDEL, Thomson Reuters, and Factset

Right capital allocation to drive returns

Soaring investments in complex generics/specialty and extended business costs during FY15–19 rendered US business of most Indian pharma companies almost non-profitable. RoCEs, which had reached north of 20% in 2015, sagged to 11% by FY19 with SUNP, LPC and TRP feeling the heat.

Prior to the pandemic, the pharma industry had already started showing signs of recovery—by dint of prudent capital allocation

decisions and concentrating on areas of strength, i.e. targeted investments in certain therapies (SUNP, Cipla, LPC, Alembic) or businesses (ARBP and DRRD in injectables).

We particularly like the strategy that only few players such as Cipla have adopted: to venture into specialty, which entails a small upfront payment and the rest is based on milestones, putting no pressure on balance sheet and P&L in case of an adverse outcomes.

Rationalising R&D spends; focus on improving productivity

As generics became a crowded space, Indian players started de-risking by moving up

the value chain. The significant amount of capital required to invest in augmenting

differentiated products or specialty led to R&D spends almost doubling over FY14–

19.

However, we note the recent shift in strategy of Indian drugs players, which involves

prioritising R&D spends towards focussed therapy areas and improving productivity

by leveraging R&D to sell products in multiple markets. Furthermore, companies are

relying on partnerships and joint ventures to finance R&D and commercialise

products: DRRD in 505b2 and biosimilars, ARBP in biosimilars, GNP in specialty

molecules. This strategic de-risking deal enables cost recovery and reduces future

R&D payouts while retaining some future upside benefits from successful filings and

commercialization.

Large players such as SUNP, LPC and DRRD commit over USD200mn in R&D

investments per annum, mainly towards specialty (wherein SUNP leads the pack)

and complex generics, primarily in injectables, respiratory, mesalamines and

transdermals. We expect biosimilars to constitute a notable share in the R&D pie

over coming years, particularly for ARBP, DRRD and CDH.

Indian players prioritising R&D spends

SUNP LPC DRRD CIPLA ARBP CDH

Specialty Respiratory Injectables Respiratory Biosimilars Mesalamines

Injectables Specialty Biosimilars Injectables Injectables Transdermals

Biosimilars Specialty Respiratory Injectables

Injectables Specialty

Biosimilars, Vaccines

Source: Company, Edelweiss Research

We reckon sector RoCEs would improve

~150bps annually over the next three–four

years as players rationalise their R&D

spends, optimise capital allocation and milk

their past investments—largely via key US

launches and replicating the playbook

aggressively in the EU and EMs.

Edelweiss Securities Limited

Pharmaceuticals

Edelweiss Research is also available on www.edelweissresearch.com, Bloomberg - EDEL, Thomson Reuters, and Factset 31

Focus remains on rationalising R&D investments

Company Comments on R&D

DRRD Focussing on creating global dossiers to leverage R&D to market same products across geographies, thus, improving productivity. Also, made a conscious decision to rationalise R&D spends on 505B2, evident from less number of products in the pipeline.

CIPLA With successful completion of gAdvair trials and filing, we expect R&D as % of sales to moderate going forward. However, the company will continue to invest meaningfully as the respiratory assets progress in clinical trials.

ARBP Only company to see significant increase in R&D, both in absolute and as % of sales as company gears itself to conduct biosimilar trials.

LPC "The focus today is on more complex products. Over the next several quarters, it will - tend to be a little lower, perhaps settling around the 8% range."

GNP Management intends to bring down R&D spends from 13% to 10% of sales in FY22. Scouting for partners for conducting phase 3 trials for certain molecules. Bulk of R&D comprises of innovative R&D and expect it to taper down.

CDH R&D to hover around 7–8% of revenue, with 60% on generics and rest divided between NCEs, biologics and vaccines.

Source: Company, Edelweiss Research

While we do not expect sector R&D to materially decline, the intensity of spends is

likely to moderate going forward commensurate with the increase in revenues.

Hence, we believe R&D as a percentage of sales would remain flat over the next

two–three years at ~7% of sales.

Sector R&D to increase commensurate with revenues

Source: Company, Edelweiss Research

0

2

4

6

8

10

0

400

800

1200

1600

2000

FY14 FY15 FY16 FY17 FY18 FY19 FY20 FY21 FY22 FY23 FY24

(%)

USD

mn

R&D as % of sales

Pharmaceuticals

Edelweiss Securities Limited

32 Edelweiss Research is also available on www.edelweissresearch.com, Bloomberg - EDEL, Thomson Reuters, and Factset

GNP, LPC and DRRD spend highest on R&D as % of sales; spends to moderate going forward

Company FY14 FY15 FY16 FY17 FY18 FY19 FY20 FY21 FY22E FY23E FY24E

Glenmark 9.0 10.2 9.5 11.6 12.3 13.2 12.7 11.2 11.1 10.9 10.7

Lupin 8.2 8.6 11.3 13.2 11.7 10.7 10.1 9.4 8.9 8.9 8.7

Dr. Reddy's 9.4 11.8 11.5 13.9 12.9 10.1 8.8 8.7 6.9 6.7 6.6

Cadila 6.4 6.5 8.1 8.0 7.3 7.2 7.7 7.5 7.5 7.5 7.0

Torrent 4.2 4.1 3.7 7.4 7.7 7.0 6.2 6.1 6.0 6.3 6.3

Sun Pharma 6.5 6.7 7.5 6.7 7.8 6.6 5.9 6.3 6.5 6.2 5.9

Natco 5.2 6.3 6.2 6.0 5.6 6.1 7.0 7.0 7.0 7.0 7.0

Cipla 5.0 5.0 6.5 7.6 7.1 7.4 6.8 4.8 5.4 5.8 5.8

Alkem 4.3 4.5 4.3 5.5 5.7 6.3 5.7 6.0 5.6 5.6 5.6

Aurobindo 3.1 2.8 3.4 3.6 4.0 4.4 4.1 6.1 6.0 6.0 6.0

Ajanta 4.2 4.8 6.1 7.5 8.7 8.6 6.3 4.8 6.0 6.0 6.0

IPCA 3.4 3.4 4.7 3.9 3.6 2.4 2.5 2.6 2.5 2.5 2.5

Source: Company, Edelweiss Research

Capex intensity to wane; RoCEs to improve going forward

Over FY14–19, pharma companies invested heavily to upgrade in-house

technologies, enhance capacity and acquire newer capabilities or assets. The

sector’s gross block almost doubled over FY15–19 primarily due to investments in

the US. Soaring investments in complex generics/specialty and pricing pressures

during FY15–19 though rendered ex-domestic business of most companies almost

non-profitable. RoCEs, which had topped 20% in 2015, plunged to 10% by FY19 with

maximum declines seen at SUNP, LPC and TRP.

Sector gross block doubled over FY16–21; capex to now taper down

Source: Company, Edelweiss Research

In the last one and half years, Indian pharma companies have started reaping the

benefits of investments; this is evident from recent filings/launches (Cipla: albutero,

gSensipar; Lupin- albuterol; Dr. Reddy’s- gCiprodex, gSuboxone, gKuvan, gVascepa).

We expect sector RoCEs to improve ~550bps in next three–four years as players

rationalise their R&D spends, improve capital allocation strategies and milk past

investments. Several companies are also trying to replicate US dossiers and launch

aggressively in the EU and EMs to improve R&D productivity, resulting in better

margins.

0

320

640

960

1280

1600

FY16 FY17 FY18 FY19 FY20 FY21 FY22E FY23E FY24E

(IN

R b

n)

Gross Block

15% CAGR

7% CAGR

Edelweiss Securities Limited

Pharmaceuticals

Edelweiss Research is also available on www.edelweissresearch.com, Bloomberg - EDEL, Thomson Reuters, and Factset 33

RoCEs to improve ~340bps over FY21–23E

Source: Company, Edelweiss Research

Improved productivity and quality launches to drive margin

Pricing pressure, extended business costs and higher R&D spends dragged sector

EBITDA margin by ~400bps over FY15–20. However, covid-induced savings led to

~300bps improvement in FY21. Even on this high base, we expect margin to further

improve 150–200bps over FY21–23 led by renewed focus on cost control, improving

SG&A productivity and visibility of quality launches aiding margin expansion.

By company, we expect NTCPH, SUNP, LPC and DRRD to log sharp upticks in margin

driven by high-value launches and cost rationalisation. Moreover, improved

productivity is likely to offset the loss on account of MEIS incentives and price

erosion in the US. On balance, gross margin stable for the sector should stay stable.

Improved productivity to keep gross margin stable

Source: Company, Edelweiss Research

Cost control and quality launches to drive margin

Source: Company, Edelweiss Research

Healthy balance sheet: Source of additional comfort

Indian pharma companies have become more disciplined with respect to

maintaining healthy balance sheets and focusing on right capital allocation

strategies. This in turn is likely to drive up returns and generate strong FCFs to fuel

their next leg of growth. TRP, CDH, GNP and TRP, which are reeling under high debt,

are expected to therefore benefit from cost rationalisation, improved productivity

and quality launches in the US.

5

10.4

15.8

21.2

26.6

32

FY13

FY14

FY15

FY16

FY17

FY18

FY19

FY20

FY2

1E

FY2

2E

FY2

3E

(%)

RoCE (%) RoCE ex-domestic

RoCE bottomed to 11% (ex-domestic 6%) in FY20 from its peak of ~27% (ex-domestic 22%) in FY14

Increasing investments and declining profitability impacted RoCEs RoCEs expected to

increase ~340bs over FY21-23E

62

64

66

68

70

FY13

FY14

FY15

FY16

FY17

FY18

FY19

FY20

FY21

FY22

E

FY23

E

Sector Gross margin (%)

18

20

22

24

26

28

FY13

FY14

FY15

FY16

FY17

FY18

FY19

FY20

FY21

FY22

E

FY23

E

Sector EBITDA margin (%)

Pharmaceuticals

Edelweiss Securities Limited

34 Edelweiss Research is also available on www.edelweissresearch.com, Bloomberg - EDEL, Thomson Reuters, and Factset

Sector leverage to remain at comfortable levels

Source: Company, Edelweiss Research

Lower capex and high-value launches to propel FCF

Source: Company, Edelweiss Research

0

0.4

0.8

1.2

1.6

2

FY1

4

FY1

5

FY1

6

FY1

7

FY1

8

FY1

9

FY2

0

FY2

1E

FY2

2E

FY2

3E

FY2

4E

Sector Debt/EBITDA

-250

-150

-50

50

150

250

FY1

4

FY1

5

FY1

6

FY1

7

FY1

8

FY1

9

FY2

0

FY2

1E

FY2

2E

FY2

3E

FY2

4E

INR

bn

Sector FCF Capex

Edelweiss Securities Limited

Pharmaceuticals

Edelweiss Research is also available on www.edelweissresearch.com, Bloomberg - EDEL, Thomson Reuters, and Factset 35

What’s in store for covid portfolio?

Despite covid cases sliding to a five-month low, several companies are

still developing various covid treatments. Based on our interactions

and recent results calls, companies believe these could be multi-year

opportunities. We attempt to size up some of these opportunities for

Indian pharma companies.

While there are beneficiaries in the near term, and vaccine

opportunity can have longer tailwinds (export markets, lack of clarity

of number of doses), other covid-19 opportunity may fade over time.

Slashing of remdesivir prices and expansion of the Covaxin vaccine

facility by the government may squeeze private players’ margins.

Moreover, the covid-opportunity itself may be limited and the stock

reaction may overreach the actual potential.

Evolving protocol keeping drugs makers interested…

The drugs that were the first line of treatment in the first and second waves such as

HCQs, favipiravir and antibiotics like azithromycin are no longer part of treatment

protocol. Treatment protocol begins with paracetamol, ivermectin naproxen and

HCQs (if needed), before progressing to inhaled budesonide and remdesivir in

moderate to severe cases.

Multiple covid infection waves across the world, evolving nature of the virus and

limited protection from vaccines mean that drugmakers are still researching

treatment options. Companies such as Cadila have been at the forefront of home-

grown innovation while Cipla has managed to tap into multiple foreign medicines

for the domestic market.

Exhibit 51 captures some of the major Indian companies; there are several others

such as Panacea, Gland, Stelis, Jubilant (Sputnik-V manufacturing), Wockhardt

(vaccine CMO) and private entities such as Biological E (J&J vaccine CMO). On the

drugs side, five Indian companies are in the fray to develop molnupiravir for the

domestic market and Divis is the API partner for innovator Merck.

It is likely that some Indian companies may license drugs from foreign innovators.

Thus, in case of a 3rd covid wave, one could see some Indian companies turn in

disproportionately higher cash flows.

Pharmaceuticals

Edelweiss Securities Limited

36 Edelweiss Research is also available on www.edelweissresearch.com, Bloomberg - EDEL, Thomson Reuters, and Factset

Major Indian players in covid treatment

Oral Antivirals Remedesivir Inhalers/Steroids MABs/Others Specialized Vaccine

Alkem √ (favipiravir)

Aurobindo √ (vaccine CMO)

Biocon √ (itolizumab)

Cadila √ √ √ (Virafin) √ (Zy-Cov D)

Cipla √ (Molnupiravir) √ √ √ (tocilizumab) √ (antibody

cocktail)

Divis √ (Molnupiravir)

Dr.Reddy √ (Molnupiravir) √ √ (Sputnik-V)

Glenmark √ (favipiravir)

Ipca √ (HCQs)

Lupin √ (barecitinib)

Natco √ (Molnupiravir) √ (barecitinib)

Sun Pharma √ (Molnupiravir) √

Torrent Pharma √ (Molnupiravir)

Source: Edelweiss Research

…but vaccine opportunity may be overstated…

Vaccinating a population of 1.4bn is a Himalayan opportunity potentially that can

straightway double if a booster dose is required. However, the potential for

incumbents such as Cadila, Dr. Reddy’s and perhaps Cipla (in case it imports

Moderna) is limited considering approval delays, lack of uptick in domestic

manufacturing, sub-par performance of private sector and acceleration in India’s

vaccination pace.

India’s daily vaccination pace has picked up…

Source: Our World in Data

Shown is the rolling 7-day average.

…with ~901mn doses administered so far

Source: Our World in Data

Note: As on 2nd October 2021

Shortages to ease as capacity ramps up

Meanwhile, the government has decided to fast-track vaccine application of foreign

players, which should ease the situation somewhat. Moreover, the current

production capacity of the indigenously developed Covaxin vaccine has shot up from

10 million vaccine doses in April 2021 to 20–25 million vaccine doses/month in Sep-

Oct. It is expected to reach nearly 100 million doses per month by Mar-22.

0

20,00,000

40,00,000

60,00,000

80,00,000

1,00,00,000

1,20,00,000

16

-Jan

-21

31

-Jan

-21

15

-Fe

b-2

10

2-M

ar-2

11

7-M

ar-2

10

1-A

pr-

21

16

-Ap

r-2

10

1-M

ay-2

11

6-M

ay-2

13

1-M

ay-2

11

5-J

un

-21

30

-Ju

n-2

11

5-J

ul-

21

30

-Ju

l-2

11

4-A

ug-

21

29

-Au

g-2

11

3-S

ep

-21

28

-Se

p-2

1

Daily vaccine doses administered

901

0

200

400

600

800

1000

16

-Jan

-21

01

-Fe

b-2

1

17

-Fe

b-2

1

05

-Mar

-21

21

-Mar

-21

06

-Ap

r-2

1

22

-Ap

r-2

1

08

-May

-21

24

-May

-21

09

-Ju

n-2

1

25

-Ju

n-2

1

11

-Ju

l-2

1

27

-Ju

l-2

1

12

-Au

g-2

1

28

-Au

g-2

1

13

-Se

p-2

1

29

-Se

p-2

1

Cumulative doses (mn)

Edelweiss Securities Limited

Pharmaceuticals

Edelweiss Research is also available on www.edelweissresearch.com, Bloomberg - EDEL, Thomson Reuters, and Factset 37

Covishield is already at 100mn/month, Sputnik V availability is likely to improve once

domestic players ramp-up. Cadila is expected to supply 10–12mn/month. This is

likely to further improve India’s inoculation rate.

State governments likely to squeeze manufacturers’ margin

The vaccination drive for 18 years and above in India began on 1st May. Domestic

vaccine manufacturers, which were earlier required to supply 50% of their monthly

doses to the Government of India, now have to supply 75%. The balance can be

supplied to state governments, private hospitals and industrial establishments. The

procurement costs of state government are likely to be lower than private market,

which may squeeze manufacturers’ margin.

Moreover, all supplies - especially from new players - may not necessarily be

absorbed given that supply would be enough after 3 months and it might not be a

'sellers’ market'.

As Exhibit 54 shows, the fair value is substantially lower as the government is the

biggest procurer (75%) of vaccines, and we believe margins are likely to be in single-

digits. While the private sector can generate substantially higher margins, the

performance so far has been sub-par.

In Jul-21, the Union Health Ministry said that despite 25% of vaccines being reserved

for the private sector, only 7% of the total covid-19 vaccinations were done there.

Likewise, Apollo and Max Healthcare have said that pace of vaccination seen in April-

May had declined substantially by July (~40%). Hence, while vaccines will help

generate FCF for the company, but they contribute substantially less to the fair

value.

Fair value lower for Dr. Reddy’s Sputnik V and Cadila’s ZyCov-D

Particulars FY22 FY23

Sputnik V Revenue potential (USD mn) 238 255

EPS accretion (INR) 8 12

NPV per share (INR) INR32/share

ZyCov-D Revenue potential (USD mn) 219 437

EPS accretion (INR) 3.5 7.5

NPV per share (INR) INR15/share

Source: Edelweiss Research

…which gives rise to increasing deal possibility on novel drugs

Cadila’s Virafin – Potential multi-year opportunity

Virafin is a Pegylated Interferon alpha-2b that has been approved since 2001 and is

used to treat various forms of cancer as well as chronic hepatitis B and C. They have

been found to reduce viral replication and secondary viral infection of neighbouring

cells. In India, Cadila has been selling peg interferon alpha-2b under the brand name

Pegi Hep for Hepatitis C. Virafin dose is to be 1mg/kg (we believe 1mg per kg patient

weight).

In Phase 2 open label trial, 40 patients were randomised to receive PEG IFN-α2b

+ standard of care vs. SOC alone. After 7 days, 80% patients on PEG arm tested

negative on RT-PCR vs. 63% on SOC arm; on day-14, 95% on PEG arm vs. 68% on

SOC. Duration of oxygen needed on PEG arm was 34 hours vs. 50 hours in SOC

group.

In Ph.3 trials, 80% patients on PEG arm vs. 68% in SOC group showed two point

statistically significant clinical improvement (WHO 7-point ORDINAL SCALE) on

Pharmaceuticals

Edelweiss Securities Limited

38 Edelweiss Research is also available on www.edelweissresearch.com, Bloomberg - EDEL, Thomson Reuters, and Factset

day 8. Hours of supplemental oxygen required on PEG arm was 5 days vs. 6 days

on SOC arm.

2 point on WHO 7-point scale means not hospitalized but limitation on activities

We believe drug cost to be INR9,000–10,000 for a 70kg patient. To ease the burden

on existing treatment options like remdesivir. Virafin can be used for moderate

patients while remdesivir can be restricted to severe patients. Given the drug

shortages and paucity of options in treatment, we think it is likely to be adopted

quickly. We expect the market size to be~INR15bn.

Cipla, Sun Pharma also sell pegylated interferon alpha-2b brands in India, and it is

likely that they could also be in line for an approval (similar to favipiravir where

Glenmark conducted trials but 10+ players eventually got approval).

Cipla’s Antibody cocktail – Huge potential in outpatient setting

Cipla is marketing Roche’s casirivimab + imdevimab injection, which received

Emergency Usage Authorization (EUA) from India’s CDSCO. The approval is after the

US FDA and the EU’s CHMP gave EUA. Approval is based on REGN-COV 2067 trial,

which reduced the risk of hospitalization or death by 70% at Day-28 (7 events in

treatment arm vs. 24 events in placebo; p=0.0024). The time to symptoms resolution

was ten days versus 14 days in placebo.

It is approved for mild to moderate patients aged 12+ who are confirmed infected

and at “high-risk” to develop severe disease. The criteria for high-risk is defined as

age of 60 years and having co-morbidities such as hypertension and diabetes. Thus

the patient pool may be restricted to those with co-morbidities.

However, while the REGN-COV 2067 trial investigated ‘high-risk, non-hospitalized’

patients, Roche has also conducted Ph.3 trials in ‘post-exposure prophylaxis

uninfected people.’ This basically means that it is also being developed as a

treatment option for: i) people living in the same house as the infected, but not

showing Covid-symptoms or antibodies; and ii) recently infected asymptomatic

people. The FDA is expected to expand EUA to include pre-exposure prophylaxis for

appropriate populations.

Roche is expected to produce ~2mn treatment doses annually. US has placed an

order for 1.5mn dose, which were delivered by 30-Jun-21, Germany for 0.2mn and

other EU countries for an undisclosed volume. Also, the price is likely to be very high.

Germany’s 0.2mn doses order is for ~USD2,400/dose. Assuming that Cipla can

market 3,0000 doses in FY22 at a realization of ~INR40,000/dose, this is likely to add

INR12bn to its top line and 3-4% to EPS. H1CY21 sales were ~USD2.76bn.

Merck’s molnupiravir – First-in-line oral treatment

Divi’s is contracted to manufacture and supply molnupiravir API to Merck.

Molnupiravir is Merck and Ridgeback’s oral antiviral medication to treat Covid.

Interim analysis of Ph.3 shows molnupiravir reduced the risk of hospitalization or

death by approximately 50%; 7.3% of patients who received molnupiravir were

either hospitalized or died through Day 29 following randomization (28/385),

compared with 14.1% of placebo-treated patients (53/377).

Through Day 29, no deaths were reported in patients that received molnupiravir, as

compared to 8 deaths in patients that received placebo. An independent Data

Monitoring Committee has recommended that recruitment into the study be

stopped in consultation with the FDA early due to these positive results. Merck is

expected to seek US emergency use authorization. This could pave the way for the

Edelweiss Securities Limited

Pharmaceuticals

Edelweiss Research is also available on www.edelweissresearch.com, Bloomberg - EDEL, Thomson Reuters, and Factset 39

first covid treatment pill in the world. For now only antibody cocktails that have to

be given intravenously are approved for non-hospitalized patients.

According to Merck, US government has already placed orders for ~1.7mn doses at

~USD700/dose. Merck expects to produce at least 10mn doses in CY21 and even

more in CY22. Divi’s is contracted to supply API to Merck and our calculations

suggest it could add ~8-10% to Merck’s FY22 EPS.

Merck has also given licences to Sun, Cipla, Natco, Torrent, Dr. Reddy’s and Emcure

to sell molnupiravir in India and 100 low- and middle-income countries. Natco is

conducting its own trials in India while others are collaborating, and we expect trial

results soon.

We forecast ~10% EPS accretion to Divis’ FY23 earnings based on USD18/dose

realization and ~55% EBITDA margin.

Pharmaceuticals

Edelweiss Securities Limited

40 Edelweiss Research is also available on www.edelweissresearch.com, Bloomberg - EDEL, Thomson Reuters, and Factset

Valuations: Expensive but not prohibitive

The pharma sector has been in a sweet spot as it positioned itself quickly to grab opportunities in the covid-19-hit economy. Covid-19 pandemic – which led to best-ever quarters in terms of profitability – was a serendipitous event. Nifty Pharma is trading at ~27x PE and ~17x EV/EBITDA 1-year forward; they are six-year highs.

While sector RoCEs and RoEs are likely to improve 100–150bps annually hereon, we note RoEs are still lower than the peak seen in

FY14. And, the re-rating in the broader market has ensured pharma premium to Nifty stands at ~20%, which is below the 10-year average.

There are clear beneficiaries in the near term, and vaccine opportunity can have a long tail from exports and private markets, not to mention lack of clarity on the number and timing of doses, other covid-19 opportunity may fade over time.

We reiterate only stocks with diversified geographical presence, a quality launch pipeline, healthy balance sheet and earnings sustainability are likely to outperform the sector. We prefer SUNP, CIPLA and ARBP among large-caps, and AJP and ALKM in mid-caps.

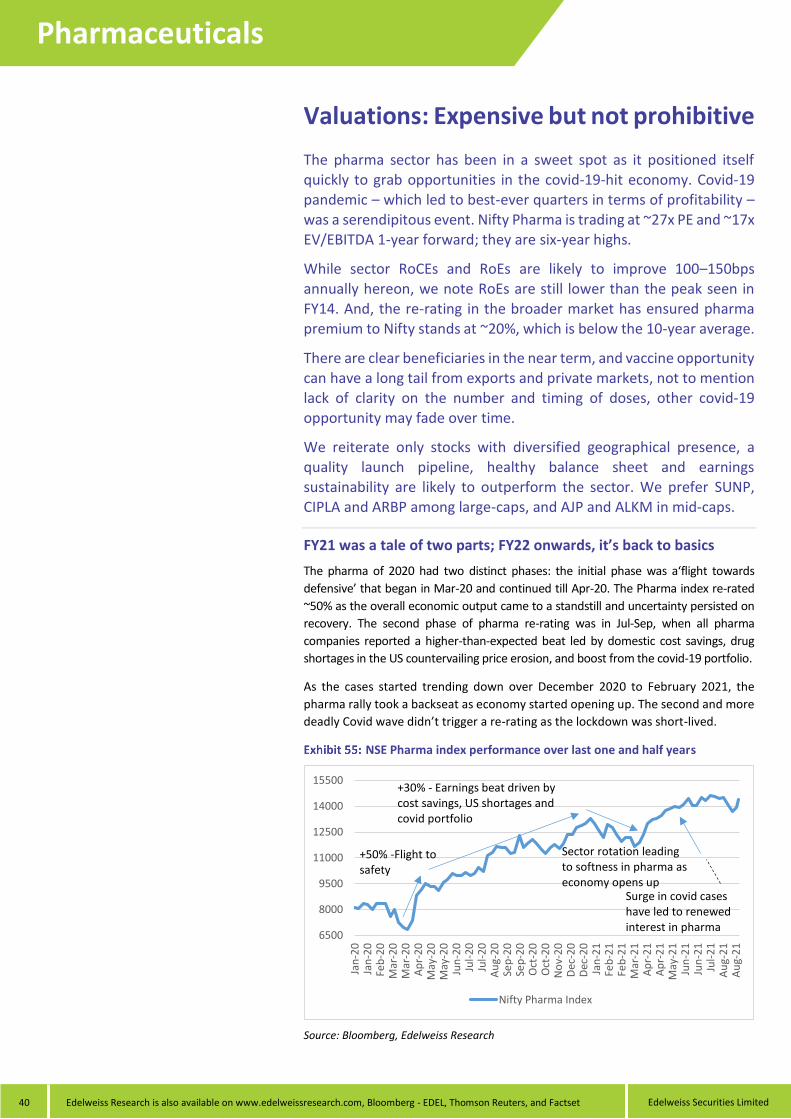
FY21 was a tale of two parts; FY22 onwards, it’s back to basics

The pharma of 2020 had two distinct phases: the initial phase was a‘flight towards

defensive’ that began in Mar-20 and continued till Apr-20. The Pharma index re-rated

~50% as the overall economic output came to a standstill and uncertainty persisted on

recovery. The second phase of pharma re-rating was in Jul-Sep, when all pharma

companies reported a higher-than-expected beat led by domestic cost savings, drug

shortages in the US countervailing price erosion, and boost from the covid-19 portfolio.

As the cases started trending down over December 2020 to February 2021, the

pharma rally took a backseat as economy started opening up. The second and more

deadly Covid wave didn’t trigger a re-rating as the lockdown was short-lived.

NSE Pharma index performance over last one and half years

Source: Bloomberg, Edelweiss Research

6500

8000

9500

11000

12500

14000

15500

Jan

-20

Jan

-20

Feb

-20

Mar

-20

Mar

-20

Ap

r-2

0M

ay-2

0M

ay-2

0Ju

n-2

0Ju

l-2

0Ju

l-2

0A

ug-

20

Sep

-20

Sep

-20

Oct

-20

Oct

-20

No

v-2

0D

ec-2

0D

ec-2

0Ja

n-2

1Fe

b-2

1Fe

b-2

1M

ar-2

1A

pr-

21

Ap

r-2

1M

ay-2

1Ju

n-2

1Ju

n-2

1Ju

l-2

1A

ug-

21

Au

g-2

1

Nifty Pharma Index

+50% -Flight to safety

+30% - Earnings beat driven by cost savings, US shortages and covid portfolio

Sector rotation leadingto softness in pharma as economy opens up

Surge in covid cases have led to renewed interest in pharma

Edelweiss Securities Limited

Pharmaceuticals

Edelweiss Research is also available on www.edelweissresearch.com, Bloomberg - EDEL, Thomson Reuters, and Factset 41

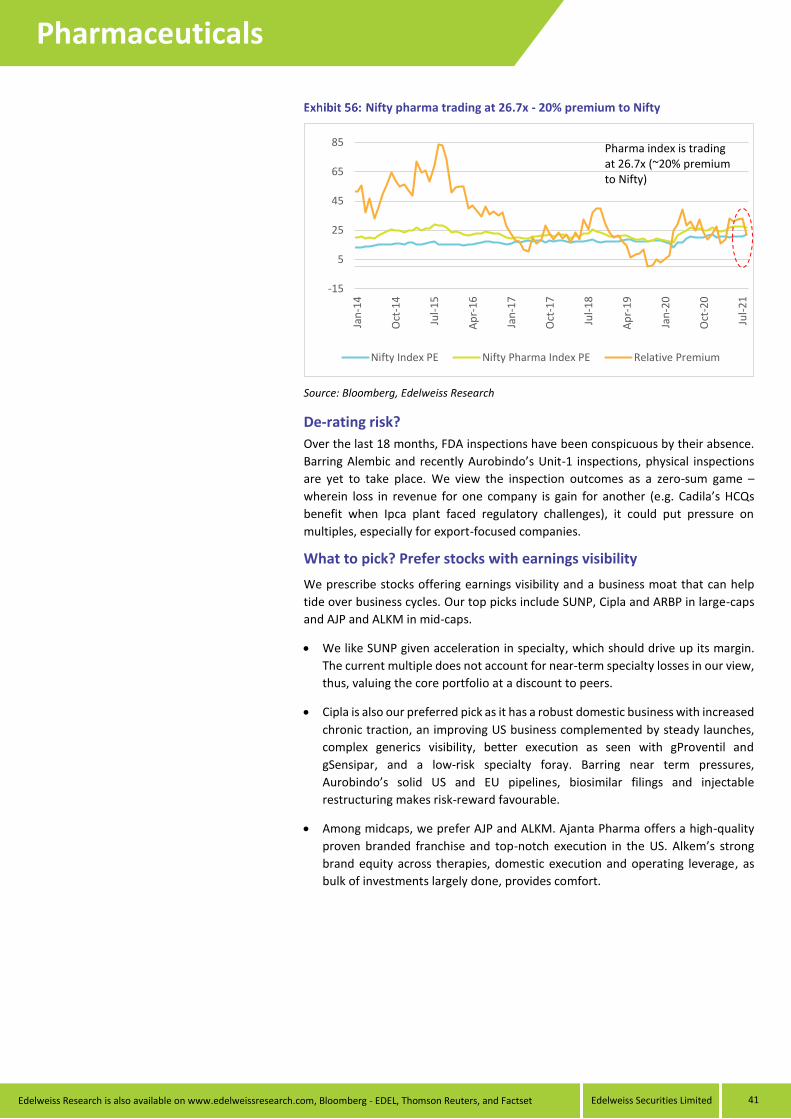
Nifty pharma trading at 26.7x - 20% premium to Nifty

Source: Bloomberg, Edelweiss Research

De-rating risk?

Over the last 18 months, FDA inspections have been conspicuous by their absence.

Barring Alembic and recently Aurobindo’s Unit-1 inspections, physical inspections

are yet to take place. We view the inspection outcomes as a zero-sum game –

wherein loss in revenue for one company is gain for another (e.g. Cadila’s HCQs

benefit when Ipca plant faced regulatory challenges), it could put pressure on

multiples, especially for export-focused companies.

What to pick? Prefer stocks with earnings visibility

We prescribe stocks offering earnings visibility and a business moat that can help

tide over business cycles. Our top picks include SUNP, Cipla and ARBP in large-caps

and AJP and ALKM in mid-caps.

We like SUNP given acceleration in specialty, which should drive up its margin.

The current multiple does not account for near-term specialty losses in our view,

thus, valuing the core portfolio at a discount to peers.

Cipla is also our preferred pick as it has a robust domestic business with increased

chronic traction, an improving US business complemented by steady launches,

complex generics visibility, better execution as seen with gProventil and

gSensipar, and a low-risk specialty foray. Barring near term pressures,

Aurobindo’s solid US and EU pipelines, biosimilar filings and injectable

restructuring makes risk-reward favourable.

Among midcaps, we prefer AJP and ALKM. Ajanta Pharma offers a high-quality

proven branded franchise and top-notch execution in the US. Alkem’s strong

brand equity across therapies, domestic execution and operating leverage, as

bulk of investments largely done, provides comfort.

-15

5

25

45

65

85

Jan

-14

Oct

-14

Jul-

15

Ap

r-1

6

Jan

-17

Oct

-17

Jul-

18

Ap

r-1

9

Jan

-20

Oct

-20

Jul-

21

Nifty Index PE Nifty Pharma Index PE Relative Premium

Pharma index is trading at 26.7x (~20% premiumto Nifty)

Pharmaceuticals

Edelweiss Securities Limited

42 Edelweiss Research is also available on www.edelweissresearch.com, Bloomberg - EDEL, Thomson Reuters, and Factset

Pharma valuation table- Edelweiss Coverage

Source: Company, Edelweiss Research

CMP Target Reco Mcap

(USD bn)

CAGR (%)

(FY21-24E)

INR mn INR Price FY21 FY22E FY23E FY24E FY21 FY22E FY23E FY24E FY21 FY22E FY23E FY24E FY21 FY22E FY23E FY21 FY22E FY23E

Sun Pharma 827 970 BUY 26.76 3,34,981 3,80,384 4,29,455 4,97,458 84,833 1,01,442 1,25,834 1,62,404 24.7 28.0 36.6 48.7 20.2 33.4 29.5 22.6 23.0 18.8 14.1

Dr. Reddy's 4,956 5,150 HOLD 11.08 1,89,722 2,23,099 2,52,347 2,90,567 44,682 48,189 65,105 85,427 142.9 179.7 256.1 346.4 24.4 34.7 27.6 19.4 18.3 16.6 11.5

Cipla 986 1,140 BUY 10.72 1,91,596 2,15,232 2,35,579 2,69,662 42,524 48,700 59,120 69,536 29.8 37.2 46.7 55.6 14.4 33.0 26.5 21.1 18.2 15.7 12.3

Biocon 365 335 REDUCE 5.91 71,058 83,183 1,13,237 1,41,945 16,526 22,350 32,557 44,018 6.1 7.0 13.1 18.9 39.0 59.6 52.0 27.9 27.7 20.7 13.7

Aurobindo 717 990 BUY 5.67 2,47,747 2,48,204 2,66,774 3,00,258 53,335 53,161 59,474 73,509 55.0 57.2 62.6 79.0 11.4 13.0 12.5 11.5 7.8 7.9 6.2

Torrent Pharma 3,081 2,850 REDUCE 7.04 80,050 87,170 1,00,306 1,12,785 24,850 27,191 31,928 36,664 74.0 75.6 95.2 114.3 14.8 41.7 40.8 32.4 22.7 20.2 16.3

Lupin 966 1,060 HOLD 5.92 1,51,630 1,67,492 1,92,119 2,32,074 25,669 30,122 39,663 53,692 26.8 34.1 49.0 71.0 27.7 36.0 28.4 19.7 17.4 14.8 10.8

Cadila 556 515 REDUCE 7.67 1,51,022 1,60,907 1,71,267 1,95,481 33,410 35,903 38,406 47,719 22.7 21.5 23.4 30.3 12.1 24.5 25.8 23.7 18.7 16.0 14.6

Large Cap 3,25,829 3,67,059 4,52,087 5,72,969 382 463 463 463 24.0 34.1 29.8 22.3 18.6 16.1 12.3

Alkem 3,990 4,600 BUY 6.44 88,765 1,05,517 1,16,632 1,31,405 19,539 21,602 25,248 28,709 132.6 140.7 170.0 189.8 12.7 30.1 28.4 23.5 24.3 21.6 17.6

Ipca 2,424 2,800 BUY 4.15 54,199 60,511 69,055 77,681 15,443 15,697 18,864 21,329 90.0 91.5 112.1 118.2 9.5 26.9 26.5 21.6 19.5 19.1 15.0

Ajanta 2,260 2,885 BUY 2.67 28,896 32,973 37,773 42,138 9,985 10,621 12,439 13,887 74.5 88.8 105.8 121.9 17.8 30.3 25.5 21.4 19.5 17.9 14.4

Glenmark 513 570 HOLD 1.95 1,09,440 1,22,107 1,26,199 1,36,061 20,845 22,486 22,315 24,281 33.3 34.4 34.2 38.3 4.7 15.4 14.9 15.0 8.6 7.4 7.0

Natco 903 970 HOLD 2.17 20,521 22,286 29,830 40,048 6,062 7,243 13,275 21,025 24.7 30.8 57.3 91.7 54.9 36.6 29.3 15.8 26.3 21.8 10.5

Mid Cap 71,873 77,648 92,141 1,09,231 33 29 29 29 18.4 28.5 26.1 20.8 18.2 16.5 13.0

Overall - Generics 3,97,702 4,44,707 5,44,228 6,82,200 #DIV/0! 33.1 29.2 22.0 18.5 16.2 12.5

Divi's Labs 4,832 5,410 HOLD 17.3 69,694 88,733 1,11,173 1,30,465 28,599 38,253 49,185 58,204 74.9 104.4 135.3 160.4 28.9 64.5 46.3 35.7 44.1 33.0 25.1

Overall 4,26,301 4,82,960 5,93,413 7,40,404 415 492 492 492 37.8 31.7 24.1 20.2 17.5 13.5

Sales (INR mn) EBITDA (INR mn) EV/ EBITDA (x) EPS (INR) P/E (x)

Edelweiss Securities Limited

Pharmaceuticals

Edelweiss Research is also available on www.edelweissresearch.com, Bloomberg - EDEL, Thomson Reuters, and Factset 43

COMPANIES

Edelweiss Research is also available on www.edelweissresearch.com, Bloomberg - EDEL, Thomson Reuters, and Factset Edelweiss Securities Limited

KEY DATA

Rating BUY Sector relative Outperformer Price (INR) 2,260 12 month price target (INR) 2,885 Market cap (INR bn/USD bn) 196/2.6 Free float/Foreign ownership (%) 29.7/8.9

What’s Changed Target Price

Rating/Risk Rating ⚊

INVESTMENT METRICS

Best placed to clock consistent growth

We maintain the positive view on Ajanta Pharma (AJP) as it remains best placed to clock steady growth given: i) domestic business is backed by first-in-market products with a promising pipeline that would drive broad-based growth; ii) few, but profitable US launches; and iii) double-digit branded exports growth. Increased in-house production will lead to sustainable 30%+ EBITDA margin and tax

benefits will drive an FY21–24E revenue/EPS CAGR of 13%/17%.

AJP is our top pick in the mid-cap pharma space. Given ~65% branded mix, a stable domestic business and minimal price erosion, AJP deserves to trade at a premium. We value AJP at 27x FY23E EPS; retain ‘BUY’ with a TP of INR2,885 (earlier INR2,760) as we roll over to FY23E.

FINANCIALS (INR mn)

Year to March FY21A FY22E FY23E FY24E

Revenue 28,896 32,973 37,773 42,138

EBITDA 9,985 10,621 12,439 13,887

Adjusted profit 6,538 7,717 9,195 10,599

Diluted EPS (INR) 74.5 88.8 105.8 121.9

EPS growth (%) 47.0 19.1 19.2 15.3

RoAE (%) 23.4 23.6 23.8 23.2

P/E (x) 30.3 25.5 21.4 18.5

EV/EBITDA (x) 19.2 17.6 14.7 12.7

Dividend yield (%) 0.4 1.0 1.2 1.3

PRICE PERFORMANCE

Branded business provides stability; growth momentum to continue

We forecast a 13% revenue CAGR backed by structural recovery and growth

initiatives across therapies in India, and branded equity in Africa and Asia. AJP’s

branded play lends visibility and sustainability to its earnings while comparable

margins across India, Africa and Asia eliminate concentration risk. Moreover, its

growing trade generics portfolio complements its branded franchise. Also, with

deepening presence and scale-up of field force in select markets such as Iraq, the

Philippines, Uzbekistan, Africa and other geographies are expected to drive double-

digit growth. While the US will see fewer launches in FY22, market share expansion

in existing products and a few high-value launches like gChantix are likely to drive

20%+ CAGR. Given low US contribution, price erosion’s fallout would be minimal.

Capex completion to propel FCF 2.3x; return ratios impressive

AJP’s ~INR16.5bn investment over FY15–20 has potential to: i) expand sales 1.5x by

FY24; ii) bring down tax rate lower due to in-house manufacturing; and iii) lift FCF by

2.3x over FY21–24E. EBITDA margins have rebounded sharply from the FY20 trough,

and the company is confident of maintaining 30%+ margins. AJP has ~INR4bn in net

cash and enjoys superior returns ratios and asset turnover of ~30% and 2x,

respectively.

Explore:

Outlook and valuation: Attractive; maintain ‘BUY’

The company’s branded business, which accounts for ~65% of revenue, lends

visibility and sustainability to earnings growth. Despite a high FY21 base, we forecast

an FY21–24E EPS CAGR of ~17% driven by a steady operating performance across

businesses and operating leverage from new plants. Given higher branded

contribution, a stable domestic business and best-in- class returns metrics, we value

AJP at 27x FY23 EPS. Maintain ‘BUY/SO’ with a revised TP of INR2,885 (INR2,760

earlier) as we roll over the valuation to FY23E EPS. Key risks: delay in product

approvals, USFDA risk, NLEM and currency.

10

15

20

25

30

Sales Growth(%)

EPS Growth(%)

RoE(%)

PE(x)

Pharmaceuticals AJP IN EQUITY

38,000

42,600

47,200

51,800

56,400

61,000

1,500

1,680

1,860

2,040

2,220

2,400

Oct-20 Jan-21 Apr-21 Jul-21 Oct-21

AJP IN EQUITY Sensex

India Equity Research Pharmaceuticals October 4, 2021

AJANTA PHARMA COMPANY UPDATE

Kunal Randeria Aashita Jain +91 (22) 6620 3040 +91 (22) 6623 3463 [email protected] [email protected]

Corporate access

Financial model Podcast

Video

Edelweiss Securities Limited

AJANTA PHARMA

Edelweiss Research is also available on www.edelweissresearch.com, Bloomberg - EDEL, Thomson Reuters, and Factset 45

Financial Statements

Income Statement (INR mn) Year to March FY21A FY22E FY23E FY24E

Total operating income 28,896 32,973 37,773 42,138

Gross profit 22,446 25,060 28,783 32,025

Employee costs 5,483 6,195 6,939 7,771

R&D cost 1,390 1,978 2,266 2,528

Other expenses 5,588 6,265 7,139 7,838

EBITDA 9,985 10,621 12,439 13,887

Depreciation 1,161 1,250 1,329 1,407

Less: Interest expense 83 74 67 67

Add: Other income 260 597 746 1,176

Profit before tax 9,001 9,894 11,789 13,589

Prov for tax 2,463 2,177 2,594 2,990

Less: Exceptional item 0 0 0 0

Reported profit 6,538 7,717 9,195 10,599

Adjusted profit 6,538 7,717 9,195 10,599

Diluted shares o/s 88 87 87 87

Adjusted diluted EPS 74.5 88.8 105.8 121.9

DPS (INR) 9.5 22.2 26.4 30.5

Tax rate (%) 27.4 22.0 22.0 22.0

Important Ratios (%) Year to March FY21A FY22E FY23E FY24E

Gross margin 77.7 76.0 76.2 76.0

R&D as a % of sales 4.8 6.0 6.0 6.0

Net Debt/EBITDA (0.4) (0.8) (1.0) (1.4)

EBITDA margin (%) 34.6 32.2 32.9 33.0

Net profit margin (%) 22.6 23.4 24.3 25.2

Revenue growth (% YoY) 11.2 14.3 14.8 11.7

EBITDA growth (% YoY) 46.1 6.4 17.1 11.6

Adj. profit growth (%) 45.8 18.0 19.2 15.3

Assumptions (%) Year to March FY21A FY22E FY23E FY24E

GDP (YoY %) (6.0) 7.0 6.0 0

Repo rate (%) 3.5 3.5 4.0 4.0

USD/INR (average) 74.0 73.9 73.0 72.0

India growth (%) 5.7 16.8 14.1 10.4

US generics (USD mn) 86.1 105.9 137.6 165.2

Asia sales growth (%) 5.6 12.0 10.0 10.0

Africa branded sales

growth (%)

15.5 10.0 10.0 10.0

Capex (USD mn) 38.2 27.1 20.5 20.8

Valuation Metrics Year to March FY21A FY22E FY23E FY24E

Diluted P/E (x) 30.3 25.5 21.4 18.5

Price/BV (x) 6.6 5.6 4.7 4.0

EV/EBITDA (x) 19.2 17.6 14.7 12.7

Dividend yield (%) 0.4 1.0 1.2 1.3

Source: Company and Edelweiss estimates

Balance Sheet (INR mn) Year to March FY21A FY22E FY23E FY24E

Share capital 174 174 174 174

Reserves 29,782 35,223 41,706 49,178

Shareholders funds 29,956 35,397 41,879 49,352

Minority interest 0 0 0 0

Borrowings 16 10 10 10

Trade payables 3,739 3,416 4,712 4,431

Other liabs & prov 3,178 3,178 3,178 3,178

Total liabilities 37,296 42,408 50,187 57,379

Net block 15,322 16,072 16,244 16,336

Intangible assets 0 0 0 0

Capital WIP 1,082 1,082 1,082 1,082

Total fixed assets 16,404 17,154 17,326 17,418

Non current inv 0 0 0 0

Cash/cash equivalent 3,853 8,284 13,065 19,064

Sundry debtors 7,384 8,334 9,673 10,415

Loans & advances 0 0 0 0

Other assets 9,049 8,029 9,517 9,875

Total assets 37,296 42,408 50,187 57,379

Free Cash Flow (INR mn) Year to March FY21A FY22E FY23E FY24E

Reported profit 6,538 7,717 9,195 10,599

Add: Depreciation 1,161 1,250 1,329 1,407

Interest (net of tax) 83 74 67 67

Others (90) 0 0 0

Less: Changes in WC (2,088) (253) (1,531) (1,380)

Operating cash flow 5,763 8,789 9,060 10,693

Less: Capex (1,699) (2,000) (1,500) (1,500)

Free cash flow 4,064 6,789 7,560 9,193

Key Ratios Year to March FY21A FY22E FY23E FY24E

RoE (%) 23.4 23.6 23.8 23.2

RoCE (%) 32.2 30.5 30.7 29.9

Inventory days 357 330 300 300

Receivable days 96 87 87 87

Payable days 208 165 165 165

Working cap (% sales) 34.9 31.3 31.4 31.4

Gross debt/equity (x) 0 0 0 0

Net debt/equity (x) (0.1) (0.2) (0.3) (0.4)

Interest coverage (x) 106.7 125.9 165.9 186.3

Valuation Drivers Year to March FY21A FY22E FY23E FY24E

EPS growth (%) 47.0 19.1 19.2 15.3

RoE (%) 23.4 23.6 23.8 23.2

EBITDA growth (%) 46.1 6.4 17.1 11.6

Payout ratio (%) 12.7 25.0 25.0 25.0

AJANTA PHARMA

Edelweiss Securities Limited

46 Edelweiss Research is also available on www.edelweissresearch.com, Bloomberg - EDEL, Thomson Reuters, and Factset

Company Description

Ajanta Pharma, a Mumbai-based mid-sized specialty pharma company, is a play on

branded generics with strong focus on branded formulation business in India and

other emerging markets. India contributes ~30% to overall revenue with focus on

ophthalmology, dermatology, pain management and cardiology segments. In Asia

and Africa (~60% of overall revenue), the company has a strong branded presence

with front ends in markets where it is present and also participates in the anti-

malaria tender business in Africa. The company has also invested in the US market,

which is expected to generate meaningful revenue over the next few years.

Management has ramped up filings and has several pending approvals. Revenue,

EBITDA and PAT have posted strong growth in recent years driven by higher focus

on branded formulation and vertical integration in API/formulation.

Investment Theme

AJP has a de-risked business model with presence across branded markets in India,

Africa & Asia and generics in the US. The company’s branded business, which

accounts for 75% of revenue, imparts visibility and sustainability to earnings growth.

Over FY20-23, we estimate 20% earnings CAGR and ~300bps margin expansion

spearheaded by India and the US.

Key Risks

Delay in approval/ regulatory risks.

Currency risk.

NLEM risk

Edelweiss Securities Limited

AJANTA PHARMA

Edelweiss Research is also available on www.edelweissresearch.com, Bloomberg - EDEL, Thomson Reuters, and Factset 47

Additional Data

Management

Chairman Mr. Mannanlal B. Agrawal

Vice Chairman Mr. Madhusudan B. Agrawal

Managing Director

Mr. Yogesh M. Agrawal

Joint Managing Director

Mr. Rajesh M. Agrawal

Auditor BSR & Co. LLP

Holdings – Top 10* % Holding % Holding

Mirae Asset 3.63 Blackrock 0.49

UTI 3.43 Tata AMC 0.48

SBI Funds 1.26 ICICI Pru AMC 0.31

Vanguard 0.82 Nippon Life AMC 0.30

Dimesional Fund 0.52 Motilal AMC 0.26

*Latest public data

Recent Company Research Date Title Price Reco

16-Aug-21 In cruise mode; Company Update 2394.7 Buy

29-Jul-21 Best placed to clock consistent growth; Result Update

2394.7 Buy

30-Apr-21 Growing from strength to strength; Result Update

1842 Buy

Recent Sector Research Date Name of Co./Sector Title

17-Sep-21 Biocon Serum deal: Execution awaited; Company Update

16-Aug-21 Glenmark Pharma. Value unlocking yet to gain traction; Result Update

13-Aug-21 Aurobindo Pharma Unsurprising miss; Result Update

Rating Interpretation

Source: Bloomberg, Edelweiss research

Daily Volume

Source: Bloomberg

Rating Distribution: Edelweiss Research Coverage

Buy Hold Reduce Total

Rating Distribution* 177 54 19 251

>50bn >10bn and <50bn <10bn Total

Market Cap (INR) 226 41 3 270

*1 stocks under review

Rating Rationale

Rating Expected absolute returns over 12 months

Buy: >15%

Hold: >15% and <-5%

Reduce: <-5%

TP1,880

TP2,040

875

1180

1485

1790

2095

2400

Oct-18 Apr-19 Oct-19 Apr-20 Oct-20 Apr-21

(IN

R)

AJP IN EQUITY Buy Hold Reduce0

2

4

6

8

10

Oct-18 Apr-19 Oct-19 Apr-20 Oct-20 Apr-21

(Mn

)

Edelweiss Research is also available on www.edelweissresearch.com, Bloomberg - EDEL, Thomson Reuters, and Factset Edelweiss Securities Limited

KEY DATA

Rating BUY Sector relative Outperformer Price (INR) 3,990 12 month price target (INR) 4,600 Market cap (INR bn/USD bn) 477/6.4 Free float/Foreign ownership (%) 41.5/4.5

What’s Changed Target Price

Rating/Risk Rating ⚊

INVESTMENT METRICS

Best-in-class brands to drive growth

We remain positive on Alkem (ALKM) based on: i) its strong brand equity, consistent market share gains and presence in fast-growing sub-therapies in India; ii) volume-driven growth, which is sustainable; iii) potential mid-teens CAGR and improved launches in the US driving profitability; and iv) uptick in margin for incremental business considering salesforce expansion is largely over.

Alkem remains one of our top pharma mid-cap space. We reckon growth led by sustained operating leverage and thus model in revenue/PAT CAGR of 14%/13% over FY21–24E. Maintain ‘BUY’ with a TP of INR4,600 (earlier INR4,060) as we roll over to FY23E EPS and raise the target to 27x due to stronger-than-expected sustainable recovery.

FINANCIALS (INR mn)

Year to March FY21A FY22E FY23E FY24E

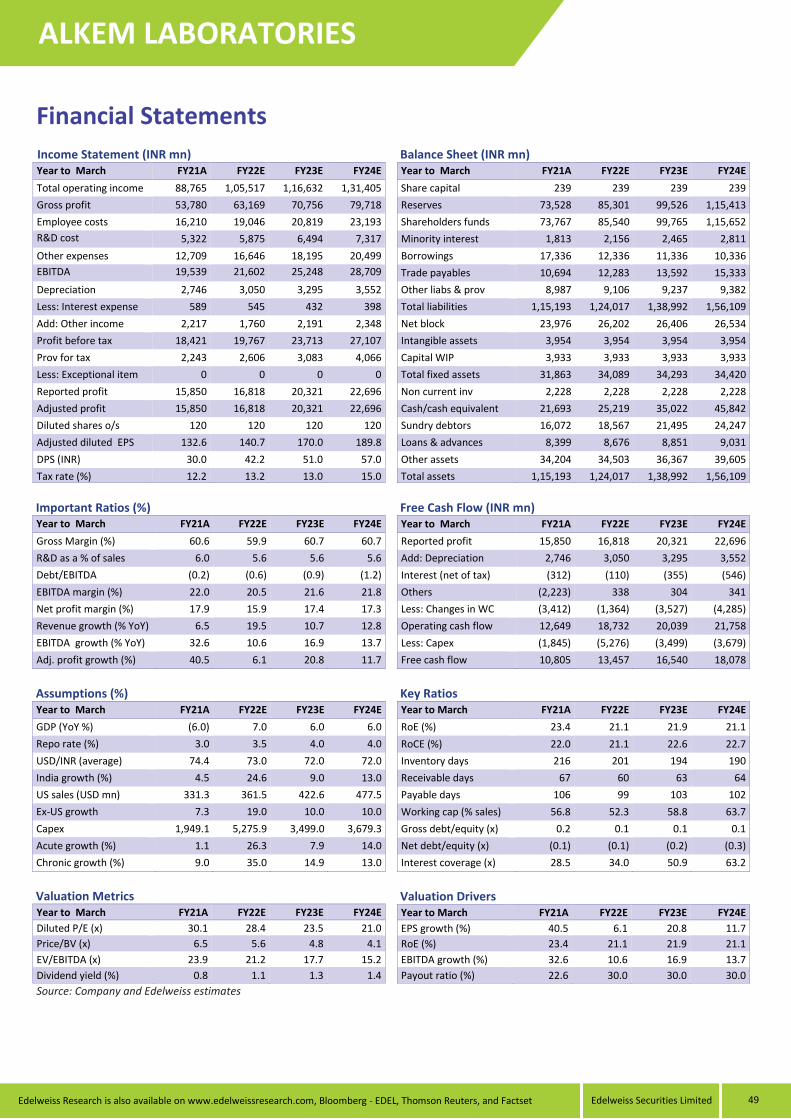
Revenue 88,765 1,05,517 1,16,632 1,31,405

EBITDA 19,539 21,602 25,248 28,709

Adjusted profit 15,850 16,818 20,321 22,696

Diluted EPS (INR) 132.6 140.7 170.0 189.8

EPS growth (%) 40.5 6.1 20.8 11.7

RoAE (%) 23.4 21.1 21.9 21.1

P/E (x) 30.1 28.4 23.5 21.0

EV/EBITDA (x) 23.9 21.2 17.7 15.2

Dividend yield (%) 0.8 1.1 1.3 1.4

PRICE PERFORMANCE

Domestic remains on solid footing

Despite bearing the brunt of the first covid wave, Alkem has posted the sharpest

recovery, which could translate to a 24% spurt in domestic revenue in FY22. The

resilience underscores the brand equity of its domestic franchise and long-standing

relationships in the trade generics business. Even on high base, ALKM would clock

an 11% CAGR over FY22–24E since its therapies, other than anti-infective, are gaining

traction. With a sales force of ~10,500 for large sub-therapies, the company’s ability

to convert patients to own brands/therapies, not to mention pursuit of niche but

untapped therapies, should help it sustain above-industry growth.

US: Improving launch trajectory to drive profitable growth

The US business has been bolstered by limited competition launches such as gApriso

and gDuexis, and could witness FY23 onward other mesalamine launches along with

gPradaxa. In fact, ALKM’s US business has ramped up 3x over the last seven years;

we forecast a mid-teen revenue CAGR for FY21–24E driven by 12–15 launches in

FY22 and more than ten FY23 onwards. Unlike past, we expect its US profitability to

improve as sales grow on the back of improvement in launch quality. This would

improve margins from high single-digit to 14% by FY23.

Explore:

Outlook and valuation: Steady growth ahead; maintain ‘BUY’

Despite an exceptional FY21, Alkem can still post a 13% earnings CAGR through FY24

driven by a 14% revenue CAGR. The sharp recovery in its domestic business testifies

to its strong brand equity. A net-cash balance sheet, consistent FCF (1.7x over FY21)

and steady returns ratios instil additional comfort. We value Alkem at 27x FY23E EPS

(10% discount to Torrent) due to stronger-than-expected recovery, which is

sustainable in our view. This yields a fair value of INR4,600 (earlier INR4,060). Retain

‘BUY/SO’.

5

10

15

20

25

30

Sales Growth(%)

EPS Growth(%)

RoE(%)

PE(x)

Pharmaceuticals ALKEM IN EQUITY

38,000

42,600

47,200

51,800

56,400

61,000

2,550

2,845

3,140

3,435

3,730

4,025

Oct-20 Jan-21 Apr-21 Jul-21 Oct-21

ALKEM IN EQUITY Sensex

India Equity Research Pharmaceuticals October 4, 2021

ALKEM LABORATORIES COMPANY UPDATE

Kunal Randeria Aashita Jain +91 (22) 6620 3040 +91 (22) 6623 3463 [email protected] [email protected]

Corporate access

Financial model Podcast

Video

Edelweiss Securities Limited

ALKEM LABORATORIES

Edelweiss Research is also available on www.edelweissresearch.com, Bloomberg - EDEL, Thomson Reuters, and Factset 49

Financial Statements

Income Statement (INR mn) Year to March FY21A FY22E FY23E FY24E

Total operating income 88,765 1,05,517 1,16,632 1,31,405

Gross profit 53,780 63,169 70,756 79,718

Employee costs 16,210 19,046 20,819 23,193

R&D cost 5,322 5,875 6,494 7,317

Other expenses 12,709 16,646 18,195 20,499

EBITDA 19,539 21,602 25,248 28,709

Depreciation 2,746 3,050 3,295 3,552

Less: Interest expense 589 545 432 398

Add: Other income 2,217 1,760 2,191 2,348

Profit before tax 18,421 19,767 23,713 27,107

Prov for tax 2,243 2,606 3,083 4,066

Less: Exceptional item 0 0 0 0

Reported profit 15,850 16,818 20,321 22,696

Adjusted profit 15,850 16,818 20,321 22,696

Diluted shares o/s 120 120 120 120

Adjusted diluted EPS 132.6 140.7 170.0 189.8

DPS (INR) 30.0 42.2 51.0 57.0

Tax rate (%) 12.2 13.2 13.0 15.0

Important Ratios (%) Year to March FY21A FY22E FY23E FY24E

Gross Margin (%) 60.6 59.9 60.7 60.7

R&D as a % of sales 6.0 5.6 5.6 5.6

Debt/EBITDA (0.2) (0.6) (0.9) (1.2)

EBITDA margin (%) 22.0 20.5 21.6 21.8

Net profit margin (%) 17.9 15.9 17.4 17.3

Revenue growth (% YoY) 6.5 19.5 10.7 12.8

EBITDA growth (% YoY) 32.6 10.6 16.9 13.7

Adj. profit growth (%) 40.5 6.1 20.8 11.7

Assumptions (%) Year to March FY21A FY22E FY23E FY24E

GDP (YoY %) (6.0) 7.0 6.0 6.0

Repo rate (%) 3.0 3.5 4.0 4.0

USD/INR (average) 74.4 73.0 72.0 72.0

India growth (%) 4.5 24.6 9.0 13.0

US sales (USD mn) 331.3 361.5 422.6 477.5

Ex-US growth 7.3 19.0 10.0 10.0

Capex 1,949.1 5,275.9 3,499.0 3,679.3

Acute growth (%) 1.1 26.3 7.9 14.0

Chronic growth (%) 9.0 35.0 14.9 13.0

Valuation Metrics Year to March FY21A FY22E FY23E FY24E

Diluted P/E (x) 30.1 28.4 23.5 21.0

Price/BV (x) 6.5 5.6 4.8 4.1

EV/EBITDA (x) 23.9 21.2 17.7 15.2

Dividend yield (%) 0.8 1.1 1.3 1.4

Source: Company and Edelweiss estimates

Balance Sheet (INR mn) Year to March FY21A FY22E FY23E FY24E

Share capital 239 239 239 239

Reserves 73,528 85,301 99,526 1,15,413

Shareholders funds 73,767 85,540 99,765 1,15,652

Minority interest 1,813 2,156 2,465 2,811

Borrowings 17,336 12,336 11,336 10,336

Trade payables 10,694 12,283 13,592 15,333

Other liabs & prov 8,987 9,106 9,237 9,382

Total liabilities 1,15,193 1,24,017 1,38,992 1,56,109

Net block 23,976 26,202 26,406 26,534

Intangible assets 3,954 3,954 3,954 3,954

Capital WIP 3,933 3,933 3,933 3,933

Total fixed assets 31,863 34,089 34,293 34,420

Non current inv 2,228 2,228 2,228 2,228

Cash/cash equivalent 21,693 25,219 35,022 45,842

Sundry debtors 16,072 18,567 21,495 24,247

Loans & advances 8,399 8,676 8,851 9,031

Other assets 34,204 34,503 36,367 39,605

Total assets 1,15,193 1,24,017 1,38,992 1,56,109

Free Cash Flow (INR mn) Year to March FY21A FY22E FY23E FY24E

Reported profit 15,850 16,818 20,321 22,696

Add: Depreciation 2,746 3,050 3,295 3,552

Interest (net of tax) (312) (110) (355) (546)

Others (2,223) 338 304 341

Less: Changes in WC (3,412) (1,364) (3,527) (4,285)

Operating cash flow 12,649 18,732 20,039 21,758

Less: Capex (1,845) (5,276) (3,499) (3,679)

Free cash flow 10,805 13,457 16,540 18,078

Key Ratios Year to March FY21A FY22E FY23E FY24E

RoE (%) 23.4 21.1 21.9 21.1

RoCE (%) 22.0 21.1 22.6 22.7

Inventory days 216 201 194 190

Receivable days 67 60 63 64

Payable days 106 99 103 102

Working cap (% sales) 56.8 52.3 58.8 63.7

Gross debt/equity (x) 0.2 0.1 0.1 0.1

Net debt/equity (x) (0.1) (0.1) (0.2) (0.3)

Interest coverage (x) 28.5 34.0 50.9 63.2

Valuation Drivers Year to March FY21A FY22E FY23E FY24E

EPS growth (%) 40.5 6.1 20.8 11.7

RoE (%) 23.4 21.1 21.9 21.1

EBITDA growth (%) 32.6 10.6 16.9 13.7

Payout ratio (%) 22.6 30.0 30.0 30.0

ALKEM LABORATORIES

Edelweiss Securities Limited

50 Edelweiss Research is also available on www.edelweissresearch.com, Bloomberg - EDEL, Thomson Reuters, and Factset

Company Description

Alkem is the seventh-largest branded pharma company in India and among the

leaders in its major therapy areas—anti-infectives, gastro-intestinal (GI), vitamins

and minerals (VMN), and pain; they account for 75% of its branded sales. For more

than 15 years, the company has defended the number 1 position in anti-infectives

(~38% of domestic sales; 10% market share) by successfully tapping into the largest

sub-therapy area, i.e. anti-bacterial. At the same time, GI and VMN have injected

growth in the company. The company has slowly diversified its revenue base in

chronic/semi-chronic therapies such as Neuro/CNS, derma, cardiac and anti-

diabetic.

Investment Theme

Despite an acute-heavy portfolio (~58%) and ~26% of portfolio under NLEM, Alkem

has been an outperformer in the domestic market, notching up an industry leading

CAGR of 15% over FY15–20. Alkem has consistently cherry-picked high-growth

molecules within a therapy and expanded the market, and is among market leaders

in most formulation groups it’s present in. Moreover, by sheer strength of its sales

force, Alkem’s brands have outperformed rivals, which has led to consistent market

share gain. The chronic segment is likely to continue to outperform, with Alkem

having cracked the CNS space, and would expand at a CAGR of ~20% over FY21–24E.

Despite being a late entrant in several molecules, Alkem has garnered industry-

leading market shares on the back of its strong supply chain and high compliance.

We expect US to grow in low-teens from FY22 on the back of 10–12 annual launches.

We forecast profitability would rise along with margin, which are likely to expand

from high single-digit to 14% by FY23

Key risks

Weak anti-infective season critical to growth

Slowdown in ANDA approvals due to regulatory actions

Edelweiss Securities Limited

ALKEM LABORATORIES

Edelweiss Research is also available on www.edelweissresearch.com, Bloomberg - EDEL, Thomson Reuters, and Factset 51

Additional Data

Management

Chairman Basudeo Singh

MD Sandeep Singh

Joint MD Dhananjay Kumar Singh

CFO Rajesh Dubey

Auditor B S R & Co LLP

Holdings – Top 10* % Holding % Holding

LIC 3.97 Vanguard 0.73

ICICI Pru Amc 2.00 Kotak Mahindra 0.53

DSP 1.46 L&T 0.51

SBI Funds 1.32 Norges 0.35

Motilal Oswal 0.78 Pictet 0.33

*Latest public data

Recent Company Research Date Title Price Reco

06-Aug-21 …And the juggernaut rolls on; Result Update

3472.05 Buy

25-May-21 Modest Q4; growth story unaffected; Result Update

2905 Buy

24-Mar-21 A dose of steady growth; Initiating Coverage

2574.8 Buy

Recent Sector Research Date Name of Co./Sector Title

17-Sep-21 Biocon Serum deal: Execution awaited; Company Update

16-Aug-21 Ajanta Pharma In cruise mode; Company Update

16-Aug-21 Glenmark Pharma. Value unlocking yet to gain traction; Result Update

Rating Interpretation

Source: Bloomberg, Edelweiss research

Daily Volume

Source: Bloomberg

Rating Distribution: Edelweiss Research Coverage

Buy Hold Reduce Total

Rating Distribution* 177 54 19 251

>50bn >10bn and <50bn <10bn Total

Market Cap (INR) 226 41 3 270

*1 stocks under review

Rating Rationale

Rating Expected absolute returns over 12 months

Buy: >15%

Hold: >15% and <-5%

Reduce: <-5%

TP3,315

1650

2125

2600

3075

3550

4025

Oct-18 Apr-19 Oct-19 Apr-20 Oct-20 Apr-21

(IN

R)

ALKEM IN EQUITY Buy Hold Reduce0

2

4

6

8

10

Oct-18 Apr-19 Oct-19 Apr-20 Oct-20 Apr-21

(Mn

)

Edelweiss Research is also available on www.edelweissresearch.com, Bloomberg - EDEL, Thomson Reuters, and Factset Edelweiss Securities Limited

KEY DATA

Rating BUY Sector relative Outperformer Price (INR) 717 12 month price target (INR) 990 Market cap (INR bn/USD bn) 420/5.7 Free float/Foreign ownership (%) 48.2/23.7

What’s Changed Target Price

Rating/Risk Rating ⚊

INVESTMENT METRICS

Favourable risk-reward

We remain positive on Aurobindo Pharma (ARBP) as: i) barring near-term pressure, US pipeline looks solid; ii) injectables expansion is margin-accretive; iii) biosimilar filings would aid growth post-FY23; iv) gRevlimid adds to FY23–25E revenue stability; and v) EU pipeline of 250-plus launches can drive steady 9–10% growth.

ARBP is on the cusp of filing biosimilars, nasals, inhalers, transdermals, and depot injections. The prospects are bright, but entail high R&D outlay and execution risks. We argue our 16x FY23E EPS target captures the risk. Retain ‘BUY’ with a TP of INR990 (up from INR970) based on 16x core FY23E EPS and INR25/share for gRevlimid.

FINANCIALS (INR mn)

Year to March FY21A FY22E FY23E FY24E

Revenue 2,47,747 2,48,204 2,66,774 3,00,258

EBITDA 53,335 53,161 59,474 73,509

Adjusted profit 32,250 33,529 36,677 46,293

Diluted EPS (INR) 55.0 57.2 62.6 79.0

EPS growth (%) 12.6 4.0 9.4 26.2

RoAE (%) 27.5 14.3 13.7 15.1

P/E (x) 13.0 12.5 11.5 9.1

EV/EBITDA (x) 7.8 7.9 6.7 5.0

Dividend yield (%) 0.6 0.5 0.5 0.7

PRICE PERFORMANCE

US pipeline solid; injectables a clear priority

Near-term pressure from ertapenem competition and price erosion is likely to be

offset by a pipeline of ~170 pending ANDAs, 50 annual launches, gRevlimid and

injectable expansion. ARBP has a clear focus on growing the injectables business

from USD395mn at present to USD650–700mn over the next three years. While we

await the unveiling of depot injections, inhalers and transdermals, we see limited

risk to our mid-single-digit US growth estimates given low profit concentration.

Biosimilar and vaccine could provide potential upside

We are enthused by ARBP’s biosimilar investments. Two of the six biosimilars are

likely to be filed in the EU and the US before end-FY22. Biosimilars can add

INR60/share to fair value. We have not factored in the vaccine (covid and

pneumococcal) opportunity yet, implying further upside to our numbers.

Pushing all areas to improve Europe profitability

EU is likely to show margin improvement driven by: i) more products sourced from

low-cost base India; ii) ertapenem launch and expansion of penem block; iii) a

pipeline of 250-plus products including complex injectables for hospital setting that

will help offset price pressure; iv) 2 biosimilar filings; and v) Eugia oncology launches.

Explore:

Outlook and valuation: Risk-reward turning favourable; retain ‘BUY’

ARBP’s business is steady and with low-profit concentration. The biosimilars and

injectables expansion provides an additional push to high US base. gRevlimid

settlement offers cushion for its complex generics business to deliver. Our INR990

target price (up from INR970) is based on 16x FY23E core EPS and INR25/share from

gRevlimid. Maintain ‘BUY/SO’.

0

10

20

30

Sales Growth(%)

EPS Growth(%)

RoE(%)

PE(x)

Pharmaceuticals ARBP IN Equity

38,000

42,600

47,200

51,800

56,400

61,000

675

750

825

900

975

1,050

Oct-20 Jan-21 Apr-21 Jul-21 Oct-21

ARBP IN Equity Sensex

India Equity Research Pharmaceuticals October 4, 2021

AUROBINDO PHARMA COMPANY UPDATE

Kunal Randeria Aashita Jain +91 (22) 6620 3040 +91 (22) 6623 3463 [email protected] [email protected]

Corporate access

Financial model Podcast

Video

Edelweiss Securities Limited

AUROBINDO PHARMA

Edelweiss Research is also available on www.edelweissresearch.com, Bloomberg - EDEL, Thomson Reuters, and Factset 53

Financial Statements

Income Statement (INR mn) Year to March FY21A FY22E FY23E FY24E

Total operating income 2,47,747 2,48,204 2,66,774 3,00,258

Gross profit 1,48,722 1,47,681 1,61,398 1,85,409

Employee costs 35,350 38,178 41,767 45,693

R&D cost 15,095 14,892 16,006 18,015

Other expenses 44,942 41,450 44,151 48,191

EBITDA 53,335 53,161 59,474 73,509

Depreciation 10,554 11,536 13,045 14,800

Less: Interest expense 745 626 556 486

Add: Other income 2,773 3,099 2,379 2,682

Profit before tax 44,255 44,098 48,252 60,905

Prov for tax 20,098 10,583 11,581 14,617

Less: Exceptional item 28,146 0 0 0

Reported profit 53,349 33,529 36,677 46,293

Adjusted profit 32,250 33,529 36,677 46,293

Diluted shares o/s 586 586 586 586

Adjusted diluted EPS 55.0 57.2 62.6 79.0

DPS (INR) 4.0 3.4 3.8 4.7

Tax rate (%) 45.4 24.0 24.0 24.0

Important Ratios (%) Year to March FY21A FY22E FY23E FY24E

Gross margin 60.0 59.5 60.5 61.8

R&D as a % of sales 6.1 6.0 6.0 6.0

Net Debt/EBITDA (0.1) (0.1) (0.3) (0.7)

EBITDA margin (%) 21.5 21.4 22.3 24.5

Net profit margin (%) 13.0 13.5 13.7 15.4

Revenue growth (% YoY) 7.3 0.2 7.5 12.6

EBITDA growth (% YoY) 10.5 (0.3) 11.9 23.6

Adj. profit growth (%) 12.7 4.0 9.4 26.2

Assumptions (%) Year to March FY21A FY22E FY23E FY24E

GDP (YoY %) 5.0 7.0 6.0 6.0

Repo rate (%) 4.0 3.5 4.0 4.0

USD/INR (average) 74.0 73.0 72.0 72.0

US generics (USD mn) 1,666.0 1,548.4 1,684.4 1,998.9

API (USD mn) 417.0 443.4 485.4 516.3

Europe growth (%) (4.9) 11.0 10.0 8.0

ROW growth (%) 6.1 10.0 10.0 10.0

ARV growth (%) 48.8 (5.0) 8.0 5.0

Capex (USD mn) 246.7 479.7 388.9 0

Valuation Metrics Year to March FY21A FY22E FY23E FY24E

Diluted P/E (x) 13.0 12.5 11.5 9.1

Price/BV (x) 1.9 1.7 1.5 1.3

EV/EBITDA (x) 7.8 7.9 6.7 5.0

Dividend yield (%) 0.6 0.5 0.5 0.7

Source: Company and Edelweiss estimates

Balance Sheet (INR mn) Year to March FY21A FY22E FY23E FY24E

Share capital 586 586 586 586

Reserves 2,18,713 2,50,049 2,84,305 3,27,543

Shareholders funds 2,19,299 2,50,635 2,84,891 3,28,129

Minority interest (9) (24) (29) (34)

Borrowings 49,711 44,711 39,711 34,711

Trade payables 27,947 26,279 27,547 28,319

Other liabs & prov 31,896 35,003 37,531 42,088

Total liabilities 3,34,013 3,61,773 3,94,820 4,38,382

Net block 89,447 1,17,611 1,32,567 1,37,767

Intangible assets 4,289 4,289 4,289 4,289

Capital WIP 30,615 30,615 30,615 30,615

Total fixed assets 1,24,351 1,52,515 1,67,471 1,72,671

Non current inv 4,312 4,312 4,312 4,312

Cash/cash equivalent 56,341 47,577 59,591 84,056

Sundry debtors 35,033 46,368 49,838 53,471

Loans & advances 216 216 216 216

Other assets 1,06,718 1,03,742 1,06,351 1,16,615

Total assets 3,34,013 3,61,773 3,94,820 4,38,382

Free Cash Flow (INR mn) Year to March FY21A FY22E FY23E FY24E

Reported profit 53,349 33,529 36,677 46,293

Add: Depreciation 10,554 11,536 13,045 14,800

Interest (net of tax) 745 626 556 486

Others (20,691) 0 0 0

Less: Changes in WC (10,668) (6,921) (2,282) (8,568)

Operating cash flow 33,289 38,770 47,995 53,011

Less: Capex 10,741 (35,500) (28,000) (20,000)

Free cash flow 44,030 3,270 19,995 33,011

Key Ratios Year to March FY21A FY22E FY23E FY24E

RoE (%) 27.5 14.3 13.7 15.1

RoCE (%) 18.5 15.9 15.7 17.9

Inventory days 308 319 298 288

Receivable days 58 60 66 63

Payable days 98 98 93 89

Working cap (% sales) 33.6 36.4 34.7 33.7

Gross debt/equity (x) 0.2 0.2 0.1 0.1

Net debt/equity (x) 0 0 (0.1) (0.2)

Interest coverage (x) 57.4 66.5 83.5 120.8

Valuation Drivers Year to March FY21A FY22E FY23E FY24E

EPS growth (%) 12.6 4.0 9.4 26.2

RoE (%) 27.5 14.3 13.7 15.1

EBITDA growth (%) 10.5 (0.3) 11.9 23.6

Payout ratio (%) 4.4 6.0 6.0 6.0

AUROBINDO PHARMA

Edelweiss Securities Limited

54 Edelweiss Research is also available on www.edelweissresearch.com, Bloomberg - EDEL, Thomson Reuters, and Factset

Company Description

Aurobindo Pharma (ARBP), unlike other major Indian pharma companies, is a pure

generic player with export focus that has achieved scale primarily through

acquisitions. In its drive to grow via consolidation and gain scale, company has been

the most aggressive and also the most successful as company always focused on

value. Its aggressive inorganic strategy is much like its global peers, and its strength

lies in its execution. Company’s future investments are mainly in injectables and now

it has started investing meaningfully in biosimilars.

Investment Theme

ARBP has followed a strategy of acquiring portfolios & technologies and bolstering

offerings. It is on the cusp of filing transdermals, biosimilars, nasals, inhalers and

depot injections. While promising, it also involves high R&D investments that are

likely to push R&D to 6% of sales and also increase execution risks vis-a-vis generics.

However, gRevlimid settlement offers cushion to the high risk business given that

this opportunity will be there for at least 3 years. In the medium term, pipeline of

170 pending ANDAs, its 50 annual launches and injectable capacity expansion should

translate to mid-to-high single-digit growth. API expansion, the PLI scheme and

contract manufacturing opportunity in vaccines promise long-term growth.

Key Risks

US pricing pressure

Slowdown in ANDA approvals and USFDA related regulatory risks are part of the

generics business

Currency fluctuation

Edelweiss Securities Limited

AUROBINDO PHARMA

Edelweiss Research is also available on www.edelweissresearch.com, Bloomberg - EDEL, Thomson Reuters, and Factset 55

Additional Data

Management

Chairman Mr. K Ragunathan

Vice Chairman Mr. K Nithyananda Reddy

CFO S. Subramanian

Managing Director

N. Govindarajan

Auditor B S R & Associates LLP

Holdings – Top 10* % Holding % Holding

LIC 3.46 Nippon AMC 1.16

HDFC AMC 3.15 SBI Funds 0.84

vanguard 1.57 Ninety One UK 0.77

Blackrock 1.55 ICICI Pru Life 0.64

BNP 1.22 UTI AMC 0.57

*Latest public data

Recent Company Research Date Title Price Reco

13-Aug-21 Unsurprising miss; Result Update 761.3 Buy

31-May-21 Soft volumes; near-term growth priced in; Result Update

997.95 Hold

11-Feb-21 Steady growth baked in; Result Update

935.2 Hold

Recent Sector Research Date Name of Co./Sector Title

17-Sep-21 Biocon Serum deal: Execution awaited; Company Update

16-Aug-21 Ajanta Pharma In cruise mode; Company Update

16-Aug-21 Glenmark Pharma. Value unlocking yet to gain traction; Result Update

Rating Interpretation

Source: Bloomberg, Edelweiss research

Daily Volume

Source: Bloomberg

Rating Distribution: Edelweiss Research Coverage

Buy Hold Reduce Total

Rating Distribution* 177 54 19 251

>50bn >10bn and <50bn <10bn Total

Market Cap (INR) 226 41 3 270

*1 stocks under review

Rating Rationale

Rating Expected absolute returns over 12 months

Buy: >15%

Hold: >15% and <-5%

Reduce: <-5%

TP970

TP780

TP500

TP975

275

430

585

740

895

1050

Oct-18 Apr-19 Oct-19 Apr-20 Oct-20 Apr-21

(IN

R)

ARBP IN Equity Buy Hold Reduce0

8

16

24

32

40

Oct-18 Apr-19 Oct-19 Apr-20 Oct-20 Apr-21

(Mn

)

Edelweiss Research is also available on www.edelweissresearch.com, Bloomberg - EDEL, Thomson Reuters, and Factset Edelweiss Securities Limited

KEY DATA

Rating REDUCE Sector relative Underperformer Price (INR) 365 12 month price target (INR) 335 Market cap (INR bn/USD bn) 439/5.9 Free float/Foreign ownership (%) 39.4/15.9

What’s Changed Target Price

Rating/Risk Rating ⚊

INVESTMENT METRICS

Biosimilar uptick blurry

We believe Biocon (BIOS) may underperform owing to: i) sub-par execution in biosimilars in the US and increased competition; and ii) surging R&D and high capex intensity. While interchangeability designation for its insulin products is welcome, we believe our 20% market share captures upside potential given innovator is likely to adopt different strategies to retain share. And given limited data

around vaccine type and strategy, we remain cautious on the vaccine deal with Serum Institute.

Meanwhile, we await evidence of a sustained uptick in market share and revenue. Our SoTP yield a DCF-based value of INR143/share for biosimilar. Maintain ‘REDUCE/SU’ with a target price of INR335.

FINANCIALS (INR mn)

Year to March FY21A FY22E FY23E FY24E

Revenue 71,058 83,183 1,13,237 1,41,945

EBITDA 16,526 22,350 32,557 44,018

Adjusted profit 7,349 8,433 15,687 22,668

Diluted EPS (INR) 6.1 7.0 13.1 18.9

EPS growth (%) 5.4 14.8 86.0 44.5

RoAE (%) 10.5 10.5 17.2 20.9

P/E (x) 59.7 52.0 28.0 19.3

EV/EBITDA (x) 27.2 20.2 13.7 9.8

Dividend yield (%) 0 0.2 0.3 0.5

PRICE PERFORMANCE

Biosimilar faces operational challenges; execution risk persists

While the biosimilar opportunity is attractive, faster-than-expected price erosion

and lower-than-expected biosimilar penetration, especially in the US, have limited

commercial potential. The big players ruling the roost and innovators getting

aggressive on pricing further add to challenges. TRx data indicate that: i) Fulphila

(pegfilgrastim) market share is yet to recover (8.7% in Jul’21 vs 9.2% peak market

share in Jun-19); ii) a sustainable uptick in Ogivri (trastuzumab) is awaited (~11.5%

market share); iii) in insulin glargine, Biocon holds a 2.7% share about 11 months

since its launch. Although the potential approval of interchangeability designation

for its insulin products is welcome, we believe our 20% market share captures upside

potential as the innovator will remain a strong competitor. Bevacizumab is likely to

be a difficult market as two biosimilars have captured two–thirds of the market.

Investments to gather pace; no room for surprise

BIOS plans to invest USD200mn per year over the next two years (ex-Syngene), split

between biologics and generics that would be largely funded by internal accruals and

fund-raise at Biocon Biologics. Management plans to increase asset block from

USD450mn to USD1bn and incur R&D at 13–15% of ex-Syngene sales. High

competition in launched biosimilars and surging R&D means margin beat is unlikely.

Explore:

Outlook and valuation: Risk-reward unfavourable; retain ‘REDUCE’

We maintain ‘REDUCE’ on Biocon despite a 44% earnings CAGR over FY21–24E,

which hinges on successful execution of the biosimilars portfolio, and that has had a

limited uptick. While market share is inching up, and we build in a rapid uptick in

glargine in FY23, heavy competition in MAbs and Amgen aggressively competing on

price are likely to put pressure on earnings. As Exhibit 6 shows, price erosion hasn’t

softened yet; hence, biosimilar realizations are unlikely to improve in the near term.

Biocon is trading at ~28.8x FY23E EPS, which factors in potential upside, but not the

risks involved. We value the stock on SoTP—biosimilars yield a DCF-based value of

INR143/share. Maintain ‘REDUCE/SU’ with a revised TP of INR335 (earlier INR345)

as we reduce Syngene’s value.

10

20

30

40

50

Sales Growth(%)

EPS Growth(%)

RoE(%)

PE(x)

Pharmaceuticals BIOS IN Equity

38,000

42,600

47,200

51,800

56,400

61,000

325

360

395

430

465

500

Oct-20 Jan-21 Apr-21 Jul-21 Oct-21

BIOS IN Equity Sensex

India Equity Research Pharmaceuticals October 4, 2021

BIOCON COMPANY UPDATE

Kunal Randeria Aashita Jain +91 (22) 6620 3040 +91 (22) 6623 3463 [email protected] [email protected]

Corporate access

Financial model Podcast

Video

Edelweiss Securities Limited

BIOCON

Edelweiss Research is also available on www.edelweissresearch.com, Bloomberg - EDEL, Thomson Reuters, and Factset 57

Financial Statements

Income Statement (INR mn) Year to March FY21A FY22E FY23E FY24E

Total operating income 71,058 83,183 1,13,237 1,41,945

Gross profit 48,973 56,758 74,737 92,264

Employee costs 17,410 18,992 20,891 22,980

R&D cost 5,530 5,301 7,700 8,943

Other expenses 9,507 10,115 13,588 16,324

EBITDA 16,526 22,350 32,557 44,018

Depreciation 7,151 7,792 8,996 9,696

Less: Interest expense 577 639 741 741

Add: Other income 2,545 1,522 1,522 1,522

Profit before tax 11,343 15,441 24,342 35,103

Prov for tax 2,215 3,684 5,964 8,776

Less: Exceptional item 126 0 0 0

Reported profit 7,502 8,433 15,687 22,668

Adjusted profit 7,349 8,433 15,687 22,668

Diluted shares o/s 1,200 1,200 1,200 1,200

Adjusted diluted EPS 6.1 7.0 13.1 18.9

DPS (INR) 0 0.6 1.2 1.7

Tax rate (%) 19.5 23.9 24.5 25.0

Important Ratios (%) Year to March FY21A FY22E FY23E FY24E

Gross margin 68.9 68.2 66.0 65.0

R&D as a % of sales 7.8 6.4 6.8 6.3

Net Debt/EBITDA 0.7 0.6 0.2 (0.2)

EBITDA margin (%) 23.3 26.9 28.8 31.0

Net profit margin (%) 10.3 10.1 13.9 16.0

Revenue growth (% YoY) 12.8 17.1 36.1 25.4

EBITDA growth (% YoY) 3.1 35.2 45.7 35.2

Adj. profit growth (%) 5.4 14.8 86.0 44.5

Assumptions (%) Year to March FY21A FY22E FY23E FY24E

GDP (YoY %) (6.0) 7.0 6.0 6.0

Repo rate (%) 3.0 3.5 4.0 4.0

USD/INR (average) 74.1 73.0 72.0 72.0

Generics (USD mn) 314.8 315.9 363.3 399.6

Biosimilars (USD mn) 377.4 500.3 689.2 849.6

Research ser (USD mn) 294.4 350.1 392.1 439.1

Capex (USD mn) 234.4 205.5 180.6 138.9

Gross R&D 84.6 94.7 141.7 168.6

Valuation Metrics Year to March FY21A FY22E FY23E FY24E

Diluted P/E (x) 59.7 52.0 28.0 19.3

Price/BV (x) 5.7 5.2 4.5 3.7

EV/EBITDA (x) 27.2 20.2 13.7 9.8

Dividend yield (%) 0 0.2 0.3 0.5

Source: Company and Edelweiss estimates

Balance Sheet (INR mn) Year to March FY21A FY22E FY23E FY24E

Share capital 6,000 6,000 6,000 6,000

Reserves 70,269 77,943 92,219 1,12,847

Shareholders funds 76,269 83,943 98,219 1,18,847

Minority interest 8,807 10,448 12,639 15,798

Borrowings 43,586 43,586 43,586 43,586

Trade payables 15,139 18,114 26,392 34,056

Other liabs & prov 12,992 12,992 12,992 12,992

Total liabilities 1,85,223 1,97,514 2,22,257 2,53,708

Net block 62,106 69,314 73,318 73,622

Intangible assets 5,467 5,467 5,467 5,467

Capital WIP 22,535 22,535 22,535 22,535

Total fixed assets 90,108 97,316 1,01,320 1,01,624

Non current inv 7,432 7,432 7,432 7,432

Cash/cash equivalent 32,241 30,493 35,544 51,996

Sundry debtors 12,176 15,953 21,717 27,222

Loans & advances 0 0 0 0

Other assets 31,587 34,641 44,565 53,755

Total assets 1,85,223 1,97,514 2,22,257 2,53,708

Free Cash Flow (INR mn) Year to March FY21A FY22E FY23E FY24E

Reported profit 9,254 11,757 18,378 26,327

Add: Depreciation 7,151 7,792 8,996 9,696

Interest (net of tax) 464 487 559 556

Others (2,914) (3,171) (2,509) (3,474)

Less: Changes in WC (2,358) (3,855) (7,411) (7,031)

Operating cash flow 11,597 13,009 18,013 26,074

Less: Capex (17,367) (15,000) (13,000) (10,000)

Free cash flow (5,770) (1,991) 5,013 16,074

Key Ratios Year to March FY21A FY22E FY23E FY24E

RoE (%) 10.5 10.5 17.2 20.9

RoCE (%) 10.4 12.1 17.2 21.5

Inventory days 273 279 253 266

Receivable days 63 62 61 63

Payable days 235 230 211 222

Working cap (% sales) 22.0 23.4 23.8 23.9

Gross debt/equity (x) 0.5 0.5 0.4 0.3

Net debt/equity (x) 0.1 0.1 0.1 (0.1)

Interest coverage (x) 16.2 22.8 31.8 46.3

Valuation Drivers Year to March FY21A FY22E FY23E FY24E

EPS growth (%) 5.4 14.8 86.0 44.5

RoE (%) 10.5 10.5 17.2 20.9

EBITDA growth (%) 3.1 35.2 45.7 35.2

Payout ratio (%) 0 51.7 82.4 160.0

BIOCON

Edelweiss Securities Limited

58 Edelweiss Research is also available on www.edelweissresearch.com, Bloomberg - EDEL, Thomson Reuters, and Factset

Company Description

Biocon (BIOS) is primarily a play on the emerging biosimilars segment in India. It is

the only Indian pharmaceutical player with i) a serious commitment to biosimilars,

ii) a good product mix of near- to long-term opportunity, and iii) diversification

across emerging and developed markets. BIOS operates across four segments:

generics, biologics, biosimilars and research services.

Investment Theme

Our key investment rationale is that the market is currently ascribing a significant

premium to BIOS’ biosimilar business compared to our DCF valuation, which is not

sustainable in our view as: i) price erosion will intensify on stiff competition in MABs,

and ii) market share gains will be very difficult in insulin, where innovator will be

much more aggressive in maintaining market share. High competition in launched

biosimilars and surging R&D means margin beat is unlikely.

Key Risks

Higher than expected ramp-up and market share gains in biosimilar business.

If the US FDA allows interchangeability for biosimilars at pharmacies without

requiring any additional clinical trials, it will help better penetration eventually

leading to higher price erosion. In this scenario early entrants will be at advantage.

Edelweiss Securities Limited

BIOCON

Edelweiss Research is also available on www.edelweissresearch.com, Bloomberg - EDEL, Thomson Reuters, and Factset 59

Additional Data

Management

Chairperson Ms. Kiran Mazumdar-Shaw

Vice Chairman andNon-Executive Director

N/A

CEO and MD Siddharth Mittal

MD of Biocon Biologics

Dr. Arun Chandavarkar

Auditor B S R & Co. LLP

Holdings – Top 10* % Holding % Holding

LIC 4.11 Aberdeen 0.51

Vanguard 1.22 Mirae MF 0.48

Blackrock 1.04 ICICI Pru AMC 0.44

Aditya Birla Su 0.70 Norges 0.27

Bank of Montrea 0.64 Kotak AMC 0.17

*Latest public data

Recent Company Research Date Title Price Reco

17-Sep-21 Serum deal: Execution awaited; Company Update

376.75 Reduce

23-Jul-21 Awaiting acceleration; Result Update

403 Reduce

29-Apr-21 Biosimilars yet to gather steam; Result Update

393.9 Reduce

Recent Sector Research Date Name of Co./Sector Title

16-Aug-21 Ajanta Pharma In cruise mode; Company Update

16-Aug-21 Glenmark Pharma. Value unlocking yet to gain traction; Result Update

13-Aug-21 Aurobindo Pharma Unsurprising miss; Result Update

Rating Interpretation

Source: Bloomberg, Edelweiss research

Daily Volume

Source: Bloomberg

Rating Distribution: Edelweiss Research Coverage

Buy Hold Reduce Total

Rating Distribution* 177 54 19 251

>50bn >10bn and <50bn <10bn Total

Market Cap (INR) 226 41 3 270

*1 stocks under review

Rating Rationale

Rating Expected absolute returns over 12 months

Buy: >15%

Hold: >15% and <-5%

Reduce: <-5%

TP440

TP225

TP350

200

260

320

380

440

500

Oct-18 Apr-19 Oct-19 Apr-20 Oct-20 Apr-21

(IN

R)

BIOS IN Equity Buy Hold Reduce0

10

20

30

40

50

Oct-18 Apr-19 Oct-19 Apr-20 Oct-20 Apr-21

(Mn

)

Edelweiss Research is also available on www.edelweissresearch.com, Bloomberg - EDEL, Thomson Reuters, and Factset Edelweiss Securities Limited

KEY DATA

Rating REDUCE Sector relative Underperformer Price (INR) 556 12 month price target (INR) 515 Market cap (INR bn/USD bn) 569/7.7 Free float/Foreign ownership (%) 25.1/4.7

What’s Changed

Target Price ⚊

Rating/Risk Rating ⚊

INVESTMENT METRICS

Uncertain times ahead

Cadila Healthcare (CDH) is up against odds: i) Mounting US pricing pressure and impending mesalamine competition from H2FY22. ii) Awaiting approval and eventual execution on transdermals and injectables; iii) Sustainable domestic recovery not yet seen. iv) Limited market opportunity for ZyCov-D; v) Moraiya clearance.

We are building in a flat earnings CAGR over FY21–24 excluding gRevlimid. While the timing and extent of mesalamine erosion remains to be seen, potential earnings downside exists. Maintain ‘REDUCE’ with a target price of INR515 as we roll over the valuation to FY23E EPS. Our TP is based on 22x FY23E core EPS and INR30 from gRevlimid and Zy-CovD.

FINANCIALS (INR mn)

Year to March FY21A FY22E FY23E FY24E

Revenue 1,51,022 1,60,907 1,71,267 1,95,481

EBITDA 33,410 35,903 38,406 47,719

Adjusted profit 23,266 22,044 23,965 31,019

Diluted EPS (INR) 22.7 21.5 23.4 30.3

EPS growth (%) 58.5 (5.3) 8.7 29.4

RoAE (%) 18.3 15.9 15.3 17.3

P/E (x) 24.2 25.6 23.5 18.2

EV/EBITDA (x) 17.9 15.3 14.6 11.2

Dividend yield (%) 0.6 0.8 0.9 1.1

PRICE PERFORMANCE

US pressure rising; pipeline delivery critical

CDH’s current revenue stream is heavily dependent on its mesalamine franchise,

which contributes ~30% to profit in our view. With Asacol HD patent expiring in Nov-

21, Lialda peaking out and rising pricing pressure, it’s critical that transdermal and

injectable launches (including in-licensed ones with exclusivity) materialise. The

success hinges on Moraiya resolution, which remains uncertain. While opex savings

may lift margin in the near term, any delay in US launches would impact earnings.

Vaccines, biosimilars, specialty – All still evolving

In biosimilars, CDH aims to target EMs initially in a big way with pegfilgrastim,

trastuzumab and adalimumab (launched first biosimilar, viz., Pegfilgrastim in Russia).

This, we believe, may not move the needle. Besides, a late entry in developed

markets may limit the opportunity. In vaccines, UNICEF and PAHO tender markets

remain the key growth driver. Saroglitazar Magnesium is in trials in the US—phase

2b trials to begin for NASH indication and phase 2 completed for PBC.

Zy-CovD potential launch in October could add INR4–6 to EPS, in our view. But given

delayed approval, competitors already having approval and ramping up supplies,

market opportunity could be limited.

Explore:

Outlook and valuation: Risk-reward unfavourable; retain ‘REDUCE’

With Asacol HD patent expiring in Nov-21, mesalamine peaking out, US facing price

pressure and covid tailwinds now behind, the odds of flat earnings are high. We have

built in a flat earnings trajectory for FY21–24 (excluding gRevlimid) as US launches

from H2FY22 are likely to be set off by competition in mesalamine and price

pressure. While Zy-CovD can be ~25% accretive, market size may be limited due to

delayed launch. We continue to maintain ‘REDUCE’ with an unchanged TP of INR515.

Our TP is based on 22x FY23E core EPS and INR30 from gRevlimid and Zy-CovD.

-10

0

10

20

30

Sales Growth(%)

EPS Growth(%)

RoE(%)

PE(x)

Pharmaceuticals CDH IN Equity

38,000

42,600

47,200

51,800

56,400

61,000

375

435

495

555

615

675

Oct-20 Jan-21 Apr-21 Jul-21 Oct-21

CDH IN Equity Sensex

India Equity Research Pharmaceuticals October 4, 2021

CADILA HEALTHCARE COMPANY UPDATE

Kunal Randeria Aashita Jain +91 (22) 6620 3040 +91 (22) 6623 3463 [email protected] [email protected]

Corporate access

Financial model Podcast

Video

Edelweiss Securities Limited

CADILA HEALTHCARE

Edelweiss Research is also available on www.edelweissresearch.com, Bloomberg - EDEL, Thomson Reuters, and Factset 61

Financial Statements

Income Statement (INR mn) Year to March FY21A FY22E FY23E FY24E

Total operating income 1,51,022 1,60,907 1,71,267 1,95,481

Gross profit 98,921 1,04,048 1,10,918 1,26,599

Employee costs 24,902 26,147 28,239 30,498

R&D cost 11,290 12,068 12,845 14,661

Other expenses 29,319 29,929 31,428 33,721

EBITDA 33,410 35,903 38,406 47,719

Depreciation 7,248 7,560 7,872 8,185

Less: Interest expense 1,635 971 845 803

Add: Other income 372 1,100 1,100 1,100

Profit before tax 24,899 28,472 30,788 39,831

Prov for tax 1,472 6,378 6,773 8,763

Less: Exceptional item (2,051) 0 0 0

Reported profit 21,336 22,044 23,965 31,019

Adjusted profit 23,266 22,044 23,965 31,019

Diluted shares o/s 1,024 1,024 1,024 1,024

Adjusted diluted EPS 22.7 21.5 23.4 30.3

DPS (INR) 3.5 4.3 4.7 6.1

Tax rate (%) 5.9 22.4 22.0 22.0

Important Ratios (%) Year to March FY21A FY22E FY23E FY24E

Gross margin 65.5 64.7 64.8 64.8

R&D as a % of sales 7.5 7.5 7.5 7.5

Net Debt/EBITDA 1.1 (0.4) (0.1) (0.6)

EBITDA margin (%) 22.1 22.3 22.4 24.4

Net profit margin (%) 15.4 13.7 14.0 15.9

Revenue growth (% YoY) 6.0 6.5 6.4 14.1

EBITDA growth (% YoY) 20.0 7.5 7.0 24.2

Adj. profit growth (%) 58.5 (5.3) 8.7 29.4

Assumptions (%) Year to March FY21A FY22E FY23E FY24E

GDP (YoY %) (6.0) 7.0 6.0 6.0

Repo rate (%) 3.0 3.5 4.0 4.0

USD/INR (average) 75.0 73.0 72.0 72.0

India formulations (%) 8.9 23.4 3.4 7.9

US generics (USD mn) 868.5 900.0 956.2 1,168.4

Exports growth (%) 5.2 4.9 7.2 19.5

Wellness growth (%) 5.9 12.0 10.0 10.0

API growth (%) 24.1 6.6 10.0 10.0

Capex (USD mn) 112.9 95.9 97.2 0

Valuation Metrics Year to March FY21A FY22E FY23E FY24E

Diluted P/E (x) 24.2 25.6 23.5 18.2

Price/BV (x) 4.3 3.8 3.4 2.9

EV/EBITDA (x) 17.9 15.3 14.6 11.2

Dividend yield (%) 0.6 0.8 0.9 1.1

Source: Company and Edelweiss estimates

Balance Sheet (INR mn) Year to March FY21A FY22E FY23E FY24E

Share capital 1,024 1,024 1,024 1,024

Reserves 1,28,899 1,46,534 1,65,706 1,90,521

Shareholders funds 1,29,923 1,47,558 1,66,730 1,91,545

Minority interest 19,373 19,423 19,473 19,523

Borrowings 46,257 40,257 38,257 38,257

Trade payables 22,059 24,925 26,454 30,195

Other liabs & prov 6,845 14,117 15,640 19,201

Total liabilities 2,28,103 2,50,108 2,70,575 3,02,941

Net block 1,21,328 91,768 1,19,895 1,18,711

Intangible assets 0 0 0 0

Capital WIP 7,832 7,832 7,832 7,832

Total fixed assets 1,29,160 99,600 1,27,727 1,26,543

Non current inv 6,312 6,312 6,312 6,312

Cash/cash equivalent 10,872 55,240 43,113 66,018

Sundry debtors 31,273 39,676 42,230 48,201

Loans & advances 18,124 18,124 18,124 18,124

Other assets 32,362 31,156 33,068 37,743

Total assets 2,28,103 2,50,108 2,70,575 3,02,941

Free Cash Flow (INR mn) Year to March FY21A FY22E FY23E FY24E

Reported profit 21,336 22,044 23,965 31,019

Add: Depreciation 7,248 7,560 7,872 8,185

Interest (net of tax) 0 0 0 0

Others 2,478 0 0 0

Less: Changes in WC 1,868 2,941 (1,413) (3,345)

Operating cash flow 32,930 32,545 30,424 35,859

Less: Capex (8,469) (7,000) (7,000) (7,000)

Free cash flow 24,461 25,545 23,424 28,859

Key Ratios Year to March FY21A FY22E FY23E FY24E

RoE (%) 18.3 15.9 15.3 17.3

RoCE (%) 13.5 14.6 14.7 17.2

Inventory days 211 204 194 188

Receivable days 82 80 87 84

Payable days 148 151 155 150

Working cap (% sales) 28.7 25.1 24.4 23.1

Gross debt/equity (x) 0.3 0.2 0.2 0.2

Net debt/equity (x) 0.2 (0.1) 0 (0.1)

Interest coverage (x) 16.0 29.2 36.1 49.2

Valuation Drivers Year to March FY21A FY22E FY23E FY24E

EPS growth (%) 58.5 (5.3) 8.7 29.4

RoE (%) 18.3 15.9 15.3 17.3

EBITDA growth (%) 20.0 7.5 7.0 24.2

Payout ratio (%) 16.8 20.0 20.0 20.0

CADILA HEALTHCARE

Edelweiss Securities Limited

62 Edelweiss Research is also available on www.edelweissresearch.com, Bloomberg - EDEL, Thomson Reuters, and Factset

Company Description

Cadila Healthcare (CDH) is a well-diversified Pharma company with presence across

more than 100 countries in the world and among the few Indian players to have

presence in Consumer and Animal health businesses. Cadila ranks among the Top10

companies in the Indian pharma market and the India branded business contributes

more than 35% of its sales. US contributes 40% of its revenues and is among the

top15 generic companies in the US in terms of prescriptions. Cadila recent success

in mesalamines has given a good momentum to the US business. Company’s focus

now is on transdermal patches, vaccines, biosimilars and specialty. Acquisition has

been a core to its strategy in recent times primarily aimed at strengthening presence

in these markets - Spain, France, Brazil, Nesher Pharma in US, etc. to its credit it also

has joint ventures with leading Global Pharma players like Abbott, Bayer, Hospira,

Takeda, etc.

Investment Theme

Cadila’s current revenue stream relies heavily on its mesalamine franchise that

contribute ~30% to its profit, in our view. Hence it’s critical that transdermals and

injectable launches (incl. in-licensed ones with exclusivity) materialize. With Asacol

HD patent expiring in Nov-21, mesalamine peaked out, US facing price pressure and

Covid tailwinds now behind the company, the odds of flat earnings remain high.

While we acknowledge management guidance of margin expansion from opex

savings, delay in US launches could impact earnings. Zy-CovD approval could add

INR4-6 to EPS, in our view. But given delay in approval, market opportunity may be

limited.

Key Risks

Limited competition in mesalamine than expected

Better than expected execution in transdermals and injectables

Third covid wave to benefit company given broad covid portfolio.

Edelweiss Securities Limited

CADILA HEALTHCARE

Edelweiss Research is also available on www.edelweissresearch.com, Bloomberg - EDEL, Thomson Reuters, and Factset 63

Additional Data

Management

Chairman Pankaj R. Patel

Managing Director

Dr. Sharvil P. Patel

Executive Director

Ganesh Nayak

CFO Nitin D. Parekh

Auditor Deloitte Haskins and Sells LLP

Holdings – Top 10* % Holding % Holding

LIC 3.63 UTI MF 0.67

Kotak Mahindra 2.16 Nippon AMC 0.53

Norges Bank 1.18 Franklin 0.49

Govt pension fu 1.15 PPFAS 0.29

Vanguard 0.75 ICICI Pru AMC 0.23

*Latest public data

Recent Company Research Date Title Price Reco

11-Aug-21 Covid-driven beat; US under pressure; Result Update

563.75 Reduce

28-May-21 Long-term growth levers still awaited; Result Update

626.85 Reduce

06-Feb-21 Growth levers yet to kick in; Result Update

475.25 Hold

Recent Sector Research Date Name of Co./Sector Title

17-Sep-21 Biocon Serum deal: Execution awaited; Company Update

16-Aug-21 Ajanta Pharma In cruise mode; Company Update

16-Aug-21 Glenmark Pharma. Value unlocking yet to gain traction; Result Update

Rating Interpretation

Source: Bloomberg, Edelweiss research

Daily Volume

Source: Bloomberg

Rating Distribution: Edelweiss Research Coverage

Buy Hold Reduce Total

Rating Distribution* 177 54 19 251

>50bn >10bn and <50bn <10bn Total

Market Cap (INR) 226 41 3 270

*1 stocks under review

Rating Rationale

Rating Expected absolute returns over 12 months

Buy: >15%

Hold: >15% and <-5%

Reduce: <-5%

TP440

TP315

TP380

TP470

TP525

200

295

390

485

580

675

Oct-18 Apr-19 Oct-19 Apr-20 Oct-20 Apr-21

(IN

R)

CDH IN Equity Buy Hold Reduce0

8

16

24

32

40

Oct-18 Apr-19 Oct-19 Apr-20 Oct-20 Apr-21

(Mn

)

Edelweiss Research is also available on www.edelweissresearch.com, Bloomberg - EDEL, Thomson Reuters, and Factset Edelweiss Securities Limited

KEY DATA

Rating BUY Sector relative Outperformer Price (INR) 986 12 month price target (INR) 1,140 Market cap (INR bn/USD bn) 795/10.7 Free float/Foreign ownership (%) 63.3/24.8

What’s Changed Target Price

Rating/Risk Rating ⚊

INVESTMENT METRICS

Steady stream of opportunities

Cipla remains among our ‘top picks’ in pharma based on: i) strong India business, ii) improved visibility in the US complex pipeline—gBrovana and gFosrenol in FY22, followed by gAdvair, gRevlimid and gAbraxane in FY23 that would potentially double US business by FY24; iii) focused cost control; and iv) a clearly delineated strategy, which allays concerns around investments and execution. Besides, with R&D likely

to rise slowly and much of opex savings looking sustainable, the base business margin of ~22% seems achievable.

Going forward, we expect the company to clock an EPS CAGR of 23% through FY24E. Maintain ‘BUY’ with a revised TP of INR1,140 (earlier INR1,100) as we roll forward to FY23E EPS.

FINANCIALS (INR mn)

Year to March FY21A FY22E FY23E FY24E

Revenue 1,91,596 2,15,232 2,35,579 2,69,662

EBITDA 42,524 48,700 59,120 69,536

Adjusted profit 24,049 29,951 37,657 44,836

Diluted EPS (INR) 29.8 37.2 46.7 55.6

EPS growth (%) 55.5 24.5 25.7 19.1

RoAE (%) 14.1 15.3 16.7 17.2

P/E (x) 33.0 26.5 21.1 17.7

EV/EBITDA (x) 18.2 15.7 12.6 10.4

Dividend yield (%) 0 0.5 0.5 0.5

PRICE PERFORMANCE

US execution promising; complex pipeline to drive growth

The company has achieved a market share of >15% in several molecules such as

gSensipar, gNexium and gPulmicort within 6–9 months of launch. The uptake in

gProventil has been promising so far, garnering ~16% share in the overall albuterol

market till Aug-21; the guidance of further market share gains is encouraging too.

While the first half of FY22 will be driven by base business recovery, H2 is likely to

see US gaining traction from launches such as gBrovana and gFosrenol. FY23 is likely

to be a big launch year with gAdvair, gAbraxane and gRevlimid all being multi-year

opportunities, followed by pipeline monetization beyond FY24.

Branded market robust; calibrated investment approach

Cipla’s revenue mix is comforting as ~65% business is from branded markets. Cipla

has maintained its leadership position in respiratory and urology and “One India”

umbrella is likely to further drive synergies, leveraging growth in Rx, Gx and

consumer health. South Africa continues to grow in high-single digits with effective

launch of product backlogs. Management’s cost focus is likely to keep base business

margin at 22.5–23%. We like Cipla’s ‘call-option’ strategy in expanding its specialty

business as it limits capital outlay and keeps balance sheet healthy, while out-

licensing of CNS assets would help stem losses.

Explore:

Outlook and valuation: Premium for steady business; maintain ‘BUY’

Given the stability in branded business, improved visibility on the US respiratory

pipeline and strong cost rationalisation credentials, we believe the company

deserves a premium to peers. We forecast an FY21–24 EPS CAGR of 23% driven by

the abovementioned opportunities. Our SoTP-based TP stands at INR1,140 based on

25x FY23E core earnings and INR91 from gRevlimid and specialty pipeline. Retain

‘BUY/SO’.

10

15

20

25

30

Sales Growth(%)

EPS Growth(%)

RoE(%)

PE(x)

Pharmaceuticals CIPLA IN Equity

38,000

42,600

47,200

51,800

56,400

61,000

700

760

820

880

940

1,000

Oct-20 Jan-21 Apr-21 Jul-21 Oct-21

CIPLA IN Equity Sensex

India Equity Research Pharmaceuticals October 4, 2021

CIPLA COMPANY UPDATE

Kunal Randeria Aashita Jain +91 (22) 6620 3040 +91 (22) 6623 3463 [email protected] [email protected]

Corporate access

Financial model Podcast

Video

Edelweiss Securities Limited

CIPLA

Edelweiss Research is also available on www.edelweissresearch.com, Bloomberg - EDEL, Thomson Reuters, and Factset 65

Financial Statements

Income Statement (INR mn) Year to March FY21A FY22E FY23E FY24E

Total operating income 1,91,596 2,15,232 2,35,579 2,69,662

Gross profit 1,18,077 1,34,512 1,53,353 1,74,461

Employee costs 32,518 35,770 38,989 42,498

R&D cost 9,240 11,623 13,664 15,640

Other expenses 33,794 38,419 41,580 46,786

EBITDA 42,524 48,700 59,120 69,536

Depreciation 10,677 10,844 11,508 12,338

Less: Interest expense 1,607 719 669 619

Add: Other income 2,660 3,000 3,000 3,000

Profit before tax 32,773 40,137 49,943 59,578

Prov for tax 8,888 10,636 12,735 15,192

Less: Exceptional item 0 0 0 0

Reported profit 24,049 29,951 37,657 44,836

Adjusted profit 24,049 29,951 37,657 44,836

Diluted shares o/s 806 806 806 806

Adjusted diluted EPS 29.8 37.2 46.7 55.6

DPS (INR) 0 5.0 5.0 5.0

Tax rate (%) 27.1 26.5 25.5 25.5

Important Ratios (%) Year to March FY21A FY22E FY23E FY24E

Gross Margin (%) 61.6 62.5 65.1 64.7

R&D as a % of sales 4.8 5.4 5.8 5.8

Debt/EBITDA 0.4 0.3 0.2 0.2

EBITDA margin (%) 22.2 22.6 25.1 25.8

Net profit margin (%) 12.6 13.9 16.0 16.6

Revenue growth (% YoY) 11.8 12.3 9.5 14.5

EBITDA growth (% YoY) 32.6 14.5 21.4 17.6

Adj. profit growth (%) 55.5 24.5 25.7 19.1

Assumptions (%) Year to March FY21A FY22E FY23E FY24E

GDP (YoY %) (6.0) 7.0 6.0 6.0

Repo rate (%) 3.0 3.5 4.0 4.0

USD/INR (average) 74.1 73.0 72.0 72.0

India growth (%) 14.8 18.6 (3.5) 9.4

Exports growth (%) 12.3 6.6 20.4 18.6

US sales (USD mn) 552.1 585.2 855.7 1,129.8

API sales (USD mn) 107.7 120.2 128.0 134.4

Capex (USD mn) 110.5 88.0 111.1 138.9

Valuation Metrics Year to March FY21A FY22E FY23E FY24E

Diluted P/E (x) 33.0 26.5 21.1 17.7

Price/BV (x) 4.3 3.8 3.3 2.8

EV/EBITDA (x) 18.2 15.7 12.6 10.4

Dividend yield (%) 0 0.5 0.5 0.5

Source: Company and Edelweiss estimates

Balance Sheet (INR mn) Year to March FY21A FY22E FY23E FY24E

Share capital 1,613 1,613 1,613 1,613

Reserves 1,81,652 2,06,849 2,39,753 2,79,836

Shareholders funds 1,83,265 2,08,462 2,41,366 2,81,448

Minority interest 2,591 2,591 2,591 2,591

Borrowings 15,375 14,375 13,375 12,375

Trade payables 20,668 22,115 22,528 26,082

Other liabs & prov 21,719 18,503 19,250 20,501

Total liabilities 2,48,372 2,70,800 3,03,863 3,47,751

Net block 61,701 57,278 53,770 51,432

Intangible assets 30,073 30,073 30,073 30,073

Capital WIP 9,689 9,689 9,689 9,689

Total fixed assets 1,01,463 97,040 93,532 91,193

Non current inv 1,953 1,953 1,953 1,953

Cash/cash equivalent 36,876 45,823 60,534 84,043

Sundry debtors 34,457 41,277 51,634 62,798

Loans & advances 14,600 21,109 23,055 26,313

Other assets 46,692 51,265 60,825 69,119

Total assets 2,48,372 2,70,800 3,03,863 3,47,751

Free Cash Flow (INR mn) Year to March FY21A FY22E FY23E FY24E

Reported profit 24,049 29,951 37,657 44,836

Add: Depreciation 10,677 10,844 11,508 12,338

Interest (net of tax) 1,607 719 669 619

Others 7,878 0 0 0

Less: Changes in WC 3,717 (19,673) (20,702) (17,911)

Operating cash flow 37,552 21,841 29,133 39,882

Less: Capex (8,189) (6,422) (8,000) (10,000)

Free cash flow 29,363 15,419 21,133 29,882

Key Ratios Year to March FY21A FY22E FY23E FY24E

RoE (%) 14.1 15.3 16.7 17.2

RoCE (%) 17.7 19.2 21.0 21.7

Inventory days 225 221 249 249

Receivable days 70 64 72 77

Payable days 108 97 99 93

Working cap (% sales) 47.0 55.1 65.4 72.5

Gross debt/equity (x) 0.1 0.1 0.1 0

Net debt/equity (x) (0.1) (0.1) (0.2) (0.3)

Interest coverage (x) 19.8 52.7 71.2 92.4

Valuation Drivers Year to March FY21A FY22E FY23E FY24E

EPS growth (%) 55.5 24.5 25.7 19.1

RoE (%) 14.1 15.3 16.7 17.2

EBITDA growth (%) 32.6 14.5 21.4 17.6

Payout ratio (%) 0 13.5 10.7 9.0

CIPLA

Edelweiss Securities Limited

66 Edelweiss Research is also available on www.edelweissresearch.com, Bloomberg - EDEL, Thomson Reuters, and Factset

Company Description

Cipla is a global pharma company with a geographically diversified presence across

80+ countries. India branded formulations account for more than 40% of business

and Cipla is among the top 3 players in the market. In the past, the company believed

in the partnership model for international markets. However, over the past 4 years

the company is undergoing a strategic shift and has started setting up its own front

end. Cipla is also a well-known global player in inhalers and anti-retrovirals. Cipla

meaningfully entered the US market fairly later than peers, in 2015, with the

acquisition of Invagen and Exelan. Going forward, the company is planning launch of

combination inhalers in larger markets of US & EU and is also setting up own front

ends to drive growth.

Investment Theme

We believe Cipla has the least revenue risk among peers as albuterol ramp-up

coupled with niche launches should keep the US ticking profitably, domestic base

business will remain steady as core therapies continue to do well and South Africa

grows in high-single digits. While R&D and other costs are likely to inch up as markets

open, strong revenue stream should ensure no tangible margin pressures.

Key Risks

Slowdown in ANDA approvals and USFDA related regulatory risks are part of the

generics business.

Regulatory changes in India or South Africa where Cipla is among the top 5

players

Currency risk

Edelweiss Securities Limited

CIPLA

Edelweiss Research is also available on www.edelweissresearch.com, Bloomberg - EDEL, Thomson Reuters, and Factset 67

Additional Data

Management

CEO Umang Vohra

CFO Kedar Upadhye

Chairman Dr. Y.K. Hamied

Executive Vice Chairperson

Ms. Samina Hamied

Auditor Walker Chandiok & Co LLP

Holdings – Top 10* % Holding % Holding

SBI Funds 3.44 Norges 1.68

LIC 2.27 HDFC AMC 1.15

Vanguard Group 2.12 Kotak AMC 0.96

Blackrock 1.98 Shroders 0.94

ICICI Prudentia 1.74 ICICI Pru Life 0.93

*Latest public data

Recent Company Research Date Title Price Reco

05-Aug-21 Strong recovery; stability ahead; Result Update

945.4 Buy

14-Jun-21 Multiple growth engines; Company Update

904.05 Buy

14-May-21 Q4 an aberration; growth to resume; Result Update

904.05 Buy

Recent Sector Research Date Name of Co./Sector Title

17-Sep-21 Biocon Serum deal: Execution awaited; Company Update

16-Aug-21 Ajanta Pharma In cruise mode; Company Update

16-Aug-21 Glenmark Pharma. Value unlocking yet to gain traction; Result Update

Rating Interpretation

Source: Bloomberg, Edelweiss research

Daily Volume

Source: Bloomberg

Rating Distribution: Edelweiss Research Coverage

Buy Hold Reduce Total

Rating Distribution* 177 54 19 251

>50bn >10bn and <50bn <10bn Total

Market Cap (INR) 226 41 3 270

*1 stocks under review

Rating Rationale

Rating Expected absolute returns over 12 months

Buy: >15%

Hold: >15% and <-5%

Reduce: <-5%

TP500

TP560

TP955

TP500

350

480

610

740

870

1000

Oct-18 Apr-19 Oct-19 Apr-20 Oct-20 Apr-21

(IN

R)

CIPLA IN Equity Buy Hold Reduce0

12

24

36

48

60

Oct-18 Apr-19 Oct-19 Apr-20 Oct-20 Apr-21

(Mn

)

Edelweiss Research is also available on www.edelweissresearch.com, Bloomberg - EDEL, Thomson Reuters, and Factset Edelweiss Securities Limited

KEY DATA

Rating HOLD Sector relative Neutral Price (INR) 4,832 12 month price target (INR) 5,410 Market cap (INR bn/USD bn) 1,283/17.3 Free float/Foreign ownership (%) 48.1/20.6

What’s Changed Target Price

Rating/Risk Rating ⚊

INVESTMENT METRICS

Enough catalysts to sustain growth

Divi’s Laboratories (DIVI) is in a good position due to: i) volume ramp-up as a result of steady legacy molecules, new products and debottlenecking activities; ii) custom synthesis scale-up and diversified offerings such as contrast media and nutraceuticals; iii) operating leverage after full commercialisation of new capacities; and iv) China disruption—its key beneficiary. Besides, ~INR10bn incremental

Kakinada and Vishakhapatnam plant capex and molnupiravir opportunity would further help in sustaining growth momentum.

We increase our FY23E EPS by 10% to factor in molnupiravir opportunity. However, its current valuation prices in a 29% EPS CAGR for FY21–24E. ‘HOLD’ with a revised TP of INR5,410 (INR4,680 earlier).

FINANCIALS (INR mn)

Year to March FY21A FY22E FY23E FY24E

Revenue 69,694 88,733 1,11,173 1,30,465

EBITDA 28,599 38,253 49,185 58,204

Adjusted profit 19,875 27,703 35,904 42,569

Diluted EPS (INR) 74.9 104.4 135.3 160.4

EPS growth (%) 51.2 39.4 29.6 18.6

RoAE (%) 23.9 27.1 29.1 28.5

P/E (x) 64.5 46.3 35.7 30.1

EV/EBITDA (x) 43.8 32.8 25.3 21.1

Dividend yield (%) 0.4 0.6 0.8 0.9

PRICE PERFORMANCE

Growth engines laid out; expansion plans promising

The company has laid out six growth engines to enter the next phase of growth.

i) Backward integration of key molecules, focusing on expanding in profitable ones

such as mesalamine and cabidopa/levodopa. ii) Venturing into all sartans given no

NDMA issues. iii) Contrast media, wherein management believes it has just scraped

the surface. iv) Two long-term custom synthesis contracts. v) Large volume niche

molecules requiring specific technology expiring in 2023–25. vi) Key legacy generic

molecules to continue to grow at 10%. The aggressive INR25bn in capex over last

three years and ~INR10bn incremental capex in 1–2 years majorly towards the

Kakinada and Krishnapatnam port should be sufficient to meet its growth needs.

Even so, execution in contrast media and leadership in new molecules remains to

be seen.

Robust volumes; best-in-class margin and return ratios

DIVI’s focus on profitability, capital efficiency and investments in technology drove

its best-in-class gross/EBITDA margin of 67%/40%-plus and RoCE of 25%-plus.

Management is confident of maintaining it. China opportunities, aggressive capacity

expansion and backward integration make us confident of DIVI clocking an FY21–24E

revenue/earnings CAGR of 20%/25%.

Explore:

Outlook and valuation: Fully valued; maintain ‘HOLD’

We value DIVI at 40x earnings—a 50% premium to sector average considering its

best-in-class margins and returns ratios, strong cash flow and growth visibility—the

latter stemming from the company’s endeavours to capitalise on new opportunities.

We raise our FY23E EPS by 10% to factor in molnupiravir opportunity. Divis is the API

supplier to Merck and this being a branded product (USD700/10 pills), realizations

are likely to be quite handsome.

The stock is trading at 35.7x FY23E EPS, which fully captures the 29% EPS CAGR over

FY21-24E and potential benefit from capex. All in all, we retain ‘HOLD/SN’ with a

revised TP of INR5,410 (earlier INR4,680) while also rolling forward the valuation to

FY23E.

10

20

30

40

50

Sales Growth(%)

EPS Growth(%)

RoE(%)

PE(x)

Pharmaceuticals DIVI IN Equity

38,000

42,600

47,200

51,800

56,400

61,000

3,025

3,465

3,905

4,345

4,785

5,225

Oct-20 Jan-21 Apr-21 Jul-21 Oct-21

DIVI IN Equity Sensex

India Equity Research Pharmaceuticals October 4, 2021

DIVI'S LAB. COMPANY UPDATE

Kunal Randeria Aashita Jain +91 (22) 6620 3040 +91 (22) 6623 3463 [email protected] [email protected]

Corporate access

Financial model Podcast

Video

Edelweiss Securities Limited

DIVI'S LAB.

Edelweiss Research is also available on www.edelweissresearch.com, Bloomberg - EDEL, Thomson Reuters, and Factset 69

Financial Statements

Income Statement (INR mn) Year to March FY21A FY22E FY23E FY24E

Total operating income 69,694 88,733 1,11,173 1,30,465

Gross profit 46,453 59,451 74,264 87,150

Employee costs 8,258 9,331 10,544 12,020

R&D cost 382 532 556 652

Other expenses 9,214 11,335 13,979 16,274

EBITDA 28,599 38,253 49,185 58,204

Depreciation 2,556 3,293 3,843 4,228

Less: Interest expense 9 9 9 30

Add: Other income 626 1,500 1,600 1,700

Profit before tax 26,660 36,451 46,933 55,646

Prov for tax 6,818 8,748 11,029 13,077

Less: Exceptional item 0 0 0 0

Reported profit 19,843 27,703 35,904 42,569

Adjusted profit 19,875 27,703 35,904 42,569

Diluted shares o/s 265 265 265 265

Adjusted diluted EPS 74.9 104.4 135.3 160.4

DPS (INR) 20.0 29.2 37.9 44.9

Tax rate (%) 25.6 24.0 23.5 23.5

Important Ratios (%) Year to March FY21A FY22E FY23E FY24E

Gross margin 66.7 67.0 66.8 66.8

R&D as a % of sales 0.6 0.6 0.5 0.5

Net Debt/EBITDA (0.8) (0.5) (0.6) (0.8)

EBITDA margin (%) 41.0 43.1 44.2 44.6

Net profit margin (%) 28.5 31.2 32.3 32.6

Revenue growth (% YoY) 30.2 27.9 25.5 17.4

EBITDA growth (% YoY) 57.0 33.8 28.6 18.3

Adj. profit growth (%) 51.2 39.4 29.6 18.6

Assumptions (%) Year to March FY21A FY22E FY23E FY24E

GDP (YoY %) (4.0) 7.0 6.0 0

Repo rate (%) 3.0 4.0 4.0 0

USD/INR (average) 75.0 73.0 73.0 0

Generics growth (%) 30.0 28.5 29.0 15.5

Custom synthesis (%) 26.8 28.0 22.0 20.0

Carotenoids growth (%) 35.8 17.1 17.7 16.5

Capex (USD mn) 121.3 178.1 137.0 0

Valuation Metrics Year to March FY21A FY22E FY23E FY24E

Diluted P/E (x) 64.5 46.3 35.7 30.1

Price/BV (x) 13.8 11.5 9.5 7.8

EV/EBITDA (x) 43.8 32.8 25.3 21.1

Dividend yield (%) 0.4 0.6 0.8 0.9

Source: Company and Edelweiss estimates

Balance Sheet (INR mn) Year to March FY21A FY22E FY23E FY24E

Share capital 531 531 531 531

Reserves 92,415 1,10,810 1,34,650 1,62,916

Shareholders funds 92,946 1,11,341 1,35,181 1,63,446

Minority interest 0 0 0 0

Borrowings 4 4 4 4

Trade payables 7,632 9,426 12,076 13,158

Other liabs & prov 6,837 7,761 8,884 7,501

Total liabilities 1,07,708 1,28,821 1,56,433 1,84,648

Net block 36,996 46,703 52,860 55,632

Intangible assets 0 0 0 0

Capital WIP 7,106 7,106 7,106 7,106

Total fixed assets 44,102 53,809 59,966 62,738

Non current inv 0 0 0 0

Cash/cash equivalent 21,560 20,029 31,005 46,961

Sundry debtors 16,765 21,868 26,602 30,325

Loans & advances 1,859 1,859 1,859 1,859

Other assets 23,422 31,255 37,001 42,765

Total assets 1,07,708 1,28,821 1,56,433 1,84,648

Free Cash Flow (INR mn) Year to March FY21A FY22E FY23E FY24E

Reported profit 26,660 36,451 46,933 55,646

Add: Depreciation 2,556 3,293 3,843 4,228

Interest (net of tax) 0 0 0 0

Others (663) 0 0 0

Less: Changes in WC (2,641) (10,219) (6,706) (7,440)

Operating cash flow 19,469 20,777 33,040 39,357

Less: Capex (9,100) (13,000) (10,000) (7,000)

Free cash flow 10,369 7,777 23,040 32,357

Key Ratios Year to March FY21A FY22E FY23E FY24E

RoE (%) 23.9 27.1 29.1 28.5

RoCE (%) 32.1 35.7 38.1 37.3

Inventory days 315 315 315 315

Receivable days 81 79 80 80

Payable days 106 106 106 106

Working cap (% sales) 44.9 46.7 43.3 42.6

Gross debt/equity (x) 0 0 0 0

Net debt/equity (x) (0.2) (0.2) (0.2) (0.3)

Interest coverage (x) 2,993.5 4,018.4 5,211.7 1,799.2

Valuation Drivers Year to March FY21A FY22E FY23E FY24E

EPS growth (%) 51.2 39.4 29.6 18.6

RoE (%) 23.9 27.1 29.1 28.5

EBITDA growth (%) 57.0 33.8 28.6 18.3

Payout ratio (%) 26.8 28.0 28.0 28.0

DIVI'S LAB.

Edelweiss Securities Limited

70 Edelweiss Research is also available on www.edelweissresearch.com, Bloomberg - EDEL, Thomson Reuters, and Factset

Company Description

Divi’s is well-positioned in the USD45bn global contract manufacturing market as a

research- focused, contract manufacturing player. The company services 20 of the

top 25 global companies with over 100 projects in the pipeline. It collaborates with

innovator companies through the early drug development stage to the

commercialisation stage. Divi’s revenues are derived from custom synthesis of

APIs/intermediates for innovator companies while generic exports make up the

balance. It is the largest manufacturer of peptide reagents and is a leader in products

such as Naproxen Sodium (antiinflammatory drug) and Dextromethorphan (cough

suppressant).

Investment Theme

Divi’s early-mover advantage in CRAMS, strict adherence to IPR norms and strong

relationships with pharma majors marked its transformation from an API player to a

successful India-based CRAMS player. By virtue of its long-standing presence, the

company has managed to gain a foothold in this segment. Thus, it will be a key

beneficiary of increased outsourcing opportunities underpinned by its expertise in

complex chemistry, cost efficient processes and relationships with global pharma

majors. The aggressive ~INR25bn capex equips DIVI to tap larger opportunities in Big

Pharma companies, which are seeking to reduce their heavy reliance on China.

Additionally, backward integration puts it ahead of competition, which has only

recently sought to reduce its China reliance. The company is poised to benefit not

only as a leader and preferred partner in the CRAMs space, but also because of the

way it has strategically positioned itself over the past years, in our view.

Key Risks

Currency realisations have a high-beta impact on the company’s margin as exports

contribute about 75% to revenue. Depreciation of key export currencies, i.e. USD

and EUR versus INR, could pose a risk.

Weak order book than estimated

Edelweiss Securities Limited

DIVI'S LAB.

Edelweiss Research is also available on www.edelweissresearch.com, Bloomberg - EDEL, Thomson Reuters, and Factset 71

Additional Data

Management Managing Director

Murali K Divi

Executive Director

Mr. NV Ramana

CFO L Kishore Babu

Whole time Director & CEO

Dr. Kiran S. Div

Auditor Price Waterhouse Chartered Accountants LLP

Holdings – Top 10* % Holding % Holding

SBI Funds 4.49 LIC 1.15

Axis AMC 3.56 UTI 1.00

Norges 1.63 Nippon life 0.94

Blackrock 1.61 Pinebridge 0.94

Vanguard 1.54 Goldman Sachs 0.80

*Latest public data

Recent Company Research Date Title Price Reco

07-Aug-21 Growth engines continue to deliver; Result Update

4916 Hold

29-May-21 Charting new growth path; Result Update

4120.25 Hold

07-Feb-21 Margins robust; growth priced in; Result Update

3822.45 Hold

Recent Sector Research Date Name of Co./Sector Title

17-Sep-21 Biocon Serum deal: Execution awaited; Company Update

16-Aug-21 Ajanta Pharma In cruise mode; Company Update

16-Aug-21 Glenmark Pharma. Value unlocking yet to gain traction; Result Update

Rating Interpretation

Source: Bloomberg, Edelweiss research

Daily Volume

Source: Bloomberg

Rating Distribution: Edelweiss Research Coverage

Buy Hold Reduce Total

Rating Distribution* 177 54 19 251

>50bn >10bn and <50bn <10bn Total

Market Cap (INR) 226 41 3 270

*1 stocks under review

Rating Rationale

Rating Expected absolute returns over 12 months

Buy: >15%

Hold: >15% and <-5%

Reduce: <-5%

TP1,750

TP1,850

TP1,150

TP1,600

TP1,855

TP3,920

1150

1965

2780

3595

4410

5225

Oct-18 Apr-19 Oct-19 Apr-20 Oct-20 Apr-21

(IN

R)

DIVI IN Equity Buy Hold Reduce0

4

8

12

16

20

Oct-18 Apr-19 Oct-19 Apr-20 Oct-20 Apr-21

(Mn

)

Edelweiss Research is also available on www.edelweissresearch.com, Bloomberg - EDEL, Thomson Reuters, and Factset Edelweiss Securities Limited

KEY DATA

Rating HOLD Sector relative Neutral Price (INR) 4,956 12 month price target (INR) 5,150 Market cap (INR bn/USD bn) 824/11.1 Free float/Foreign ownership (%) 73.3/29.0

What’s Changed Target Price

Rating/Risk Rating ⚊

INVESTMENT METRICS

Testing times ahead

We argue the road ahead for Dr. Reddy’s (DRRD) may not be smooth. i) Key launches are behind and launch momentum is fading. ii) Uncertainty around launch timelines of key products Sandostatin LAR, Levo, gCopaxone and gNuvaring; iii) High US contribution that is exposed to price pressure; iv) Domestic business remains in investment mode; acceleration awaited. v) The Sputnik opportunity is

shrinking, and its ramp-up is unlikely until domestic supplies builds up.

We await evidence of US pipeline monetization before turning positive again. Meanwhile, we keep ‘HOLD’ with a TP of INR5,150 (INR5,265 earlier) while rolling over to FY23E. TP breakdown: 25x core business, INR240/share from gRevlimid and INR32/share from Sputnik V.

FINANCIALS (INR mn)

Year to March FY21A FY22E FY23E FY24E

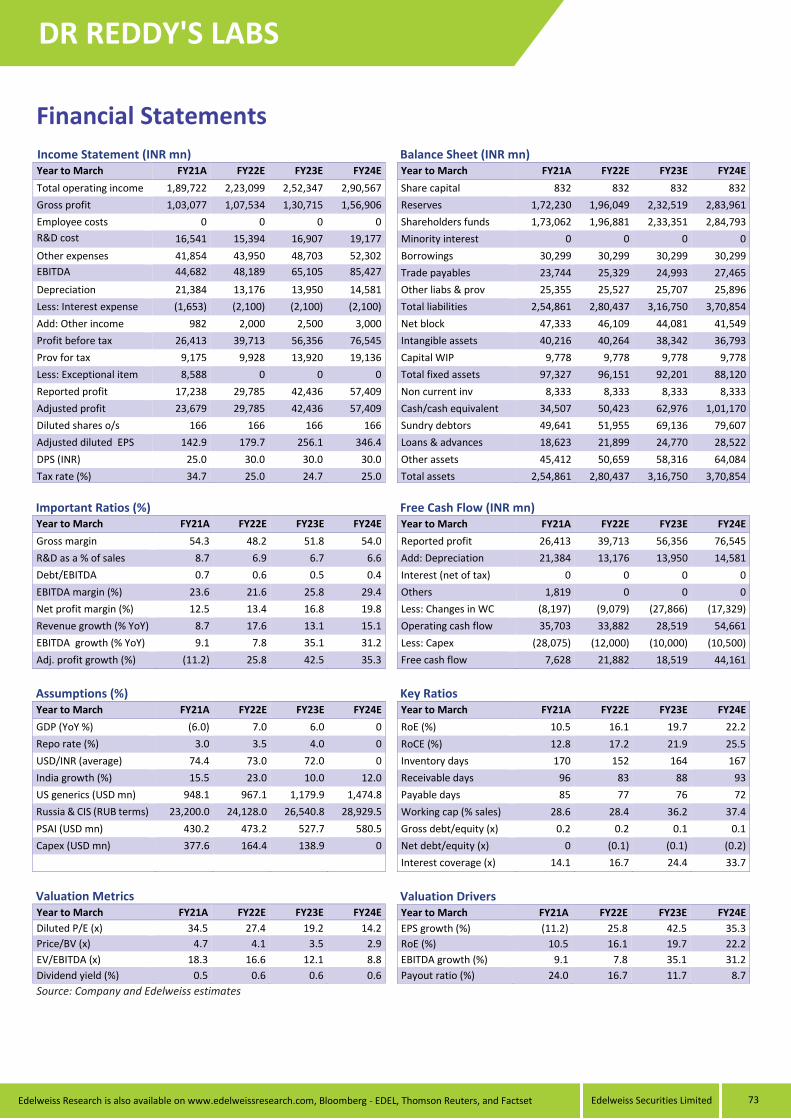
Revenue 1,89,722 2,23,099 2,52,347 2,90,567

EBITDA 44,682 48,189 65,105 85,427

Adjusted profit 23,679 29,785 42,436 57,409

Diluted EPS (INR) 142.9 179.7 256.1 346.4

EPS growth (%) (11.2) 25.8 42.5 35.3

RoAE (%) 10.5 16.1 19.7 22.2

P/E (x) 34.5 27.4 19.2 14.2

EV/EBITDA (x) 18.3 16.6 12.1 8.8

Dividend yield (%) 0.5 0.6 0.6 0.6

PRICE PERFORMANCE

US unlikely to surprise; launch momentum fading

Despite the launch of key assets, US has been underperforming due to rising pricing

pressure. DRRD’s market share is stagnant in existing products while uncertainty

persists on launch timelines for gRemodulin, sandostatin LAR, iron sucrose,

gCopaxone and gNuvaring. And since key US launches are behind, US is unlikely to

surprise. Furthermore, other lucrative launches are limited until gRevlimid in

H2FY23. DRRD is also looking to capitalise biosimilar opportunity with two in

advanced stages; this is likely to increase R&D spends. Fresenius’s potential US

pegfilgrastim launch is likely to gain traction only in FY23 post-Onpro-kind device

launch. We await evidence of investments fructifying and US pipeline monetization,

before turning positive again.

Domestic: In investment mode; acceleration awaited

DRRD is investing in new brands, OTC business (such as Celevida) in nutrition space,

rural areas and digital avenues. Management has indicated they would not shy away

from investing in India and Russia. However, domestic business is yet to reach pre-

covid levels. Opex in India and EMs, while welcome, are yet to bear fruit. Sputnik V

could add INR20/INR14 to FY22/23E EPS, but the opportunity is shrinking with delay

in supplies.

Explore:

Outlook and valuation: Not a smooth road ahead; maintain ‘HOLD’

Pipeline uncertainty, rising pricing pressure in the US, higher R&D and opex pose a

risk to our core earnings CAGR of 17% over FY21–24E. We reiterate ‘HOLD/SN’ with

a revised TP of INR5,150 (earlier INR5,265) while rolling forward the valuation to

FY23E. Our TP is based on 25x FY22E EPS and INR240 from gRevlimid NPV and INR46

from the Sputnik opportunity. We have reduced FY22/23E by 8%/5% to account for

lower Sputnik sales and US price erosion.

10

15

20

25

30

Sales Growth(%)

EPS Growth(%)

RoE(%)

PE(x)

Pharmaceuticals DRRD IN Equity

38,000

42,600

47,200

51,800

56,400

61,000

4,200

4,480

4,760

5,040

5,320

5,600

Oct-20 Jan-21 Apr-21 Jul-21 Oct-21

DRRD IN Equity Sensex

India Equity Research Pharmaceuticals October 4, 2021

DR REDDY'S LABS COMPANY UPDATE

Kunal Randeria Aashita Jain +91 (22) 6620 3040 +91 (22) 6623 3463 [email protected] [email protected]

Corporate access

Financial model Podcast

Video

Edelweiss Securities Limited

DR REDDY'S LABS

Edelweiss Research is also available on www.edelweissresearch.com, Bloomberg - EDEL, Thomson Reuters, and Factset 73

Financial Statements

Income Statement (INR mn) Year to March FY21A FY22E FY23E FY24E

Total operating income 1,89,722 2,23,099 2,52,347 2,90,567

Gross profit 1,03,077 1,07,534 1,30,715 1,56,906

Employee costs 0 0 0 0

R&D cost 16,541 15,394 16,907 19,177

Other expenses 41,854 43,950 48,703 52,302

EBITDA 44,682 48,189 65,105 85,427

Depreciation 21,384 13,176 13,950 14,581

Less: Interest expense (1,653) (2,100) (2,100) (2,100)

Add: Other income 982 2,000 2,500 3,000

Profit before tax 26,413 39,713 56,356 76,545

Prov for tax 9,175 9,928 13,920 19,136

Less: Exceptional item 8,588 0 0 0

Reported profit 17,238 29,785 42,436 57,409

Adjusted profit 23,679 29,785 42,436 57,409

Diluted shares o/s 166 166 166 166

Adjusted diluted EPS 142.9 179.7 256.1 346.4

DPS (INR) 25.0 30.0 30.0 30.0

Tax rate (%) 34.7 25.0 24.7 25.0

Important Ratios (%) Year to March FY21A FY22E FY23E FY24E

Gross margin 54.3 48.2 51.8 54.0

R&D as a % of sales 8.7 6.9 6.7 6.6

Debt/EBITDA 0.7 0.6 0.5 0.4

EBITDA margin (%) 23.6 21.6 25.8 29.4

Net profit margin (%) 12.5 13.4 16.8 19.8

Revenue growth (% YoY) 8.7 17.6 13.1 15.1

EBITDA growth (% YoY) 9.1 7.8 35.1 31.2

Adj. profit growth (%) (11.2) 25.8 42.5 35.3

Assumptions (%) Year to March FY21A FY22E FY23E FY24E

GDP (YoY %) (6.0) 7.0 6.0 0

Repo rate (%) 3.0 3.5 4.0 0

USD/INR (average) 74.4 73.0 72.0 0

India growth (%) 15.5 23.0 10.0 12.0

US generics (USD mn) 948.1 967.1 1,179.9 1,474.8

Russia & CIS (RUB terms) 23,200.0 24,128.0 26,540.8 28,929.5

PSAI (USD mn) 430.2 473.2 527.7 580.5

Capex (USD mn) 377.6 164.4 138.9 0

Valuation Metrics Year to March FY21A FY22E FY23E FY24E

Diluted P/E (x) 34.5 27.4 19.2 14.2

Price/BV (x) 4.7 4.1 3.5 2.9

EV/EBITDA (x) 18.3 16.6 12.1 8.8

Dividend yield (%) 0.5 0.6 0.6 0.6

Source: Company and Edelweiss estimates

Balance Sheet (INR mn) Year to March FY21A FY22E FY23E FY24E

Share capital 832 832 832 832

Reserves 1,72,230 1,96,049 2,32,519 2,83,961

Shareholders funds 1,73,062 1,96,881 2,33,351 2,84,793

Minority interest 0 0 0 0

Borrowings 30,299 30,299 30,299 30,299

Trade payables 23,744 25,329 24,993 27,465

Other liabs & prov 25,355 25,527 25,707 25,896

Total liabilities 2,54,861 2,80,437 3,16,750 3,70,854

Net block 47,333 46,109 44,081 41,549

Intangible assets 40,216 40,264 38,342 36,793

Capital WIP 9,778 9,778 9,778 9,778

Total fixed assets 97,327 96,151 92,201 88,120

Non current inv 8,333 8,333 8,333 8,333

Cash/cash equivalent 34,507 50,423 62,976 1,01,170

Sundry debtors 49,641 51,955 69,136 79,607

Loans & advances 18,623 21,899 24,770 28,522

Other assets 45,412 50,659 58,316 64,084

Total assets 2,54,861 2,80,437 3,16,750 3,70,854

Free Cash Flow (INR mn) Year to March FY21A FY22E FY23E FY24E

Reported profit 26,413 39,713 56,356 76,545

Add: Depreciation 21,384 13,176 13,950 14,581

Interest (net of tax) 0 0 0 0

Others 1,819 0 0 0

Less: Changes in WC (8,197) (9,079) (27,866) (17,329)

Operating cash flow 35,703 33,882 28,519 54,661

Less: Capex (28,075) (12,000) (10,000) (10,500)

Free cash flow 7,628 21,882 18,519 44,161

Key Ratios Year to March FY21A FY22E FY23E FY24E

RoE (%) 10.5 16.1 19.7 22.2

RoCE (%) 12.8 17.2 21.9 25.5

Inventory days 170 152 164 167

Receivable days 96 83 88 93

Payable days 85 77 76 72

Working cap (% sales) 28.6 28.4 36.2 37.4

Gross debt/equity (x) 0.2 0.2 0.1 0.1

Net debt/equity (x) 0 (0.1) (0.1) (0.2)

Interest coverage (x) 14.1 16.7 24.4 33.7

Valuation Drivers Year to March FY21A FY22E FY23E FY24E

EPS growth (%) (11.2) 25.8 42.5 35.3

RoE (%) 10.5 16.1 19.7 22.2

EBITDA growth (%) 9.1 7.8 35.1 31.2

Payout ratio (%) 24.0 16.7 11.7 8.7

DR REDDY'S LABS

Edelweiss Securities Limited

74 Edelweiss Research is also available on www.edelweissresearch.com, Bloomberg - EDEL, Thomson Reuters, and Factset

Company Description

Dr. Reddy’s is one of the largest Indian generic companies in the world with presence

in more than 40 countries. The US is its largest market, contributing 40% of its

revenues. It has one of the largest complex generic portfolios among Indian generic

players, which has enabled it to become a prominent generic player in the US. Russia

and India are the two other key geographies, where it has significant presence. Apart

from strengths in developing niche generic products, vertical integration into APIs

has enabled it to become a global generic powerhouse. It operates 30 facilities (10

US FDA approved) and is actively supported by an extensive R&D programme. It also

has a deep biosimilar pipeline.

Investment Theme

The past four quarters saw launch of key assets, but uncertainty persists on launch

timelines for gRemodulin, sandostatin LAR, iron sucrose, gCopaxone and gNuvaring.

Further, other lucrative launches are limited until gRevlimid in H2FY23. Opex in India

and EMs, while welcome, are yet to bear fruit. Sputnik V opportunity is also shrinking

as supplies are unlikely to ramp-up until September and two competitor vaccines

could hit the market by then. Fresenius’ potential US pegfilgrastim launch is likely to

gain traction only in FY23 post Onpro kind device launch. We await evidence of

investments fructifying and US pipeline monetization before we turn positive again.

Key risks

Delay in approval of key complex products

Regulatory risk from plant inspections

Failure to get approvals for biosimilars and delays in ramp up of proprietary pipeline

Currency fluctuation

Edelweiss Securities Limited

DR REDDY'S LABS

Edelweiss Research is also available on www.edelweissresearch.com, Bloomberg - EDEL, Thomson Reuters, and Factset 75

Additional Data

Management

Chairman K Satish Reddy

Co Chairman and MD

GV Prasad

CEO Mr. Erez Israeli

CFO Parag Agarwal

Auditor S.R. Batliboi & Associates LLP

Holdings – Top 10* % Holding % Holding

Blackrock 4.34 Aditya Birla Su 1.82

First State 3.89 Vanguard 1.68

Mitsubishi UFJ 3.54 Mirae 1.42

LIC 2.34 ICICI PruLife 1.38

SBI Funds 2.11 UTI 1.22

*Latest public data

Recent Company Research Date Title Price Reco

27-Jul-21 Testing times ahead ; Result Update 4843.35 Hold

15-Jun-21 Going from strength to strength; Company Update

5196.85 Buy

15-May-21 Steady Q4; double-digit growth ahead; Result Update

5196.85 Buy

Recent Sector Research Date Name of Co./Sector Title

17-Sep-21 Biocon Serum deal: Execution awaited; Company Update

16-Aug-21 Ajanta Pharma In cruise mode; Company Update

16-Aug-21 Glenmark Pharma. Value unlocking yet to gain traction; Result Update

Rating Interpretation

Source: Bloomberg, Edelweiss research

Daily Volume

Source: Bloomberg

Rating Distribution: Edelweiss Research Coverage

Buy Hold Reduce Total

Rating Distribution* 177 54 19 251

>50bn >10bn and <50bn <10bn Total

Market Cap (INR) 226 41 3 270

*1 stocks under review

Rating Rationale

Rating Expected absolute returns over 12 months

Buy: >15%

Hold: >15% and <-5%

Reduce: <-5%

TP3,450

TP3,400

TP5,600

TP5,265

2325

2980

3635

4290

4945

5600

Oct-18 Apr-19 Oct-19 Apr-20 Oct-20 Apr-21

(IN

R)

DRRD IN Equity Buy Hold Reduce0

6

12

18

24

30

Oct-18 Apr-19 Oct-19 Apr-20 Oct-20 Apr-21

(Mn

)

Edelweiss Research is also available on www.edelweissresearch.com, Bloomberg - EDEL, Thomson Reuters, and Factset Edelweiss Securities Limited

KEY DATA

Rating HOLD Sector relative Neutral Price (INR) 513 12 month price target (INR) 570 Market cap (INR bn/USD bn) 145/2.0 Free float/Foreign ownership (%) 53.4/26.8

What’s Changed Target Price

Rating/Risk Rating ⚊

INVESTMENT METRICS

Some green shoots, some uncertainties

We remain neutral on Glenmark as signs of operational improvement in core business await value unlocking in other parts. Domestic footprint is strong and US launch trajectory has improved, while GLS listing should help pare down debt. We await Ichnos fund-raising, NCE partnership and Ryaltris roll-out.

We forecast 8%/5% FY21–24 revenue/PAT CAGR. gSpiriva EU launch; gBrovana, theophylline in the US are likely to be partly offset by price erosion. While GLS proceeds would offset debt, debt repayment from organic cash flow proceeds is to be seen and with Ryaltris delay and no progress on Ichnos fund-raising, we reduce multiple marginally to 17x (from 18x). Maintain ‘HOLD’ with a TP of INR570 (from INR630).

FINANCIALS (INR mn)

Year to March FY21A FY22E FY23E FY24E

Revenue 1,09,440 1,22,107 1,26,199 1,36,061

EBITDA 20,845 22,486 22,315 24,281

Adjusted profit 9,393 9,717 9,649 10,796

Diluted EPS (INR) 33.3 34.4 34.2 38.3

EPS growth (%) 24.7 3.4 (0.7) 11.9

RoAE (%) 14.8 12.3 10.6 10.9

P/E (x) 15.3 14.8 14.9 13.4

EV/EBITDA (x) 9.4 8.0 7.8 7.0

Dividend yield (%) 0.5 0.5 0.5 0.5

PRICE PERFORMANCE

Still awaiting execution; awaiting triggers to play out in H2FY22

GNP’s core business promises aplenty: the company clocked >12% growth in key

therapies in India such as cardiac, anti-diabetic and respiratory driven by niche

launches and market penetration. Going forward, India is expected to clock double-

digit growth. Similarly, past couple of quarters have seen niche launches such as

gBrovana, theophylline and gQudexy, among others, but double-digit growth is

elusive as the company grapples with price erosion. gSpiriva is a promising launch,

but execution in the EU remains to be seen.

Specialty unlocking awaited

GNP has invested ~USD700m in its innovation business to date, and intends to raise

capital for Ichnos to fund the pipeline. While we note management’s efforts to

expand into NCEs, it has had limited success in partnering ISB 830, ISB 880 and ISC

17536. Before we turn positive, we await signs of better execution in the form of

gSpiriva and Ryaltris ramp-up in the EU, Ryaltris’s US approval and launch, and fund-

raising in Ichnos. While INR8bn from GLS proceeds is welcome, whether

management can generate enough organic FCF to pay off further debt remains to be

seen. Thus, while potential is aplenty, we await triggers to play out before turning

more positive on the stock.

Explore:

Outlook and valuation: Challenges persist; maintain ‘HOLD’

Though GNP is trading at a discount to peers, limited growth drivers and visibility on

free cash flow and a highly leveraged balance sheet limit upside potential. Hence,

we maintain ‘HOLD/SN’ with a revised TP of INR570 (17x Mar-2023E EPS; earlier

INR630).

0

10

20

30

Sales Growth(%)

EPS Growth(%)

RoE(%)

PE(x)

Pharmaceuticals GNP IN Equity

38,000

42,600

47,200

51,800

56,400

61,000

425

480

535

590

645

700

Oct-20 Jan-21 Apr-21 Jul-21 Oct-21

GNP IN Equity Sensex

India Equity Research Pharmaceuticals October 4, 2021

GLENMARK PHARMA. COMPANY UPDATE

Kunal Randeria Aashita Jain +91 (22) 6620 3040 +91 (22) 6623 3463 [email protected] [email protected]

Corporate access

Financial model Podcast

Video

Edelweiss Securities Limited

GLENMARK PHARMA.

Edelweiss Research is also available on www.edelweissresearch.com, Bloomberg - EDEL, Thomson Reuters, and Factset 77

Financial Statements

Income Statement (INR mn) Year to March FY21A FY22E FY23E FY24E

Total operating income 1,09,440 1,22,107 1,26,199 1,36,061

Gross profit 72,452 78,935 81,581 87,956

Employee costs 23,437 25,312 27,337 29,524

R&D cost 12,210 13,554 13,756 14,559

Other expenses 15,960 17,583 18,173 19,593

EBITDA 20,845 22,486 22,315 24,281

Depreciation 4,436 5,133 5,485 5,838

Less: Interest expense 3,531 3,065 2,465 2,240

Add: Other income 502 750 750 750

Profit before tax 13,380 15,038 15,115 16,953

Prov for tax 4,124 4,511 4,535 5,086

Less: Exceptional item 446 0 0 0

Reported profit 9,702 9,717 9,649 10,796

Adjusted profit 9,393 9,717 9,649 10,796

Diluted shares o/s 282 282 282 282

Adjusted diluted EPS 33.3 34.4 34.2 38.3

DPS (INR) 2.5 2.5 2.5 2.8

Tax rate (%) 30.8 30.0 30.0 30.0

Important Ratios (%) Year to March FY21A FY22E FY23E FY24E

Gross margin 66.2 64.6 64.6 64.6

R&D as a % of sales 11.2 11.1 10.9 10.7

Net Debt/EBITDA 1.7 0.9 0.6 0.3

EBITDA margin (%) 19.0 18.4 17.7 17.8

Net profit margin (%) 8.6 8.0 7.6 7.9

Revenue growth (% YoY) 2.8 11.6 3.4 7.8

EBITDA growth (% YoY) 22.8 7.9 (0.8) 8.8

Adj. profit growth (%) 24.7 3.4 (0.7) 11.9

Assumptions (%) Year to March FY21A FY22E FY23E FY24E

GDP (YoY %) (4.0) 7.0 6.0 6.0

Repo rate (%) 3.0 4.0 4.0 4.0

USD/INR (average) 74.1 73.0 72.0 72.0

India growth (%) 10.4 20.4 (3.5) 9.0

US generics (USD mn) 415.8 449.1 480.5 514.1

API growth (%) 17.9 8.0 8.0 8.0

Europe growth (%) 6.3 10.0 10.0 8.0

Branded exports (%) (7.4) 6.8 7.0 7.0

Capex (USD mn) 91.1 102.7 104.2 104.2

Valuation Metrics Year to March FY21A FY22E FY23E FY24E

Diluted P/E (x) 15.3 14.8 14.9 13.4

Price/BV (x) 2.0 1.7 1.5 1.4

EV/EBITDA (x) 9.4 8.0 7.8 7.0

Dividend yield (%) 0.5 0.5 0.5 0.5

Source: Company and Edelweiss estimates

Balance Sheet (INR mn) Year to March FY21A FY22E FY23E FY24E

Share capital 282 282 282 282

Reserves 70,364 86,561 94,574 1,03,509

Shareholders funds 70,646 86,843 94,856 1,03,791

Minority interest (4) 806 1,738 2,809

Borrowings 46,870 34,870 30,870 28,870

Trade payables 22,378 26,119 26,994 29,103

Other liabs & prov (3,409) 2,295 2,704 3,690

Total liabilities 1,40,689 1,55,140 1,61,369 1,72,471

Net block 64,525 66,893 68,908 70,570

Intangible assets 580 580 580 580

Capital WIP 0 0 0 0

Total fixed assets 65,105 67,473 69,488 71,150

Non current inv 0 0 0 0

Cash/cash equivalent 11,392 15,144 16,994 20,737

Sundry debtors 25,721 28,697 29,659 31,977

Loans & advances 13,715 15,263 15,775 17,008

Other assets 22,768 26,575 27,465 29,611

Total assets 1,40,689 1,55,140 1,61,369 1,72,471

Free Cash Flow (INR mn) Year to March FY21A FY22E FY23E FY24E

Reported profit 9,702 9,717 9,649 10,796

Add: Depreciation 4,436 5,133 5,485 5,838

Interest (net of tax) 3,501 2,315 1,715 1,490

Others 2,635 0 0 0

Less: Changes in WC (3,858) 1,113 (1,079) (2,601)

Operating cash flow 11,312 18,278 15,770 15,522

Less: Capex (6,753) (7,500) (7,500) (7,500)

Free cash flow 4,559 10,778 8,270 8,022

Key Ratios Year to March FY21A FY22E FY23E FY24E

RoE (%) 14.8 12.3 10.6 10.9

RoCE (%) 15.2 15.1 14.1 14.6

Inventory days 218 209 221 217

Receivable days 83 81 84 83

Payable days 215 205 217 213

Working cap (% sales) 25.7 22.2 22.3 22.6

Gross debt/equity (x) 0.7 0.4 0.3 0.3

Net debt/equity (x) 0.5 0.2 0.1 0.1

Interest coverage (x) 4.6 5.7 6.8 8.2

Valuation Drivers Year to March FY21A FY22E FY23E FY24E

EPS growth (%) 24.7 3.4 (0.7) 11.9

RoE (%) 14.8 12.3 10.6 10.9

EBITDA growth (%) 22.8 7.9 (0.8) 8.8

Payout ratio (%) 7.3 7.3 7.3 7.3

GLENMARK PHARMA.

Edelweiss Securities Limited

78 Edelweiss Research is also available on www.edelweissresearch.com, Bloomberg - EDEL, Thomson Reuters, and Factset

Company Description

GNP is a research driven company and has established presence globally. US & India

are its largest markets and contribute 60% to revenue. In India, it is among the top25

companies and is among the fastest growing companies. In the US, it has achieved

reasonable scale by launching products in niche categories like derma, hormones,

controlled substances and modified release products. The company is also gradually

gaining scale in emerging markets like Brazil, Mexico, Russia and eastern European

countries.

Investment Theme

While base business remains steady and API continue to benefit from China+1

strategy, we are yet to see meaningful recovery in the US and EU inhalation

launches. Also, covid opportunity itself is limited. GNP is looking to out-license ISB

830 and ISB 880 and is in active discussions with potential partners for biosimilar

Xolair (before it initiates phase-III trials) and fund raising for Ichnos. While the fund

raise may alleviate some concern around leveraged balance sheet, we still await for

deals to materialise.

Key Risks

Slowdown in ANDA approvals and USFDA related regulatory risks are part of the

generics business.

Currency risk in LatAm and Russia.

Setback on the novel research pipeline could hurt multiples.

Edelweiss Securities Limited

GLENMARK PHARMA.

Edelweiss Research is also available on www.edelweissresearch.com, Bloomberg - EDEL, Thomson Reuters, and Factset 79

Additional Data

Management

Chairman & MD Glenn Saldanha

Executive Director & CFO V. S. Mani

COO Gagan Sehgal

Click or tap here to enter text.

Auditor Walker Chandiok & Co. LLP

Holdings – Top 10* % Holding % Holding

HDFC Asset Mgmt 2.20 Bajaj Alliance 1.13

LIC 1.76 BlackRock Inc 0.88

Vanguard 1.64 Aditya Birla 0.84

HSBC Holdings P 1.54 Bellevue group 0.65

Ellipsis Partne 1.29 Dimensional Fun 0.55

*Latest public data

Recent Company Research Date Title Price Reco

16-Aug-21 Value unlocking yet to gain traction; Result Update

569 Hold

31-May-21 Awaiting triggers to play out; Result Update

608 Hold

17-Feb-21 Business steady; deleveraging priority; Company Update

491 Hold

Recent Sector Research Date Name of Co./Sector Title

17-Sep-21 Biocon Serum deal: Execution awaited; Company Update

16-Aug-21 Ajanta Pharma In cruise mode; Company Update

13-Aug-21 Aurobindo Pharma Unsurprising miss; Result Update

Rating Interpretation

Source: Bloomberg, Edelweiss research

Daily Volume

Source: Bloomberg

Rating Distribution: Edelweiss Research Coverage

Buy Hold Reduce Total

Rating Distribution* 177 54 19 251

>50bn >10bn and <50bn <10bn Total

Market Cap (INR) 226 41 3 270

*1 stocks under review

Rating Rationale

Rating Expected absolute returns over 12 months

Buy: >15%

Hold: >15% and <-5%

Reduce: <-5%

TP660

TP345

TP545

175

280

385

490

595

700

Oct-18 Apr-19 Oct-19 Apr-20 Oct-20 Apr-21

(IN

R)

GNP IN Equity Buy Hold Reduce0

20

40

60

80

100

Oct-18 Apr-19 Oct-19 Apr-20 Oct-20 Apr-21

(Mn

)

Edelweiss Research is also available on www.edelweissresearch.com, Bloomberg - EDEL, Thomson Reuters, and Factset Edelweiss Securities Limited

KEY DATA

Rating BUY Sector relative Outperformer Price (INR) 2,424 12 month price target (INR) 2,800 Market cap (INR bn/USD bn) 307/4.1 Free float/Foreign ownership (%) 53.7/17.8

What’s Changed Target Price

Rating/Risk Rating ⚊

INVESTMENT METRICS

Growth levers intact

We remain positive on Ipca Laboratories as revenue potential remains intact: pain, CVS and derma continue to turn in market-leading growth, while generics recover led by EU and branded grows at a steady pace. Regulatory resolution in FY23 can provide further support to the stock’s re-rating in the short run.

We model in a 13% revenue CAGR, but PAT CAGR is likely to be ~9% as margin reverts to ~26% and a higher tax rate kicks in from FY24. While we appreciate the moat, an optically weak earnings CAGR and limited potential for a further re-rating constrain our multiple to 25x. We are increasing FY23E EPS by 5% on Ipca’s strong domestic outlook. Retain ‘BUY’ with a TP of INR2,800 (earlier INR2,550) as we roll over to FY23E.

FINANCIALS (INR mn)

Year to March FY21A FY22E FY23E FY24E

Revenue 54,199 60,511 69,055 77,681

EBITDA 15,443 15,697 18,864 21,329

Adjusted profit 11,410 11,613 14,216 14,997

Diluted EPS (INR) 90.0 91.5 112.1 118.2

EPS growth (%) 77.0 1.8 22.4 5.5

RoAE (%) 27.4 22.5 22.9 20.4

P/E (x) 26.9 26.5 21.6 20.5

EV/EBITDA (x) 19.2 18.7 15.2 13.0

Dividend yield (%) 0.7 0.8 0.9 1.0

PRICE PERFORMANCE

Business levers intact; entering a period of steady growth

We forecast a 13% revenue CAGR over FY21–FY24 as: i) domestic pain franchise

complemented by cardiac, derma, ophthal would drive a 14% CAGR; ii) with UK

partner issues behind, a steady EU business should drive mid-teens growth in generic

exports; and iii) API remains on solid footing with industry-leading margin. And while

capacity expansion and backward integration are welcome, this is unlikely to lead to

more than 10% growth as sartan opportunity fades. We have not built in US revenue,

but believe Ipca is the only company capable of staging a V-shaped recovery given

backward integration of its ANDAs.

Margins to remain buoyant; capacity constraints could continue

The company is operating at 90% plant utilisation levels and API capacity is the only

constraint that we envisage at this stage, although de-bottlenecking should ease up

some capacity. The company plans to incur INR2.5bn capex on Dewas (to come on

stream in early FY23) and INR1bn on Ratlam. These two plants are expected to add

15% to existing capacity. Furthermore, backward integration project at the

Aurangabad site and Nobel Explochem site capex are also on the cards. We expect

opex control and backward integration to continue to drive margin to 26–27% in the

next two–three years, but positive surprises to this are unlikely.

Explore:

Outlook and valuation: Growth levers intact; maintain ‘BUY’

While the FDA timelines remain uncertain, Ipca’s business is much more stable than

peers. The company’s high-quality pain franchise, leadership in APIs and cost control

make it least vulnerable to margin shocks. However, Ipca has been the beneficiary

of several one-offs such as HCQs during covid and sartan opportunities in API, which

have helped push its margin up by ~600bps over the last 18 months. Hence, FY22

growth looks challenging but FY23 should see normal growth resuming.

Considering Ipca is operating around peak margins, we are not building in margin

expansion, but PAT CAGR looks optically modest as effective tax rate increases from

18–19% to 25% by FY24. We value Ipca at 25x Mar-23E multiple, which yields a target

price of INR2,800.

0

10

20

30

Sales Growth(%)

EPS Growth(%)

RoE(%)

PE(x)

Pharmaceuticals IPCA IN Equity

38,000

42,600

47,200

51,800

56,400

61,000

1,800

1,970

2,140

2,310

2,480

2,650

Oct-20 Jan-21 Apr-21 Jul-21 Oct-21

IPCA IN Equity Sensex

India Equity Research Pharmaceuticals October 4, 2021

IPCA LABORATORIES COMPANY UPDATE

Kunal Randeria Aashita Jain +91 (22) 6620 3040 +91 (22) 6623 3463 [email protected] [email protected]

Corporate access

Financial model Podcast

Video

Edelweiss Securities Limited

IPCA LABORATORIES

Edelweiss Research is also available on www.edelweissresearch.com, Bloomberg - EDEL, Thomson Reuters, and Factset 81

Financial Statements

Income Statement (INR mn) Year to March FY21A FY22E FY23E FY24E

Total operating income 54,199 60,511 69,055 77,681

Gross profit 36,916 40,240 46,129 51,891

Employee costs 10,136 11,352 12,487 13,861

R&D cost 1,409 1,483 1,588 1,864

Other expenses 7,761 9,288 10,427 11,730

EBITDA 15,443 15,697 18,864 21,329

Depreciation 2,092 2,150 2,350 2,580

Less: Interest expense 90 74 74 74

Add: Other income 628 781 989 1,421

Profit before tax 13,889 14,254 17,428 20,095

Prov for tax 2,401 2,566 3,137 5,024

Less: Exceptional item 0 0 0 0

Reported profit 11,410 11,613 14,216 14,997

Adjusted profit 11,410 11,613 14,216 14,997

Diluted shares o/s 127 127 127 127

Adjusted diluted EPS 90.0 91.5 112.1 118.2

DPS (INR) 18.0 18.3 22.4 23.6

Tax rate (%) 17.3 18.0 18.0 25.0

Important Ratios (%) Year to March FY21A FY22E FY23E FY24E

Gross margin 68.1 66.5 66.8 66.8

R&D as a % of sales 2.6 2.5 2.3 2.4

Net Debt/EBITDA (0.4) (0.5) (0.8) (1.1)

EBITDA margin (%) 28.5 25.9 27.3 27.5

Net profit margin (%) 21.1 19.2 20.6 19.3

Revenue growth (% YoY) 16.6 11.6 14.1 12.5

EBITDA growth (% YoY) 70.3 1.6 20.2 13.1

Adj. profit growth (%) 77.9 1.8 22.4 5.5

Assumptions (%) Year to March FY21A FY22E FY23E FY24E

GDP (YoY %) (6.0) 7.0 6.0 6.0

Repo rate (%) 3.0 3.5 4.0 4.0

USD/INR (average) 74.0 73.0 72.0 72.0

India growth (%) 3.6 18.5 15.0 15.0

Export generics (%) 21.8 8.0 18.0 15.0

Export branded (%) 5.7 12.5 14.0 12.0

API growth (%) 28.4 4.7 15.2 10.4

Institutional (USD mn) 52.1 55.7 55.7 55.7

Capex (USD mn) 48.9 82.2 41.7 0

Valuation Metrics Year to March FY21A FY22E FY23E FY24E

Diluted P/E (x) 26.9 26.5 21.6 20.5

Price/BV (x) 6.5 5.5 4.5 3.9

EV/EBITDA (x) 19.2 18.7 15.2 13.0

Dividend yield (%) 0.7 0.8 0.9 1.0

Source: Company and Edelweiss estimates

Balance Sheet (INR mn) Year to March FY21A FY22E FY23E FY24E

Share capital 254 254 254 254

Reserves 46,763 56,053 67,426 79,423

Shareholders funds 47,017 56,307 67,680 79,677

Minority interest 145 145 145 145

Borrowings 1,857 1,857 1,857 1,857

Trade payables 6,662 7,775 8,794 9,892

Other liabs & prov 4,983 4,983 4,983 4,983

Total liabilities 60,664 71,068 83,459 96,555

Net block 20,770 24,620 25,270 25,690

Intangible assets 466 466 466 466

Capital WIP 1,837 1,837 1,837 1,837

Total fixed assets 23,073 26,923 27,573 27,993

Non current inv 1,114 1,114 1,114 1,114

Cash/cash equivalent 7,589 9,564 17,440 26,055

Sundry debtors 8,118 11,108 12,676 14,259

Loans & advances 4,823 4,823 4,823 4,823

Other assets 15,948 17,537 19,834 22,311

Total assets 60,664 71,068 83,459 96,555

Free Cash Flow (INR mn) Year to March FY21A FY22E FY23E FY24E

Reported profit 11,410 11,613 14,216 14,997

Add: Depreciation 2,092 2,150 2,350 2,580

Interest (net of tax) 0 0 0 0

Others (237) 0 0 0

Less: Changes in WC (2,363) (3,465) (2,847) (2,963)

Operating cash flow 10,901 10,298 13,719 14,614

Less: Capex (3,616) (6,000) (3,000) (3,000)

Free cash flow 7,286 4,298 10,719 11,614

Key Ratios Year to March FY21A FY22E FY23E FY24E

RoE (%) 27.4 22.5 22.9 20.4

RoCE (%) 31.2 26.7 27.3 26.7

Inventory days 308 301 297 298

Receivable days 57 58 63 63

Payable days 135 130 132 132

Working cap (% sales) 49.1 53.0 62.0 70.0

Gross debt/equity (x) 0 0 0 0

Net debt/equity (x) (0.1) (0.1) (0.2) (0.3)

Interest coverage (x) 147.7 182.3 222.3 252.4

Valuation Drivers Year to March FY21A FY22E FY23E FY24E

EPS growth (%) 77.0 1.8 22.4 5.5

RoE (%) 27.4 22.5 22.9 20.4

EBITDA growth (%) 70.3 1.6 20.2 13.1

Payout ratio (%) 20.0 20.0 20.0 20.0

IPCA LABORATORIES

Edelweiss Securities Limited

82 Edelweiss Research is also available on www.edelweissresearch.com, Bloomberg - EDEL, Thomson Reuters, and Factset

Company Description

From a company which was known for anti-malarials and an API manufacturer in the

past, its business has evolved into a full-fledged global Pharma company with

multiple segments spanning multiple countries. IPCA is a vertically integrated

company with a diverse presence across geographies including India, Africa, Asia,

Australia, Europe and the US. It boasts of high level of vertical integration that has

enabled leadership in various segments and delivered good profitability at the same

time. India business is its largest business where it has consistently beaten market

growth over the years. Exports formulations account for almost 50% of its revenues

with branded generics business accounting for 1/4th of exports. While branded

generics continue to register steady growth, the growth in exports will be driven by

the generics business (US, EU and Institutional malaria).

Investment Theme

Ipca has had a strong execution track record in the past years along with maintaining

healthy balance sheet (low net D/E) despite an investment phase. Even without US,

Ipca is likely to report double-digit growth as: a) main domestic therapies pain and

CVS continue to post market-leading growth; b) API exports to remain strong as Ipca

bolsters sartans over its existing portfolio; and c) recovery in generics led by EU. Ipca

has a moat w.r.t. cost leadership in several APIs, enabling it to be cheapest supplier

in the world. With domestic and APIs contributing ~70% to revenue, Ipca deserves

to trade at a premium.

Key Risks

Cross Currency impacts could hurt earnings.

Regulatory risks wrt to USFDA inspection

Edelweiss Securities Limited

IPCA LABORATORIES

Edelweiss Research is also available on www.edelweissresearch.com, Bloomberg - EDEL, Thomson Reuters, and Factset 83

Additional Data

Management

Chairman, MD and CEO Premchand Godha

Joint Managing Director/CFO Ajit Kumar Jain

Executive Director Pranay Godha

Executive Director Prashant Godha

Auditor G. M. Kapadia & Co

Holdings – Top 10* % Holding % Holding

DSP 4.56 Vanguard 1.68

HDFC AMC 3.36 L&T MF 1.62

HDFC Life 2.02 Mirae 1.58

Blackrock 1.99 UTI 1.52

ICICI Pru AMC 1.76 Axis AMC 1.38

*Latest public data

Recent Company Research Date Title Price Reco

06-Aug-21 The going remains strong; Result Update

2,171 Buy

31-May-21 Revenue trajectory unaltered; Result Update

2,071 Buy

05-Feb-21 Growth levers intact; outlook solid; Result Update

1,932 Buy

Recent Sector Research Date Name of Co./Sector Title

17-Sep-21 Biocon Serum deal: Execution awaited; Company Update

16-Aug-21 Ajanta Pharma In cruise mode; Company Update

16-Aug-21 Glenmark Pharma. Value unlocking yet to gain traction; Result Update

Rating Interpretation

Source: Bloomberg, Edelweiss research

Daily Volume

Source: Bloomberg

Rating Distribution: Edelweiss Research Coverage

Buy Hold Reduce Total

Rating Distribution* 177 54 19 251

>50bn >10bn and <50bn <10bn Total

Market Cap (INR) 226 41 3 270

*1 stocks under review

Rating Rationale

Rating Expected absolute returns over 12 months

Buy: >15%

Hold: >15% and <-5%

Reduce: <-5%

TP2,400

TP780

TP1,340

600

1010

1420

1830

2240

2650

Oct-18 Apr-19 Oct-19 Apr-20 Oct-20 Apr-21

(IN

R)

IPCA IN Equity Buy Hold Reduce0

2

4

6

8

10

Oct-18 Apr-19 Oct-19 Apr-20 Oct-20 Apr-21

(Mn

)

Edelweiss Research is also available on www.edelweissresearch.com, Bloomberg - EDEL, Thomson Reuters, and Factset Edelweiss Securities Limited

KEY DATA

Rating HOLD Sector relative Neutral Price (INR) 966 12 month price target (INR) 1,060 Market cap (INR bn/USD bn) 439/5.9 Free float/Foreign ownership (%) 53.2/18.6

What’s Changed Target Price

Rating/Risk Rating ⚊

INVESTMENT METRICS

Success hinges on pipeline execution

We await revenue uptick at Lupin (LPC), which remains elusive as erosion in profitable molecules offset gains from launches and domestic growth. Over the medium term Lupin has a healthy pipeline comprising gRevlimid, gSpiriva, pegfilgrastim, Suprep Bowel kit, and Fostair ramp-up, among others, that is expected to give boost from FY23. With the bulk of cost levers having played out, margin expansion

hinges on successful execution of its pipeline.

We maintain ‘HOLD’ as near-term uncertainties persist regarding approval and launch, as well as USFDA inspection timelines. Our TP is based on 24x core FY23E EPS and INR110/share NPV-derived value for specialty/ gRevlimid that yield a TP of INR1,060 (earlier INR1,090).

FINANCIALS (INR mn)

Year to March FY21A FY22E FY23E FY24E

Revenue 1,51,630 1,67,492 1,92,119 2,32,074

EBITDA 25,669 30,122 39,663 53,692

Adjusted profit 12,165 15,467 22,245 32,224

Diluted EPS (INR) 26.8 34.1 49.0 71.0

EPS growth (%) 16.6 27.1 43.9 44.9

RoAE (%) 9.2 10.8 14.1 18.1

P/E (x) 35.7 28.1 19.5 13.5

EV/EBITDA (x) 17.0 14.5 10.8 7.8

Dividend yield (%) 0.6 0.8 1.1 1.7

PRICE PERFORMANCE

Promising pipeline; execution remains key

While US may face pressure in the near term owing to famotidine erosion and

potential levo competition, the pipeline remains strong. It comprises FTF-like Suprep

bowel kit, high-value launches such as gRevlimid, niche ones such as gSpiriva,

gDulera, and biosimilars. Expansion of bEnbrel and gFostair in the EU are also

promising. The company has also seen a sharp uptick in albuterol share, which it

believes will reflect from Q3. With the bulk of opex control behind, further margin

expansion is contingent on successful launch and execution of pipeline. There is no

FDA clarity on re-inspection of OAI/warning letter of the affected plants.

Biosimilar starting to evolve; complex injectable a hard nut to crack

In biosimilar, LPC has filed BLA for Pegfilgrastim in the US, which is expected to be

launched in FY23. Global Phase III study for biosimilar Ranibizumab for the US is

going on, and LPC is also developing Aflibercept biosimilar. Also looking to expand

access to bEnbrel across the EU. LPC is making good progress in complex injectables,

and expects exhibits for at least two peptide products in FY22. Depo injectable -

Risperdal consta being in clinicals, expected filing is FY23. Moreover, LPC invested

about INR20bn in FY21 in Nanomi, specialising in microsphere and nanoparticle R&D

of long acting injectables.

Explore:

Outlook and valuation: Near-term uncertainties; maintain ‘HOLD

LPC’s pipeline is one of the strongest: inhalation, biosimilar and injectables.

However, approval and execution remain key considering modest track record in

levo, albuterol and Solosec. Besides, with majority of specialty cost restructuring

done, further cost levers are awaited while margin expansion is contingent on

launches.

LPC trades at ~28x/24x FY22/23E core earnings (ex-specialty NPV), and our FY21–

24E EPS CAGR of 37% prices in a full recovery with limited room for an upgrade. We

are assigning 24x to core FY23E EPS and derive an NPV of INR95/share for specialty/

gRevlimid; they sum up to a TP of INR1,060 (earlier INR1,090) along with a valuation

rollover to FY23E. Retain ‘HOLD/SN’.

10

15

20

25

30

Sales Growth(%)

EPS Growth(%)

RoE(%)

PE(x)

Pharmaceuticals LPC IN Equity

38,000

42,600

47,200

51,800

56,400

61,000

850

930

1,010

1,090

1,170

1,250

Oct-20 Jan-21 Apr-21 Jul-21 Oct-21

LPC IN Equity Sensex

India Equity Research Pharmaceuticals October 4, 2021

LUPIN COMPANY UPDATE

Kunal Randeria Aashita Jain +91 (22) 6620 3040 +91 (22) 6623 3463 [email protected] [email protected]

Corporate access

Financial model Podcast

Video

Edelweiss Securities Limited

LUPIN

Edelweiss Research is also available on www.edelweissresearch.com, Bloomberg - EDEL, Thomson Reuters, and Factset 85

Financial Statements

Income Statement (INR mn) Year to March FY21A FY22E FY23E FY24E

Total operating income 1,51,630 1,67,492 1,92,119 2,32,074

Gross profit 98,008 1,05,090 1,22,271 1,51,180

Employee costs 28,259 31,085 34,193 37,613

R&D cost 14,324 14,907 16,714 20,190

Other expenses 29,756 28,976 31,700 39,685

EBITDA 25,669 30,122 39,663 53,692

Depreciation 8,874 8,915 9,582 9,998

Less: Interest expense 1,407 1,339 1,339 1,339

Add: Other income 1,363 1,602 1,722 1,800

Profit before tax 16,764 21,500 30,504 44,195

Prov for tax 4,485 5,797 7,921 11,480

Less: Exceptional item 0 0 0 0

Reported profit 12,165 15,467 22,245 32,224

Adjusted profit 12,165 15,467 22,245 32,224

Diluted shares o/s 454 454 454 454

Adjusted diluted EPS 26.8 34.1 49.0 71.0

DPS (INR) 6.0 7.6 11.0 15.9

Tax rate (%) 26.8 27.0 26.0 26.0

Important Ratios (%) Year to March FY21A FY22E FY23E FY24E

Gross margin 64.6 62.7 63.6 65.1

R&D as a % of sales 9.4 8.9 8.7 8.7

Net Debt/EBITDA 0.3 0.2 0 (0.2)

EBITDA margin (%) 16.9 18.0 20.6 23.1

Net profit margin (%) 8.0 9.2 11.6 13.9

Revenue growth (% YoY) (1.4) 10.5 14.7 20.8

EBITDA growth (% YoY) 9.0 17.3 31.7 35.4

Adj. profit growth (%) 16.8 27.2 43.8 44.9

Assumptions (%) Year to March FY21A FY22E FY23E FY24E

GDP (YoY %) (6.0) 7.0 6.0 0

Repo rate (%) 3.0 3.5 4.0 0

USD/INR (average) 76.2 75.0 72.0 0

India growth (%) 2.6 18.0 11.0 10.0

US generics (USD mn) 720.0 756.0 945.0 1,320.0

API (USD mn) 181.4 189.8 225.4 248.0

EMEA growth (%) 3.4 24.1 9.1 11.0

Growth markets (%) 8.5 (2.0) 19.5 16.0

Capex (USD mn) 88.9 133.3 97.2 97.2

Valuation Metrics Year to March FY21A FY22E FY23E FY24E

Diluted P/E (x) 35.7 28.1 19.5 13.5

Price/BV (x) 3.2 2.9 2.6 2.3

EV/EBITDA (x) 17.0 14.5 10.8 7.8

Dividend yield (%) 0.6 0.8 1.1 1.7

Source: Company and Edelweiss estimates

Balance Sheet (INR mn) Year to March FY21A FY22E FY23E FY24E

Share capital 907 907 907 907

Reserves 1,37,124 1,48,429 1,64,688 1,89,710

Shareholders funds 1,38,031 1,49,337 1,65,596 1,90,617

Minority interest 550 550 550 550

Borrowings 47,828 47,828 47,828 47,828

Trade payables 20,144 27,354 30,618 35,460

Other liabs & prov 34,218 34,610 35,022 35,022

Total liabilities 2,51,475 2,70,383 2,90,317 3,20,181

Net block 61,331 62,415 59,833 56,835

Intangible assets 19,624 19,624 19,624 19,624

Capital WIP 8,515 8,515 8,515 8,515

Total fixed assets 89,470 90,555 87,973 84,974

Non current inv 319 319 319 319

Cash/cash equivalent 41,193 40,573 49,015 59,778

Sundry debtors 44,743 59,655 68,426 82,656

Loans & advances 13,676 13,676 13,676 13,676

Other assets 40,920 44,451 49,755 57,623

Total assets 2,51,475 2,70,383 2,90,317 3,20,181

Free Cash Flow (INR mn) Year to March FY21A FY22E FY23E FY24E

Reported profit 12,165 15,467 22,245 32,224

Add: Depreciation 8,874 8,915 9,582 9,998

Interest (net of tax) 1,407 1,339 1,339 1,339

Others (2,663) 0 0 (1,339)

Less: Changes in WC (1,565) (10,840) (10,399) (17,256)

Operating cash flow 18,218 14,881 22,767 24,966

Less: Capex (6,776) (10,000) (7,000) (7,000)

Free cash flow 11,441 4,881 15,767 17,966

Key Ratios Year to March FY21A FY22E FY23E FY24E

RoE (%) 9.2 10.8 14.1 18.1

RoCE (%) 9.7 11.9 15.5 20.1

Inventory days 257 250 246 242

Receivable days 119 114 122 119

Payable days 151 139 151 149

Working cap (% sales) 30.0 33.6 34.7 36.2

Gross debt/equity (x) 0.3 0.3 0.3 0.3

Net debt/equity (x) 0 0 0 (0.1)

Interest coverage (x) 11.9 15.8 22.5 32.6

Valuation Drivers Year to March FY21A FY22E FY23E FY24E

EPS growth (%) 16.6 27.1 43.9 44.9

RoE (%) 9.2 10.8 14.1 18.1

EBITDA growth (%) 9.0 17.3 31.7 35.4

Payout ratio (%) 22.4 22.4 22.4 22.4

LUPIN

Edelweiss Securities Limited

86 Edelweiss Research is also available on www.edelweissresearch.com, Bloomberg - EDEL, Thomson Reuters, and Factset

Company Description

Lupin over the last decade has established itself as a leading generic player from

India. US and India are its largest markets and contribute almost 60% of its revenues.

While in India it is among the top-10 companies and among the fastest growing, it is

among top5 companies in terms of prescriptions in the US. Lupin has been on an

investment overdrive for the past five years. Lupin focuses on specialty, respiratory

and biosimilars, while in injectables, LPC is a late entrant. The company follows a

mixed strategy comprising both organic and inorganic actions. Specifically, it has

invested ~USD3bn, over the last five years, towards: 1) R&D in complex generics; 2)

capacity expansion; and 3) acquisition of Gavis, Novel and Symbiomix.

Investment Theme

Lupin’s pipeline remains promising with sales growth likely to be driven by levo and

albuterol market share gains, gBrovana launch in the US, bEnbrel expansion and

gFostair launch in the EU, whose effects would be seen in FY22. FY23 onwards, we

expect gDulera and gSpiriva launch. Moreover, H2FY21 underscores the seriousness

in controlling opex. A combination of improving business mix, Solosec loss reversal

and gSpiriva launch drive a potential 37% FY21–24E EPS CAGR. However, approval

and execution remain the key considering modest execution in the past such as in

levo, albuterol and Solosec. Also, with majority of specialty cost restructuring done,

further cost levers are awaited and margin expansion is contingent on launches. Key

triggers are lifting of OAI/Warning letter of the affected plants.

Key Risks

Delay in resolution of warning letter

Inability to scale up Branded business

Slowdown in ANDA approvals and USFDA related regulatory risks are part of the

generics business.

Concentration risk in US portfolio

Currency risk.

Edelweiss Securities Limited

LUPIN

Edelweiss Research is also available on www.edelweissresearch.com, Bloomberg - EDEL, Thomson Reuters, and Factset 87

Additional Data

Management

CEO Ms. Vinita Gupta

CFO Mr. Ramesh Swaminathan

Managing Director

Mr. Nilesh Deshbandhu Gupta

Chairperson Mrs Manju D Gupta

Auditor KPMG

Holdings – Top 10* % Holding % Holding

LIC 6.99 Comgest 1.34

HDFC AMC 4.04 Norges 1.25

Vanguard 1.69 SBI 1.25

Blackrock 1.67 Franklin 1.21

Rakesh Jhunjhun 1.60 Kotak AMC 1.14

*Latest public data

Recent Company Research Date Title Price Reco

11-Aug-21 Soft Q1; near-term pressure visible; Result Update

1051 Hold

13-May-21 Margin recovery along expected lines; Result Update

1212 Hold

29-Jan-21 Recovery underway; Result Update 1008 Hold

Recent Sector Research Date Name of Co./Sector Title

17-Sep-21 Biocon Serum deal: Execution awaited; Company Update

16-Aug-21 Ajanta Pharma In cruise mode; Company Update

16-Aug-21 Glenmark Pharma. Value unlocking yet to gain traction; Result Update

Rating Interpretation

Source: Bloomberg, Edelweiss research

Daily Volume

Source: Bloomberg

Rating Distribution: Edelweiss Research Coverage

Buy Hold Reduce Total

Rating Distribution* 177 54 19 251

>50bn >10bn and <50bn <10bn Total

Market Cap (INR) 226 41 3 270

*1 stocks under review

Rating Rationale

Rating Expected absolute returns over 12 months

Buy: >15%

Hold: >15% and <-5%

Reduce: <-5%

TP1,050

TP900

TP900

TP1,040

525

670

815

960

1105

1250

Oct-18 Apr-19 Oct-19 Apr-20 Oct-20 Apr-21

(IN

R)

LPC IN Equity Buy Hold Reduce0

6

12

18

24

30

Oct-18 Apr-19 Oct-19 Apr-20 Oct-20 Apr-21

(Mn

)

Edelweiss Research is also available on www.edelweissresearch.com, Bloomberg - EDEL, Thomson Reuters, and Factset Edelweiss Securities Limited

KEY DATA

Rating HOLD Sector relative Neutral Price (INR) 903 12 month price target (INR) 970 Market cap (INR bn/USD bn) 165/2.2 Free float/Foreign ownership (%) 51.1/13.7

What’s Changed Target Price

Rating/Risk Rating ⚊

INVESTMENT METRICS

Core business under pressure

Natco is braving headwinds across business lines. Domestic oncology is seeing slower-than-expected recovery while competition has also intensified. Cardio-diabetes too is yet to pick up scale in India. While gRevlimid is likely to turn in ~USD900mn in cumulative cash flow over FY22–26, we are mindful of impending competition in gFosrenol, volume pressure in Copaxone market and gTamiflu uncertainty.

Natco has the highest FY21–24E revenue/PAT CAGR. This is on account of a finite four-year gRevlimid window, whose pricing is uncertain. We are keeping ‘HOLD’ but reducing SoTP-based TP to INR970 (from INR1,045) to model in lower gImbruvica. TP comprises INR540 of core business, INR307 gRevlimid and INR123 from other opportunities.

FINANCIALS (INR mn)

Year to March FY21A FY22E FY23E FY24E

Revenue 20,521 22,286 29,830 40,048

EBITDA 6,062 7,243 13,275 21,025

Adjusted profit 4,402 5,496 10,210 16,351

Diluted EPS (INR) 24.7 30.8 57.3 91.7

EPS growth (%) (2.4) 24.9 85.8 60.2

RoAE (%) 11.2 12.7 20.5 26.5

P/E (x) 35.7 28.6 15.4 9.6

EV/EBITDA (x) 26.2 21.8 11.4 6.6

Dividend yield (%) 0.8 0.9 1.0 0

PRICE PERFORMANCE

gRevlimid lends visibility to earnings, but not without risks

gRevlimid’s fair value stands at INR300, which is ~27% of Natco’s target price of

INR1,045. Given Natco enjoys the best settlement terms, including limited volume

for all players until Jan-26, it is also likely to generate highest cumulative FCF—in our

view, ~USD900mn from FY22–26E. However, the underlying assumption is benign

price erosion, which touches ~35% with 10+ players before genericisation. Hence,

greater-than-expected price erosion could pose downside risk to our gRevlimid

assumptions.

Base business continues to shrink; new avenues of growth from H2

NTCPH’s base portfolio, i.e. business with consistent revenue streams comprising

domestic oncology and exports of gCopaxone, gFosrenol, gDoxil and gTamiflu are

facing pressure on various counts: pricing pressure in oncology and potential

competition to gCopaxone and gFosrenol by year-end. gRevlimid and gNexavar

ensure earnings visibility, but are finite opportunities with best business dynamics

between FY23 and FY25 before tapering sharply. Agrochem faced a setback with the

gCoragen launch now delayed to H2FY22 at best and pheromone launch yet to

create a market. With Natco losing the gImbruvica case, its launch has been delayed

to 2032; hence upside to any molecule seems unlikely.

Explore:

Outlook and valuation: Opportunities priced in; maintain ‘HOLD’

We value NTCPH on an SoTP, ascribing 22x to the base business that yields INR540.

We value gNexavar, gRevlimid and other P-4 opportunities using NPV that yield a fair

value of INR430.

While Natco offers the highest FY21–24 revenue/PAT CAGR among peers, a large

part of this growth is driven by gRevlimid, which is likely to face pressure from FY26.

We are maintaining ‘HOLD’ and reducing the target price to INR970 from (INR1,045)

as we now factor in the launch of gImbruvica tablets in FY32 (delayed from FY27).

5

10

15

20

25

30

Sales Growth(%)

EPS Growth(%)

RoE(%)

PE(x)

Pharmaceuticals NTCPH IN Equity

38,000

42,600

47,200

51,800

56,400

61,000

775

855

935

1,015

1,095

1,175

Oct-20 Jan-21 Apr-21 Jul-21 Oct-21

NTCPH IN Equity Sensex

India Equity Research Pharmaceuticals October 4, 2021

NATCO PHARMA COMPANY UPDATE

Kunal Randeria Aashita Jain +91 (22) 6620 3040 +91 (22) 6623 3463 [email protected] [email protected]

Corporate access

Financial model Podcast

Video

Edelweiss Securities Limited

NATCO PHARMA

Edelweiss Research is also available on www.edelweissresearch.com, Bloomberg - EDEL, Thomson Reuters, and Factset 89

Financial Statements

Income Statement (INR mn) Year to March FY21A FY22E FY23E FY24E

Total operating income 20,521 22,286 29,830 40,048

Gross profit 15,407 17,606 25,058 33,641

Employee costs 4,149 4,346 4,922 5,407

R&D cost 1,436 1,560 2,088 2,803

Other expenses 3,760 4,457 4,773 4,405

EBITDA 6,062 7,243 13,275 21,025

Depreciation 1,169 1,314 1,474 1,633

Less: Interest expense 133 110 87 65

Add: Other income 1,036 1,139 1,210 1,635

Profit before tax 5,796 6,957 12,923 20,963

Prov for tax 1,372 1,461 2,714 4,612

Less: Exceptional item 0 0 0 0

Reported profit 4,402 5,496 10,210 16,351

Adjusted profit 4,402 5,496 10,210 16,351

Diluted shares o/s 178 178 178 178

Adjusted diluted EPS 24.7 30.8 57.3 91.7

DPS (INR) 7.0 8.0 9.0 0

Tax rate (%) 23.7 21.0 21.0 22.0

Important Ratios (%) Year to March FY21A FY22E FY23E FY24E

Gross margin 75.1 79.0 84.0 84.0

R&D as a % of sales 7.0 7.0 7.0 7.0

Net Debt/EBITDA (0.3) (0.4) (0.7) (1.0)

EBITDA margin (%) 29.5 32.5 44.5 52.5

Net profit margin (%) 21.5 24.7 34.2 40.8

Revenue growth (% YoY) 11.1 8.8 34.4 34.7

EBITDA growth (% YoY) 4.1 19.5 83.3 58.4

Adj. profit growth (%) (3.9) 24.9 85.8 60.2

Assumptions (%) Year to March FY21A FY22E FY23E FY24E

GDP (YoY %) (4.0) 7.0 6.0 0

Repo rate (%) 3.0 4.0 4.0 0

USD/INR (average) 75.0 73.0 72.0 0

India growth (%) (24.1) 43.8 (15.4) 8.5

India onco growth (%) (24.9) 20.0 10.0 10.0

US generics (USD mn) 0 0 0 0

RoW growth (%) 0 0 0 0

API growth (%) 55.7 (23.0) 5.0 5.0

Capex (USD mn) 27.6 47.9 48.6 0

Valuation Metrics Year to March FY21A FY22E FY23E FY24E

Diluted P/E (x) 35.7 28.6 15.4 9.6

Price/BV (x) 3.8 3.5 2.9 2.3

EV/EBITDA (x) 26.2 21.8 11.4 6.6

Dividend yield (%) 0.8 0.9 1.0 0

Source: Company and Edelweiss estimates

Balance Sheet (INR mn) Year to March FY21A FY22E FY23E FY24E

Share capital 365 365 365 365

Reserves 40,851 45,099 53,883 68,629

Shareholders funds 41,216 45,464 54,248 68,994

Minority interest 18 18 18 18

Borrowings 2,676 2,167 1,667 1,167

Trade payables 1,462 1,754 2,105 2,526

Other liabs & prov 1,540 1,590 1,642 1,697

Total liabilities 47,919 52,001 60,687 75,410

Net block 20,138 22,334 24,370 26,247

Intangible assets 94 84 74 64

Capital WIP 2,234 2,234 2,234 2,234

Total fixed assets 22,466 24,652 26,678 28,545

Non current inv 1,594 1,594 1,594 1,594

Cash/cash equivalent 4,278 5,226 10,891 22,701

Sundry debtors 4,129 4,335 4,552 4,780

Loans & advances 131 131 131 131

Other assets 14,835 15,577 16,356 17,173

Total assets 47,919 52,001 60,687 75,410

Free Cash Flow (INR mn) Year to March FY21A FY22E FY23E FY24E

Reported profit 5,796 6,957 12,923 20,963

Add: Depreciation 1,169 1,314 1,474 1,633

Interest (net of tax) (433) (678) (773) (1,220)

Others (115) 0 0 0

Less: Changes in WC (2,129) (606) (592) (569)

Operating cash flow 2,988 5,526 10,318 16,194

Less: Capex (2,072) (3,500) (3,500) (3,500)

Free cash flow 916 2,026 6,818 12,694

Key Ratios Year to March FY21A FY22E FY23E FY24E

RoE (%) 11.2 12.7 20.5 26.5

RoCE (%) 14.0 15.4 25.1 33.3

Inventory days 484 638 657 514

Receivable days 86 69 54 43

Payable days 143 125 148 132

Working cap (% sales) 81.9 78.1 60.1 46.0

Gross debt/equity (x) 0.1 0 0 0

Net debt/equity (x) 0 (0.1) (0.2) (0.3)

Interest coverage (x) 36.8 53.7 135.0 300.2

Valuation Drivers Year to March FY21A FY22E FY23E FY24E

EPS growth (%) (2.4) 24.9 85.8 60.2

RoE (%) 11.2 12.7 20.5 26.5

EBITDA growth (%) 4.1 19.5 83.3 58.4

Payout ratio (%) 28.3 25.9 15.7 0

NATCO PHARMA

Edelweiss Securities Limited

90 Edelweiss Research is also available on www.edelweissresearch.com, Bloomberg - EDEL, Thomson Reuters, and Factset

Company Description

NATP, incorporated in September 1981 by Mr. V.C Nannapaneni, started operations

as a contract manufacturer for various companies in the pharmaceutical industry.

The company has the distinction of introducing the time release technology in India

and manufactured formulations in conventional as well as sustained release forms.

It faced difficult times in 1990s in its bid to diversify operations and had to sell off a

portfolio of branded products. However, by 2003, NATP was able to turn around its

operations. While it now has a strong India business with focus on the niche

oncology segment, it has several niche ANDAs like gCopaxone, gRevlimid and

gTamiflu in the US, partnering with some of the biggest global generic players like

Mylan, Actavis and Breckenbridge, among others. It is also focusing on de-risking its

revenue base and growing business in several geographies like Brazil, Venezuela and

Canada.

Investment Theme

In FY22 Natco will enter a period of high revenue visibility. Litigation victory can give

it a year’s headstart in gCoragen, its first agrochem product that has a front-end in

place; launch of gRevlimid in US and other countries as well as potential gNexavar

launch in the US where it holds FTF exclusivity. While the revenue visibility is

welcome, we do note increasing competition in domestic oncology space, gDoxil

erosion, a potential gCopaxone competition and supernormal API business that

could see some softness if tenders are not renewed.

Key Risks

Delay in successful commissioning of Agrochemical plants

Higher price erosion in gCopaxone

Delay in product approvals and filings

Currency risk

Edelweiss Securities Limited

NATCO PHARMA

Edelweiss Research is also available on www.edelweissresearch.com, Bloomberg - EDEL, Thomson Reuters, and Factset 91

Additional Data

Management

Chairman & MD V C Nannapaneni

Vice Chairman & CEO

Rajeev Nannapaneni

CFO Appa Rao S V V N

Click or tap here to enter text.

Auditor B S R & Associates LLP

Holdings – Top 10* % Holding % Holding

Mirae 4.06 SBI Funds 1.18

LIC 2.46 Tata AIA Life 0.90

Plenty PE 1.74 Sundaram AMC 0.85

Nomura 1.69 Blackrock 0.81

Vanguard 1.62 ICICI Pru AMC 0.62

*Latest public data

Recent Company Research Date Title Price Reco

12-Aug-21 Covid-led beat; acceleration from H2; Result Update

1041.45 Hold

18-Jun-21 Entering high growth phase ; Result Update

1095.8 Hold

12-Feb-21 Weak show; long-term story unchanged; Result Update

854 Hold

Recent Sector Research Date Name of Co./Sector Title

17-Sep-21 Biocon Serum deal: Execution awaited; Company Update

16-Aug-21 Ajanta Pharma In cruise mode; Company Update

16-Aug-21 Glenmark Pharma. Value unlocking yet to gain traction; Result Update

Rating Interpretation

Source: Bloomberg, Edelweiss research

Daily Volume

Source: Bloomberg

Rating Distribution: Edelweiss Research Coverage

Buy Hold Reduce Total

Rating Distribution* 177 54 19 251

>50bn >10bn and <50bn <10bn Total

Market Cap (INR) 226 41 3 270

*1 stocks under review

Rating Rationale

Rating Expected absolute returns over 12 months

Buy: >15%

Hold: >15% and <-5%

Reduce: <-5%

TP800

TP660

TP850

TP905

450

595

740

885

1030

1175

Oct-18 Apr-19 Oct-19 Apr-20 Oct-20 Apr-21

(IN

R)

NTCPH IN Equity Buy Hold Reduce0

2

4

6

8

10

Oct-18 Apr-19 Oct-19 Apr-20 Oct-20 Apr-21

(Mn

)

Edelweiss Research is also available on www.edelweissresearch.com, Bloomberg - EDEL, Thomson Reuters, and Factset Edelweiss Securities Limited

KEY DATA

Rating BUY Sector relative Outperformer Price (INR) 827 12 month price target (INR) 970 Market cap (INR bn/USD bn) 1,983/26.8 Free float/Foreign ownership (%) 45.5/11.7

What’s Changed Target Price

Rating/Risk Rating ⚊

INVESTMENT METRICS

Specialty builds confidence

Sun Pharmaceuticals (SUNP) is among the few Indian players that boast success in US specialty. We reaffirm our faith in SUNP’s growth story given: i) Ilumya and Cequa outperformance would offset Absorica losses; ii) Winlevi would boost derma portfolio and monetise Absorica salesforce; iii) quality launches such as Asacol HD and gRevlimid, India recovery, Winlevi uptick and specialty acceleration

would translate to 30%+ margin in FY24E.

SUNP is our top pick in the pharma space. We value the stock at 28x consolidated FY23E EPS to factor in near-term specialty losses. On balance, we maintain ‘BUY’ with a revised TP of INR970 (earlier INR950) along with a valuation rollover to FY23E EPS.

FINANCIALS (INR mn)

Year to March FY21A FY22E FY23E FY24E

Revenue 3,34,981 3,80,384 4,29,455 4,97,458

EBITDA 84,833 1,01,442 1,25,834 1,62,404

Adjusted profit 59,316 67,267 87,712 1,16,843

Diluted EPS (INR) 24.7 28.0 36.6 48.7

EPS growth (%) 47.3 13.4 30.4 33.2

RoAE (%) 6.4 13.7 16.0 18.7

P/E (x) 33.2 29.3 22.5 16.9

EV/EBITDA (x) 22.5 18.3 14.4 10.6

Dividend yield (%) 0.8 0.9 1.1 1.5

PRICE PERFORMANCE

Specialty uptick progressing well

Sun’s specialty products are likely to be key growth drivers for the next three years.

While Absorica is likely to trough out in a couple of quarters, Ilumya and Cequa

should mitigate losses. With IL-23s outpacing IL-17, Ilumya’s growth has been best-

in-class for the last couple of quarters and accordingly on track to clock a 45% CAGR

over FY21–24. Scrapping of mirikizumab by Eli Lilly lessens potential competition.

Sun’s Ilumya in EU has grown at 100% YoY/18% QoQ in Q1FY22 and is annualizing

~USD100mn despite >50% sales from Germany. Cequa has become the fastest

growing molecule in its class, and we expect strong growth till FY23 and eventual

plateauing as Restasis generics hit the market. While we acknowledge

commercialisation hurdles for Winlevi, the throughput is likely to be very high as

incremental investments are likely to be minimal.

India, EMs to aid growth; margin improvement encouraging

The upcoming launches such as gRevlimid, Asacol HD, Bridion injectable, etc and

Taro recovery should provide comfort to US base business. The solid chronic

business and steady EMs and RoW growth are likely to aid growth. This coupled with

cost savings and specialty acceleration would translate to 30%+ margin in FY24.

Explore:

Outlook and valuation: Higher revenue visibility; maintain ‘BUY’

With acceleration in specialty, improving margin, domestic recovery and ~24%

earnings CAGR over FY21–24E, SUNP remains on a strong growth trajectory. The

stock’s current multiple does not account for near-term specialty losses in our view,

implying the market values the core portfolio at a discount to peers. We value SUNP

at a target 28x FY23E EPS as specialty’s best economics are likely to be seen only in

FY25/26. Maintain ‘BUY/SO’ with a revised TP of INR970 (from INR950) as we roll

over to FY23. Our TP includes INR20 from gRevlimid.

10

15

20

25

30

Sales Growth(%)

EPS Growth(%)

RoE(%)

PE(x)

Pharmaceuticals SUNP IN Equity

38,000

42,600

47,200

51,800

56,400

61,000

450

530

610

690

770

850

Oct-20 Jan-21 Apr-21 Jul-21 Oct-21

SUNP IN Equity Sensex

India Equity Research Pharmaceuticals October 4, 2021

SUN PHARMACEUTICALS COMPANY UPDATE

Kunal Randeria Aashita Jain +91 (22) 6620 3040 +91 (22) 6623 3463 [email protected] [email protected]

Corporate access

Financial model Podcast

Video

Edelweiss Securities Limited

SUN PHARMACEUTICALS

Edelweiss Research is also available on www.edelweissresearch.com, Bloomberg - EDEL, Thomson Reuters, and Factset 93

Financial Statements

Income Statement (INR mn) Year to March FY21A FY22E FY23E FY24E

Total operating income 3,34,981 3,80,384 4,29,455 4,97,458

Gross profit 2,48,081 2,80,233 3,19,124 3,72,990

Employee costs 68,622 72,397 77,464 82,887

R&D cost 21,028 24,725 26,626 29,350

Other expenses 73,597 81,670 89,200 98,350

EBITDA 84,833 1,01,442 1,25,834 1,62,404

Depreciation 20,800 21,352 21,902 22,452

Less: Interest expense 1,414 1,203 991 780

Add: Other income 8,355 6,034 7,192 8,274

Profit before tax 70,975 84,920 1,10,133 1,47,446

Prov for tax 5,147 12,653 17,621 25,803

Less: Exceptional item (42,825) 0 0 0

Reported profit 29,194 67,267 87,712 1,16,843

Adjusted profit 59,316 67,267 87,712 1,16,843

Diluted shares o/s 2,399 2,399 2,399 2,399

Adjusted diluted EPS 24.7 28.0 36.6 48.7

DPS (INR) 6.5 7.0 9.1 12.2

Tax rate (%) 7.3 14.9 16.0 17.5

Important Ratios (%) Year to March FY21A FY22E FY23E FY24E

Gross Margin (%) 74.1 73.7 74.3 75.0

R&D as a % of sales 6.3 6.5 6.2 5.9

Net Debt/EBITDA (0.7) (1.1) (1.2) (1.5)

EBITDA margin (%) 25.3 26.7 29.3 32.6

Net profit margin (%) 17.7 17.7 20.4 23.5

Revenue growth (% YoY) 2.0 13.6 12.9 15.8

EBITDA growth (% YoY) 21.4 19.6 24.0 29.1

Adj. profit growth (%) 47.3 13.4 30.4 33.2

Assumptions (%) Year to March FY21A FY22E FY23E FY24E

GDP (YoY %) (6.0) 7.0 6.0 0

Repo rate (%) 3.5 3.5 4.0 0

USD/INR (average) 74.2 73.0 72.0 0

India growth (%) 6.5 18.7 5.6 10.5

Exports growth (%) 0.6 12.1 17.3 19.1

US sales (USD mn) 1,360.0 1,544.7 1,852.2 2,435.3

API sales (USD mn) 263.2 293.9 327.8 360.5

Capex (USD mn) 144.6 235.6 138.9 0

Valuation Metrics Year to March FY21A FY22E FY23E FY24E

Diluted P/E (x) 33.2 29.3 22.5 16.9

Price/BV (x) 4.2 3.8 3.4 2.9

EV/EBITDA (x) 22.5 18.3 14.4 10.6

Dividend yield (%) 0.8 0.9 1.1 1.5

Source: Company and Edelweiss estimates

Balance Sheet (INR mn) Year to March FY21A FY22E FY23E FY24E

Share capital 2,399 2,399 2,399 2,399

Reserves 4,62,229 5,12,679 5,78,463 6,66,095

Shareholders funds 4,64,628 5,15,078 5,80,862 6,68,494

Minority interest 30,171 35,171 39,971 44,771

Borrowings 33,430 28,430 23,430 18,430

Trade payables 39,737 59,043 49,777 69,576

Other liabs & prov 62,151 62,151 62,151 62,151

Total liabilities 6,41,103 7,10,859 7,67,177 8,74,409

Net block 1,54,855 1,48,503 1,36,601 1,24,148

Intangible assets 62,876 62,876 62,876 62,876

Capital WIP 15,668 15,668 15,668 15,668

Total fixed assets 2,33,400 2,27,047 2,15,145 2,02,693

Non current inv 64,824 64,824 64,824 64,824

Cash/cash equivalent 95,756 1,41,741 1,80,386 2,68,412

Sundry debtors 90,614 1,14,636 1,29,425 1,49,919

Loans & advances 28,081 28,081 28,081 28,081

Other assets 89,970 93,869 1,08,656 1,19,820

Total assets 6,41,103 7,10,859 7,67,177 8,74,409

Free Cash Flow (INR mn) Year to March FY21A FY22E FY23E FY24E

Reported profit 17,964 67,267 87,712 1,16,843

Add: Depreciation 18,099 21,352 21,902 22,452

Interest (net of tax) 0 0 0 0

Others 0 0 0 0

Less: Changes in WC 25,641 (8,616) (38,841) (11,859)

Operating cash flow 61,704 80,004 70,773 1,27,437

Less: Capex (10,730) (17,201) (10,000) (10,000)

Free cash flow 50,974 62,802 60,773 1,17,437

Key Ratios Year to March FY21A FY22E FY23E FY24E

RoE (%) 6.4 13.7 16.0 18.7

RoCE (%) 13.2 15.6 18.2 21.5

Inventory days 354 335 335 335

Receivable days 101 98 104 102

Payable days 169 180 180 175

Working cap (% sales) 21.4 21.1 27.7 26.3

Gross debt/equity (x) 0.1 0.1 0 0

Net debt/equity (x) (0.1) (0.2) (0.3) (0.4)

Interest coverage (x) 45.3 66.6 104.9 179.5

Valuation Drivers Year to March FY21A FY22E FY23E FY24E

EPS growth (%) 47.3 13.4 30.4 33.2

RoE (%) 6.4 13.7 16.0 18.7

EBITDA growth (%) 21.4 19.6 24.0 29.1

Payout ratio (%) 53.4 25.0 25.0 25.0

SUN PHARMACEUTICALS

Edelweiss Securities Limited

94 Edelweiss Research is also available on www.edelweissresearch.com, Bloomberg - EDEL, Thomson Reuters, and Factset

Company Description

Sun Pharmaceuticals is the largest Indian Pharma company with an impressive track

record of organic and inorganic growth. Various US acquisitions augment SUNP’s

pipeline with differentiated products, where SUNP has turned around business in a

highly profitable manner – Taro/ TDPL/Natco’s brands/etc. SUNP is among the first

few Indian pharma players to have shifted focus to specialty from generics. It has

invested ~USD2bn in this business so far. Within specialty, dermatology and

ophthalmology are the key investment areas. While the company has entered the

commercialisation phase for most of specialty products, it continue to, invest in

development of specialty pipeline, and in evaluating new markets for

commercialising specialty products.

Investment Theme

Sun’s specialty products are likely to be key growth drivers in the next three years.

While Absorica is likely to trough out in a couple of quarters, Ilumya and Cequa

should help mitigate losses. Recovery in ex-Taro US business, steady EM and RoW

growth, solid domestic chronic biz and visible cost control are likely to provide

comfort to base business. With acceleration in specialty, improving margin,

domestic recovery and ~24% earnings CAGR over FY21–24E, SUNP remains on a

strong growth trajectory

Key Risks

Slowdown in specialty uptick particularly Ilumya;

USFDA inspection risk

Currency risk

Edelweiss Securities Limited

SUN PHARMACEUTICALS

Edelweiss Research is also available on www.edelweissresearch.com, Bloomberg - EDEL, Thomson Reuters, and Factset 95

Additional Data

Management

Chairman Israel Makov

Managing Director Dilip S. Shanghvi

CFO C. S. Muralidharan

Click or tap here to enter text.

Auditor S R B C & Co. LLP

Holdings – Top 10* % Holding % Holding

LIC 7.37 Nippon life 1.10

ICICI Pru AMC 3.61 HDFC AMC 1.08

SBI Funds 2.03 Norges 0.75

Vanguard Group 1.48 Mirae 0.67

Blackrock 1.17 UTI 0.66

*Latest public data

Recent Company Research Date Title Price Reco

30-Jul-21 The going gets better; Result Update 774 Buy

27-May-21 Some rain, some shine ahead ; Result Update

700 Hold

09-Feb-21 Specialty recovery key; Company Update

586 Hold

Recent Sector Research Date Name of Co./Sector Title

17-Sep-21 Biocon Serum deal: Execution awaited; Company Update

16-Aug-21 Ajanta Pharma In cruise mode; Company Update

16-Aug-21 Glenmark Pharma. Value unlocking yet to gain traction; Result Update

Rating Interpretation

Source: Bloomberg, Edelweiss research

Daily Volume

Source: Bloomberg

Rating Distribution: Edelweiss Research Coverage

Buy Hold Reduce Total

Rating Distribution* 177 54 19 251

>50bn >10bn and <50bn <10bn Total

Market Cap (INR) 226 41 3 270

*1 stocks under review

Rating Rationale

Rating Expected absolute returns over 12 months

Buy: >15%

Hold: >15% and <-5%

Reduce: <-5%

TP950

TP515

TP575

TP500

TP380

TP380

300

430

560

690

820

950

Oct-18 Apr-19 Oct-19 Apr-20 Oct-20 Apr-21

(IN

R)

SUNP IN Equity Buy Hold Reduce0

18

36

54

72

90

Oct-18 Apr-19 Oct-19 Apr-20 Oct-20 Apr-21

(Mn

)

Edelweiss Research is also available on www.edelweissresearch.com, Bloomberg - EDEL, Thomson Reuters, and Factset Edelweiss Securities Limited

KEY DATA

Rating REDUCE Sector relative Underperformer Price (INR) 3,081 12 month price target (INR) 2,850 Market cap (INR bn/USD bn) 521/7.0 Free float/Foreign ownership (%) 28.8/11.7

What’s Changed Target Price

Rating/Risk Rating ⚊

INVESTMENT METRICS

Steady growth; limited room for surprise

We see limited scope for earnings upgrade for Torrent Pharma (TRP) as its: i) domestic growth remains price-driven and a sustainable volume uptick remains elusive; ii) US pipeline visibility is limited and USFDA remediation timelines uncertain; Levittown and sartan launches are unlikely to move the needle; and iii) higher R&D and tax rate would offset opex control. Trade Gx foray is in contrast to its

strategy of pursuing a branded play, and the impact of this is awaited.

As TRP offers steady growth due to a high share of India chronic, we value it at industry-leading 30x FY23E earnings. Retain ‘REDUCE’ with a revised TP of INR2,850 (earlier INR2,700) as we roll over to FY23E.

FINANCIALS (INR mn)

Year to March FY21A FY22E FY23E FY24E

Revenue 80,050 87,170 1,00,306 1,12,785

EBITDA 24,850 27,191 31,928 36,664

Adjusted profit 12,520 12,798 16,115 19,468

Diluted EPS (INR) 74.0 75.6 95.2 115.0

EPS growth (%) 22.1 2.2 25.9 20.8

RoAE (%) 23.5 20.6 22.7 23.9

P/E (x) 42.4 41.5 32.9 27.3

EV/EBITDA (x) 23.0 20.5 17.0 14.4

Dividend yield (%) 0.6 1.0 1.2 1.5

PRICE PERFORMANCE

Sustainable volume uptick elusive in India

Despite a predominantly chronic portfolio, growth continues to be price-led with

volumes have lagged IPM several times over the past few years. Management is

confident of sustaining 6–7% price growth, but we argue growth led by volumes is

more sustainable and hence revival of volume growth is critical. Moreover, several

of TRP’s top brands are showing only low single-digit volume growth; therefore, we

see a remote possibility of it beating our FY21–24E domestic CAGR of ~13%. Entry in

low-margin trade generics is in contrast to its strategy of pursuing branded plays.

US languishes; limited room for earnings surprise

While investment in complex drugs and adding one 505b2 product each year in the

US looks promising, remediation timelines for Indrad and Dahej remain uncertain,

thereby delaying recovery. Launches from Levittown may not move the needle and

sartan margin profile remains unimpressive.

Besides, other businesses are unlikely to throw up any positive surprise. We see

limited scope for earnings upgrade as a reduction in marketing spends is likely to be

more than offset by higher R&D spends and a steeper tax rate (~31% versus 24%

earlier) on account of MAT credit utilisation.

Explore:

Outlook and valuation: Growth priced in; retain ‘REDUCE’

Given TRP’s superior business driving its steady growth and strong margin profile,

the stock deserves to trade at a premium in our view. However, at 35x/30x FY22/23E

EPS, the current price captures the opportunity, but not the risk associated with

prolonged volume slowdown and delayed US recovery. We value it at industry

leading 30x FY23E earnings, highest in our pharma coverage. Maintain ‘REDUCE/SU’

with a target price of INR2,850 (earlier INR2,700) as we roll over to FY23E.

0

10

20

30

40

Sales Growth(%)

EPS Growth(%)

RoE(%)

PE(x)

Pharmaceuticals TRP IN Equity

38,000

42,600

47,200

51,800

56,400

61,000

2,350

2,520

2,690

2,860

3,030

3,200

Oct-20 Jan-21 Apr-21 Jul-21 Oct-21

TRP IN Equity Sensex

India Equity Research Pharmaceuticals October 4, 2021

TORRENT PHARMA COMPANY UPDATE

Kunal Randeria Aashita Jain +91 (22) 6620 3040 +91 (22) 6623 3463 [email protected] [email protected]

Corporate access

Financial model Podcast

Video

Edelweiss Securities Limited

TORRENT PHARMA

Edelweiss Research is also available on www.edelweissresearch.com, Bloomberg - EDEL, Thomson Reuters, and Factset 97

Financial Statements

Income Statement (INR mn) Year to March FY21A FY22E FY23E FY24E

Total operating income 80,050 87,170 1,00,306 1,12,785

Gross profit 58,580 63,285 72,722 81,769

Employee costs 14,400 15,696 17,423 19,165

R&D cost 4,870 5,230 6,319 7,105

Other expenses 14,460 15,168 17,052 18,835

EBITDA 24,850 27,191 31,928 36,664

Depreciation 6,580 6,744 7,119 7,503

Less: Interest expense 3,580 2,706 2,173 1,698

Add: Other income 570 807 719 751

Profit before tax 15,260 18,548 23,355 28,214

Prov for tax 2,740 5,750 7,240 8,746

Less: Exceptional item 0 0 0 0

Reported profit 12,520 12,798 16,115 19,468

Adjusted profit 12,520 12,798 16,115 19,468

Diluted shares o/s 169 169 169 169

Adjusted diluted EPS 74.0 75.6 95.2 115.0

DPS (INR) 20.0 30.2 38.1 46.0

Tax rate (%) 18.0 31.0 31.0 31.0

Important Ratios (%) Year to March FY21A FY22E FY23E FY24E

Gross margin 73.2 72.6 72.5 72.5

R&D as a % of sales 6.1 6.0 6.3 6.3

Net Debt/EBITDA 1.7 1.0 0.4 0

EBITDA margin (%) 31.0 31.2 31.8 32.5

Net profit margin (%) 15.6 14.7 16.1 17.3

Revenue growth (% YoY) 0.8 8.9 15.1 12.4

EBITDA growth (% YoY) 14.5 9.4 17.4 14.8

Adj. profit growth (%) 22.1 2.2 25.9 20.8

Assumptions (%) Year to March FY21A FY22E FY23E FY24E

GDP (YoY %) (4.0) 7.0 6.0 6.0

Repo rate (%) 3.0 4.0 4.0 4.0

USD/INR (average) 74.0 73.0 72.0 72.0

India growth (%) 6.3 15.0 12.0 12.0

US sales (USD mn) 166.0 148.0 220.0 270.0

Brazil growth (%) 8.4 12.0 10.0 10.0

Germany growth (%) (0.8) 11.0 12.0 12.0

RoW growth (%) 7.1 10.0 10.0 10.0

Capex (USD mn) 45.1 34.2 34.7 0

Valuation Metrics Year to March FY21A FY22E FY23E FY24E

Diluted P/E (x) 42.4 41.5 32.9 27.3

Price/BV (x) 9.1 8.0 7.0 6.1

EV/EBITDA (x) 23.0 20.5 17.0 14.4

Dividend yield (%) 0.6 1.0 1.2 1.5

Source: Company and Edelweiss estimates

Balance Sheet (INR mn) Year to March FY21A FY22E FY23E FY24E

Share capital 850 850 850 850

Reserves 57,530 65,209 74,878 86,558

Shareholders funds 58,380 66,059 75,728 87,408

Minority interest 0 0 0 0

Borrowings 48,750 38,750 28,750 18,750

Trade payables 20,670 22,688 26,107 29,355

Other liabs & prov 4,990 5,038 6,431 7,755

Total liabilities 1,36,540 1,36,284 1,40,766 1,47,018

Net block 65,980 61,736 57,117 52,114

Intangible assets 3,410 3,410 3,410 3,410

Capital WIP 8,890 8,890 8,890 8,890

Total fixed assets 78,280 74,036 69,417 64,414

Non current inv 420 420 420 420

Cash/cash equivalent 7,430 11,876 15,124 20,536

Sundry debtors 15,230 17,939 20,229 22,688

Loans & advances 5,770 5,770 5,770 5,770

Other assets 26,810 23,643 27,206 30,591

Total assets 1,36,540 1,36,284 1,40,766 1,47,018

Free Cash Flow (INR mn) Year to March FY21A FY22E FY23E FY24E

Reported profit 12,520 12,798 16,115 19,468

Add: Depreciation 6,580 6,744 7,119 7,503

Interest (net of tax) 3,580 2,706 2,173 1,698

Others 0 0 0 0

Less: Changes in WC (3,370) 2,523 (1,040) (1,272)

Operating cash flow 19,310 24,771 24,367 27,397

Less: Capex (3,340) (2,500) (2,500) (2,500)

Free cash flow 15,970 22,271 21,867 24,897

Key Ratios Year to March FY21A FY22E FY23E FY24E

RoE (%) 23.5 20.6 22.7 23.9

RoCE (%) 17.6 20.1 24.4 28.4

Inventory days 410 386 336 340

Receivable days 72 69 69 69

Payable days 352 331 323 326

Working cap (% sales) 22.4 17.7 16.4 15.7

Gross debt/equity (x) 0.8 0.6 0.4 0.2

Net debt/equity (x) 0.7 0.4 0.2 0

Interest coverage (x) 5.1 7.6 11.4 17.2

Valuation Drivers Year to March FY21A FY22E FY23E FY24E

EPS growth (%) 22.1 2.2 25.9 20.8

RoE (%) 23.5 20.6 22.7 23.9

EBITDA growth (%) 14.5 9.4 17.4 14.8

Payout ratio (%) 27.0 40.0 40.0 40.0

TORRENT PHARMA

Edelweiss Securities Limited

98 Edelweiss Research is also available on www.edelweissresearch.com, Bloomberg - EDEL, Thomson Reuters, and Factset

Company Description

Torrent Pharmaceuticals (TRP) is one of the few companies in the pharma space with

a focus on cash flows and thus the domestic market remains its first choice. In

pursuit of growth in domestic market, company has performed two bold acquisitions

over the past five years — Elder (acquired at 5x sales) and leveraged buyout of

Unichem (acquired at 4x sales). TRP was very successful in accelerating growth in

Elder’s portfolio post acquisition and it is yet to see a similar ramp-up in Unichem’s

portfolio. Other focus markets include Brazil, Germany and the US, where it has

recently started focusing on complex generics.

Investment Theme

TRP continues to focus on branded business mix from India and Brazil, which bodes

well for sustainable growth in a challenging global environment for the pharma

sector. However, additional costs from the recent Unichem acquisition are likely to

offset any synergy benefits arising from the overlap in the portfolio. Current

valuations factor in benefits from TRP’s chronic branded business but not the risks

from: i) deceleration in the pricing-led domestic growth; ii) slower than expected

revival in volume growth; iii) further delays in US plant clearances; iv) sustained

pressure in Brazil and Germany.

Key Risks

Deceleration in pricing-led domestic growth

Slowdown in ANDA approvals and USFDA related regulatory risks are part of the

generics business.

Delay in product launches in Brazil, Germany and US could restrict growth in these

key geographies

Currency risk

Edelweiss Securities Limited

TORRENT PHARMA

Edelweiss Research is also available on www.edelweissresearch.com, Bloomberg - EDEL, Thomson Reuters, and Factset 99

Additional Data

Management

Chairman Sudhir Mehta

Executive Chairman

Samir Mehta

CFO Sudhir Menon

Click or tap here to enter text.

Auditor B S R & Co. LLP

Holdings – Top 10* % Holding % Holding

Mirae Asset Glo 2.21 Pictet 0.86

UTI 1.28 Kotac AMC 0.73

FMR 1.19 T Rowe 0.72

Vanguard 0.93 ICICI Pru Life 0.68

Blackrock 0.89 Nippon Life AMC 0.64

*Latest public data

Recent Company Research Date Title Price Reco

27-Jul-21 In-line quarter; limited earnings upside; Result Update

3003 Reduce

18-May-21 Growth ahead, but not sans challenges; Result Update

2724 Reduce

08-Feb-21 Growth ahead, but not sans challenges; Result Update

2758 Reduce

Recent Sector Research Date Name of Co./Sector Title

17-Sep-21 Biocon Serum deal: Execution awaited; Company Update

16-Aug-21 Ajanta Pharma In cruise mode; Company Update

16-Aug-21 Glenmark Pharma. Value unlocking yet to gain traction; Result Update

Rating Interpretation

Source: Bloomberg, Edelweiss research

Daily Volume

Source: Bloomberg

Rating Distribution: Edelweiss Research Coverage

Buy Hold Reduce Total

Rating Distribution* 177 54 19 251

>50bn >10bn and <50bn <10bn Total

Market Cap (INR) 226 41 3 270

*1 stocks under review

Rating Rationale

Rating Expected absolute returns over 12 months

Buy: >15%

Hold: >15% and <-5%

Reduce: <-5%

TP1,760 TP

1,625

TP2,250

TP2,500

1450

1800

2150

2500

2850

3200

Oct-18 Apr-19 Oct-19 Apr-20 Oct-20 Apr-21

(IN

R)

TRP IN Equity Buy Hold Reduce0

2

4

6

8

10

Oct-18 Apr-19 Oct-19 Apr-20 Oct-20 Apr-21

(Mn

)

TORRENT PHARMA

Edelweiss Securities Limited

100 Edelweiss Research is also available on www.edelweissresearch.com, Bloomberg - EDEL, Thomson Reuters, and Factset

DISCLAIMER Edelweiss Securities Limited (“ESL” or “Research Entity”) is regulated by the Securities and Exchange Board of India (“SEBI”) and is licensed to carry on the business of broking, depository services and related activities. The business of ESL and its Associates (list available on www.edelweissfin.com) are organized around five broad business groups – Credit including Housing and SME Finance, Commodities, Financial Markets, Asset Management and Life Insurance.

This Report has been prepared by Edelweiss Securities Limited in the capacity of a Research Analyst having SEBI Registration No.INH200000121 and distributed as per SEBI (Research Analysts) Regulations 2014. This report does not constitute an offer or solicitation for the purchase or sale of any financial instrument or as an official confirmation of any transaction. Securities as defined in clause (h) of section 2 of the Securities Contracts (Regulation) Act, 1956 includes Financial Instruments and Currency Derivatives. The information contained herein is from publicly available data or other sources believed to be reliable. This report is provided for assistance only and is not intended to be and must not alone be taken as the basis for an investment decision. The user assumes the entire risk of any use made of this information. Each recipient of this report should make such investigation as it deems necessary to arrive at an independent evaluation of an investment in Securities referred to in this document (including the merits and risks involved), and should consult his own advisors to determine the merits and risks of such investment. The investment discussed or views expressed may not be suitable for all investors.

This information is strictly confidential and is being furnished to you solely for your information. This information should not be reproduced or redistributed or passed on directly or indirectly in any form to any other person or published, copied, in whole or in part, for any purpose. This report is not directed or intended for distribution to, or use by, any person or entity who is a citizen or resident of or located in any locality, state, country or other jurisdiction, where such distribution, publication, availability or use would be contrary to law, regulation or which would subject ESL and associates / group companies to any registration or licensing requirements within such jurisdiction. The distribution of this report in certain jurisdictions may be restricted by law, and persons in whose possession this report comes, should observe, any such restrictions. The information given in this report is as of the date of this report and there can be no assurance that future results or events will be consistent with this information. This information is subject to change without any prior notice. ESL reserves the right to make modifications and alterations to this statement as may be required from time to time. ESL or any of its associates / group companies shall not be in any way responsible for any loss or damage that may arise to any person from any inadvertent error in the information contained in this report. ESL is committed to providing independent and transparent recommendation to its clients. Neither ESL nor any of its associates, group companies, directors, employees, agents or representatives shall be liable for any damages whether direct, indirect, special or consequential including loss of revenue or lost profits that may arise from or in connection with the use of the information. Our proprietary trading and investment businesses may make investment decisions that are inconsistent with the recommendations expressed herein. Past performance is not necessarily a guide to future performance .The disclosures of interest statements incorporated in this report are provided solely to enhance the transparency and should not be treated as endorsement of the views expressed in the report. The information provided in these reports remains, unless otherwise stated, the copyright of ESL. All layout, design, original artwork, concepts and other Intellectual Properties, remains the property and copyright of ESL and may not be used in any form or for any purpose whatsoever by any party without the express written permission of the copyright holders.

ESL shall not be liable for any delay or any other interruption which may occur in presenting the data due to any reason including network (Internet) reasons or snags in the system, break down of the system or any other equipment, server breakdown, maintenance shutdown, breakdown of communication services or inability of the ESL to present the data. In no event shall ESL be liable for any damages, including without limitation direct or indirect, special, incidental, or consequential damages, losses or expenses arising in connection with the data presented by the ESL through this report.

We offer our research services to clients as well as our prospects. Though this report is disseminated to all the customers simultaneously, not all customers may receive this report at the same time. We will not treat recipients as customers by virtue of their receiving this report.

ESL and its associates, officer, directors, and employees, research analyst (including relatives) worldwide may: (a) from time to time, have long or short positions in, and buy or sell the

Securities, mentioned herein or (b) be engaged in any other transaction involving such Securities and earn brokerage or other compensation or act as a market maker in the financial

instruments of the subject company/company(ies) discussed herein or act as advisor or lender/borrower to such company(ies) or have other potential/material conflict of interest with

respect to any recommendation and related information and opinions at the time of publication of research report or at the time of public appearance. ESL may have proprietary long/short

position in the above mentioned scrip(s) and therefore should be considered as interested. The views provided herein are general in nature and do not consider risk appetite or investment

objective of any particular investor; readers are requested to take independent professional advice before investing. This should not be construed as invitation or solicitation to do business

with ESL.

ESL or its associates may have received compensation from the subject company in the past 12 months. ESL or its associates may have managed or co-managed public offering of securities for the subject company in the past 12 months. ESL or its associates may have received compensation for investment banking or merchant banking or brokerage services from the subject company in the past 12 months. ESL or its associates may have received any compensation for products or services other than investment banking or merchant banking or brokerage services from the subject company in the past 12 months. ESL or its associates have not received any compensation or other benefits from the Subject Company or third party in connection with the research report. Research analyst or his/her relative or ESL’s associates may have financial interest in the subject company. ESL and/or its Group Companies, their Directors, affiliates and/or employees may have interests/ positions, financial or otherwise in the Securities/Currencies and other investment products mentioned in this report. ESL, its associates, research analyst and his/her relative may have other potential/material conflict of interest with respect to any recommendation and related information and opinions at the time of publication of research report or at the time of public appearance.

Participants in foreign exchange transactions may incur risks arising from several factors, including the following: ( i) exchange rates can be volatile and are subject to large fluctuations; ( ii) the value of currencies may be affected by numerous market factors, including world and national economic, political and regulatory events, events in equity and debt markets and changes in interest rates; and (iii) currencies may be subject to devaluation or government imposed exchange controls which could affect the value of the currency. Investors in securities such as ADRs and Currency Derivatives, whose values are affected by the currency of an underlying security, effectively assume currency risk.

Research analyst has served as an officer, director or employee of subject Company: No

ESL has financial interest in the subject companies: No

ESL’s Associates may have actual / beneficial ownership of 1% or more securities of the subject company at the end of the month immediately preceding the date of publication of research report.

Research analyst or his/her relative has actual/beneficial ownership of 1% or more securities of the subject company at the end of the month immediately preceding the date of publication of research report: No

ESL has actual/beneficial ownership of 1% or more securities of the subject company at the end of the month immediately preceding the date of publication of research report: No

Subject company may have been client during twelve months preceding the date of distribution of the research report.

There were no instances of non-compliance by ESL on any matter related to the capital markets, resulting in significant and material disciplinary action during the last three years except that ESL had submitted an offer of settlement with Securities and Exchange commission, USA (SEC) and the same has been accepted by SEC without admitting or denying the findings in relation to their charges of non registration as a broker dealer.

A graph of daily closing prices of the securities is also available at www.nseindia.com

Analyst Certification:

The analyst for this report certifies that all of the views expressed in this report accurately reflect his or her personal views about the subject company or companies and its or their securities, and no part of his or her compensation was, is or will be, directly or indirectly related to specific recommendations or views expressed in this report.

Edelweiss Securities Limited

TORRENT PHARMA

Edelweiss Research is also available on www.edelweissresearch.com, Bloomberg - EDEL, Thomson Reuters, and Factset 101

Additional Disclaimers

Disclaimer for U.S. Persons

This research report is a product of Edelweiss Securities Limited, which is the employer of the research analyst(s) who has prepared the research report. The research analyst(s) preparing the research report is/are resident outside the United States (U.S.) and are not associated persons of any U.S. regulated broker-dealer and therefore the analyst(s) is/are not subject to supervision by a U.S. broker-dealer, and is/are not required to satisfy the regulatory licensing requirements of FINRA or required to otherwise comply with U.S. rules or regulations regarding, among other things, communications with a subject company, public appearances and trading securities held by a research analyst account.

This report is intended for distribution by Edelweiss Securities Limited only to "Major Institutional Investors" as defined by Rule 15a-6(b)(4) of the U.S. Securities and Exchange Act, 1934 (the Exchange Act) and interpretations thereof by U.S. Securities and Exchange Commission (SEC) in reliance on Rule 15a 6(a)(2). If the recipient of this report is not a Major Institutional Investor as specified above, then it should not act upon this report and return the same to the sender. Further, this report may not be copied, duplicated and/or transmitted onward to any U.S. person, which is not the Major Institutional Investor.

In reliance on the exemption from registration provided by Rule 15a-6 of the Exchange Act and interpretations thereof by the SEC in order to conduct certain business with Major Institutional Investors, Edelweiss Securities Limited has entered into an agreement with a U.S. registered broker-dealer, Edelweiss Financial Services Inc. ("EFSI"). Transactions in securities discussed in this research report should be effected through Edelweiss Financial Services Inc.

Disclaimer for U.K. Persons

The contents of this research report have not been approved by an authorised person within the meaning of the Financial Services and Markets Act 2000 ("FSMA"). In the United Kingdom, this research report is being distributed only to and is directed only at (a) persons who have professional experience in matters relating to investments falling within Article 19(5) of the FSMA (Financial Promotion) Order 2005 (the “Order”); (b) persons falling within Article 49(2)(a) to (d) of the Order (including high net worth companies and unincorporated associations); and (c) any other persons to whom it may otherwise lawfully be communicated (all such persons together being referred to as “relevant persons”). This research report must not be acted on or relied on by persons who are not relevant persons. Any investment or investment activity to which this research report relates is available only to relevant persons and will be engaged in only with relevant persons. Any person who is not a relevant person should not act or rely on this research report or any of its contents. This research report must not be distributed, published, reproduced or disclosed (in whole or in part) by recipients to any other person. Disclaimer for Canadian Persons

This research report is a product of Edelweiss Securities Limited ("ESL"), which is the employer of the research analysts who have prepared the research report. The research analysts preparing the research report are resident outside the Canada and are not associated persons of any Canadian registered adviser and/or dealer and, therefore, the analysts are not subject to supervision by a Canadian registered adviser and/or dealer, and are not required to satisfy the regulatory licensing requirements of the Ontario Securities Commission, other Canadian provincial securities regulators, the Investment Industry Regulatory Organization of Canada and are not required to otherwise comply with Canadian rules or regulations regarding, among other things, the research analysts' business or relationship with a subject company or trading of securities by a research analyst.

This report is intended for distribution by ESL only to "Permitted Clients" (as defined in National Instrument 31-103 ("NI 31-103")) who are resident in the Province of Ontario, Canada (an "Ontario Permitted Client"). If the recipient of this report is not an Ontario Permitted Client, as specified above, then the recipient should not act upon this report and should return the report to the sender. Further, this report may not be copied, duplicated and/or transmitted onward to any Canadian person.

ESL is relying on an exemption from the adviser and/or dealer registration requirements under NI 31-103 available to certain international advisers and/or dealers. Please be advised that (i) ESL is not registered in the Province of Ontario to trade in securities nor is it registered in the Province of Ontario to provide advice with respect to securities; (ii) ESL's head office or principal place of business is located in India; (iii) all or substantially all of ESL's assets may be situated outside of Canada; (iv) there may be difficulty enforcing legal rights against ESL because of the above; and (v) the name and address of the ESL's agent for service of process in the Province of Ontario is: Bamac Services Inc., 181 Bay Street, Suite 2100, Toronto, Ontario M5J 2T3 Canada.

Disclaimer for Singapore Persons

In Singapore, this report is being distributed by Edelweiss Investment Advisors Private Limited ("EIAPL") (Co. Reg. No. 201016306H) which is a holder of a capital markets services license and an exempt financial adviser in Singapore and (ii) solely to persons who qualify as "institutional investors" or "accredited investors" as defined in section 4A(1) of the Securities and Futures Act, Chapter 289 of Singapore ("the SFA"). Pursuant to regulations 33, 34, 35 and 36 of the Financial Advisers Regulations ("FAR"), sections 25, 27 and 36 of the Financial Advisers Act, Chapter 110 of Singapore shall not apply to EIAPL when providing any financial advisory services to an accredited investor (as defined in regulation 36 of the FAR. Persons in Singapore should contact EIAPL in respect of any matter arising from, or in connection with this publication/communication. This report is not suitable for private investors.

Disclaimer for Hong Kong persons

This report is distributed in Hong Kong by Edelweiss Securities (Hong Kong) Private Limited (ESHK), a licensed corporation (BOM -874) licensed and regulated by the Hong Kong Securities and Futures Commission (SFC) pursuant to Section 116(1) of the Securities and Futures Ordinance “SFO”. This report is intended for distribution only to “Professional Investors” as defined in Part I of Schedule 1 to SFO. Any investment or investment activity to which this document relates is only available to professional investor and will be engaged only with professional investors.” Nothing here is an offer or solicitation of these securities, products and services in any jurisdiction where their offer or sale is not qualified or exempt from registration. The report also does not constitute a personal recommendation or take into account the particular investment objectives, financial situations, or needs of any individual recipients. The Indian Analyst(s) who compile this report is/are not located in Hong Kong and is/are not licensed to carry on regulated activities in Hong Kong and does not / do not hold themselves out as being able to do so. Copyright 2009 Edelweiss Research (Edelweiss Securities Ltd). All rights reserved.

Aditya Narain

Head of Research

[email protected]

Edelweiss Securities Limited, Edelweiss House, off C.S.T. Road, Kalina, Mumbai 400 098Tel: +91 22 4009 4400. Email: [email protected]


Recommended