60
1 SECTOR SKILLS PLAN (SSP) 2016-2017 Final 01 August 2016

1
SECTOR SKILLS PLAN (SSP)
2016-2017
Final
01 August 2016
2
Table of Contents
A. LIST OF FIGURES ...............................................................................................................................3
B. LIST OF TABLES ................................................................................................................................4
C. Tables…………………………………………………………………………………………………………………………………….…….4
D. ACRONYMS ......................................................................................................................................5
EXECUTIVE SUMMARY .....................................................................................................................................7
1 CHAPTER 1: SECTOR PROFILE ......................................................................................................... 10
1.1 Scope of Coverage .............................................................................................................. 10
1.2 Key Role Players.................................................................................................................. 13
1.3 Economic Performance ...................................................................................................... 15
1.5 Labour Market Profile ........................................................................................................ 18
1.5.1 Employment Patterns and Trends .................................................................... 25
1.6 Chapter Conclusion ............................................................................................................ 25
1.7 Change Drivers ................................................................................................................... 26
1.7.1 Growth into Africa ............................................................................................. 26
1.7.2 Speed to Market ................................................................................................ 26
1.7.3 Digital Revolution .............................................................................................. 27
1.7.4 Skills Shortage .................................................................................................... 27
1.7.5 Responsible Buying ............................................................................................ 27
1.8 Alignment with National Strategy and Plans ...................................................................... 28
1.9 Chapter Conclusion ............................................................................................................ 29
2 CHAPTER 3: EXTENT OF SKILLS MISMATCH .................................................................................... 30
2.1 Extent and Nature of Demand ............................................................................................ 30
2.1.1 Employment Patterns and Trends ..................................................................... 30
2.1.2 Conditions of Employment ................................................................................ 30
2.1.3 Occupations that are difficult to fill ................................................................... 31
2.1.4 Number and Types of Vacancies........................................................................ 32
2.2 Extent and Nature of Supply .............................................................................................. 33
2.2.1 Extent of Occupational Skills Supply .................................................................. 34
2.2.2 State of Education and Training Provision ......................................................... 35
2.2.3 Supply problems experienced by the sector ..................................................... 38
2.3 Skills Gaps ........................................................................................................................... 39
2.3.1 Skills Demand..................................................................................................... 39
2.3.2 Employability of Graduates ............................................................................... 44
2.3.3 ‘Skills supply problems that firms are experiencing’ ......................................... 46
2.4 Chapter Conclusion ............................................................................................................ 47
3 CHAPTER 4: SECTOR PARTNERSHIPS .............................................................................................. 48
3.1 Existing partnerships .......................................................................................................... 48
3.2 New partnerships ............................................................................................................... 50
3.3 Chapter Conclusion ............................................................................................................ 51
4 CHAPTER 5: SKILLS PRIORITY ACTIONS ........................................................................................... 52
4.1 Findings from Previous Chapters ........................................................................................ 52
4.2 Recommended Actions ....................................................................................................... 53
4.2.1 Skills Priorities for the Sector ............................................................................. 53
4.2.2 Proposed Interventions ..................................................................................... 54
6. Chapter Conclusion ............................................................................................................ 58
BIBLIOGRAPHY ............................................................................................................................................... 59
3
A. LIST OF FIGURES
Figure 1-1: Proportion of wholesalers by type of wholesale activity ............................................................................... 12
Figure 1-2: Proportion of retailers by type of retail activity ............................................................................................. 12
Figure 1-3: Proportion of Wholesale and Retail Enterprises by size (Small: n=5905, Medium: n= 1189, Large: n=
519) ............................................................................................................................................................... 16
Figure 1-4: Location of Enterprises by Size (Small: n=5905, Medium: n= 1189, Large: n= 519) ...................................... 17
Figure 1-5: Proportion of Staff (n=751 848) ..................................................................................................................... 17
Figure 1-6: Employment in the Wholesale and Retail Trade 2004-2014 (000’) ............................................................... 18
Figure 1-7: Proportion of Employees by Formal and Informal Sector .............................................................................. 18
Figure 1-8: Employment in the Wholesale and Retail Sector by province (000) .............................................................. 19
Figure 1-9: Number of employees by gender................................................................................................................... 20
Figure 1-10: Proportion of Staff by Occupation (n=751 848) ........................................................................................... 20
Figure 1-11: Employee Demographics .............................................................................................................................. 21
Figure 1-12: Proportion of Staff per province by race and gender (n=751 848) .............................................................. 21
Figure 1-13: Proportion of Staff per occupational category, by age (n=751 848) ............................................................ 22
Figure 1-14: Proportion of Staff per province, by age (n=751 848) ................................................................................. 23
Figure 1-15: Proportion of Disabled Staff per Occupational Category, by Race (n=2 209) .............................................. 24
Fiergure 1-16: Proportion of Disabled Staff per Province, by Race (n=2 209) ................................................................. 25
Figure 2-1: Sectors with a high skills demand .................................................................................................................. 32
Figure 2-2: Number of Employment Adverts in the FMCG, Retail and Wholesale Sectors .............................................. 33
Figure 2-3: University intake by major field of study ....................................................................................................... 35
Figure 2-4: Training workers ............................................................................................................................................ 35
Figure 2-5: Number of people trained per occupational class 2013/2014 ...................................................................... 36
Figure 2-6: Number of people trained per province 2013/2014 ...................................................................................... 36
Figure 2-7: Sectors with a high skills supply ..................................................................................................................... 38
Figure 2-8: Reasons for Scarcity (n=243) .......................................................................................................................... 39

4
B. LIST OF TABLES
Table 1-1: Key Role Players in the Wholesale and Retail Sector ...................................................................................... 14
Table 1-2: Provincial Spread of W&RSETA enterprises by size (Small: n=5905, Medium: n= 1189, Large: n= 519) ........ 17
Table 1-3: Number of staff per occupational category by age (n= 751 848) .................................................................... 22
Table 1-4: Number of Staff per province, by age (n=751 848) ......................................................................................... 23
Table 1-5: Number of staff per occupational category by race (n=2 209) ....................................................................... 24
Table 1-6: Disabled Employees ........................................................................................................................................ 25
Table 1-7: National Strategies/ Policies and their implications for Skills Development in the Wholesale and
Retail Sector .................................................................................................................................................. 28
Table 2-1: Applicants per Advert, Career Junction ........................................................................................................... 33
Table 2-2: Planned training by Top 30 occupations ......................................................................................................... 36
Table 2-3: Findings on the remaining 6 PIVOTAL skills ..................................................................................................... 43
Table 2-4: Findings on the remaining 6 scarce skills ..................................................................................................…….43
Table 2-5: Skills Challenges............................................................................................................................................... 46
C. Tables
Table 1: SIC Codes Wholesale & Retail……………………………………………………………………………………………………………….….…...11
Table 2: W&RSETA Key role players………………………………………………………………………….………………………………………….……..14
Table 3: The W&R sectors economic performance……………………………………………………………………………………………...……..17
Table 4: W&R enterprises by size and province……………………………………………………………………………………………..…………..18
Table5: Scarce skills list for Western Cape and Eastern Cape………………………………………………………………..………….……….47
Table 6: Scarce skills list for Northern Cape and Free State………………………………………………………………………….…….………47
Table 7: Scarce skills list for Kwa Zulu Natal and North West………………………………………………………………………….….………47
Table 8: Scarce skills list for Gauteng and Mpumalanga………………………………………………………………………..……….….….....48
Table 9: Scarce skills list for Limpopo………………………………………………………………………………………………………………...……..48
Table 10: National Top 10 Critical Skills List………………………………………………………………………………………………………..……..50
Table 11: National Policies alignment to W&RSETA strategies………………………………………………………………………….……….61

5
D. ACRONYMS
Acronym Description
ALC Adult Learning Centre
ATR Annual Training Report
BER Bureau for Economic Research
BUSA Business Unity South Africa
CGCSA Consumer Goods Council of South Africa
DBE Department of Basic Education
DHET Department of Higher Education and Training
FDI Foreign direct investment
FMCG Fast Moving Consumer Goods
FRA Fuel Retailers Association South Africa
GDP Gross Domestic Product
IMF International Monetary Fund
IPAP Industrial Policy Action Plan
NDP National Development Plan
NEC Not Elsewhere Classified
NGP New Growth Path
NQF National Qualifications Framework
NSA National Skills Accord
NSDS National Skills Development Strategy
OFO Organising Framework for Occupations
PIVOTAL Professional, Vocational, Technical and Academic Learning
PSET Post School Education and Training
PWC Price Waterhouse Coopers
QCTO Quality Council for Trades and Occupations
QLFS Quarterly Labour Force Survey
RA Retailers Association
RMI Retail Motor Industry Organisation
SAQA South African Qualifications Authority
SARB South Africa Reserve Bank
SERO Socio-Economic Review and Outlook
SETA Sector Education and Training Authority
SIC Standard Industrial Classification

6
Acronym Description
SIPs Strategic Infrastructure Projects
SMME Small, Medium and Micro Enterprises
SSP Sector Skills Plan
STATSSA Statistics South Africa
TVET Technical and Vocational Education and Training
UNISA University of South Africa
USD United States Dollar
W&RSETA Wholesale and Retail Sector Education and Training Authority
WEO World Economic Outlook
WPPSET White Paper for Post-School Education and Training
WSP Workplace Skills Plan
7
Executive Summary
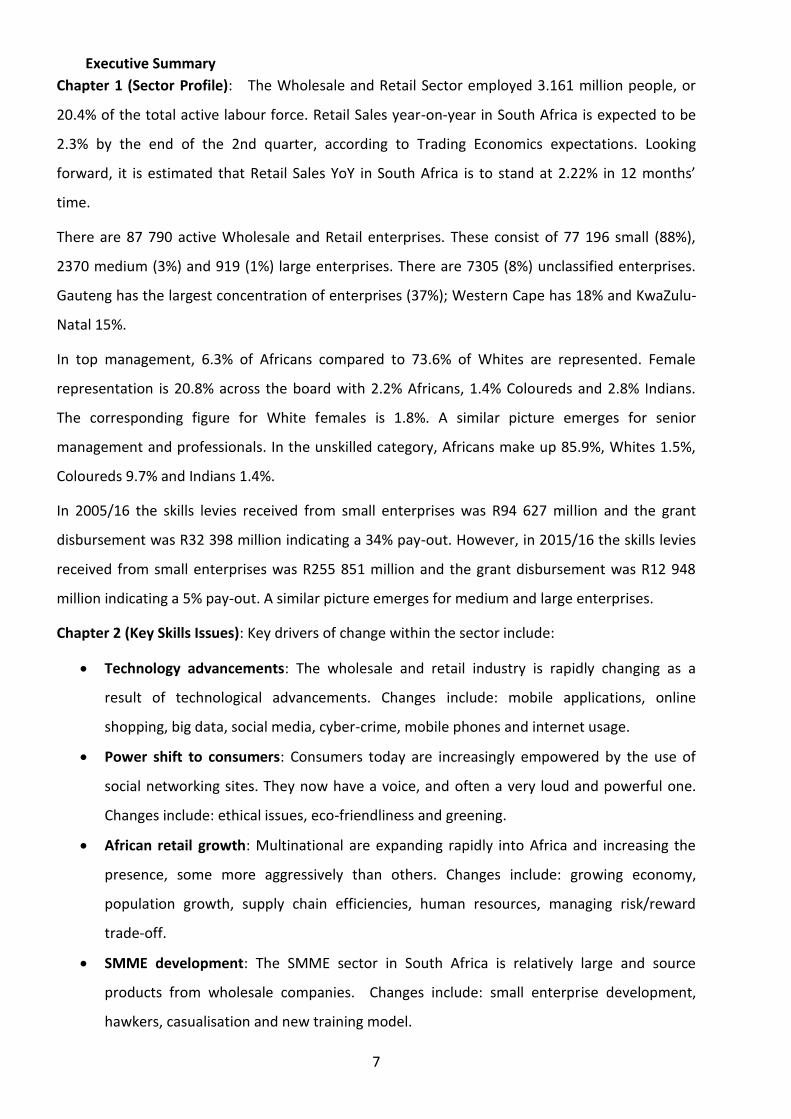
Chapter 1 (Sector Profile): The Wholesale and Retail Sector employed 3.161 million people, or
20.4% of the total active labour force. Retail Sales year-on-year in South Africa is expected to be
2.3% by the end of the 2nd quarter, according to Trading Economics expectations. Looking
forward, it is estimated that Retail Sales YoY in South Africa is to stand at 2.22% in 12 months’
time.
There are 87 790 active Wholesale and Retail enterprises. These consist of 77 196 small (88%),
2370 medium (3%) and 919 (1%) large enterprises. There are 7305 (8%) unclassified enterprises.
Gauteng has the largest concentration of enterprises (37%); Western Cape has 18% and KwaZulu-
Natal 15%.
In top management, 6.3% of Africans compared to 73.6% of Whites are represented. Female
representation is 20.8% across the board with 2.2% Africans, 1.4% Coloureds and 2.8% Indians.
The corresponding figure for White females is 1.8%. A similar picture emerges for senior
management and professionals. In the unskilled category, Africans make up 85.9%, Whites 1.5%,
Coloureds 9.7% and Indians 1.4%.
In 2005/16 the skills levies received from small enterprises was R94 627 million and the grant
disbursement was R32 398 million indicating a 34% pay-out. However, in 2015/16 the skills levies
received from small enterprises was R255 851 million and the grant disbursement was R12 948
million indicating a 5% pay-out. A similar picture emerges for medium and large enterprises.
Chapter 2 (Key Skills Issues): Key drivers of change within the sector include:
Technology advancements: The wholesale and retail industry is rapidly changing as a
result of technological advancements. Changes include: mobile applications, online
shopping, big data, social media, cyber-crime, mobile phones and internet usage.
Power shift to consumers: Consumers today are increasingly empowered by the use of
social networking sites. They now have a voice, and often a very loud and powerful one.
Changes include: ethical issues, eco-friendliness and greening.
African retail growth: Multinational are expanding rapidly into Africa and increasing the
presence, some more aggressively than others. Changes include: growing economy,
population growth, supply chain efficiencies, human resources, managing risk/reward
trade-off.
SMME development: The SMME sector in South Africa is relatively large and source
products from wholesale companies. Changes include: small enterprise development,
hawkers, casualisation and new training model.
8
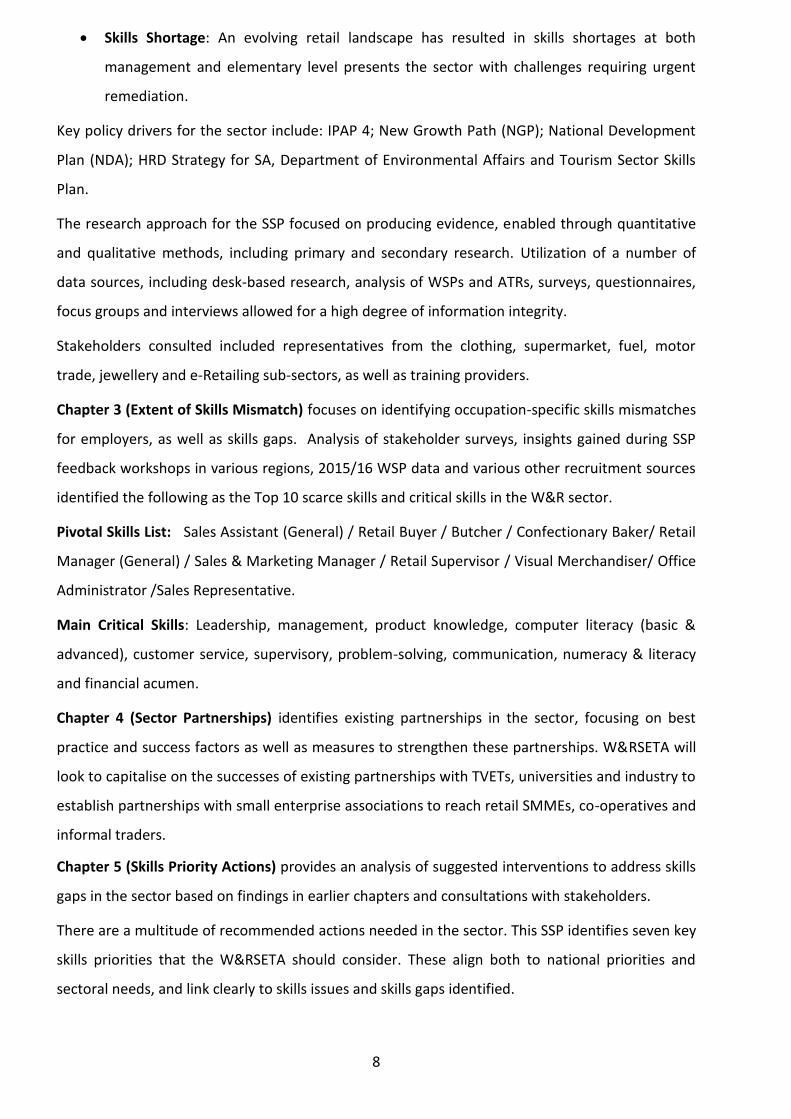
Skills Shortage: An evolving retail landscape has resulted in skills shortages at both
management and elementary level presents the sector with challenges requiring urgent
remediation.
Key policy drivers for the sector include: IPAP 4; New Growth Path (NGP); National Development
Plan (NDA); HRD Strategy for SA, Department of Environmental Affairs and Tourism Sector Skills
Plan.
The research approach for the SSP focused on producing evidence, enabled through quantitative
and qualitative methods, including primary and secondary research. Utilization of a number of
data sources, including desk-based research, analysis of WSPs and ATRs, surveys, questionnaires,
focus groups and interviews allowed for a high degree of information integrity.
Stakeholders consulted included representatives from the clothing, supermarket, fuel, motor
trade, jewellery and e-Retailing sub-sectors, as well as training providers.
Chapter 3 (Extent of Skills Mismatch) focuses on identifying occupation-specific skills mismatches
for employers, as well as skills gaps. Analysis of stakeholder surveys, insights gained during SSP
feedback workshops in various regions, 2015/16 WSP data and various other recruitment sources
identified the following as the Top 10 scarce skills and critical skills in the W&R sector.
Pivotal Skills List: Sales Assistant (General) / Retail Buyer / Butcher / Confectionary Baker/ Retail
Manager (General) / Sales & Marketing Manager / Retail Supervisor / Visual Merchandiser/ Office
Administrator /Sales Representative.
Main Critical Skills: Leadership, management, product knowledge, computer literacy (basic &
advanced), customer service, supervisory, problem-solving, communication, numeracy & literacy
and financial acumen.
Chapter 4 (Sector Partnerships) identifies existing partnerships in the sector, focusing on best
practice and success factors as well as measures to strengthen these partnerships. W&RSETA will
look to capitalise on the successes of existing partnerships with TVETs, universities and industry to
establish partnerships with small enterprise associations to reach retail SMMEs, co-operatives and
informal traders.
Chapter 5 (Skills Priority Actions) provides an analysis of suggested interventions to address skills
gaps in the sector based on findings in earlier chapters and consultations with stakeholders.
There are a multitude of recommended actions needed in the sector. This SSP identifies seven key
skills priorities that the W&RSETA should consider. These align both to national priorities and
sectoral needs, and link clearly to skills issues and skills gaps identified.

9
SMME and cooperatives development: SMMEs, cooperatives, and informal traders have
tremendous potential to create jobs and grow the sector. It is critical that these
enterprises are supported with skills development. New training models are needed to
meet the training needs of SMMEs.
Youth unemployment: The retail sector provides significant temporary employment
opportunities for the youth. School-leavers and graduates are employed as packers,
cashiers and clerks. The challenge is to convert these into permanent employment and
encourage career development in the sector. This will encourage students to join the
sector, rather than view it as a “second option”.
Scarce and critical skills: The identification of critical and scarce skills is a key deliverable of
the SSP. This is necessary to ensure that the work of the SETA responds to the changing,
demand-side needs of the sector. It also ensures that investments in skills development
are effective and efficient since priority skills are addressed. The identification of scarce
skills is also necessary to inform the DHET’s National List of Occupations in High Demand.
Stakeholder engagement: Stakeholder partnerships are increasingly becoming the
adopted approach to meeting industry needs for skilled workers and workers’ need for
better jobs. Partnerships address current and emerging occupational needs and skill gaps.
It offers a mechanism to focus scarce resources on industries that are major job providers
in an area, as well as to focus comprehensively on the workforce skills, from entry level to
advanced, required in the economy. Partnerships provide a means for the W&RSETA to
engage directly with industry across traditional boundaries better aligning training
programmes and resources.
Training and employment of the disabled: Despite a very progressive legislation and a
clear commitment from the government, the majority of people with disabilities (PWD)
still do not access the same opportunities of leading an independent life as non-disabled
people do. Access to employment is low among people with disabilities. Therefore,
improving access to mainstream training and access to employment are priorities to
ensure that people with disabilities are able to fully participate in society.
Trade union capacity-building: There is a need to build institutional and individual
capacities in trade unions. Individual capacities should be developed at all levels from
general secretary to union members.
Green Skills: The W&RSETA interventions will also be aimed at promoting green skills in
the sector by establishing necessary and relevant partnerships with other organizations.
The capacity development sessions and awareness programmes will be used in addressing
the green skills in the sector.

10
1 Chapter 1: Sector Profile Introduction
This chapter presents a profile of the wholesale and retail sector. It outlines the scope, size, and shape of the sector; thus providing a sense of the contribution of the sector in economic and employment terms.
The sector profile describes the scope of coverage of the sector, its key role-players, its economic performance and labour market profile; and how it has been evolving.
1.1 Scope of Coverage
The Wholesale and Retail Sector Education and Training Authority (W&RSETA) was established in 2000 in terms of the Skills Development Act 97 of 1998 (as amended). This public entity is responsible for supporting skills development in the wholesale and retail (W&R) sector of South Africa through the implementation of learning programmes, disbursement of grants and monitoring of education and training as outlined the Act, accompanying regulations and the National Skills Development Strategy III (NSDS III).
Wholesale trade deals with the bulk buying of goods from various manufacturers and the breaking
down of this bulk into smaller quantities which is then sold to the retailer. Retail trade deals with
the buying of goods from the wholesaler and selling of such goods to the consumer.
The actual activities that fall within the scope of the wholesale and retail sector are demarcated according to Standard Industrial Classification (SIC) codes.
The scope of coverage of the W&RSETA in terms of the Skills Development Act 97 of 1998 is as follows:
Table 1: SIC Codes Wholesale & Retail
SIC CODE TRADE CATEGORY
Wholesale
61000 Wholesale and commission trade, except for motor vehicles and motor cycles
61100 Wholesale trade on a fee or contract basis
61220 Wholesale trade in food, beverages and tobacco
61310 Wholesale trade in textiles, clothing and footwear
61391 Wholesale trade in household furniture requisites and appliances
61392 Wholesale trade in books and stationery
61393 Wholesale trade in precious stones, jewellery and silverware
61394 Wholesale trade in pharmaceuticals, toiletries and medical equipment
61420 Wholesale trade in metal and metal ores
61430 Wholesale trade in construction materials, hardware, plumbing and heating equipment
61501 Office machinery and equipment, including computers
61509 Other machinery
61901 General wholesale trade
61909 Other wholesale trade not elsewhere classified (nec)
Retail
62000 Retail trade, except for motor vehicles and motor cycles; repair of personal and household goods

11
62110 Retail trade in non-specialised stores with food, beverages and tobacco dominating
62190 Other retail trade non-specialised stores
62201 Retail trade in fresh fruit and vegetables
62202 Retail trade in meat and meat products
62203 Retail trade in bakery products
62204 Retail trade in beverages (bottle stores)
62209 Other retail trade in food, beverages and tobacco (nec)
62311 Retail of non-prescribed medicine and pharmaceutical products other than by pharmacists
62321 Retail trade in men’s and boy’s clothing
62322 Retail trade in ladies‟ and girls‟ clothing
62323 Retail trade by general outfitters and by dealers in piece goods, textiles, leather and travel accessories
62324 Retail trade in shoes
62330 Retail trade in household furniture appliances, articles and equipment
62340 Retail trade in hardware, paints and glass
62391 Retail trade in reading matter and stationery
62392 Retail trade in jewellery, watches and clocks
62393 Retail trade in sports goods and entertainment requisites
62399 Retail trade by other specified stores
62400 Retail trade in second-hand goods in stores
63122 Retail sale of used motor vehicles
63311 Sale of tyres
63500 Retail sale of automotive fuel
Source: StatsSA (2016)
It is important to note that the revised SETA landscape associated with NSDS III (and thus applicable from 1 April 2011 to 31March 2016) led to the transfer of petrol retail subsector from the merSETA to W&RSETA1.
The following key sub-sectors have been identified for by stakeholders within the retail and wholesale sector, for the purposes of consultation on input to this SSP2:
Clothing sub-sector
Supermarket sub-sector
Motor trade and fuel sub-sector
e-Retailing sub-sector
Jewellery sub-sector
Hardware
Merchandising.
1 Dr Blade Nzimande (2010). Press briefing the new SETA landscape for the period April 2011 till March 2016, 09
November 2010. Online: http://www.dhet.gov.za/portals/0/documents/SETA%20Landscape.pdf (Accessed on 10 May 2014). 2 These sub-sectors are as defined by the wholesale and retail sector, and do not necessarily correspond to the SIC
code categories.

12
The types of wholesalers in the Wholesale and Retail Sector is illustrated in the graph below. Wholesalers of solid, liquid & gaseous fuels & related products dominate the sector followed by food, beverages & tobacco and machinery & equipment and supplies wholesalers. Precious stones, jewellery & silverware wholesalers make up only 2% of the total number of wholesalers in the sector. The W&RSETA should ensure that the skills requirements of the dominant wholesalers are taken into account when planning skills development interventions.
Figure 1-1: Proportion of wholesalers by type of wholesale activity
Source: StatsSA, 2016
The figure below depicts the types of retail enterprises in the Retail sector. General dealers dominate the sector, making up 42% of all retail enterprises. This is followed by textiles, clothing, footwear and leather goods retailers that comprise 20% of the retail sector. Retailers of household furniture, appliances and equipment make up a relatively small portion at 4% of the total. Skills requirements of the dominant types of retailers need to be prioritised when planning skills development interventions. Figure 1-2: Proportion of retailers by type of retail activity
Source: StatsSA, 2015
4%
6%
17%
3%
11%
2%
20%
3%
6%
4%
16%
8%
0%
5%
10%
15%
20%
25%
Fee or
contractbasis
Agricultural
raw materials
&livestock
Food,
beverages &
tobacco
Textiles,
clothing &
footwear
Other
household goods except
precious stones
Precious
stones, jewellery
& silverware
Solid,
liquid & gaseous fuels & related
products
Metals
& metal ores
Construction
& building
ores
Other
intermediate products, waste &
scrap
Machinery
&equipment
& supplies
Other
goods
Pro
po
rtio
n o
f w
ho
lesa
lers
Type of Wholesaler
42%
9%7%
20%
4%
8%10%
0%
5%
10%
15%
20%
25%
30%
35%
40%
45%
General dealers Food, beverages and tobacco in
specialised stores
Pharmaceuticals and medical
goods, cosmetics and toiletries
Textiles, clothing,
footwear and leather goods
Household furniture,
appliances and equipment
Hardware, paint and glass
All other retailers
Pro
po
rtio
n o
f re
tail
ers
Type of retailer

13
1.2 Key Role Players
Key role players within the sector include individual retailers and wholesalers that due to their size have a significant impact on the sector. This influence may be exerted directly, for instance through contribution to total sales, or indirectly, through buying power, or through participation in industry organisations. Associations that play a role in the Wholesale and Retail Sector include the stakeholders outlined in the following table.
Table 2: W&RSETA Key role players

14
Table 1-1: Key Role Players in the Wholesale and Retail Sector
Role Player Description
Business Unity South Africa (BUSA)
BUSA is a confederation of South African chambers of commerce and industry, professional and corporate associations, and unisectoral employers’ organizations. BUSA’s key role in the Wholesale and Retail Sector is supporting and developing the role of small and medium Wholesale and Retail Sector business enterprises
Consumer Goods Council of South Africa (CGCSA)
CGCSA is a member organisation that acts as the representative body of the entire consumer goods industry. The CGCSA facilitates engagement between stakeholders in the industry, and they represent the interests of the industry to the government and other relevant parties.
The FET Committee The committee includes representatives from the FET sector. The FET Committee has an important role to play in accommodating scarce and critical skills within the sector.
FRA FRA is an association of fuel service station owners. The Association monitors and becomes involved wherever necessary with retail fuel governance, distribution and sales in South Africa in order to protect and enhance fuel retailers’ interest.
The HET Committee The committee includes representatives from the higher education and training sector. The HET Committee has an important role to play in accommodating scarce and critical skills within the sector.
Labour Organised labour is a key component of the sector, and as such has a critical role to play with regards to skills development.
Private Training Providers – Association of Private Providers of Education Training and Development (APPETD)
APPETD is as an alliance of the Association of Private Colleges of South Africa (APCSA), Association of Private Distance Colleges (APDEC), Association of Technical Providers (ATP), and INPROV. APPETD renders services that are specifically aimed at the needs and interests of its members and private providers as a whole.
South African Petroleum Retailers Association (SAPRA)
The South African Petroleum Retailers Association (SAPRA) represents and promotes the interests of Petroleum Retailers in South Africa. SAPRA is a constituent association of RMI.
Retail Motor Industry Organisation (RMI)
The RMI is the retail and associated motor industry organisation focused on enabling motor traders to deliver high end service to motoring customers in South Africa.
SMMEs (Small, Medium and Micro Enterprises)
Small retail enterprises constitute 78% of the sector’s employers, and as such represent a key stakeholder group in the sector.
15
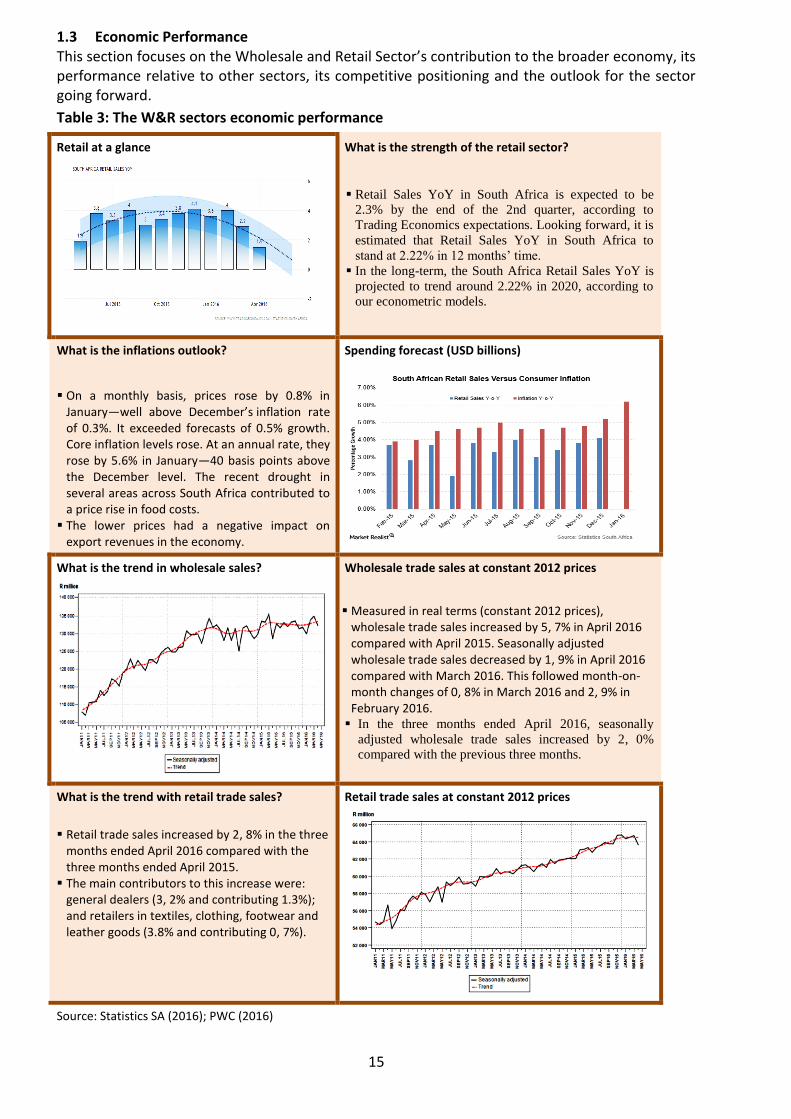
1.3 Economic Performance This section focuses on the Wholesale and Retail Sector’s contribution to the broader economy, its performance relative to other sectors, its competitive positioning and the outlook for the sector going forward.
Table 3: The W&R sectors economic performance
Retail at a glance
What is the strength of the retail sector?
Retail Sales YoY in South Africa is expected to be
2.3% by the end of the 2nd quarter, according to
Trading Economics expectations. Looking forward, it is
estimated that Retail Sales YoY in South Africa to
stand at 2.22% in 12 months’ time.
In the long-term, the South Africa Retail Sales YoY is
projected to trend around 2.22% in 2020, according to
our econometric models.
What is the inflations outlook?
On a monthly basis, prices rose by 0.8% in January—well above December’s inflation rate of 0.3%. It exceeded forecasts of 0.5% growth. Core inflation levels rose. At an annual rate, they rose by 5.6% in January—40 basis points above the December level. The recent drought in several areas across South Africa contributed to a price rise in food costs.
The lower prices had a negative impact on export revenues in the economy.
Spending forecast (USD billions)
What is the trend in wholesale sales?
Wholesale trade sales at constant 2012 prices
Measured in real terms (constant 2012 prices), wholesale trade sales increased by 5, 7% in April 2016 compared with April 2015. Seasonally adjusted wholesale trade sales decreased by 1, 9% in April 2016 compared with March 2016. This followed month-on-month changes of 0, 8% in March 2016 and 2, 9% in February 2016.
In the three months ended April 2016, seasonally
adjusted wholesale trade sales increased by 2, 0%
compared with the previous three months.
What is the trend with retail trade sales?
Retail trade sales increased by 2, 8% in the three
months ended April 2016 compared with the three months ended April 2015.
The main contributors to this increase were: general dealers (3, 2% and contributing 1.3%); and retailers in textiles, clothing, footwear and leather goods (3.8% and contributing 0, 7%).
Retail trade sales at constant 2012 prices
Source: Statistics SA (2016); PWC (2016)

16
1.4 Employer Profile
As per the 2015 WSP/ATR data, there are 7 613 active Wholesale and Retail enterprises. These are made up of 5905 small, 1189 medium and 519 large enterprises .Retail enterprises dominate the Wholesale and Retail Sector as indicated by the graph below. Retailers also make up more than 50% of small, medium and large enterprises in the sector. Figure 1-3: Proportion of Wholesale and Retail Enterprises by size (Small: n=5905, Medium: n= 1189, Large: n= 519)
Source: WSP/ATR (2016)
The graph below illustrates that the Wholesale and Retail Sector is dominated by small enterprises which make up 78% of enterprises. Large enterprises make up only 7% of enterprises. The predominance of small enterprises highlights the need for skills development initiatives to ensure adequate coverage of this sub-sector.
The employer breakdown of the sector is as follows:
Table 4: W&R enterprises by size and province
PROVINCE LARGE MEDIUM SMALL UNKNOWN TOTAL
Gauteng North 214 542 17219 3229 21204
Western Cape 153 334 13371 1509 15367
KwaZulu-Natal 165 446 11662 978 13251
Gauteng South 234 435 10462 20 11151
Eastern Cape 45 171 5928 356 6500
Mpumalanga 29 110 5012 508 5659
Free State 20 84 4795 263 5162
Limpopo 36 139 3662 144 3981
North West 16 81 2584 171 2852
Northern Cape 7 28 1344 104 1483
(Blank) 0 0 1157 23 1180
Total 919 2370 77 196 7305 87 790
Source: W&R WSP/ATR data, 2015/16
The above Table reveals the following:
There are 87 790 active Wholesale and Retail enterprises. These consist of 77 196 small (88%), 2370 medium (3%) and 919 (1%) large enterprises. There are 7305 (8%) unclassified enterprises.
Gauteng has the largest concentration of enterprises (37%); Western Cape has 18% and KwaZulu-Natal 15%.
Northern Cape has 2% of all enterprises in the W&R sector. This may be due to minimal W&R activity in the province.
41% 43% 43%58% 56% 56%1% 1% 1%
2424
514 226
3424667 289
57 8 4
0%
10%
20%
30%
40%
50%
60%
70%
Small Medium Large
Pro
po
rtio
n o
f En
terp
rise
s
Size of Enterprises
Wholesale Retail Unknown

17
Table 1-2: Provincial Spread of W&RSETA enterprises by size (Small: n=5905, Medium: n= 1189, Large: n= 519)
Province Small Medium Large
Eastern Cape 462 86 31
Free State 248 33 15
Gauteng 2048 384 221
KwaZulu-Natal 718 235 92
Limpopo 306 71 19
Mpumalanga 308 56 13
North West 229 40 9
Northern Cape 163 18 3
Western Cape 1423 266 116
Total 5905 1189 519 Source: WSP/ATR (2016)
According to WSP/ATR data, 16% (1235) of Wholesale and Retail Sector enterprises are located in rural areas. Such a significant percentage points to the need to ensure the reach of skills development initiatives into rural areas. Figure 1-4: Location of Enterprises by Size (Small: n=5905, Medium: n= 1189, Large: n= 519)
Source: WSP/ATR (2016)
As illustrated below, large enterprises have more than two thirds of the total number of wholesale and retail staff. These points to the opportunity to reach a large number of employees via skills development initiatives directed through large enterprises. Figure 1-5: Proportion of Staff (n=751 848)
Source: WSP/ATR (2015)
15% 14% 72%
111 288 102 398
538 162
0%
10%
20%
30%
40%
50%
60%
70%
80%
Small Medium Large
Pro
po
rtio
n o
f St
aff
Size of Enterprise

18
1.5 Labour Market Profile
This section analyses the labour market context for the sector. It provides key employer and employee data and information on the sector.
The figure below illustrates the growth of employment in the Wholesale and Retail Sector between 2004 and 2014. In 2004, there were 2.748 million employees in the sector and in 2014 there were 3.247 million employees in the sector. This represents an increase of 499 000 (18%) employees between 2004 and 2014. Employment in the sector shows a steady growth from 2004 to 2007. The global economic crisis in 2008 caused employment in the sector to drop. Employment rebounded in the sector in 2012 and has shown slow growth between 2013 and 2014. Figure 1-6: Employment in the Wholesale and Retail Trade 2004-2014 (000’)
Source: StatsSA Quarterly Labour Force Survey, Quarter 1, 2015
There were 15.3 million people employed in South Africa in 2014. The Wholesale and Retail Sector employed 3.247 million people, or 21% of the total labour force.
The growth in the number of employees in the sector points to an increase in skills development needs for the immediate future.
There were 2.239 million (69%) people in formal employment and 1.008 million (31%) people in informal employment in the Wholesale and Retail Sector. While formal sector employment has experienced steady growth between 2012 and 2014, informal sector employment has experienced a steady decline. Skill development initiatives focused on the informal sector provide an opportunity to address this decline, and to help realise the growth potential the sector would otherwise present. Figure 1-7: Proportion of Employees by Formal and Informal Sector
Source: StatsSA Quarterly Labour Force Survey, Quarter 1, 2015
0
500
1000
1500
2000
2500
3000
3500
4000
2004 2005 2006 2007 2008 2009 2010 2011 2012 2013 2014
Nu
mb
er
of
Emp
loye
es
(00
0)
Year
69%35% 32% 31%
2 0182 192 2 239
1 0901 032 1 008
0%
10%
20%
30%
40%
50%
60%
70%
80%
2012 2013 2014
Pro
po
rtio
n o
f Em
plo
yees
(00
0)
Year
Formal
Informal

19
Gauteng has the highest number of Wholesale and Retail Sector employees, as illustrated in the figure below despite the fact that there has been a slow decline in numbers between 2012 and 2014. The Eastern Cape, Free State, North West and Limpopo experienced increases in the number of employees from 2013 to 2014.
The prevalence of high employee numbers in Gauteng, the Western Cape, and KwaZulu-Natal highlight the need for skills development initiatives to ensure adequate coverage of these provinces. Low employment numbers in the Northern Cape, Free State and the North West indicate the need for targeted skills development in these areas. Skills development initiatives need to take into account the local economic development needs of provinces. This will require the W&RSETA to analyse provincial economies and labour markets. Figure 1-8: Employment in the Wholesale and Retail Sector by province (000)
Source: StatsSA Quarterly Labour Force Survey, Quarter 1, 2015
The figure below illustrates the number of employees in the Wholesale and Retail Sector by gender between 2012 and 2014. Between 2012 and 2013, the number of males employed in the Wholesale and Retail Sector decreased and the number of females employed increased. However in 2014, the number of male employees increased and the number of female employees decreased increasing the gender gap to 6%. Stakeholder feedback indicated that there is a lack of females in Management positions in the Wholesale and Retail Sector. Skills development interventions need to focus on management training programmes for women to ensure that this imbalance is addressed.
Western Cape Eastern CapeNorthern
CapeFree State
KwaZulu-Natal
North West Gauteng Mpumalanga Limpopo
2012 428 269 50 148 470 158 1 067 251 267
2013 496 263 51 139 567 163 1 011 265 271
2014 466 289 47 170 530 177 1 002 254 312
0
200
400
600
800
1 000
1 200
Nu
mb
er
of
Emp
loye
es
(00
0)
20
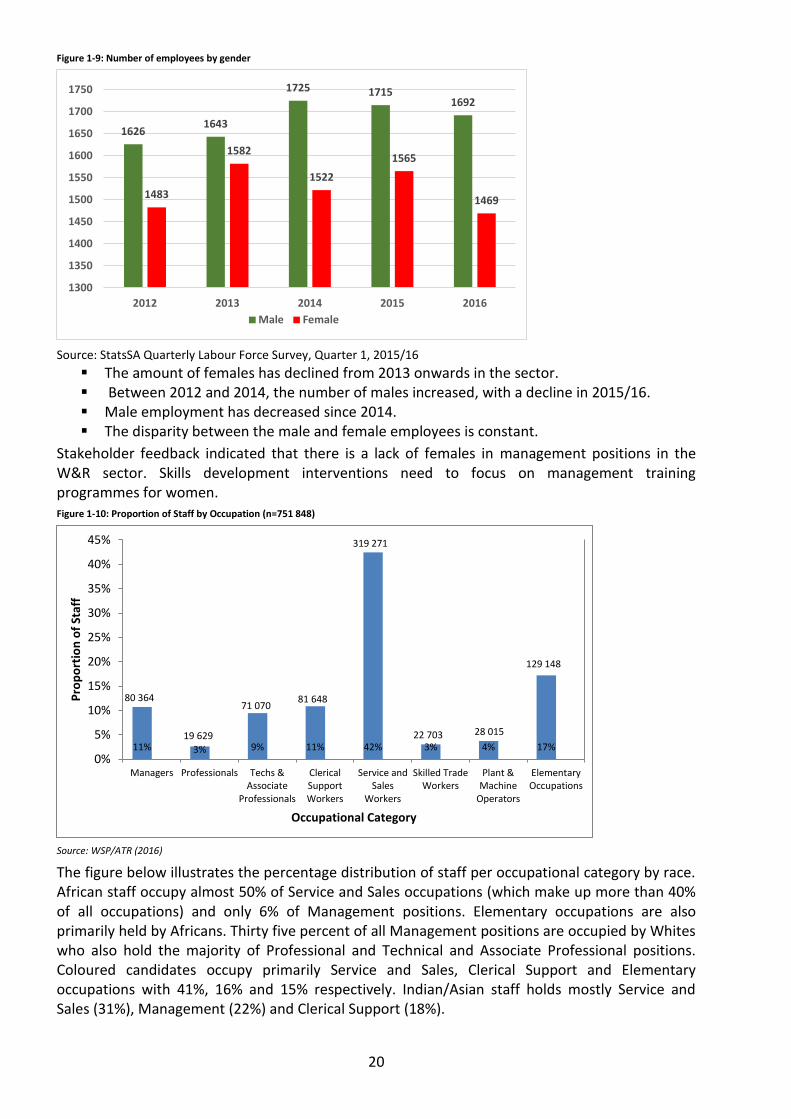
Figure 1-9: Number of employees by gender
Source: StatsSA Quarterly Labour Force Survey, Quarter 1, 2015/16
The amount of females has declined from 2013 onwards in the sector. Between 2012 and 2014, the number of males increased, with a decline in 2015/16. Male employment has decreased since 2014. The disparity between the male and female employees is constant.
Stakeholder feedback indicated that there is a lack of females in management positions in the W&R sector. Skills development interventions need to focus on management training programmes for women. Figure 1-10: Proportion of Staff by Occupation (n=751 848)
Source: WSP/ATR (2016)
The figure below illustrates the percentage distribution of staff per occupational category by race. African staff occupy almost 50% of Service and Sales occupations (which make up more than 40% of all occupations) and only 6% of Management positions. Elementary occupations are also primarily held by Africans. Thirty five percent of all Management positions are occupied by Whites who also hold the majority of Professional and Technical and Associate Professional positions. Coloured candidates occupy primarily Service and Sales, Clerical Support and Elementary occupations with 41%, 16% and 15% respectively. Indian/Asian staff holds mostly Service and Sales (31%), Management (22%) and Clerical Support (18%).
1626 1643
1725 1715 1692
1483
1582
1522
1565
1469
1300
1350
1400
1450
1500
1550
1600
1650
1700
1750
2012 2013 2014 2015 2016
Male Female
11% 3% 9% 11% 42% 3% 4% 17%
80 364
19 629
71 070 81 648
319 271
22 703 28 015
129 148
0%
5%
10%
15%
20%
25%
30%
35%
40%
45%
Managers Professionals Techs &Associate
Professionals
ClericalSupportWorkers
Service andSales
Workers
Skilled TradeWorkers
Plant &Machine
Operators
ElementaryOccupations
Pro
po
rtio
n o
f St
aff
Occupational Category
21
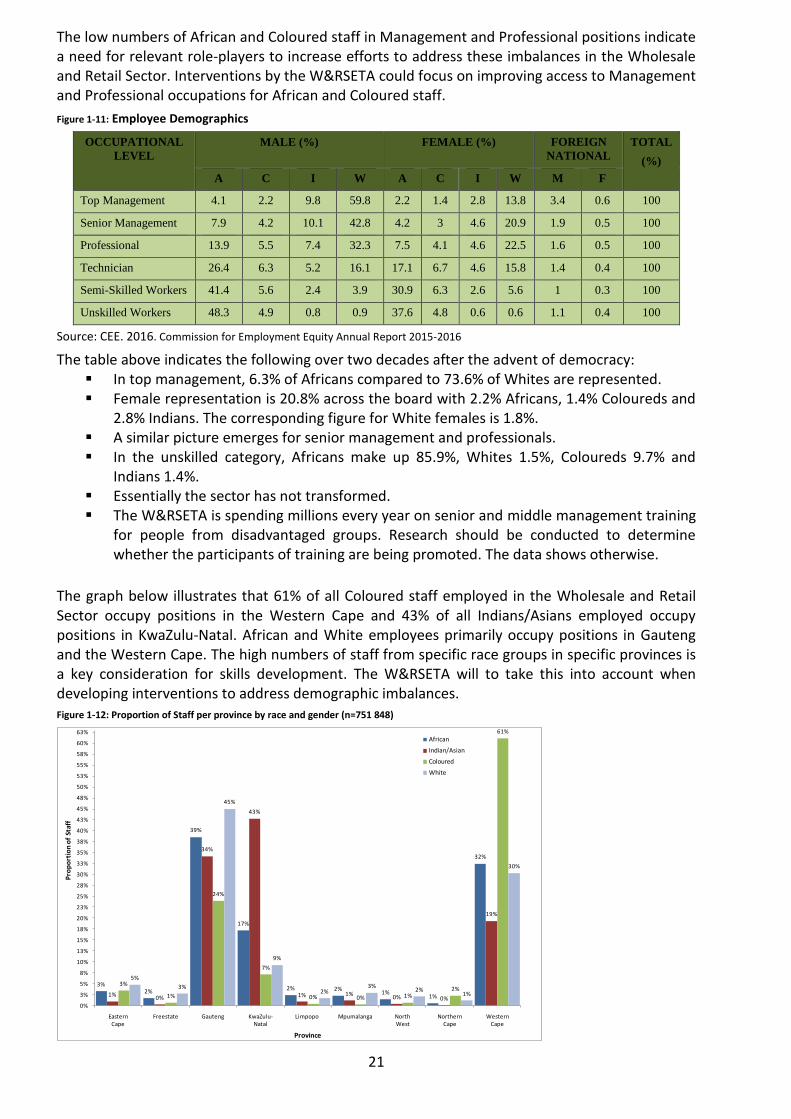
The low numbers of African and Coloured staff in Management and Professional positions indicate a need for relevant role-players to increase efforts to address these imbalances in the Wholesale and Retail Sector. Interventions by the W&RSETA could focus on improving access to Management and Professional occupations for African and Coloured staff.
Figure 1-11: Employee Demographics
OCCUPATIONAL
LEVEL
MALE (%) FEMALE (%) FOREIGN
NATIONAL
TOTAL
(%)
A C I W A C I W M F
Top Management 4.1 2.2 9.8 59.8 2.2 1.4 2.8 13.8 3.4 0.6 100
Senior Management 7.9 4.2 10.1 42.8 4.2 3 4.6 20.9 1.9 0.5 100
Professional 13.9 5.5 7.4 32.3 7.5 4.1 4.6 22.5 1.6 0.5 100
Technician 26.4 6.3 5.2 16.1 17.1 6.7 4.6 15.8 1.4 0.4 100
Semi-Skilled Workers 41.4 5.6 2.4 3.9 30.9 6.3 2.6 5.6 1 0.3 100
Unskilled Workers 48.3 4.9 0.8 0.9 37.6 4.8 0.6 0.6 1.1 0.4 100
Source: CEE. 2016. Commission for Employment Equity Annual Report 2015-2016
The table above indicates the following over two decades after the advent of democracy: In top management, 6.3% of Africans compared to 73.6% of Whites are represented. Female representation is 20.8% across the board with 2.2% Africans, 1.4% Coloureds and
2.8% Indians. The corresponding figure for White females is 1.8%. A similar picture emerges for senior management and professionals. In the unskilled category, Africans make up 85.9%, Whites 1.5%, Coloureds 9.7% and
Indians 1.4%. Essentially the sector has not transformed. The W&RSETA is spending millions every year on senior and middle management training
for people from disadvantaged groups. Research should be conducted to determine whether the participants of training are being promoted. The data shows otherwise.
The graph below illustrates that 61% of all Coloured staff employed in the Wholesale and Retail Sector occupy positions in the Western Cape and 43% of all Indians/Asians employed occupy positions in KwaZulu-Natal. African and White employees primarily occupy positions in Gauteng and the Western Cape. The high numbers of staff from specific race groups in specific provinces is a key consideration for skills development. The W&RSETA will to take this into account when developing interventions to address demographic imbalances. Figure 1-12: Proportion of Staff per province by race and gender (n=751 848)
3%2%
39%
17%
2% 2%1%
1%
32%
1%0%
34%
43%
1% 1%0% 0%
19%
3%
1%
24%
7%
0% 0% 1%2%
61%
5%
3%
45%
9%
2%3%
2%1%
30%
0%
3%
5%
8%
10%
13%
15%
18%
20%
23%
25%
28%
30%
33%
35%
38%
40%
43%
45%
48%
50%
53%
55%
58%
60%
63%
Eastern Cape
Freestate Gauteng KwaZulu-Natal
Limpopo Mpumalanga North West
Northern Cape
Western Cape
Pro
po
rtio
n o
f St
aff
Province
African
Indian/Asian
Coloured
White

22
Source: WSP/ATR (2016)
The graph below illustrates that almost 50% of all staff below 35 years old and almost 35% of all staff between 35 and 55 are employed as Service and Sales workers. Employees older than 55 years primarily hold Management and Service and Sales positions. This is an important indicator for capacity planning for the W&RSETA. Interventions to provide the high number of younger staff with workplace experience in areas such as management should aim to leverage the skills and experience of older staff. Figure 1-13: Proportion of Staff per occupational category, by age (n=751 848)
Source: WSP/ATR (2016)
The table below indicates the number of staff in each of the occupational categories by age. Table 1-3: Number of staff per occupational category by age (n= 751 848)
Occupational Category Less than 35 35 to 55 Greater than 55
Managers 28 556 44 524 7 284
Professionals 9 128 9 154 1 347
Techs & Associate Professionals 41 021 26 946 3 103
Clerical Support Workers 44 844 31 991 4 813
Service and Sales Workers 216 678 93 923 8 670
Skilled Trade Workers 10 710 10 957 1 036
Plant & Machine Operators 10 971 14 316 2 728
Elementary Occupations 78 847 45 944 4 357
Total 440 755 277 755 33 338 Source: WSP/ATR (2016)
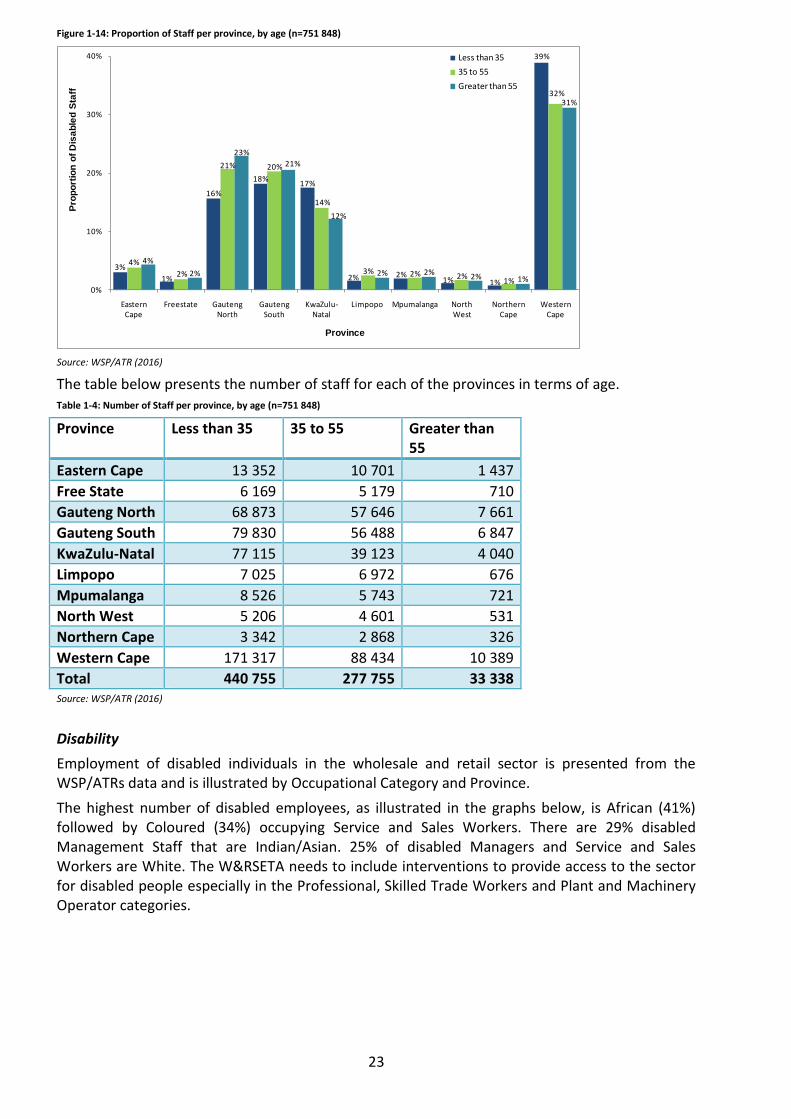
Gauteng, as indicated in the graph below, has almost 44% of staff older than 55 and 41% between 35 and 55 years old. The Western Cape has the highest number of staff younger than 35, closely followed by Gauteng and then KwaZulu-Natal.
The management and professional areas appear to be dominated by the older age groups, which point to the need for succession planning, and for skill development initiatives required to support growth of skills in these areas.
6%
2%
9% 10%
49%
2% 2%
18%16%
3%
10%12%
34%
4% 5%
17%
22%
4%
9%
14%
26%
3%
8%
13%
0%
10%
20%
30%
40%
50%
60%
Managers Professionals Techs & Associate
Professionals
Clerical Support Workers
Service and Sales Workers
Skilled Trade Workers
Plant & Machine
Operators
Elementary Occupations
Pro
po
rtio
n o
f S
taff
Occupational Category
Less than 3535 to 55Greater than 55
23
Figure 1-14: Proportion of Staff per province, by age (n=751 848)
Source: WSP/ATR (2016)
The table below presents the number of staff for each of the provinces in terms of age. Table 1-4: Number of Staff per province, by age (n=751 848)
Province Less than 35 35 to 55 Greater than 55
Eastern Cape 13 352 10 701 1 437
Free State 6 169 5 179 710
Gauteng North 68 873 57 646 7 661
Gauteng South 79 830 56 488 6 847
KwaZulu-Natal 77 115 39 123 4 040
Limpopo 7 025 6 972 676
Mpumalanga 8 526 5 743 721
North West 5 206 4 601 531
Northern Cape 3 342 2 868 326
Western Cape 171 317 88 434 10 389
Total 440 755 277 755 33 338 Source: WSP/ATR (2016)
Disability
Employment of disabled individuals in the wholesale and retail sector is presented from the WSP/ATRs data and is illustrated by Occupational Category and Province.
The highest number of disabled employees, as illustrated in the graphs below, is African (41%) followed by Coloured (34%) occupying Service and Sales Workers. There are 29% disabled Management Staff that are Indian/Asian. 25% of disabled Managers and Service and Sales Workers are White. The W&RSETA needs to include interventions to provide access to the sector for disabled people especially in the Professional, Skilled Trade Workers and Plant and Machinery Operator categories.
3%
1%
16%
18%17%
2% 2%1% 1%
39%
4%
2%
21% 20%
14%
3% 2% 2%1%
32%
4%
2%
23%
21%
12%
2% 2%2% 1%
31%
0%
10%
20%
30%
40%
Eastern Cape
Freestate Gauteng North
Gauteng South
KwaZulu-Natal
Limpopo Mpumalanga North West
Northern Cape
Western Cape
Pro
po
rtio
n o
f D
isa
ble
d S
taff
Province
Less than 35
35 to 55
Greater than 55

24
Figure 1-15: Proportion of Disabled Staff per Occupational Category, by Race (n=2 209)
Source: WSP/ATR (2016)
The tables below indicate the number of staff for each of the occupational categories in terms of race. Table 1-5: Number of staff per occupational category by race (n=2 209)
Occupational Category African Indian/Asian Coloured White
Managers 47 50 23 106
Professionals 17 7 11 38
Techs & Associate Professionals 161 28 41 62
Clerical Support Workers 195 42 84 64
Service and Sales Workers 508 31 126 106
Skilled Trade Workers 36 0 23 16
Plant & Machine Operators 29 4 19 6
Elementary Occupations 241 10 47 31
Total 1234 172 374 429 Source: WSP/ATR (2016)
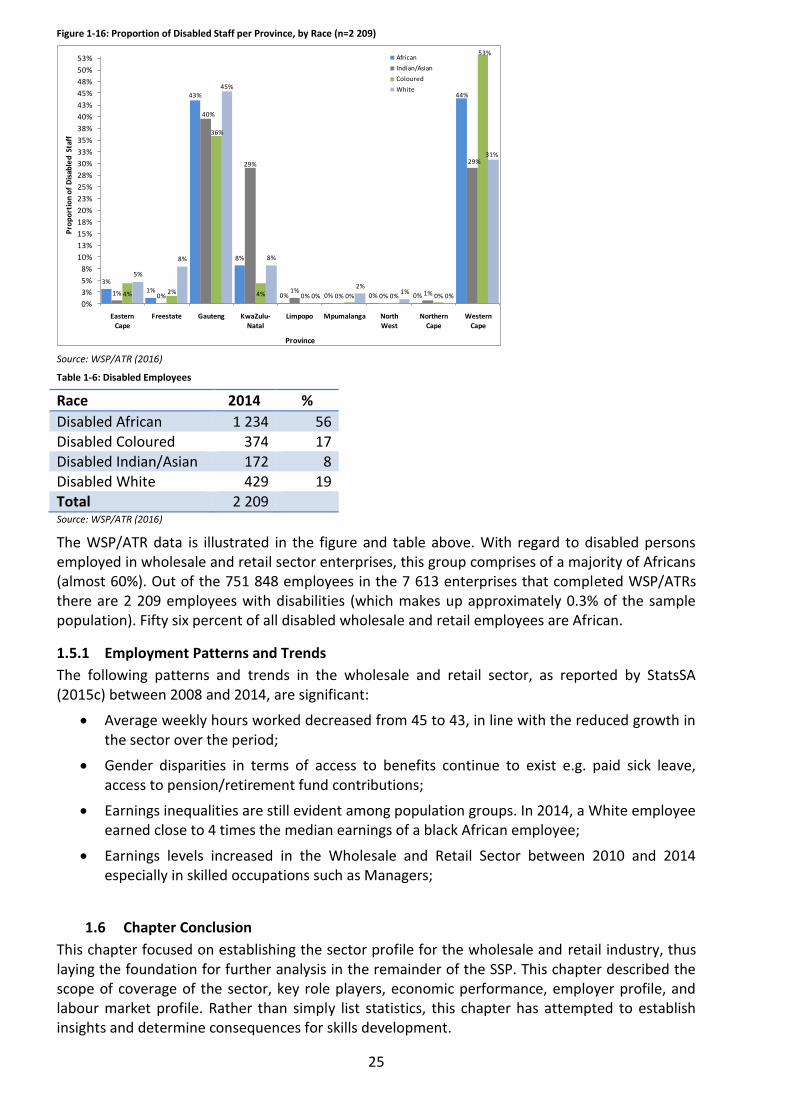
Fifty three percent of disabled staff in the Western Cape are Coloured followed by 44% who are African. Gauteng enterprises employ disabled employees from all races with the highest number of White (45%) disabled employees followed by African (43%), Indian/Asian (40%) and then Coloured (36%). The W&RSETA needs to focus skills development initiatives for the disabled in the rest of the provinces such as Limpopo, the North West, the Northern Cape and Mpumalanga. These interventions need to take into the consideration the total number of staff in these provinces in comparison to other provinces.
4%
1%
13%
16%
41%
3% 2%
20%
29%
4%
16%
24%
18%
0%
2%
6%6%
3%
11%
22%
34%
6%5%
13%
25%
9%
14% 15%
25%
4%
1%
7%
0%
5%
10%
15%
20%
25%
30%
35%
40%
45%
Managers Professionals Techs & Associate
Professionals
Clerical Support Workers
Service and Sales Workers
Skilled Trade Workers
Plant & Machine
Operators
Elementary Occupations
Pro
po
rtio
n o
f D
isab
led
Sta
ff
Occupational Category
African
Indian/Asian
Coloured
White
25
Figure 1-16: Proportion of Disabled Staff per Province, by Race (n=2 209)
Source: WSP/ATR (2016) Table 1-6: Disabled Employees
Race 2014 %
Disabled African 1 234 56 Disabled Coloured 374 17 Disabled Indian/Asian 172 8 Disabled White 429 19 Total 2 209 Source: WSP/ATR (2016)
The WSP/ATR data is illustrated in the figure and table above. With regard to disabled persons employed in wholesale and retail sector enterprises, this group comprises of a majority of Africans (almost 60%). Out of the 751 848 employees in the 7 613 enterprises that completed WSP/ATRs there are 2 209 employees with disabilities (which makes up approximately 0.3% of the sample population). Fifty six percent of all disabled wholesale and retail employees are African.
1.5.1 Employment Patterns and Trends
The following patterns and trends in the wholesale and retail sector, as reported by StatsSA (2015c) between 2008 and 2014, are significant:
Average weekly hours worked decreased from 45 to 43, in line with the reduced growth in the sector over the period;
Gender disparities in terms of access to benefits continue to exist e.g. paid sick leave, access to pension/retirement fund contributions;
Earnings inequalities are still evident among population groups. In 2014, a White employee earned close to 4 times the median earnings of a black African employee;
Earnings levels increased in the Wholesale and Retail Sector between 2010 and 2014 especially in skilled occupations such as Managers;
1.6 Chapter Conclusion
This chapter focused on establishing the sector profile for the wholesale and retail industry, thus laying the foundation for further analysis in the remainder of the SSP. This chapter described the scope of coverage of the sector, key role players, economic performance, employer profile, and labour market profile. Rather than simply list statistics, this chapter has attempted to establish insights and determine consequences for skills development.
3%1%
43%
8%
0% 0% 0% 0%
44%
1% 0%
40%
29%
1%0% 0% 1%
29%
4% 2%
36%
4% 0% 0% 0% 0%
53%
5%
8%
45%
8%
0%
2%1%
0%
31%
0%
3%
5%
8%
10%
13%
15%
18%
20%
23%
25%
28%
30%
33%
35%
38%
40%
43%
45%
48%
50%
53%
Eastern Cape
Freestate Gauteng KwaZulu-Natal
Limpopo Mpumalanga North West
Northern Cape
Western Cape
Pro
po
rtio
n o
f D
isab
led
Sta
ff
Province
African
Indian/Asian
Coloured
White
26
Chapter 2: Key Skills Issues Introduction
This chapter focuses on identifying factors that are driving change in the sector; influencing skills demand either positively or negatively.
1.7 Change Drivers
There are a number of external and internal factors that impact the demand for and supply of skills in the Wholesale and Retail Sector. Issues such as enabling access and demographic equity drive change in the country towards a skilled and capable workforce. These issues also form the basis for enhanced employability and employment within the Wholesale and Retail Sector via skills development and training.
The South African government has shown a commitment to addressing issues that constrain growth and development in the country such as the lack of a skilled workforce. This needs to be mirrored by the W&RSETA.
Research Approach
Extensive research and analysis based on desk based research as well as feedback from stakeholders via focus group sessions, interviews and surveys, has culminated in the following key factors that affect the demand for and supply of skills. Implications on skills development are also indicated for each factor. The change drivers below have emerged as key themes from desktop research, surveys, and interviews, validated in particular through stakeholder engagement through focus groups conducted throughout the country.
1.7.1 Growth into Africa
In the past decade, a growing number of globally-minded South African wholesalers and retailers have expanded into attractive foreign markets as part of their growth strategy.
However globalisation requires a significant investment of time, money and resources.
Major retailers and wholesalers are penetrating the African economy and some are increasing their presence. In order to successfully move into unfamiliar and unpredictable geographies, these enterprises need to be aware of and prepared for challenges posed by different economic, political and cultural environments. The impact on resource requirements is great as qualifications, skills and experience to work in the international trading environment is critical.
The W&R SETA needs to focus skills development initiatives on programmes to improve knowledge of the global trading environment, including potential study visits to the relevant international locations.
1.7.2 Speed to Market
Remaining competitive in a sluggish market, particularly in the face of threats such as the entry of foreign retailers (such as Wal-Mart), is dependent on speed to market and responsiveness to fast-changing consumer preferences. The ability to innovate, source and alter stock levels in line with changing consumer demands is therefore vital. Small batch production; short lead times; quick style and product changes; and speed from manufacturer to retail floor are all areas that staff needs to be conversant with.
W&RSETA skills development initiatives must focus on training in areas such as:
complex supply chains;
methodologies such as just-in-time;
entrepreneurship; and
customer relationship management

27
1.7.3 Digital Revolution
In order for the Wholesale and Retail Sector to become efficient, effective and economical enough to maximise profit margins and customer experience, technological change is critical. The retail industry is in the midst of a consumer revolution. The key drivers of this revolution are the rapid adoption of mobile devices, digital media and tablets equipped with shopping applications. Wholesalers and retailers risk potential growth and development if they do not stay abreast of technology.
The type, level and mix of skills required by multi-channel retailing presents a challenge to the sector. The W&R SETA needs to focus skills development on initiatives such as learnerships that include new technologies, and training in digital media, social networking and marketing. The skills development emphasis should include developing of talent pipelines to harness customer strategies.
1.7.4 Skills Shortage
The shortage of skills has been researched and analysed and is presented in detail in Section 3.3 of this report. Stakeholders highlighted PIVOTAL, Scarce and Critical skills and reasons for the scarcity. The skills gaps exist for various occupational categories and levels from Management to Elementary occupations and from numeracy and literacy to supervisory skills. Wholesale and Retail Sector workers are required to keep abreast of the rapidly evolving landscape in areas such as retail management processes and operations.
The lack of staff with the required qualifications and skills especially retail-specific experience, combination skills such as product knowledge and sales, basic literacy and numeracy skills, and technical training aggravate skills shortages. Stakeholders emphasized the lack of learners with the requisite level of numeracy and literacy and comments include “our assessment processes place Grade 12 learners at an effective Grade 9 level” (Focus Groups, 2015). Coupled with this is the lack of suitable staff and training providers in specific locations.
Skills shortages in the sector especially for PIVOTAL occupations have the potential to impact successful operations and growth in the sector. The impact on staff is that they are placed in roles for which they are often neither qualified nor experienced and are thus unable to perform key functions.
The impact on skills development in the Wholesale and Retail Sector is the need for initiatives to partner with training providers to address these specific pivotal, scarce and critical skills. Stakeholder comments highlighted that skills development should focus on, amongst others:
“bridging programmes in both numeracy and literacy”;
Training in sales with sector-specific product knowledge in sports equipment, hardware, interior design, electrical, lighting, pharmaceutical, furniture and fuel retail.
1.7.5 Responsible Buying
The emergence of responsible buying (e.g. a preference for organic food, green technologies, and socially-conscientious purchases) is a consumer trend that retailers increasingly need to be responsive to. Such changing consumer preferences present both risks (with regard to product substitution) and opportunities (to encourage additional sales) to retailers. To respond to such challenges and opportunities, retailers need to stay abreast of such emerging consumer needs, and to plan and implement suitable responses. For instance, making organic food available to consumers, while ensuring cost-competiveness, requires research skills, negotiation skills (e.g. to establish the required relationships with small producers), and a mastery of logistics (e.g. to ensure product reaches retail outlets in good time, at reasonable cost).
The type, level and mix of skills required by consumer responsible buying presents a challenge to the sector. The W&R SETA needs to focus skills development on initiatives such as learnerships that include consumer research, green technologies, negotiation, and logistics.

28
1.8 Alignment with National Strategy and Plans Policy and legislation that inform the W&R SETA’s Strategic Plan and Annual Performance Plan must be taken into account in the Wholesale and Retail Sector skills planning. These policies aim to ensure uniformity and facilitate impact through the education and training system. Below is a table summarising the National Policies that guide the operations of the W&R SETA. It demonstrates the alignment of the W&R SETA Strategic Plan to Government National Policies and Strategies. Table 1-7: National Strategies/ Policies and their implications for Skills Development in the Wholesale and Retail Sector
National Strategies/ Policies Impacting on the Wholesale and Retail Sector
National Skills Accord 8 commitments to be followed:
Expand more fully the level of training using existing facilities
Create internship and placement opportunities available in the workplace
Set guidelines of ratios of trainees and artisans, as well as across the technical vocations, in order to improve level of training
Improve the funding of training, the use of funds available for training and provide incentives for companies to train
Set annual targets for training in state-owned enterprises
Improve SETA governance and financial management, as well as stakeholder involvement
Align training to the New Growth Path and improve SSPs
Improve the role and performance of TVET colleges
Industrial Policy Action Plan II (IPAP II) IPAP has identified several growth sectors which will address the high rate of unemployment in the country.
New Growth Path (NGP) The New Growth Path identifies 5 job drivers:
Infrastructure for employment and development
Improving job creation in employment and development
Seizing the potential of new economies
Investing in social capital
Spatial development
National Development Plan 2030 (NDP) The National Development Plan 2030 has identified the following 9 key areas in order to achieve a development approach that is sustainable and inclusive:
Creating jobs and livelihoods
Expanding infrastructure
Transitioning to low carbon economy
Transforming urban and rural spaces
Improving education and training
Providing quality healthcare
Building a capable state
Fighting corruption and enhancing accountability
Transforming society and uniting the nation
White Paper for Post-School Education and Training (WPPSET)
Set out strategies to improve the capacity of post-school education and training system to meet SA’s needs.
It is a vision for an integrated system of post-school education and training with all institutions playing their roles.
National Skills Development Strategy (NSDSIII)
The vision is a skilled and capable workforce that shares in, and contributes to, the benefits and opportunities of economic expansion and an inclusive growth path.
Acts as strategic guide for skills development and provides direction to skills planning and implementation in the SETAs.
Sets out the linkages with, and responsibilities of, other education and training stakeholders.

29
1.9 Chapter Conclusion
This chapter focused on identifying and describing factors that are driving change in the sector; influencing skills demand either positively or negatively. These findings lead into the analysis undertaken in the next chapter.
30
Chapter 3: Extent of Skills Mismatch Introduction
This chapter focuses on understanding occupation-specific skills mismatches for employers in the sector; including consideration of the extent and nature of supply and demand for skills.
The demand for Wholesale and Retail Sector skills focuses on employment patterns and conditions, the occupations that research and analysis have shown to be difficult to fill, the number, type and availability of training providers as well as the gap areas. An analysis of the supply side is presented covering secondary and tertiary sectors as well as W&R SETA training. These two sub-sections are concluded with a view of the challenges that currently dominate. This chapter also provides lists of key PIVOTAL, scarce and critical skills developed from extensive research and stakeholder engagement that include the e-Retail and Fuel Retail Sectors. Reasons for the scarcity and potential interventions are then outlined.
1.10 Extent and Nature of Demand The demand for skills refers to the employers’ needs for skills in the sector. This section covers various aspects of skills demand in the Wholesale and Retail Sector.
1.10.1 Employment Patterns and Trends
Attrition
The perceptions of stakeholders with respect to patterns and trends that impact employment in the sector indicate that there is significant attrition in the sector due to the sector being “used as a stepping stone” and “extreme high turnover due to poaching” (Focus Groups, 2015). Working conditions for Wholesale and Retail Sector staff was also cited as a challenge in the sector in terms of attracting and retaining staff. Stakeholder input suggests that employees are likely to “resign for a better proposition elsewhere” once they have obtained the training and/or experience. Job descriptions are cited as “changing much faster than what the curricula allows” due to issues such as technological advances that require specific information-related qualifications and skills. Stakeholders indicated that this has resulted in people occupying roles that they are unable to fulfill.
Changing Demographics
There was also an indication from stakeholders that there are “more women being employed than men” and that the “market has been flooded by women”. This is despite the perception that there are “men sitting at home who have skills that can be used to fill shortages”. Some stakeholders on the other hand, indicated that “women are still locked out of the main stream of the economy” and “there are certain occupations that women are still shying away from as they find them too aggressive” and “there are few women in retail management/leadership”.
Stakeholders also indicated that the “influx of foreign nationals into the country” is impacting employment for South Africa citizens.
Earnings Trends
In terms of wage trends in the Wholesale and Retail Sector, median monthly earnings increased from R2 900 in 2010 to R3 033 in 2014. Earnings levels also increased in the Wholesale and Retail Sector between 2010 and 2014 especially in skilled occupations such as Managers and Professionals. Earnings inequalities are however still evident among population groups. In 2014, a White employee earned close to 4 times the median earnings of a black African employee. Median earnings in 2014 were highest in Gauteng and Western Cape.
1.10.2 Conditions of Employment
According to a recent proposal submitted by the COSATU-affiliated Southern African Clothing & Textile Workers’ Union (SACTWU), the average monthly minimum wage for the lowest paid worker in the retail sector (shop assistant) and the lowest paid worker in the wholesale sector
31
(general assistant) is far below the average monthly minimum wage for a labourer in the manufacturing sector. SACTWU submitted its proposals to the Employment Conditions Commission to increase the wages of all categories of retail workers. This follows a government gazette notice recently published by the minister of labour, notifying the industry that the sectoral determination governing conditions of employment in the Wholesale & Retail Sector is being reviewed3.
This was substantiated by the following comments by stakeholders (Focus Groups & Interviews, 2015) about the low remuneration, which appears to sometimes have a link to geography:
o “low salaries in comparison to corporate sector”; o “not attractive to specialist skills e.g. Accountant and IT”; o “The will to work on commission is very hard to come by. People mostly want
a job with a fixed salary that they are guaranteed without having to work hard for it”;
o “salary not aligned to strong candidates in other provinces”; o “Salary range offered in KZN lower than in Gauteng”; and o “Cannot meet salary expectations”.
Stakeholders also indicated poor conditions of employment that included unsuitable working hours:
o “long working hours include weekends”; o “long retail hours”; o “hours work is always a problem”; o “retail store trading Hours are also a deterrent”; and o “Position entails the successful candidate to work half days, for which many
candidates were not happy with”. Occupations in the Wholesale and Retail Sector are reported as often being stressful:
o “Work pressure is high”; o “Employees have more stress and responsibilities in this working
environment”; and o “This vacancy is very strenuous; it involves a lot of commitment, hard work
and skills”.
1.10.3 Occupations that are difficult to fill Occupations are defined as difficult to fill when finding candidates with the relevant qualifications, work experience and attributes at current remuneration levels to fill these occupations generally take at least 3 months. The high demand for General Retail Managers is due to there not being enough people with experience in this profession. According to stakeholders, it is especially difficult in specialist retail stores such as in multi-media where candidates either have the technical skills and lack the management experience or vice versa. In rural communities, finding Retail Managers with the skills to run their store independently is reported as being a huge challenge. Difficulties experienced in sourcing Sales Assistants are due to a lack of product knowledge and experience particularly in the cellular and hardware industries. Retailers such as jewelers reported finding it difficult to source candidates that can pass the required polygraph test. Stakeholders indicate that the difficulty in filling positions for butchers is due to a lack of qualified and skilled candidates.
3 Fin24. (2015). Clothing retail workers must earn much more. [Online]. Available from www.fin24.com. [Accessed: 19th July 2015].

32
A lack of accredited training providers was also cited as an issue in areas such as Port Elizabeth. The primary reason stakeholders provided for a lack of Retail Supervisors in the Wholesale and Retail Sector is a lack of qualified people. This was also stated as the main reason for difficulties in filling Confectionary Baker positions together with insufficient new entrants into the industry. Service Stations Attendant positions are difficult to fill due to a high staff turnover. Stakeholders indicated that staff often left once they were trained. The reason for scarcity in filling Forklift Driver vacancies is the lack of candidates with licenses that meet equity requirements. Stakeholders indicated that the shortage of Retail Buyers and planner is primarily due to lack of experience in specific industries such as the Clothing, Footwear and Apparel industry. Reasons provided for the scarcity in Automotive Parts Salespersons include poaching by competitors once employees are trained, lack of product knowledge and sales techniques and a lack of experience in specific areas such as trailer parts sales. Office Cashiers are, according to feedback from stakeholders, difficult to source in the rural areas of the Eastern and Northern Cape. An additional challenge is the high staff turnover of this occupation.
1.10.4 Number and Types of Vacancies The online vacancy analysis below draws on research conducted by The Career Junction, South Africa’s largest online recruitment website. The information is based on occupations in all sectors.
1.10.4.1 High Skills Demand The graph below indicates sectors in which there is a high skills demand. Figure 0-1: Sectors with a high skills demand
Source: Career Junction Index, June 2015
The overview of vacancy levels across various industries illustrated in the figure above provides a good indication of where the majority of employment takes place. The Information Technology and Finance industries are undoubtedly the most sought after, followed by the Engineering; FMCG (Fast Moving Consumer Goods), Retail & Wholesale; and Admin, Office and Support industries, among others listed.
1.10.4.2 Recruitment Conditions
Below is a table of the online labour market situation, taking into account the amount of active career seekers and the amount of advertised jobs on the Career Junction website. The table shows the number of work-seekers who have applied for jobs per advert on the Career Junction website. It thus gives an indication of skills demand. Note that this is not an indication of how
0% 5% 10% 15% 20% 25%
Information Technology
Finance
Engineering
FMCG, Retail & Wholesale
Admin, Office & Support
Manufacturing, Production &Trades
Medical
Human Resources and Recruitment
Sales
Distribution, Warehousing & Freight
% Skills Demand
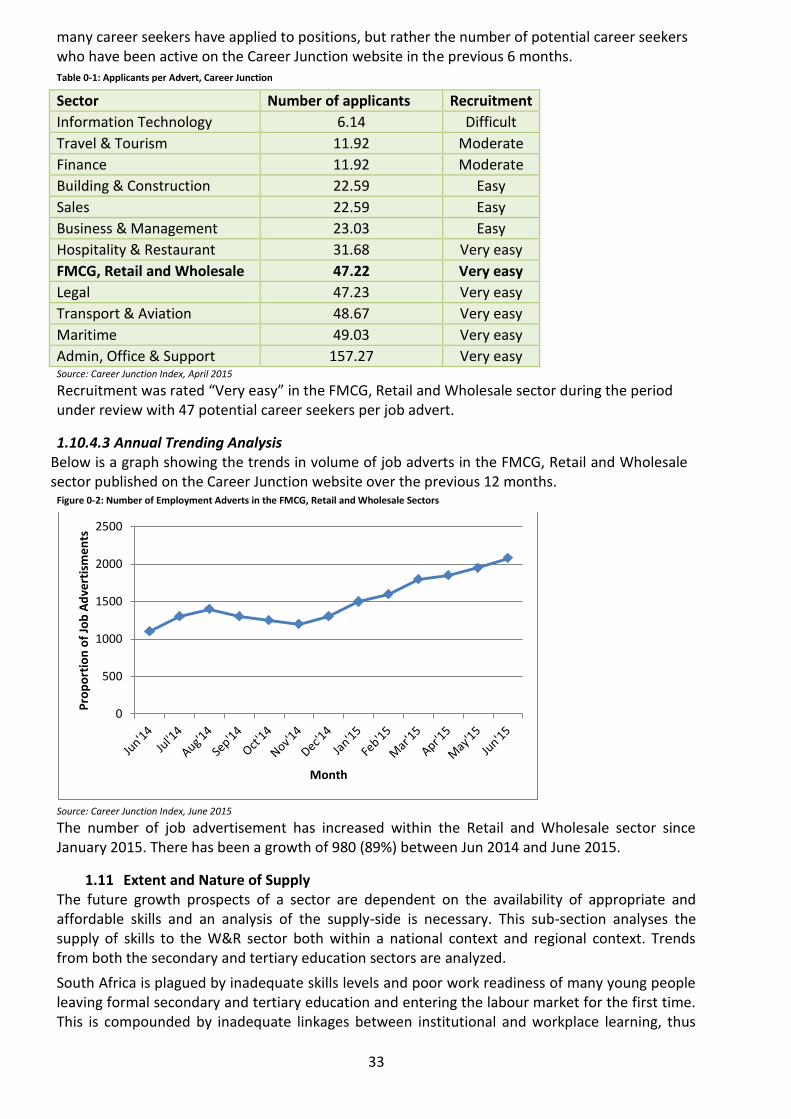
33
many career seekers have applied to positions, but rather the number of potential career seekers who have been active on the Career Junction website in the previous 6 months. Table 0-1: Applicants per Advert, Career Junction
Sector Number of applicants Recruitment
Information Technology 6.14 Difficult
Travel & Tourism 11.92 Moderate
Finance 11.92 Moderate
Building & Construction 22.59 Easy
Sales 22.59 Easy
Business & Management 23.03 Easy
Hospitality & Restaurant 31.68 Very easy
FMCG, Retail and Wholesale 47.22 Very easy
Legal 47.23 Very easy
Transport & Aviation 48.67 Very easy
Maritime 49.03 Very easy
Admin, Office & Support 157.27 Very easy Source: Career Junction Index, April 2015
Recruitment was rated “Very easy” in the FMCG, Retail and Wholesale sector during the period under review with 47 potential career seekers per job advert.
1.10.4.3 Annual Trending Analysis Below is a graph showing the trends in volume of job adverts in the FMCG, Retail and Wholesale sector published on the Career Junction website over the previous 12 months.
Figure 0-2: Number of Employment Adverts in the FMCG, Retail and Wholesale Sectors
Source: Career Junction Index, June 2015
The number of job advertisement has increased within the Retail and Wholesale sector since January 2015. There has been a growth of 980 (89%) between Jun 2014 and June 2015.
1.11 Extent and Nature of Supply The future growth prospects of a sector are dependent on the availability of appropriate and affordable skills and an analysis of the supply-side is necessary. This sub-section analyses the supply of skills to the W&R sector both within a national context and regional context. Trends from both the secondary and tertiary education sectors are analyzed.
South Africa is plagued by inadequate skills levels and poor work readiness of many young people leaving formal secondary and tertiary education and entering the labour market for the first time. This is compounded by inadequate linkages between institutional and workplace learning, thus
0
500
1000
1500
2000
2500
Pro
po
rtio
n o
f Jo
b A
dve
rtis
me
nts
Month

34
reducing the employability and work readiness of the successful graduates from TVET and HET institutions
1.11.1 Extent of Occupational Skills Supply
This sub-section establishes the extent of occupational skills supply in the sector, based on sector-specific training and education undertaken. Given that some entrants to the sector possess no more than a basic education, or generic graduate qualifications, this section commences with an examination of output for such general qualifications.
Basic Education A total of 532,860 learners enrolled to write the final matriculation exam last year, with 403,874 passing. A total in excess of 700,000 dropped out before writing matric the previous year. Entry level positions in the Wholesale and Retail sector (such as cashiers and packers) provide opportunities for school leavers, and others that choose not to pursue post schooling qualifications. TVET sector TVET colleges form a critical component of the current training capacity of artisans. TVET colleges offer training for the NQF Level 4 National Certificate Vocational (NCV).
From interviews with employer representatives regarding TVET colleges, industry seems to be willing to work with TVETs to ensure more rounded and capable students are produced. Some employers did mention that TVET colleges are strong on theory but do not adequately equip the students practically. Focus on TVETs should therefore not be on the numbers but rather on the quality of students coming through to ensure their employability and acceptance by industry. Employers interviewed also mentioned that quality of TVET students might not be up to their standards because of the quality of lecturers used specifically using non-tradesmen to teach trades. Greater cooperation between industry and TVETs is required to help feedback into the curriculum and also to provide workplace exposure to both the lecturers and students.
The recommendation that was put across by employers is that the TVET curriculum must be designed in a way that vocational training is always linked to on- the-job work experience to ensure that the skills being acquired are those that are in demand in the workplace. Higher education and training Higher Education and Training, or tertiary education, includes education for undergraduate and postgraduate degrees, certificates and diplomas, up to the level of the doctoral degree. In recent years more school leavers have been getting marks that enable them to enrol for studies at university, which creates bottlenecks in all institutions.
Graduates from universities are potential candidate managers and professionals that can be attracted into the higher occupational categories of the Wholesale and Retail sector.
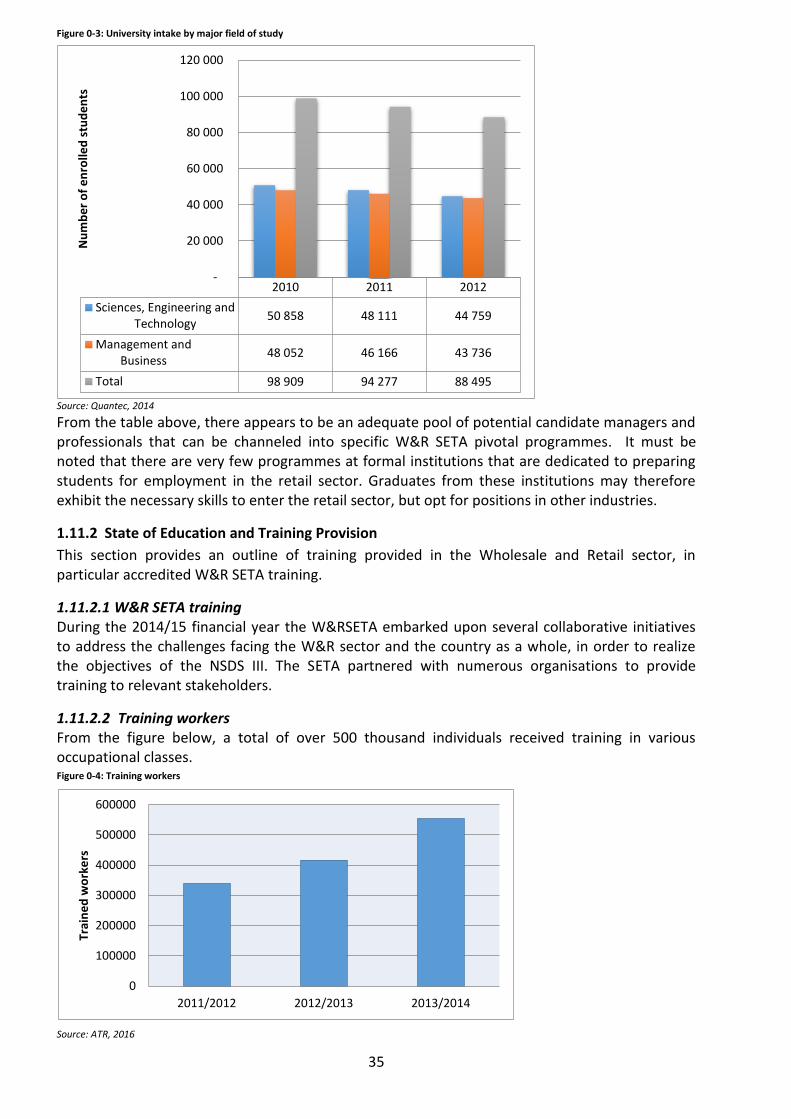
35
Figure 0-3: University intake by major field of study
Source: Quantec, 2014
From the table above, there appears to be an adequate pool of potential candidate managers and professionals that can be channeled into specific W&R SETA pivotal programmes. It must be noted that there are very few programmes at formal institutions that are dedicated to preparing students for employment in the retail sector. Graduates from these institutions may therefore exhibit the necessary skills to enter the retail sector, but opt for positions in other industries.
1.11.2 State of Education and Training Provision
This section provides an outline of training provided in the Wholesale and Retail sector, in particular accredited W&R SETA training.
1.11.2.1 W&R SETA training During the 2014/15 financial year the W&RSETA embarked upon several collaborative initiatives to address the challenges facing the W&R sector and the country as a whole, in order to realize the objectives of the NSDS III. The SETA partnered with numerous organisations to provide training to relevant stakeholders.
1.11.2.2 Training workers From the figure below, a total of over 500 thousand individuals received training in various occupational classes. Figure 0-4: Training workers
Source: ATR, 2016
2010 2011 2012
Sciences, Engineering andTechnology
50 858 48 111 44 759
Management andBusiness
48 052 46 166 43 736
Total 98 909 94 277 88 495
-
20 000
40 000
60 000
80 000
100 000
120 000
Nu
mb
er
of
en
rolle
d s
tud
en
ts
0
100000
200000
300000
400000
500000
600000
2011/2012 2012/2013 2013/2014
Trai
ne
d w
ork
ers

36
The number of workers trained year-on-year represents an uptake in training in the sector. Over 135 000 individuals more were trained during the 2013/2014 period representing a 33% increase from the 2012/2013 figure. Figure 0-5: Number of people trained per occupational class 2013/2014
Source: W&RSETA - Annual Report 2013/14
49% of those trained where in the service and sales workers class followed by 13% from the managers’ occupational class. This level of training has a positive impact on the supply side of labour in the sector. Figure 0-6: Number of people trained per province 2013/2014
Source: W&RSETA - Annual Report 2013/14
As is to be expected the provinces with the greatest proportion of people trained in 2013/2014 were Gauteng, KwaZulu-Natal, and the Western Cape, those provinces with the highest number of employees for the sector. The table below records the number of people trained by occupations. Table 0-2: Planned training by Top 30 occupations
Large and medium companies Small companies
Occupation No. Trained
Occupation No. Trained
Sales Assistant (General) 204 853 Service Station Attendant 4 944
Retail Manager (General) 52 199 Sales Assistant (General) 4 841
Checkout Operator 33 795 Store Person 1 762
General Clerk 19 864 Office Cashier 1 442
Retail Supervisor 12 848 Checkout Operator 1 411
Shelf Filter 12 844 General Clerk 959
0% 10% 20% 30% 40% 50% 60%
Clerical support workers
Elementary occupations
Managers
Plant and machine operators and assemblers
Professionals
Service and sales workers
Skilled agriculture, forestry, fishery, craft and…
Technicians and associate professionals
6% 4%
37%
16%
5%
5%
4%
2%
21%
Eastern Cape
Free State
Gauteng
KwaZulu Natal
Limpopo
Mpumalanga
North West
Northern Cape
Western Cape

37
Large and medium companies Small companies
Occupation No. Trained
Occupation No. Trained
Stock Clerk / Officer 11 530 Retail Manager (General) 878
Visual Merchandiser 9 376 Delivery Driver 866
Store Person 9 201 Packer (Non Perishable Products) 847
Office Cashier 8 538 Sales Clerk / Officer 775
Call Centre Salesperson 7 065 Sales Representative/Salesman (Industrial Products)
747
Corporate General Manager 6 098 Director (Enterprise / Organisation) 717
Call or Contact Centre Manager 4 554 Retail Supervisor 702
Operations Manager (Non Manufacturing)
4 442 Handyperson 673
Food Service Counter Attendant
4 078 Accounts Clerk 594
Dispatching and Receiving Clerk / Officer
3 946 Commercial Sales Representative 525
Confectionary Baker 3 602 Office Administrator 500
ICT Sales Assistant 3 545 Sales Representative (Personal and Household Goods) 465
Accounts Clerk 3 457 Sales Manager 429
Packer (Non Perishable Products)
3 217
Fire Fighter 379
Retail Buyer 3 125 Sales Representative (Medical and Pharmaceutical Products) 365
Sales and Marketing Manager 3 038 Finance Manager 330
Sales Representative (Personal and Household Goods)
2 784 Shelf Filler 322
Office Administrator 2 733 Warehouse Administrator / Clerk 301
Manufacturer’s Representative 2 609 First Aid Attendant 293
Credit or Loans Officer 2 445 Dispatching and Receiving Clerk / Officer
289
Sales Manager 2 445 Confectionary Baker 282
Food Trade Assistant 2 242 Forklift Driver 271
Supply and Distribution Manager
2 124 Truck Driver (General) 264
Service Station Attendant 1 889 Receptionist (General) 259 Source: ATR, 2015
Most of these occupations have been identified as scarce skills. There seems to be minimal difference between large/medium and small companies in relation to whom they train from the above table
1.11.2.3 High Skills Supply The graph below indicates sectors in which there is a high skills supply according to the Career Junction Index (2015) online analysis.
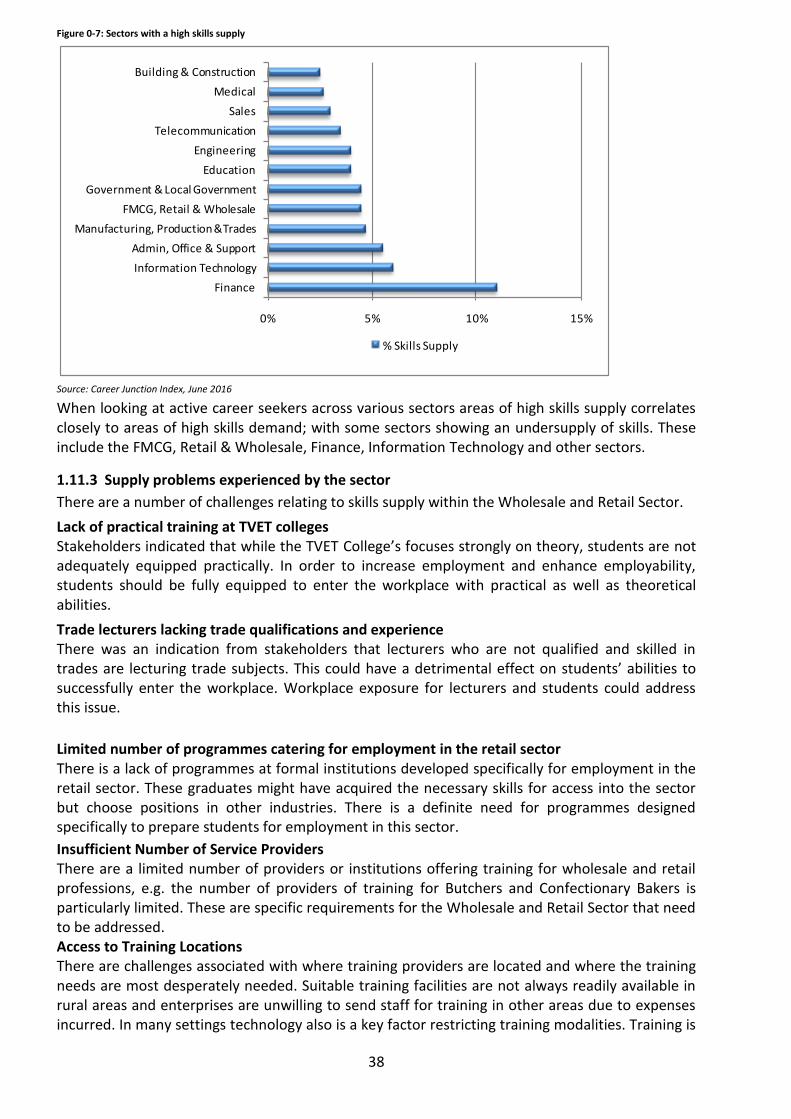
38
Figure 0-7: Sectors with a high skills supply
Source: Career Junction Index, June 2016
When looking at active career seekers across various sectors areas of high skills supply correlates closely to areas of high skills demand; with some sectors showing an undersupply of skills. These include the FMCG, Retail & Wholesale, Finance, Information Technology and other sectors.
1.11.3 Supply problems experienced by the sector
There are a number of challenges relating to skills supply within the Wholesale and Retail Sector.
Lack of practical training at TVET colleges Stakeholders indicated that while the TVET College’s focuses strongly on theory, students are not adequately equipped practically. In order to increase employment and enhance employability, students should be fully equipped to enter the workplace with practical as well as theoretical abilities.
Trade lecturers lacking trade qualifications and experience There was an indication from stakeholders that lecturers who are not qualified and skilled in trades are lecturing trade subjects. This could have a detrimental effect on students’ abilities to successfully enter the workplace. Workplace exposure for lecturers and students could address this issue.
Limited number of programmes catering for employment in the retail sector There is a lack of programmes at formal institutions developed specifically for employment in the retail sector. These graduates might have acquired the necessary skills for access into the sector but choose positions in other industries. There is a definite need for programmes designed specifically to prepare students for employment in this sector.
Insufficient Number of Service Providers There are a limited number of providers or institutions offering training for wholesale and retail professions, e.g. the number of providers of training for Butchers and Confectionary Bakers is particularly limited. These are specific requirements for the Wholesale and Retail Sector that need to be addressed. Access to Training Locations There are challenges associated with where training providers are located and where the training needs are most desperately needed. Suitable training facilities are not always readily available in rural areas and enterprises are unwilling to send staff for training in other areas due to expenses incurred. In many settings technology also is a key factor restricting training modalities. Training is
0% 5% 10% 15%
Finance
Information Technology
Admin, Office & Support
Manufacturing, Production &Trades
FMCG, Retail & Wholesale
Government & Local Government
Education
Engineering
Telecommunication
Sales
Medical
Building & Construction
% Skills Supply

39
often of a generic nature and often there are insufficient providers able to customize in-house training specific to the needs of the organization. Further investigation is required to investigate different training models, the purpose of the training, the quality of teaching and learning, and where the training is located in relation to the need identified.
1.12 Skills Gaps
1.12.1 Skills Demand
1.12.1.1 Scarce skills The term “scarce skill” refers to those occupations in which there is a shortage of qualified and experienced people – current or anticipated. Scarce skills can involve relative scarcity (suitably skilled people that are available, but do not meet other employment criteria) or absolute scarcity (suitably skilled people are not available in the labour market). The following table depicts the 10 most frequently cited occupations for large, medium and small companies in the wholesale & retail sector. Table 2.5: National Top 10 Scarce Occupational List
NO Occupation OFO Code
1 Retail Manager (General) 142103
2 Sales Assistant (General) 522301
3 Butcher 681103
4 Retail Supervisor 522201
5 Baker and Confectionary 681201
6 Service Station Attendant 524501
7 Logistics (Distribution) 734402
8 Retail Buyer and Planner 332301
9 Automotive Parts Salesperson 522303
10 Office Cashier 523102
Source: WSP/ATR Analysis, 2015/16, SSP workshop, feedback, stakeholder survey-2016
The following, illustrated in the figure below, were indicated as key reasons for scarcity in the sector. Almost 54% of all stakeholders surveyed and/or interviewed indicated Skills Shortage as a reason for scarcity. Close to 25% indicated that scarcity is due to the Education System. Figure 0-8: Reasons for Scarcity (n=243)
9.1%
53.7%
13.0%
24.2% Recruitment
Skills shortage
Human capitalinvestment
Education system
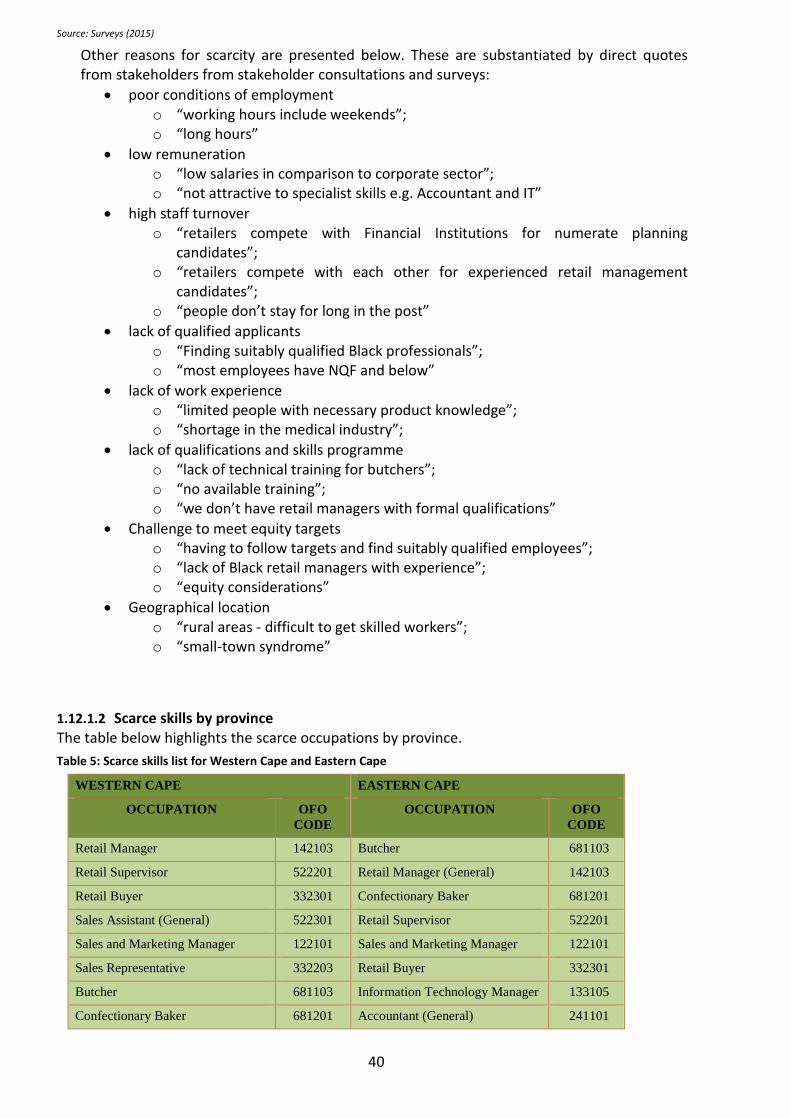
40
Source: Surveys (2015)
Other reasons for scarcity are presented below. These are substantiated by direct quotes from stakeholders from stakeholder consultations and surveys:
poor conditions of employment o “working hours include weekends”; o “long hours”
low remuneration o “low salaries in comparison to corporate sector”; o “not attractive to specialist skills e.g. Accountant and IT”
high staff turnover o “retailers compete with Financial Institutions for numerate planning
candidates”; o “retailers compete with each other for experienced retail management
candidates”; o “people don’t stay for long in the post”
lack of qualified applicants o “Finding suitably qualified Black professionals”; o “most employees have NQF and below”
lack of work experience o “limited people with necessary product knowledge”; o “shortage in the medical industry”;
lack of qualifications and skills programme o “lack of technical training for butchers”; o “no available training”; o “we don’t have retail managers with formal qualifications”
Challenge to meet equity targets o “having to follow targets and find suitably qualified employees”; o “lack of Black retail managers with experience”; o “equity considerations”
Geographical location o “rural areas - difficult to get skilled workers”; o “small-town syndrome”
1.12.1.2 Scarce skills by province
The table below highlights the scarce occupations by province.
Table 5: Scarce skills list for Western Cape and Eastern Cape
WESTERN CAPE EASTERN CAPE
OCCUPATION OFO
CODE
OCCUPATION OFO
CODE
Retail Manager 142103 Butcher 681103
Retail Supervisor 522201 Retail Manager (General) 142103
Retail Buyer 332301 Confectionary Baker 681201
Sales Assistant (General) 522301 Retail Supervisor 522201
Sales and Marketing Manager 122101 Sales and Marketing Manager 122101
Sales Representative 332203 Retail Buyer 332301
Butcher 681103 Information Technology Manager 133105
Confectionary Baker 681201 Accountant (General) 241101
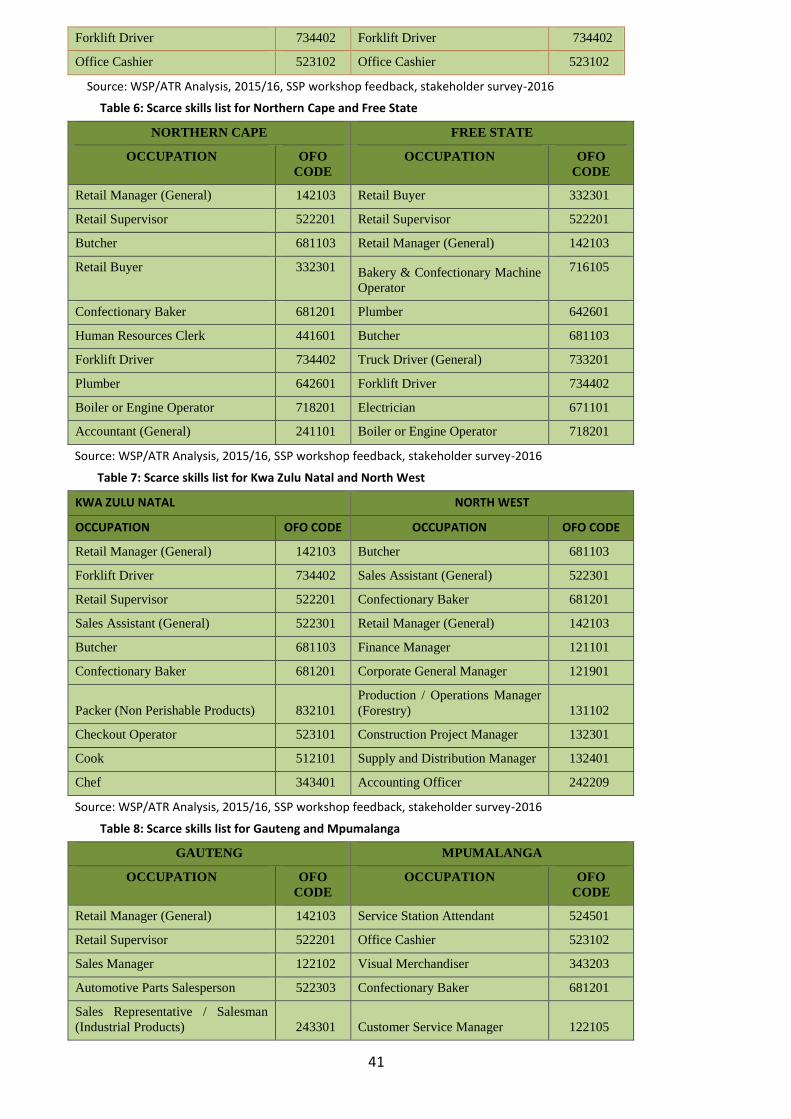
41
Forklift Driver 734402 Forklift Driver 734402
Office Cashier 523102 Office Cashier 523102
Source: WSP/ATR Analysis, 2015/16, SSP workshop feedback, stakeholder survey-2016
Table 6: Scarce skills list for Northern Cape and Free State
NORTHERN CAPE FREE STATE
OCCUPATION OFO
CODE
OCCUPATION OFO
CODE
Retail Manager (General) 142103 Retail Buyer 332301
Retail Supervisor 522201 Retail Supervisor 522201
Butcher 681103 Retail Manager (General) 142103
Retail Buyer
332301
Bakery & Confectionary Machine
Operator
716105
Confectionary Baker 681201 Plumber 642601
Human Resources Clerk 441601 Butcher 681103
Forklift Driver 734402 Truck Driver (General) 733201
Plumber 642601 Forklift Driver 734402
Boiler or Engine Operator 718201 Electrician 671101
Accountant (General) 241101 Boiler or Engine Operator 718201
Source: WSP/ATR Analysis, 2015/16, SSP workshop feedback, stakeholder survey-2016
Table 7: Scarce skills list for Kwa Zulu Natal and North West
KWA ZULU NATAL NORTH WEST
OCCUPATION OFO CODE OCCUPATION OFO CODE
Retail Manager (General) 142103 Butcher 681103
Forklift Driver 734402 Sales Assistant (General) 522301
Retail Supervisor 522201 Confectionary Baker 681201
Sales Assistant (General) 522301 Retail Manager (General) 142103
Butcher 681103 Finance Manager 121101
Confectionary Baker 681201 Corporate General Manager 121901
Packer (Non Perishable Products) 832101
Production / Operations Manager
(Forestry) 131102
Checkout Operator 523101 Construction Project Manager 132301
Cook 512101 Supply and Distribution Manager 132401
Chef 343401 Accounting Officer 242209
Source: WSP/ATR Analysis, 2015/16, SSP workshop feedback, stakeholder survey-2016
Table 8: Scarce skills list for Gauteng and Mpumalanga
GAUTENG MPUMALANGA
OCCUPATION OFO
CODE
OCCUPATION OFO
CODE
Retail Manager (General) 142103 Service Station Attendant 524501
Retail Supervisor 522201 Office Cashier 523102
Sales Manager 122102 Visual Merchandiser 343203
Automotive Parts Salesperson 522303 Confectionary Baker 681201
Sales Representative / Salesman
(Industrial Products) 243301 Customer Service Manager 122105
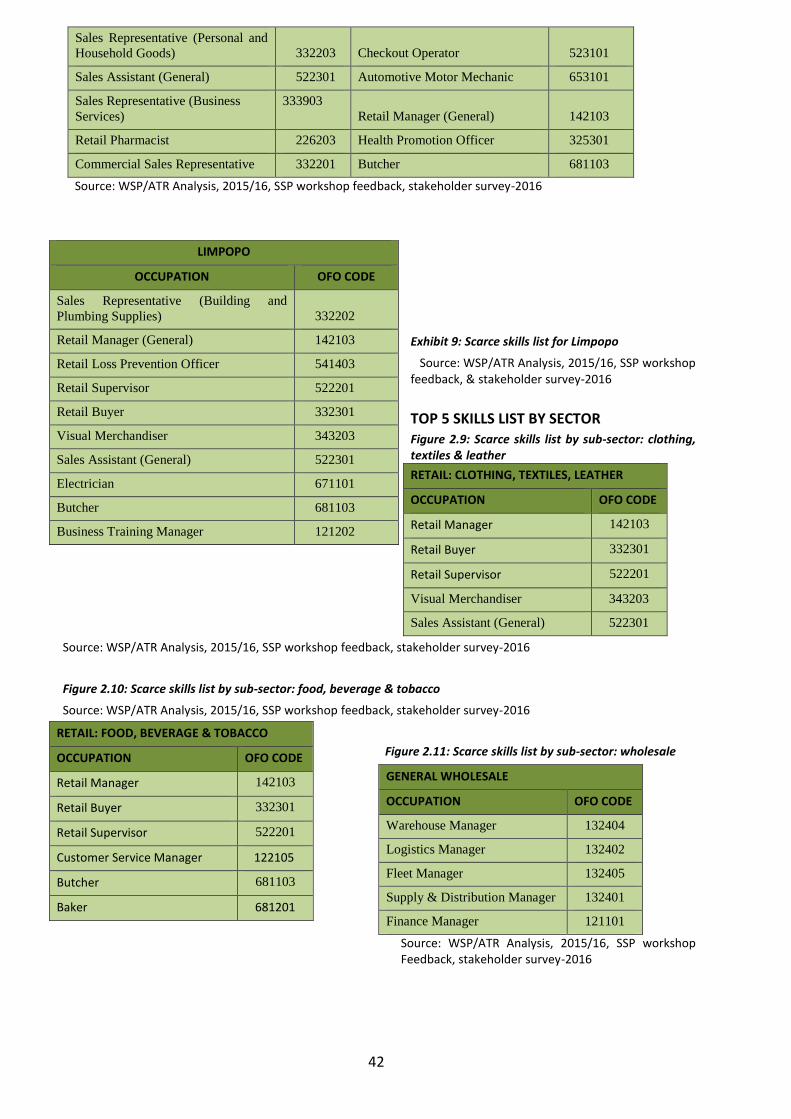
42
Sales Representative (Personal and
Household Goods) 332203 Checkout Operator 523101
Sales Assistant (General) 522301 Automotive Motor Mechanic 653101
Sales Representative (Business
Services)
333903
Retail Manager (General) 142103
Retail Pharmacist 226203 Health Promotion Officer 325301
Commercial Sales Representative 332201 Butcher 681103
Source: WSP/ATR Analysis, 2015/16, SSP workshop feedback, stakeholder survey-2016
Exhibit 9: Scarce skills list for Limpopo
Source: WSP/ATR Analysis, 2015/16, SSP workshop feedback, & stakeholder survey-2016
TOP 5 SKILLS LIST BY SECTOR Figure 2.9: Scarce skills list by sub-sector: clothing, textiles & leather
RETAIL: CLOTHING, TEXTILES, LEATHER
OCCUPATION OFO CODE
Retail Manager 142103
Retail Buyer 332301
Retail Supervisor 522201
Visual Merchandiser 343203
Sales Assistant (General) 522301
Source: WSP/ATR Analysis, 2015/16, SSP workshop feedback, stakeholder survey-2016
Figure 2.10: Scarce skills list by sub-sector: food, beverage & tobacco
Source: WSP/ATR Analysis, 2015/16, SSP workshop feedback, stakeholder survey-2016
Figure 2.11: Scarce skills list by sub-sector: wholesale
GENERAL WHOLESALE
OCCUPATION OFO CODE
Warehouse Manager 132404
Logistics Manager 132402
Fleet Manager 132405
Supply & Distribution Manager 132401
Finance Manager 121101
Source: WSP/ATR Analysis, 2015/16, SSP workshop Feedback, stakeholder survey-2016
LIMPOPO
OCCUPATION OFO CODE
Sales Representative (Building and
Plumbing Supplies) 332202
Retail Manager (General) 142103
Retail Loss Prevention Officer 541403
Retail Supervisor 522201
Retail Buyer 332301
Visual Merchandiser 343203
Sales Assistant (General) 522301
Electrician 671101
Butcher 681103
Business Training Manager 121202
RETAIL: FOOD, BEVERAGE & TOBACCO
OCCUPATION OFO CODE
Retail Manager 142103
Retail Buyer 332301
Retail Supervisor 522201
Customer Service Manager 122105
Butcher 681103
Baker 681201

43
Figure 2.12: Scarce skills for e-Retail
Source: WSP/ATR Analysis, 2015/16, SSP workshop feedback, stakeholder survey-2016
Figure 2.12: Scarce skills for fuel retail
FUEL RETAIL
OCCUPATION OFO CODE
Service Station Manager 142103
Service Station Site Supervisor 522201
Administration Manager 121301
Health and Safety Officer
Source: WSP/ATR Analysis, 2015/16, SSP workshop feedback, stakeholder survey-2016
1.12.1.3 Critical skills Table 0-3: Findings on the remaining 6 PIVOTAL skills
Critical skills refer to skills gaps within an occupation or ‘top up’ skills. Training for critical skills usually takes the form of short courses delivered in-house or externally. Such programmes, due to their short duration, do not require accreditation and thus does not lead to national qualifications on the NQF. Both scarce and critical skills must be identified at the occupational level, with scarce skills being considered against the occupation itself and critical skills being reflected as specific skills within the occupation. The following Critical Skills were identified from WSP/ATR 2015/16, interviews, workshops and the literature:
Table 10: National Top 10 Critical Skills List.
No Critical skills
1 Management
2 Leadership
3 Life skills (time management. Personal budgeting, Labour relations Knowledge)
4 Customer service
5 Selling
6 Product knowledge
7 Supervisory
8 Financial acumen
9 Numeracy & literacy
10 IT Skills Computer (Advanced)
Source: Stakeholder Feedback, 2016
e-RETAIL
OCCUPATION OFO CODE
e-Commerce Manager No OFO Codes
e-Commerce Planner
Web Integrator
e-Retail Managers
Call Centre Agent
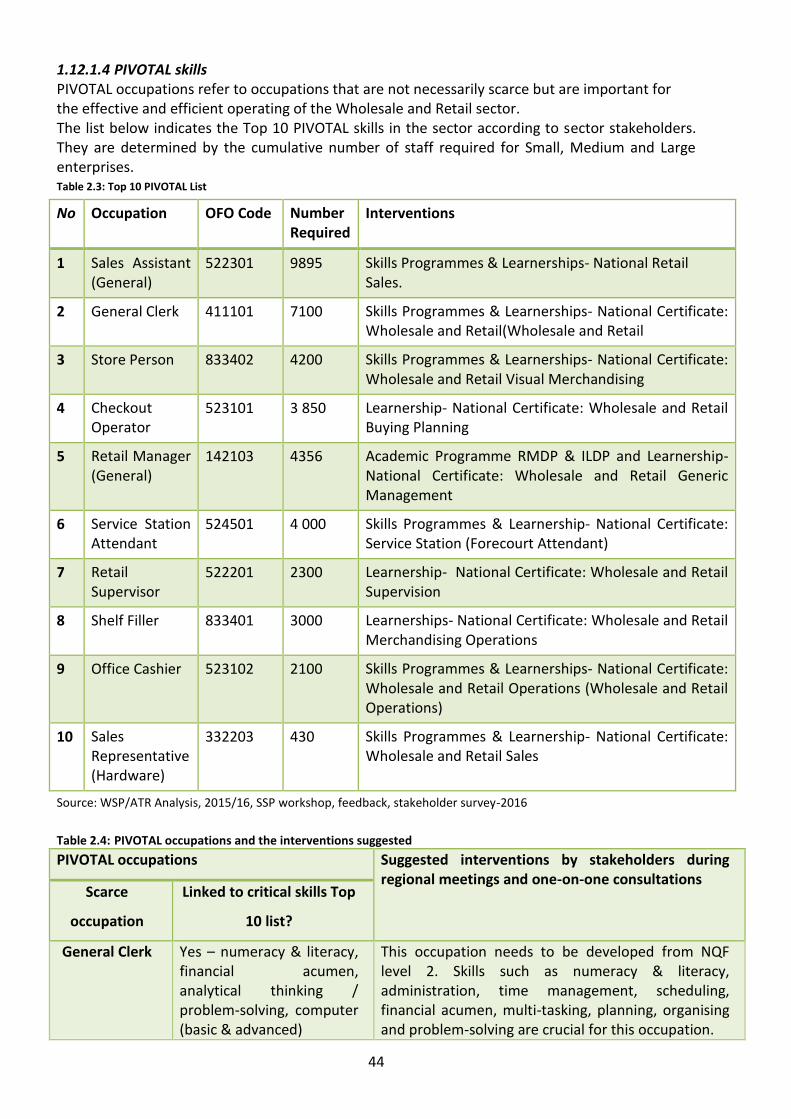
44
1.12.1.4 PIVOTAL skills PIVOTAL occupations refer to occupations that are not necessarily scarce but are important for the effective and efficient operating of the Wholesale and Retail sector. The list below indicates the Top 10 PIVOTAL skills in the sector according to sector stakeholders. They are determined by the cumulative number of staff required for Small, Medium and Large enterprises. Table 2.3: Top 10 PIVOTAL List
No Occupation OFO Code Number Required
Interventions
1 Sales Assistant (General)
522301 9895 Skills Programmes & Learnerships- National Retail Sales.
2 General Clerk 411101 7100 Skills Programmes & Learnerships- National Certificate: Wholesale and Retail(Wholesale and Retail
3 Store Person 833402 4200 Skills Programmes & Learnerships- National Certificate: Wholesale and Retail Visual Merchandising
4 Checkout Operator
523101 3 850 Learnership- National Certificate: Wholesale and Retail Buying Planning
5 Retail Manager (General)
142103 4356 Academic Programme RMDP & ILDP and Learnership-National Certificate: Wholesale and Retail Generic Management
6 Service Station Attendant
524501 4 000 Skills Programmes & Learnership- National Certificate: Service Station (Forecourt Attendant)
7 Retail Supervisor
522201 2300 Learnership- National Certificate: Wholesale and Retail Supervision
8 Shelf Filler 833401 3000 Learnerships- National Certificate: Wholesale and Retail Merchandising Operations
9 Office Cashier 523102 2100 Skills Programmes & Learnerships- National Certificate: Wholesale and Retail Operations (Wholesale and Retail Operations)
10 Sales Representative (Hardware)
332203 430 Skills Programmes & Learnership- National Certificate: Wholesale and Retail Sales
Source: WSP/ATR Analysis, 2015/16, SSP workshop, feedback, stakeholder survey-2016
Table 2.4: PIVOTAL occupations and the interventions suggested
PIVOTAL occupations Suggested interventions by stakeholders during regional meetings and one-on-one consultations
Scarce
occupation
Linked to critical skills Top
10 list?
General Clerk Yes – numeracy & literacy, financial acumen, analytical thinking / problem-solving, computer (basic & advanced)
This occupation needs to be developed from NQF level 2. Skills such as numeracy & literacy, administration, time management, scheduling, financial acumen, multi-tasking, planning, organising and problem-solving are crucial for this occupation.

45
PIVOTAL occupations Suggested interventions by stakeholders during regional meetings and one-on-one consultations
Scarce
occupation
Linked to critical skills Top
10 list?
Store Person Yes –product knowledge, analytical thinking / problem-solving, computer (basic & advanced), numeracy & literacy, financial acumen
Skills in warehousing, supply, distribution and logistics need to be developed from NQF level 2. Additionally, skills such as time management, multi-tasking, planning, anticipating and problem-solving are crucial for this occupation.
Checkout Operator
Yes – numeracy & literacy, financial acumen, customer service, analytical thinking / problem-solving, computer (basic)
This occupation needs to be developed from NQF level 2. Skills such as numeracy & literacy, customer service, time management, financial acumen, multi-tasking, payments handling and problem-solving are crucial for this occupation.
Shelf Filler Yes –product knowledge, analytical thinking / problem-solving, computer (basic), numeracy & literacy
Skills such as time management, multi-tasking, planning, anticipating and problem-solving are crucial for this occupation.
Office Cashier Yes – numeracy & literacy, financial acumen, analytical thinking / problem-solving, computer (basic & advanced)
This occupation needs to be developed from NQF level 2. Skills such as numeracy & literacy, financial acumen, administration, and time management are crucial for this occupation.
Sales Representative
Yes – selling, product knowledge, customer service, analytical thinking / problem-solving, computer (basic & advanced), numeracy & literacy, financial acumen
Qualifications to develop selling skills are in huge demand, with sector-specific modules to provide the required product knowledge. Sub sectors highlighted during stakeholder consultations where this need was emphasised include building & plumbing supplies, business services, chemical, commerce, education, ICT, industrial goods, medical & pharmaceutical, personal & household goods, photographic and printing & publishing). Additionally, product knowledge training should be ongoing as technology changes quickly.
Skills such as identification of opportunities, taking initiative, achieving an understanding of customer needs, analytical thinking, financial acumen, computer literacy, and negotiation and closing deals are crucial for Sales Representatives to be effective.
Source: Stakeholder Feedback, 2015/16
The table above indicates the PIVOTAL occupations and the interventions suggested by stakeholders.
1.12.2 Employability of Graduates
The Wholesale and Retail Sector provides significant opportunities for university graduates, as well as matriculants and school leavers. While school leavers may be able eligible for entry level

46
positions (such as packers), matriculants choosing to pursue post school studies have the opportunity to pursue studies that enable more senior positions in the sector.
According to a study conducted by the Centre for Development and Enterprise (2013), the Retail and Wholesale Trade industry accounted for 7% of all graduates.
1.12.3 ‘Skills supply problems that firms are experiencing’ During the research process, stakeholders reported facing a number of challenges where skills are concerned. These challenges are tabled below.
Table 0-4: Skills Challenges
Occupation Skills challenge
Sales assistants Finding a person with a good combination of selling abilities, customer
service and excellent product knowledge was cited frequently by
stakeholders as being very difficult to find. Sales staff with specific
knowledge included Building Materials Knowledge was difficult to find.
Sub sectors highlighted during stakeholder consultations included sport
equipment, hardware, interior design, electrical, lighting,
pharmaceutical, furniture, fuel retail.
It is difficult to develop low level staff to become supervisors unless they
have developed basic skills such as numeracy, people skills and financial
acumen.
Retail Managers There is a lack of Managers with retail-specific experience.
Retail Managers with leadership abilities are particularly scarce.
HR Managers HR Managers are difficult to find because of a lack of retail-specific
experience.
Software
Developers
Software Developers are no longer just technical people – they now need
to be both technical- and business-minded. This combination is difficult
to find, and when they are found they are very expensive.
Senior Buyers and
Planners
Senior Buyers and Planners are scarce because a combination of vast
experience in the field plus management skills is very rare to find. These
people normally have to be imported.
Blockmen and
Butchers
Blockmen and Butchers are scarce because of a lack of qualifications. In
the Eastern Cape, for example, there are no providers training Blockmen
and Butchers.
Bakers
Bakers are scarce because of a lack of technical training. They need to be
developed from NQF level 2.
Source: Stakeholder Feedback, 2016
Stakeholders further reported facing the following challenges where skills are concerned. o Exports- and imports-related qualifications are an urgent need in Mpumalanga. These
skills are very scarce to find as well as expensive for a company to train internally owing to a lack of knowledge in the field.
o With regards to the QCTO qualifications, comments and concerns from stakeholders included:
Stakeholders are concerned that 20% customisation will not be possible in the new QCTO qualifications.

47
Regarding the existing unit standards, some stakeholders stated that they agree with the current structure because it allows employees to develop skills which are lacking to perform their jobs well, and in a fairly inexpensive way as it doesn’t require full and lengthy qualifications.
Stakeholders would therefore like to understand whether skills programmes will continue to be funded when the QCTO qualifications are implemented.
o Many stakeholders commented that the removal of funding for NQF level 2 qualifications is unfortunate for the following reasons:
It is the entry-level qualification for the W&R sector, which means it is aligned to government’s priority to focus on developing the youth.
NQF 3 is too advanced for school-leavers and some graduates, therefore bridging programmes are required.
NQF2 provides exposure to many different areas such as admin, sales, management, marketing, so it provides learners with exposure to different areas of the sector and therefore the opportunity to choose appropriate career paths which are aligned to core interests and strengths.
As the new BBBEE codes which will be implemented in 2015 stipulate that extra points will be awarded for employing “unemployed” learners, NQF 2 is an ideal learnership to run to bring in unemployed people into the business as well as for the business to earn points.
NQF 2 learnerships are an opportunity to create employment, thereby aligning to government’s priority where addressing unemployment in youth is concerned.
Very high turnover of shop floor staff so it’s expensive to train these entry-levels employees.
o Some small companies struggle to retain staff. o It is difficult to train in rural areas as critical mass to justify the costs of running
training programmes there is tough to achieve.
1.13 Chapter Conclusion
This chapter focused on the identification of scarce and critical skills, building upon an analysis of the extent and nature of supply and demand. The employability of graduates continuous to be of importance to the W&RSETA and partnership with industry will be established to offer a qualification that prepares graduates for employment in the sector. The shortage of training providers in rural provinces will also be addressed as part of improving access to training in rural areas. The update in the scarce and critical skills list and Pivotal list has been made in line with the data analysis gathered from the W&RSETA SSP update research methods and processes. Chapter Three is primarily focused on the identification of critical and scarce skills in the W&R sector. The primary methods used to determine scarce and critical skills are interviews with key informants, regional workshops with stakeholders, literature reviews and analysis of WSP/ATRs.
A primary means for identifying and anticipating skills are workplace skills plans (WSPs) and annual training reports (ATRs). These are submitted by member companies to qualify for mandatory grant rebates from the skills development levies paid to the South African Revenue Services. The WSPs and ATRs provide a representative sample of the training planned for the future 12 months and training that actually occurred in the previous 12 months.
It is interesting to note that the majority of training is being done at the lower levels of the occupational class structure. This is due to the majority of workers in the sector being at the lower end of the occupational structure
48
2 Chapter 4: Sector Partnerships Introduction The purpose of this chapter is to assess the effectiveness of existing W&RSETA partnerships and to determine the outcomes of new partnerships the Wholesale and Retail Sector. It is important to understand the nature of the W&RSETA partnerships in order to assess their effectiveness in addressing the skills development requirements of the sector. The W&RSETA partnerships are mainly influenced by the sector key skills priorities and the SETA is having seven categories of partnerships:
1. Research partnerships (Universities). 2. Small Enterprise Development partnership (Rural and Townships business forums). 3. Trade Unions Partnerships. 4. Qualification development partnerships. 5. TVET colleges’ partnerships. 6. Green Skills partnerships 7. Industry partnerships (Employers and providers)
2.1 Existing partnerships Existing partnerships have enabled the W&R SETA to achieve some of its key skills development objectives. The following includes a description of each partnership; provides an overview of the need for the partnership, an examination of successes and opportunities for improvement, and endeavours by the W&RSETA to strengthen the partnerships.
1. Partnerships with TVETS o The SETA has collaborated with a number of TVETs to establish Schools of
Excellence and to undertake joint development of learning programmes. o The W&RSETA’s partnerships with the Mthashana, Majuba, Esayidi, Thekwini,
Maluti, Motheo, Slaves Mareka and Goldfieds TVET Colleges were created to establish Schools of Excellence. This collaboration enables the provision of learnerships and relevant qualifications for learners to be placed in the Wholesale and Retail Sector.
o The number TVET Schools of Excellence have increased to include Tshwane North TVET College and Ekurhuleni West TVET College.
o The SETA has also appointed 29 TVET Regional Coordinators to work as W&RSETA representatives at the rural and township colleges.
o A working group including representatives from TVETs, DUT, and employers drove the establishment of branded simulation / practicum rooms in four TVET’s as well as the placement of 100 graduate interns at retail companies for workplace experience (representing an investment of R4.5 million) and 700 graduate interns at various Government departments (representing an investment of R31.5 million).
o Initiatives by the W&RSETA to strengthen these partnerships include capacity building sessions to enhance the knowledge of TVETs and contracting QCTO consultants to ensure transfer of knowledge and capacity building on the process of TVET qualifications development.
o The SETA views the current partnership initiatives with TVETs as successful, and plans to expand such partnerships to include more TVETs going forward.
1.1 TVET SIMULATION CENTRES- TVET College / Retail Simulations Centres: This project is
aimed at capacitating colleges to deliver W&RSETA programmes with a two-pronged purpose of
fostering collaboration between institutions and the sector and to produce graduates that meet
the needs of the industry. These centres, established at the College of Cape Town (Western Cape),
Gert Sibande (Mpumalanga), Ekurhuleni West College and Vuselela (North-West) TVET colleges,

49
will provide practical experience on retail practices to ensure that colleges produce suitably
qualified and experienced graduates.
Successes of the retail simulation centres
During October 2014 - February 2015, the W&RSETA launched three retail
simulation centres in three provinces across the country.
Makro and Spar Lowveld have collaborated with the W&RSETA to equip the
centres with the merchandise required for the simulated learning environments at
the College of Cape Town and Gert Sibande TVET College respectively. The
involvement of the Sector will go a long way to secure the workplace experience
that is required by graduates and possible employment on completion of
programmes. The colleges will deliver four learnerships on W&R Operations,
Chain Store, Helpdesk and Merchandiser.
These innovations contribute to improved prospects of employment for the
graduates and promote the and promote the creation of self-employment
opportunities.
Way-forward
There is a need for job/work attachments.
There is a need to roll-out the centres to other SMMEs.
Co-operatives should also be included in training in simulation centres.
2. Partnerships with Universities o W&R SETA has partnered with various universities to develop sector-specific
qualifications, to establish Schools of Excellence, and to conduct research of the W&R Sector.
o The SETA has developed qualifications and established learnerships for the W&R Sector jointly with the DUT, resulting in 800 graduate placements. A similar partnership with CPUT has seen the development of retail qualifications within HEIs and provided support to masters and PhD bursary beneficiaries.
o Research partnerships have focused on collaboration on research into the W&R Sector. This may take the form of the SETA obtaining access to research studies undertaken by a university (e.g. access to retail sector analysis, labour market studies), or in the SETA providing direction on research topics, or broader collaboration on SSP oriented research. Partnerships have been established with Stellenbosch University (which provides access to Bureau for Market Research), CPUT (which has seen the establishment of a W&R Research Chair), and UNISA (the SETA subscribes to the Bureau for Economic Research).
o The SETA’s partnerships with universities appear to be operating well, and no major changes to structure or functioning of these partnerships are planned in the near future.
3. Partnership with QCTO
o The W&R SETA works closely with QCTO to develop, register, and quality-assure retail specific qualifications. To date 1 qualification has been registered, with 8 more in the pipeline.
o While the partnership has been moderately successful, it has not delivered new retail qualifications at a pace that adequately meets industry’s skill development needs.
o W&R SETA will work with QCTO going forward to attempt to shorten lead times for the registration of new retail qualifications.

50
4. Partnership with Industry
o W&R SETA works closely with industry on the SSP development process, the development of Schools of Excellence, and on work placement programmes.
o The W&RSETA’s partnership with Decorland, Boxer Superstores, FG Knight, Mass Discounters, and Mass Cash was created to establish schools of excellence. This collaboration enables the provision of learnerships and Wholesale and Retail experience to graduates, in particular the placement of 700 graduates at these retail organisations.
o The W&RSETA’s partnership with the Department of Trade and Industry (the dti) was created to help develop the informal trading sector. This partnership enables the provision of relevant expertise in the informal trading sector in the form of skills development and training as well as to offer financial assistance to develop infrastructure. The W&RSETA Board has approved a R10 million project to address the challenges of SME.
5. Partnership with Labour o The W&RSETA’s partnership with Federal Council of Retail and Allied Workers
(FEDCRAW), South African Commercial, Catering and Allied Workers Union (SACCAWU), National Union of Metalworkers of South Africa (NUMSA), Entertainment Catering Commercial and Allied Workers Union of South Africa (ECCAWUSA) and South African Congress of Trade Unions (SACTU) was established to help capacitate unions. These partnerships enable the provision of assistance to employees in the Wholesale and Retail Sector on labour related issues. The W&RSETA also approved a project to capacitate Unions on various skills development needs.
o The partnership has helped to ensure sustained capacity and ability to organize and service workers, especially those in precarious working environments as well as reduce levels of dependency on service providers and build internal capabilities and capacity as well as efficiency in all spheres.
2.2 New partnerships The SETA is keen to build on the successes of existing partnerships to extend its skill development reach. In particular, it plans to pursue partnerships aimed at expanding retail skill development amongst smaller retail enterprises and on establishing further partnerships with SETAs relevant to the wholesale and retail sector and its challenges. 1. Small Enterprise Associations
o Partnerships with industry associations focused on retail co-operatives, SMMEs, and informal traders are required to pursue skills development initiatives that are customised for these constituencies. Small retail enterprises have tremendous potential for growth and transformation of the sector. For this potential to be realised it is critical that the individuals within these businesses are provided with access to the required skills development opportunities. Innovative and creative skills delivery mechanisms will be required to account for the unique circumstances within which these businesses operate.
o The SETA plans to leverage existing relationships with small enterprise associations (e.g. through representation on its Qualification Management Board) to establish the required partnerships.

51
2. Linked SETAs o Given the overlapping scope of the W&R sector with regard to other SETAs it makes
practical sense that the W&R SETA collaborates with these SETAs on skills development initiatives.
o The W&R SETA has a record or successful collaboration with other SETAs, e.g. the partnership with the F&PM SETA on the Work Layoff Training programme.
o The SETA plans to commence initiate discussion with related SETAs with the goal of identifying areas of overlap, as the foundation for collaboration going forward.
o The 2016/17 SSP review sessions with stakeholders have highlighted a need for Health and Safety compliance occupations in the sector. Thus, the SETA will be commencing discussions with the relevant SETAs in addressing the compliance occupations in the sector.
2.3 Chapter Conclusion
The W&R SETA has a track record of a number of successful partnerships, with universities, TVETs, and industry. Some partnerships have presented challenges that will help inform a more successful way forward. Further partnerships are required, in particular to address the skill development needs of small retail enterprises (SMMEs, co-operatives, and informal traders) and to address opportunities to realise synergies with other SETAs.
52
Chapter 5: Skills Priority Actions
Introduction
This chapter consolidates and presents the findings from previous chapters and reflects on priority actions for the W&R sector. The previous chapters provided the information and analysis and thus enable a response in the form of recommended actions that are outcomes-focused. Consideration is also given to national strategies and plans to ensure alignment with government’s priorities.
5.1 Findings from Previous Chapters
Previous chapters have outlined a progressive analysis of skills areas, that have highlighted various skills challenge and opportunity areas that need to be remediated through the skills priority actions described in this, the final chapter of the SSP.
Chapter 1 (Sector Profile) described the scope of coverage of the sector, its key role-players, its economic performance and labour market profile; and how it has been evolving. Key findings included the following:
While the wholesale and retail sector is considered highly competitive, and a significant contributor to South Africa’s GDP, it has experienced sluggish market conditions and is facing marginal constant growth over the next 5 years;
Small enterprises constitute 78% of the sector’s organisations, but are underrepresented in terms of skills development initiatives. Informal retailers (accounting for 31% of the sector’s employment) form part of these small enterprises, and are particularly in need to greater skills development.
With just 7% of black people in the sector occupying management and professional positions and 21% in elementary positions; and under-representation of females in management positions, the sector provides opportunities to pursue a transformational agenda through skills development initiatives.
Chapter 2 (Key Skills Issues) examined drivers of change, alignment with national strategies and research methodology.
Key drivers of change for skills within the sector are:
•Technology advancements: The wholesale and retail industry is rapidly changing as a result of
technological advancements. Changes include: mobile applications, online shopping, big data,
social media, cyber-crime, mobile phones and internet usage.
• Power shift to consumers: Consumers today are increasingly empowered by the use of social
networking sites. They now have a voice, and often a very loud and powerful one. Changes
include: ethical issues, eco-friendliness and greening.
• African retail growth: Multinational are expanding rapidly into Africa and increasing the
presence, some more aggressively than others. Changes include: growing economy, population
growth, supply chain efficiencies, human resources, managing risk/reward trade-off.
• SMME development: The SMME sector in South Africa is relatively large and source products
from wholesale companies. Changes include: small enterprise development, hawkers,
casualisation and new training model.

53
• Skills Shortage: An evolving retail landscape has resulted in skills shortages at both management
and elementary level presents the sector with challenges requiring urgent remediation.
Key policy drivers for the sector include the National Skills Accord (NSA), Industrial Policy Action Plan (IPAP), New Growth Path (NGP), National Development Plan (NDP) 2030, White Paper for Post-School Education and Training (WPPSET) and the National Skills Development Strategy (NSDS). Chapter 3 (Extent of Skills Mismatch) focused on identifying occupation-specific skills mismatches for employers, as well as on skills gaps.
Pivotal Skills List: Sales Assistant (General) / Retail Buyer / Butcher / Confectionary Baker/ Retail Manager (General) / Sales & Marketing Manager / Retail Supervisor / Visual Merchandiser/ Office Administrator /Sales Representative.
Main Critical Skills: Leadership, management, product knowledge, computer literacy (basic & advanced), customer service, supervisory, problem-solving, communication, numeracy & literacy and financial acumen.
Chapter 4 identifies existing partnerships in the sector, focusing on best practice and success factors as well as measures to strengthen these partnerships. W&RSETA will look to capitalise on the successes of existing partnerships with TVETs, universities and industry to establish partnerships with small enterprise associations to reach retail SMMEs, co-operatives and informal traders. The twelve key interventions are recommended to address seven critical skills development priorities. The foregoing chapters have highlighted areas of focus for skills priority actions, which are outlined in the next section.
2.4 Recommended Actions This section describes recommended actions within the context of key skills priorities for the W&R Sector.
2.4.1 Skills Priorities for the Sector
This SSP points to 7 key skills priorities for the W&R sector. These align both to national priorities and sectoral needs, and link clearly to skills issues and skills gaps identified. These priority areas are as follows:
1. SMME and cooperatives development: SMMEs, cooperatives, and informal traders have tremendous potential to create jobs and grow the sector. It is critical that these enterprises are supported with skills development. New training models are needed to meet the training needs of SMMEs.
2. Youth unemployment: The retail sector provides significant temporary employment opportunities for the youth. School-leavers and graduates are employed as packers, cashiers and clerks. The challenge is to convert these into permanent employment and encourage career development in the sector. This will encourage students to join the sector, rather than view it as a “second option”.
3. Scarce and critical skills: The identification of critical and scarce skills is a key deliverable of the SSP. This is necessary to ensure that the work of the SETA responds to the changing, demand-side needs of the sector. It also ensures that investments in skills development are effective and efficient since priority skills are addressed. The identification of scarce skills is also necessary to inform the DHET’s National List of Occupations in High Demand.
4. Stakeholder engagement: Stakeholder partnerships are increasingly becoming the adopted approach to meeting industry needs for skilled workers and workers’ need for better jobs. Partnerships address current and emerging occupational needs and skill gaps. It offers a mechanism to focus scarce resources on industries that are major job providers
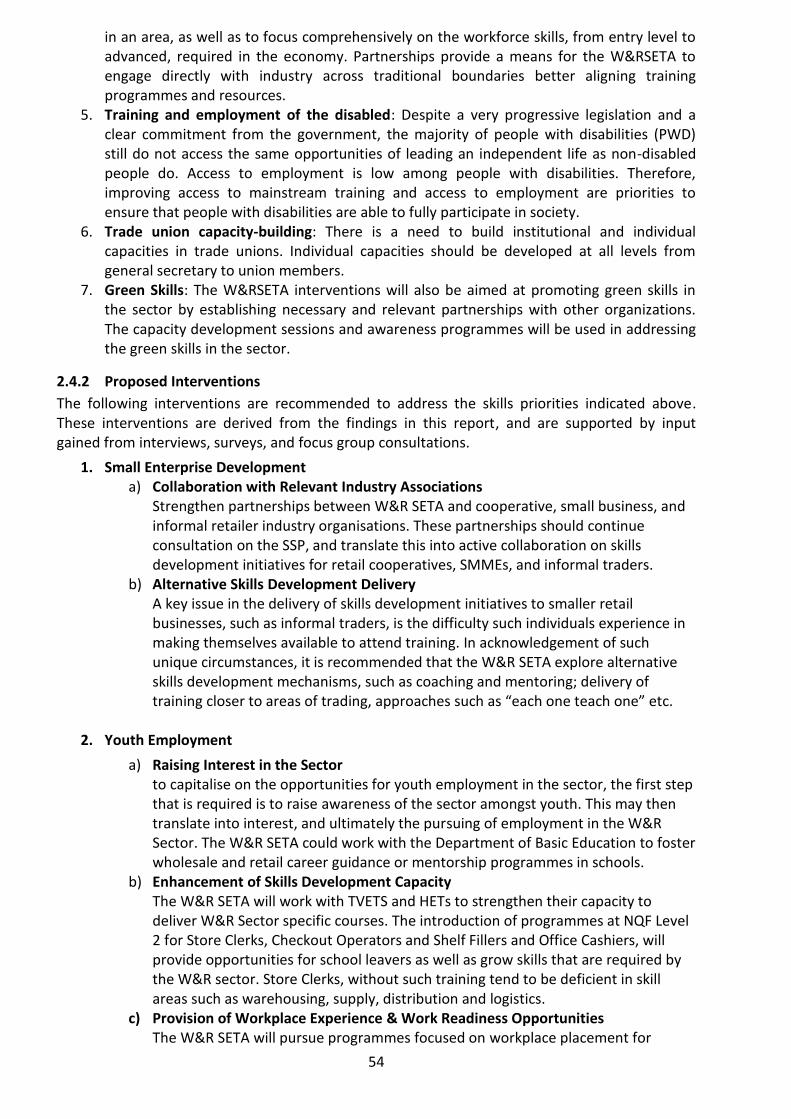
54
in an area, as well as to focus comprehensively on the workforce skills, from entry level to advanced, required in the economy. Partnerships provide a means for the W&RSETA to engage directly with industry across traditional boundaries better aligning training programmes and resources.
5. Training and employment of the disabled: Despite a very progressive legislation and a clear commitment from the government, the majority of people with disabilities (PWD) still do not access the same opportunities of leading an independent life as non-disabled people do. Access to employment is low among people with disabilities. Therefore, improving access to mainstream training and access to employment are priorities to ensure that people with disabilities are able to fully participate in society.
6. Trade union capacity-building: There is a need to build institutional and individual capacities in trade unions. Individual capacities should be developed at all levels from general secretary to union members.
7. Green Skills: The W&RSETA interventions will also be aimed at promoting green skills in the sector by establishing necessary and relevant partnerships with other organizations. The capacity development sessions and awareness programmes will be used in addressing the green skills in the sector.
2.4.2 Proposed Interventions
The following interventions are recommended to address the skills priorities indicated above. These interventions are derived from the findings in this report, and are supported by input gained from interviews, surveys, and focus group consultations.
1. Small Enterprise Development a) Collaboration with Relevant Industry Associations
Strengthen partnerships between W&R SETA and cooperative, small business, and informal retailer industry organisations. These partnerships should continue consultation on the SSP, and translate this into active collaboration on skills development initiatives for retail cooperatives, SMMEs, and informal traders.
b) Alternative Skills Development Delivery A key issue in the delivery of skills development initiatives to smaller retail businesses, such as informal traders, is the difficulty such individuals experience in making themselves available to attend training. In acknowledgement of such unique circumstances, it is recommended that the W&R SETA explore alternative skills development mechanisms, such as coaching and mentoring; delivery of training closer to areas of trading, approaches such as “each one teach one” etc.
2. Youth Employment
a) Raising Interest in the Sector to capitalise on the opportunities for youth employment in the sector, the first step that is required is to raise awareness of the sector amongst youth. This may then translate into interest, and ultimately the pursuing of employment in the W&R Sector. The W&R SETA could work with the Department of Basic Education to foster wholesale and retail career guidance or mentorship programmes in schools.
b) Enhancement of Skills Development Capacity The W&R SETA will work with TVETS and HETs to strengthen their capacity to deliver W&R Sector specific courses. The introduction of programmes at NQF Level 2 for Store Clerks, Checkout Operators and Shelf Fillers and Office Cashiers, will provide opportunities for school leavers as well as grow skills that are required by the W&R sector. Store Clerks, without such training tend to be deficient in skill areas such as warehousing, supply, distribution and logistics.
c) Provision of Workplace Experience & Work Readiness Opportunities The W&R SETA will pursue programmes focused on workplace placement for

55
unemployed graduates and internships for students. Aside from providing opportunities for the youth, this will also address the dire need for junior planners and buyers to gain the experience required to prepare them for more senior roles.
3. Qualification Development a) Fostering Retail Management Competencies
The W&R SETA could assist with the development of management competencies within the retail industry by the introduction of management courses at lower NQF levels (e.g. levels 4 and 5) to develop leadership and strategic thinking capabilities early in a retail employees career, thus ensuring retail and management competence at more senior levels.
b) Building Core Skills a properly functioning W&R sector organisation requires its staff to demonstrate core retail capabilities. These include customer service skills, selling skills, financial acumen, and interpersonal skills. Some the skills required are generic (e.g. computer literacy) while others are more specific (e.g. selling skills specifically for Service Stations Attendants, to leverage forecourt cross-selling opportunities). The development of selling skills in conjunction with product knowledge appears to an area of skill development that requires particular focus, particularly with regard to technology linked products such as sports equipment, lighting, photographic equipment, medical etc.
c) Enabling Specialisation The W&R SETA will investigate the development of qualifications and training programmes required to build specialist skills, some of which relate to a lack of appropriate qualifications and some of which are related to areas of scarce skills. An example of the former is the need for separate qualifications for Buyers and Planners at NQF Level 6 and 7. Examples of the latter are the need for qualifications and training programmes and Learnerships for Bakers from NQF level 2; Fresh Meat Processing; Meat Cutting; Hygiene and Safety from NQF level 2; Forklift training courses. At a practical level, ensuring adequate OFO code representation for specialised (e.g. separate OFO codes for buyers and planners) or emerging occupations (e.g. Food Technologist) will allow for these occupations to be flagged as scarce skills, and thus to allow for recognition of their specific skill development needs.
4. Sector Transformation
a) Bursaries The W&RSETA will provide full bursaries covering tuition, books accommodation and living allowances to students from financially disadvantaged backgrounds.
b) Targeted Initiatives The W&R SETA will investigate ways in which to support transformation in the W&R SETA through targeted initiatives. Small enterprise development, targeting as it does co-operatives, SMMEs, and informal traders, will support the growth of this sector. Targeted youth employment initiatives, similarly, provides an opportunity to meet transformation objectives.
c) Facilitating Linkages The W&R SETA aims to enable access to required support for transformation through facilitating linkages to appropriate organisations and programmes.
5. Learning Programmes a) Enabling Supervisory Skills Development
There is a particular requirement for supervisory skill development to be enabled through learning programmes. This is expected to help better bridge the development gap from junior positions to management positions.

56
6. Disability Programmes a) The SETA will be partnering with the sector stakeholders in making awareness about
people of disability in the sector. The employers will also be encouraged to make their workplace more accessible to people with disability.
7. Green Skills a) The W&RSTEA will be initiating a partnership for green skills in the sector with
leading universities such as Stellenbosch University, Wits University and University of Cape Town. The W&RSETA will also be establishing partnership with the Department of the Environmental Affairs. The partnership will be focusing on information sharing and approaches to green skills.
Below is a table summarising the National Policies that guide the operations of the W&R SETA. It demonstrates the alignment of the W&R SETA Strategic Plan to Government National Policies and Strategies.
Table: National Policies alignment to W&RSETA strategies
National Strategies/ Policies Impacting on the Wholesale and Retail Sector
Implications for Skills Development in the Wholesale and Retail Sector
National Skills Accord 8 commitments to be followed:
Expand more fully the level of training using existing facilities
Create internship and placement opportunities available in the workplace
Set guidelines of ratios of trainees and artisans, as well as across the technical vocations, in order to improve level of training
Improve the funding of training, the use of funds available for training and provide incentives for companies to train
Set annual targets for training in state-owned enterprises
Improve SETA governance and financial management, as well as stakeholder involvement
Align training to the New Growth Path and improve SSPs
Improve the role and performance of TVET colleges
The W&RSETA Strategic Plan has prioritized the internship and placement opportunities for the unemployed within workplaces and artisan development. The W&RSETA Strategic Plan has focused its attention on improving the quality and credibility of the sector skills plan (SSP) and the capacitation of TVET colleges, in order to deliver Wholesale and Retail specific learning programs.
Industrial Policy Action Plan II (IPAP II) IPAP has identified several growth sectors which will address the high rate of unemployment in the country.
W&RSETA has identified an oversupply of skills at
lower levels (e.g. NQF levels 1-3) and an undersupply
at intermediate and higher levels (NQF levels 4 and
higher). The W&RSETA seeks to bring about a critical
balance required to address both these needs;
stakeholders have confirmed that there is still a great
demand for managers in the sector.
New Growth Path (NGP) The New Growth Path identifies 5 job drivers:
Infrastructure for employment and development
Improving job creation in employment and development
Seizing the potential of new economies
Investing in social capital
W&RSETA has identified initiatives within the 3rd, 4th
and 5th job drivers which speak to the Green
Economy, the Social Economy and Rural
Development respectively.
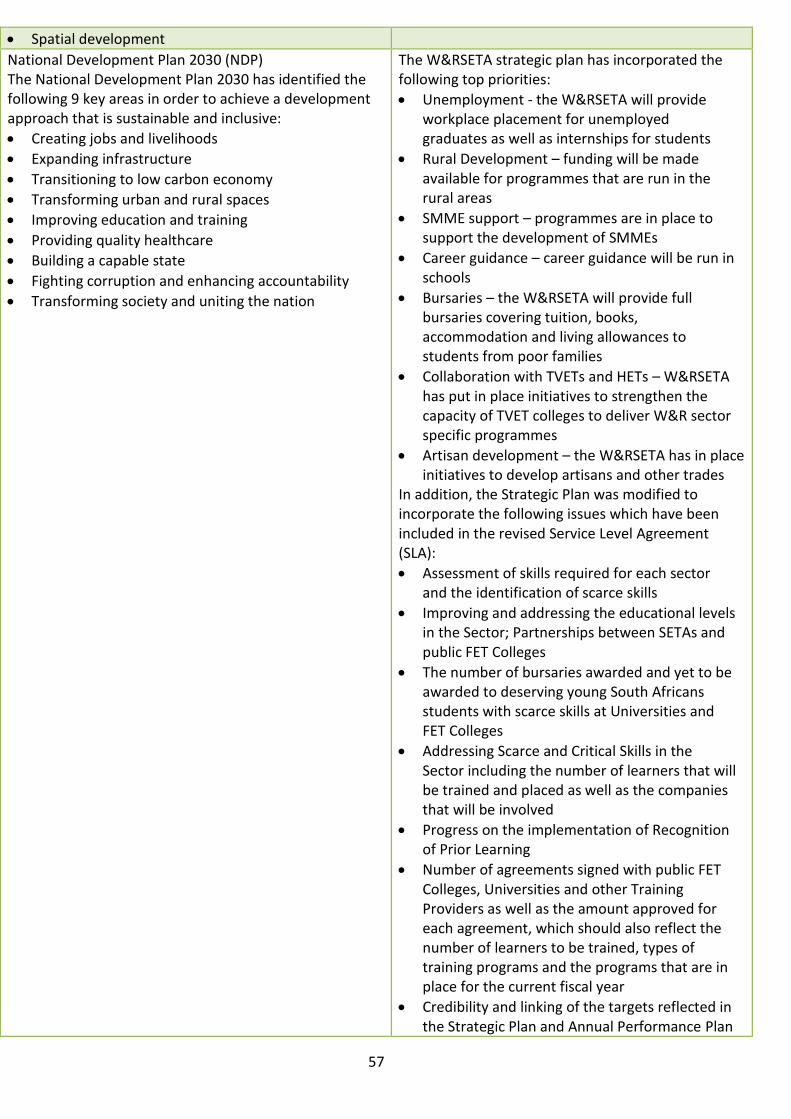
57
Spatial development
National Development Plan 2030 (NDP) The National Development Plan 2030 has identified the following 9 key areas in order to achieve a development approach that is sustainable and inclusive:
Creating jobs and livelihoods
Expanding infrastructure
Transitioning to low carbon economy
Transforming urban and rural spaces
Improving education and training
Providing quality healthcare
Building a capable state
Fighting corruption and enhancing accountability
Transforming society and uniting the nation
The W&RSETA strategic plan has incorporated the following top priorities:
Unemployment - the W&RSETA will provide workplace placement for unemployed graduates as well as internships for students
Rural Development – funding will be made available for programmes that are run in the rural areas
SMME support – programmes are in place to support the development of SMMEs
Career guidance – career guidance will be run in schools
Bursaries – the W&RSETA will provide full bursaries covering tuition, books, accommodation and living allowances to students from poor families
Collaboration with TVETs and HETs – W&RSETA has put in place initiatives to strengthen the capacity of TVET colleges to deliver W&R sector specific programmes
Artisan development – the W&RSETA has in place initiatives to develop artisans and other trades
In addition, the Strategic Plan was modified to incorporate the following issues which have been included in the revised Service Level Agreement (SLA):
Assessment of skills required for each sector and the identification of scarce skills
Improving and addressing the educational levels in the Sector; Partnerships between SETAs and public FET Colleges
The number of bursaries awarded and yet to be awarded to deserving young South Africans students with scarce skills at Universities and FET Colleges
Addressing Scarce and Critical Skills in the Sector including the number of learners that will be trained and placed as well as the companies that will be involved
Progress on the implementation of Recognition of Prior Learning
Number of agreements signed with public FET Colleges, Universities and other Training Providers as well as the amount approved for each agreement, which should also reflect the number of learners to be trained, types of training programs and the programs that are in place for the current fiscal year
Credibility and linking of the targets reflected in the Strategic Plan and Annual Performance Plan

58
6. Chapter Conclusion
Twelve key interventions have been proposed to address seven key skills priorities for the W&R Sector. This chapter describes these interventions in the context of 5 key skills priorities, first recapping findings from the previous chapters, given that these findings form the basis for both the skills priorities and interventions. The skills priorities identified, and the interventions recommended, will inform the W&R SETA’s strategic plan going forward.
to a “Baseline”
Placement of students in the Sector as part of the agreement between the SETA and Companies through internships and work placement for experience
Development of a comprehensive plan to transform the public service into a training space to make a significant impact on the lives of the youth, which should include annual targets
Rural Development programs and their implementation
Presence of SETAs in rural areas and townships, as well as how and when they will be implemented
Number of public FET College and University students placed in companies to obtain work experience
Facilitating the exposure and placement of FET College lecturers to the Sector
White Paper for Post-School Education and Training (WPPSET)
Set out strategies to improve the capacity of post-school education and training system to meet SA’s needs.
It is a vision for an integrated system of post-school education and training with all institutions playing their roles.
Bursaries – the W&R SETA will provide full bursaries covering tuition, books, accommodation and living allowances to students from poor families
Collaboration with TVETs and HETs – W&R SETA has put in place initiatives to strengthen the capacity of TVET colleges to deliver W&R sector specific programs
Artisan development – the W&RSETA has in place initiatives to develop artisans and other trades
National Skills Development Strategy (NSDSIII)
The vision is a skilled and capable workforce that shares in, and contributes to, the benefits and opportunities of economic expansion and an inclusive growth path.
Acts as strategic guide for skills development and provides direction to skills planning and implementation in the SETAs.
Sets out the linkages with, and responsibilities of, other education and training stakeholders.
Bursaries – the W&RSETA will provide full bursaries covering tuition, books, accommodation and living allowances to students from poor families
Collaboration with TVETs and HETs – W&RSETA has put in place initiatives to strengthen the capacity of TVET colleges to deliver W&R sector specific programmes
Artisan development – the W&RSETA has in place initiatives to develop artisans and other trades
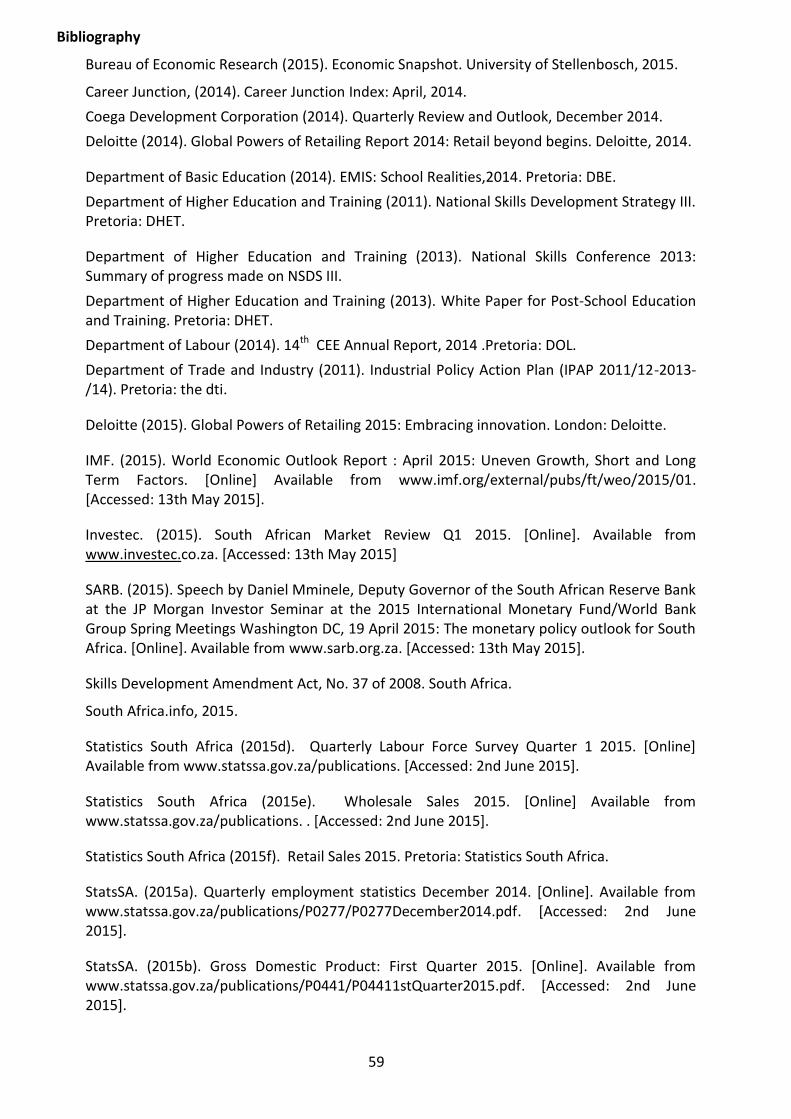
59
Bibliography
Bureau of Economic Research (2015). Economic Snapshot. University of Stellenbosch, 2015.
Career Junction, (2014). Career Junction Index: April, 2014.
Coega Development Corporation (2014). Quarterly Review and Outlook, December 2014.
Deloitte (2014). Global Powers of Retailing Report 2014: Retail beyond begins. Deloitte, 2014.
Department of Basic Education (2014). EMIS: School Realities,2014. Pretoria: DBE.
Department of Higher Education and Training (2011). National Skills Development Strategy III. Pretoria: DHET.
Department of Higher Education and Training (2013). National Skills Conference 2013: Summary of progress made on NSDS III.
Department of Higher Education and Training (2013). White Paper for Post-School Education and Training. Pretoria: DHET.
Department of Labour (2014). 14th CEE Annual Report, 2014 .Pretoria: DOL.
Department of Trade and Industry (2011). Industrial Policy Action Plan (IPAP 2011/12-2013-/14). Pretoria: the dti.
Deloitte (2015). Global Powers of Retailing 2015: Embracing innovation. London: Deloitte.
IMF. (2015). World Economic Outlook Report : April 2015: Uneven Growth, Short and Long Term Factors. [Online] Available from www.imf.org/external/pubs/ft/weo/2015/01. [Accessed: 13th May 2015].
Investec. (2015). South African Market Review Q1 2015. [Online]. Available from www.investec.co.za. [Accessed: 13th May 2015]
SARB. (2015). Speech by Daniel Mminele, Deputy Governor of the South African Reserve Bank at the JP Morgan Investor Seminar at the 2015 International Monetary Fund/World Bank Group Spring Meetings Washington DC, 19 April 2015: The monetary policy outlook for South Africa. [Online]. Available from www.sarb.org.za. [Accessed: 13th May 2015].
Skills Development Amendment Act, No. 37 of 2008. South Africa.
South Africa.info, 2015.
Statistics South Africa (2015d). Quarterly Labour Force Survey Quarter 1 2015. [Online] Available from www.statssa.gov.za/publications. [Accessed: 2nd June 2015].
Statistics South Africa (2015e). Wholesale Sales 2015. [Online] Available from www.statssa.gov.za/publications. . [Accessed: 2nd June 2015].
Statistics South Africa (2015f). Retail Sales 2015. Pretoria: Statistics South Africa.
StatsSA. (2015a). Quarterly employment statistics December 2014. [Online]. Available from www.statssa.gov.za/publications/P0277/P0277December2014.pdf. [Accessed: 2nd June 2015].
StatsSA. (2015b). Gross Domestic Product: First Quarter 2015. [Online]. Available from www.statssa.gov.za/publications/P0441/P04411stQuarter2015.pdf. [Accessed: 2nd June 2015].
60
StatsSA. (2015c). Gross Labour market dynamics in South Africa, 2014. [Online]. Available from www.statssa.gov.za/publications/Report-02-11-02/ Report-02-11-022014.pdf. [Accessed: 2nd June 2015].
W&RSETA (2013). Annual Report. [Online] Available from www.wrseta.org.za. [Accessed: 20th May 2015].
W&RSETA (2013). Sector Skills Plan Update: 2013. 2011-2016. [Online] Available from www.wrseta.org.za. [Accessed: 20th May 2015].
W&RSETA (2014a). Strategic Plan 2011-2016. [Online] Available from www.wrseta.org.za. [Accessed: 20th May 2015].
W&RSETA (2014b). The impact of wholesale-retail sector on the economy of South Africa, 2014.
Wholesale Business Issue 4, 2014. . [Online] Available from [Accessed: 2nd June 2015].


