598 Ekonomický časopis, 66, 2018, č. 6, s. 598 – 620 Sectoral Linkages of Taxes: An Input-Output Analysis of the Croatian Economy Sabina HODŽIĆ* – Damira KEČEK** – Davor MIKULIĆ*** Abstract The design of a tax system should take into account that producers in the national economy are strongly interconnected. Increasing the tax burden not only affects the sector the activities of which taxes are directly levied on, but all other economic entities, too, because of sectoral linkages. In this empirical re- search, the input-output (I-O) analysis was used to analyse sectoral linkages of taxes within the Croatian economy. The results show that the largest ratio of total to direct tax effects induced by unit change of final demand in an open I-O model (type I tax multiplier) is found in sector CPA_A01 – Products of agri- culture, hunting and related services. The largest ratio of total tax effects to di- rect tax effects per unit change of final demand in a closed I-O model – (type II tax multiplier) is found in sector CPA_T – Services of households as employers; undifferentiated goods and services produced by households for own use. On the other hand, the lowest indicators of type I and II tax multipliers are found in sector CPA_L68A – Imputed rents of owner-occupied dwellings. Keywords: tax multipliers, fiscal policy, input-output analysis, sectoral linkages, Croatian economy JEL Classification: H23, C67, H2 * Sabina HODŽIĆ, University of Rijeka, Faculty of Tourism and Hospitality Management Opatija, Primorska 42, POB 97, Ika, 51410 Opatija, Croatia; e-mail: [email protected]** Damira KEČEK, University North, 104. Brigade 1, 42000 Varaždin, Croatia; e-mail: damira. [email protected]*** Davor MIKULIĆ, The Institute of Economics Zagreb, Trg J. F. Kennedyja 7, 10000 Zagreb, Croatia; e-mail: [email protected]
Transcript
598 Ekonomický časopis, 66, 2018, č. 6, s. 598 – 620
Sectoral Linkages of Taxes: An Input-Output Analysis of the Croatian Economy Sabina HODŽIĆ* – Damira KEČEK** – Davor MIKULIĆ***
Abstract The design of a tax system should take into account that producers in the national economy are strongly interconnected. Increasing the tax burden not only affects the sector the activities of which taxes are directly levied on, but all other economic entities, too, because of sectoral linkages. In this empirical re-search, the input-output (I-O) analysis was used to analyse sectoral linkages of taxes within the Croatian economy. The results show that the largest ratio of total to direct tax effects induced by unit change of final demand in an open I-O model (type I tax multiplier) is found in sector CPA_A01 – Products of agri-culture, hunting and related services. The largest ratio of total tax effects to di-rect tax effects per unit change of final demand in a closed I-O model – (type II tax multiplier) is found in sector CPA_T – Services of households as employers; undifferentiated goods and services produced by households for own use. On the other hand, the lowest indicators of type I and II tax multipliers are found in sector CPA_L68A – Imputed rents of owner-occupied dwellings. Keywords: tax multipliers, fiscal policy, input-output analysis, sectoral linkages, Croatian economy JEL Classification: H23, C67, H2
* Sabina HODŽIĆ, University of Rijeka, Faculty of Tourism and Hospitality Management Opatija, Primorska 42, POB 97, Ika, 51410 Opatija, Croatia; e-mail: [email protected] ** Damira KEČEK, University North, 104. Brigade 1, 42000 Varaždin, Croatia; e-mail: damira. [email protected] *** Davor MIKULI Ć, The Institute of Economics Zagreb, Trg J. F. Kennedyja 7, 10000 Zagreb, Croatia; e-mail: [email protected]
599
Introduction Designing a tax system to be business-friendly can have an important positive impact on an economy. It can ensure appropriate financial resources for the func-tioning of government bodies, but also limit negative impacts of taxation on the growth, employment and overall competitiveness of domestic producers. In re-cent years, Croatia has experienced very turbulent financial markets, starting with the progressive de-industrialisation at the beginning of the 2000s, continu-ing on with the recession in 2008 and accession to the European Union in 2013, and culminating in the end in a current account surplus in 2016. All of that affected the Croatian economy and its sectors (i.e. extractive industry, manufacturing, energy and utilities). To achieve a sustainable budget, it is the task of fiscal policy to support all government objectives and programmes. That includes, for example, the stimu-lation of economic growth, the regulation of unemployment and price levels and the redistribution of income. There are significant differences between European Union Members States regarding income distribution and tax burden. According to the European Commission (2018) the disposable income inequality increased in only 11 (Slovenia, Sweden, Denmark, Austria, Luxembourg, France, Germany, Cyprus, Spain, Italy, Greece) and declined in 15 (Czech Republic, Slovakia, Nether-lands, Belgium, Hungary, Malta, Ireland, Poland, United Kingdom, Estonia, Lithuania, Bulgaria, Romania, Portugal, Latvia) European Union Member States. Regarding the tax burden on labour, there are substantial differences between European Union Member States. However, the highest implicit tax rate on labour in 2015 is found in Belgium (43.6%), Italy (43.2%) and Austria (43.1%) and the lowest in Malta (23%), Bulgaria (23.9%) and the United Kingdom (24.8%) (European Commission, 2017). All of this indicates a high tax burden on labour and how the tax burden is distributed to other economic sectors. For doing em-pirical research on how the tax burden is distributed among the domestic sectors via sectoral linkages, the most appropriate model is an input-output (I-O) model. The objective of our paper is to explore the sectoral linkages of taxes by using an I-O analysis for all economic sectors in Croatia and to quantify the total tax effects related to unit change of final demand for goods and services across the industries. This paper attempts to fill the gap by analysing the sectoral linkages of taxes on certain industries in Croatia. Based on these linkages, a general as-sessment of the direction of the tax reform which was introduced in 2017 will be provided in the conclusion of the paper. The remainder of this paper is organised as follows. After the introduction, a brief literature review will be presented. Section two will describe the research methodology and data sources, while Sec-tion three will present the empirical results. In the conclusion, we will provide our final remarks and recommendations for further research.
600
1. Literature Review Fiscal policy can act in both the short and long runs. In the short run, fiscal policy is considered expansionary (contractionary) when public expenditures exceed (fall short of) public revenues. On the other hand, if additional govern-ment expenditures enhance growth, then government deficits exhibit an indirect effect in the long run. To stimulate economic growth and lower unemployment rates, the government needs to implement an expansionary fiscal policy by in-creasing government spending and decreasing taxation rates. Vice versa, it is a case of restrictive policy. In his study Malinowski (2017) investigated the possi-bilities of instituting an expansive fiscal policy in individual euro zone countries. He found that in the euro zone countries it is very hard to implement an expan-sive fiscal policy due to a high level of public debt and high level of budget deficit in relation to gross domestic product. The connection between fiscal policy and economic growth has garnered a lot of attention in theoretical and empirical research. Some empirical studies docu-ment a positive relationship between fiscal policy and economic growth (Cohen and Follete, 2000; van den Noord, 2000; Di Bella, 2002; Walsh, 2002; Dalic, 2013), while others have explored the negative relationship (Landau, 1983; 1986; Kormendi and Meguire, 1985; Grier and Tullock, 1989; Barro, 1991, Alesina et al., 2002; Moro, 2004). Among them, there is a consensus that fiscal policy mea-sures have an important impact on economic activities. To increase budget reve-nues, every country uses different types of taxes as an instrument. Therefore, the theory of optimal taxation plays a central role. According to this theory, a tax system should be chosen in order to maximise social welfare at the lowest costs possible. In his work, Mirrlees (1971) “pointed out that greater inequality in ability makes the optimal tax policy more redistributive” (p. 13). To ensure tax fairness and performance, taxes are a tool to influence the decisions of indi-viduals and businesses. In addition, they generate direct and indirect spillover effects. Besides the positive or negative relationship between fiscal policy and economic growth, the design of a tax structure also has an important impact on economic growth. Therefore, Trasberg (2013) investigated the structural changes in taxation across the new European Union Member States from Central Eastern Europe (CEE) and a group of old countries of the European Union during last decade. He found that the new countries of the European Union have been moving towards a higher importance of consumption and smaller use of direct taxation, while old countries have been relatively stable regarding the design of taxation structures. Researchers (Grdinić, Drezgić and Blažić, 2017) explored the impact of the structure of taxes on economic growth by using a sample of
601
CEE countries in the period from 1990 to 2010. They found that tax forms have a negative impact on economic growth, and among them, personal income taxes have the highest negative impact on economic growth. All of this is af-fected by differences in economic and political structures, as well as in fiscal autonomies. The tax systems of the European Union Member States, including Croatia, tend to be heavily reliant on labour taxes (European Commission, 2014). High labour taxes negatively affect both the supply of and demand for labour. The tax reforms of many European Union members have focused on shifting the tax burden from labour and production to other types of taxation which do not have a negative impact on competitiveness, like property or consumption taxes. In the literature, not so many researchers have explored the effect of taxes on an economy by using an I-O analysis. The basic mathematical model for an I-O analysis is the Leontief I-O quantity model. The first researcher to discuss the price effects of taxation and subsidisation in the I-O model was Lloyd Metzler (1951). According to his research, “[T]he price of the taxed commodity rises and the price of the subsidized commodity falls; the primary effect of the tax or sub-sidy exceeds the secondary effect by changing the cost of production in the taxed and subsidized industry” (p. 27). On the other hand, Allen (1972) found that, “[I]f an ad valorem tax (subsidy) is imposed, combined with a subsidy (tax) of equal absolute value, it can be said that only the price of the taxed (subsidised) commodity rises (falls); it is impossible to tell whether the price of the subsi-dised (taxed) commodity will fall (rise)” (p. 28). In his paper, Atsumi (1981) presented some interesting facts about Leontief’s system, and also provides a theorem on Metzler’s matrix. On the basis of an I-O analysis with regard to Romanian fiscal policy, Zaman, Surugiu and Surugiu (2010) suggest a new way of substantiating the tax measures by considering their possible effects in the short and medium runs. The application of I-O analyses in economic studies has a long tradition in certain Central European economies, especially Slovakia and the Czech Repub-lic. A central I-O model could be expanded and used to analyse various areas of interests. Authors from the CEE contributed to the literature not only by empiri-cal application of an I-O model, but also by means of methodological contribution in expansion of the I-O model in to order capture important economic phenomena. Luptáčik and Böhm (1994) reconsidered approaches to non-negative solutions for the augmented Leontief model. The same authors proposed a measurement method for efficiency with an I-O model extended by the constraints on primary inputs (Luptáčik and Böhm, 2010) and presented how the efficiency frontier of the economy could be modelled by the multi-objective optimisation model. Based
602
on an extended I-O model, Luptáčik (2001) and Luptáčik and Böhm (2005) de-veloped new alternative measures for eco-efficiency. The I-O model has also been applied in numerous empirical studies. Sixta and Vltavská (2016) developed the methodology and discussed practical aspects of the construction of regional I-O tables for the Czech Republic. They used a matrix of technical coefficients from national I-O tables as a base and produced the regional tables that are consistent with macroeconomic aggregates. By trans-forming available data and using an approach based on symmetric I-O tables, Sixta and Fischer (2014) produced a time series for the Czech Republic to con-struct the gross domestic product for the socialist period, i.e. for the period 1970 – 1989. The comparison of the estimated time series with the official data that the Czech Statistical Office has published since 1990 indicates their complete consistency. Zbranek, Sixta and Fischer (2016) developed a modified semi-dynamic I-O model to analyse the impact of large multi-annual investment projects. The model considers the primary investment shocks and calculates induced effects based on increased wages and salaries as well as on increased profits in the next period. Also, the model updates the technical coefficients for the following years for which the analysis is conducted, given the structural changes in the economy driven by investment shocks. 2. Research Methodology and Data Sources
An input-output analysis is a practical quantitative macroeconomic method that examines and determines sectoral interdependence within the economy. The statistical information basis of an I-O analysis is an input-output table where sectoral flows of goods and services between productive sectors of the economy are shown (Miller and Blair, 2009). The main equations of the I-O model de-scribing the sectoral flows comprised of productive sectors can be expressed as:
1 1
, 1, ,n n
i ij i ij j ij j
X X Y a X Y i n= =
= + = + = … (1)
where iX – total output of sector i,
ijX – output from sector i which is used as an intermediate input by sector j,
iY – final demand for products in sector i,
ijij
j
Xa
X= – technical coefficient defined as a ratio of a product from sector i that is
required by sector in order to produce one unit of its product.
603
In matrix form, the system of equations (1) can be rewritten as:
X AX Y= + (2)
where 1
n
X
X
X
=
⋮ , 1
n
Y
Y
Y
=
⋮ and 11 1
1
n
n nn
a a
A
a a
=
⋯
⋮ ⋱ ⋮
⋯
Matrix A with elements , , 1, , ija i j n= … is a technology matrix.
The solution to the system (2), where I is an n-by-n identity matrix is:
1( )X I A Y−= − (3) where matrix 1( )I A −− is known as a Leontief Inverse matrix whose elements
ijα represent sector i’s total direct and indirect output per one unit of final de-
mand in sector j. In order to reflect tax linkages among domestic producers, an I-O table for the use of domestic output is applied and elements ijα present I-O
coefficients for domestic output only. The direct, indirect and induced effects of each productive sector on the overall economy are based on the input-output model. An open I-O model, where final consumption is considered an exogenous variable, is used to calculate the direct and indirect effects. Indicators that determine these effects are called type I multi-pliers. A closed I-O model, in which households are considered an endogenous variable, is used to analyse direct, indirect and induced effects, and multipliers that include direct, indirect and induced effects are called type II multipliers (McLennan, 2006).
Tax coefficient ɶ ii
i
tt
X= represents the share of tax in sector i’s output.
In matrix form, the total tax effects in the open I-O model can be calculated by
multiplying the row vector tɶ containing tax coefficients ɶ, 1, , it i n= … of sectors of the national economy and Leontief Inverse matrix:
1 ( )T t I A −= −ɶ (4) The total tax effect for sector j can be interpreted as an increase in the total taxes in the overall economy which are related to the unit increase of the output of sector j. The total tax effects in the closed I-O model can be expressed in matrix form as:
1 ( )T t I A −= −ɶ (5)
604
where matrix A is an expanded technology matrix A with one more row of compensation of employees coefficients and one more column of household consumption coefficients. Type I tax multipliers express the tax of an economy directly and indirectly related to the unit of final demand of a certain sector. For sector j, the type I tax multiplier, ( ) jm t , is defined as the ratio of the tax of an economy directly and in-
directly required per unit of final demand and the tax generated per unit of its output:
�
�
11
. .
( )
n i niji
i iji ij
j j
j
ttX
m tt tX
α α=== =
(6)
Besides direct and indirect tax changes, type II tax multipliers involve in-
duced tax changes. The type II tax multiplier for sector j, ( ) jm t , is defined as
the ratio of direct, indirect and induced tax growth generated by growth of final demand for one unit in sector j and the tax generated per unit of its output, i.e.:
�
�
11
. .
( )
n i niji
i iji ij
j j
j
ttX
m tt tX
α α=== =
(7)
where �
jt – sector j’s tax coefficient and numbers,
ijα – elements of the matrix 1( )I A −− . The main data source used in this research is the Croatian symmetric I-O table for domestic production for 2010 (Croatian Bureau of Statistics, 2017), where the total Croatian economy is separated into 64 mutually exclusive pro-duction sectors. According to Eurostat recommendations (Eurostat, 2008), symmetric I-O tables are valued at basic prices. A basic price is defined as the price receivable by the producer from the purchaser for a unit of a good or ser-vice produced as output (Eurostat, 2010). A basic price does not include any tax payable on that unit as a consequence of its production or sale (i.e. taxes on products), but does include any subsidy receivable on that unit as a consequence of its production or sale (i.e. subsidies on products). The reconciliation of total uses and supply in the process of compi-lation of I-O tables require that both uses and supply are based on the same price concept.
605
The original data used in compilation of the supply table are usually valued at basic prices, while final demand categories are usually expressed at purchaser prices. In order to compare supply and demand in a meaningful way, the valua-tion tables which comprise information on taxes less subsidies on products, trade margins and transport margins need to be constructed. The process of the con-struction of a valuation matrix has been known for a long time and was de-scribed in SNA 1968 and SNA 1993. The model of price transformation should be carefully designed and should be based not only on economic concepts, but should also account for national tax legislation with regard to specific items, especially when deductible taxes like VAT are in question (Eurostat, 1995). The columns of the symmetric I-O table present the structure of production costs incurred in the production process of each activity. The total output value of an activity is distributed to intermediate consumption expressed in basic prices, non-deductible taxes on intermediate products and gross value added (GVA). The structure of the output of each productive sector could be distributed to the following items:
o intermediate consumption in basic prices o net non-deductible taxes on products (tgs)
• Gross value added (3) = (4) + (5) + (6) + (7) o compensation of employees (4) ▪ net wages and salaries ▪ personal income tax and social contributions (pitsc)
o other taxes on production minus other subsidies on production (otp, 5) o consumption of fixed capital (6) o operating surplus and mixed income, net (7) ▪ profit tax (pt) ▪ producers’ profit.
Total taxes paid by an industry comprise: • net non-deductible taxes on products (tgs), • labour taxes: personal income taxes and social contributions (pitsc), • other net taxes on production (otp), • profit tax (pt).
Taxes on products (tgs) are taxes that are payable per unit of a certain good or service produced or distributed (Eurostat, 2010). The tax obligation could be ex-pressed as a specific amount of money per unit of quantity of a good or service, or it may be calculated ad valorem as a specific percentage of the price per unit
606
(usually applied for excises) or value of the goods and services produced or transacted (value added tax (VAT) type taxes). As a general principle, taxes are applied on defined transactions irrespective of the institutional entity (producer or final user). However, in economies which apply a VAT system, taxes paid on intermediate consumption are treated as deductible tax and are therefore not included in the intermediate costs. According to the ESA 2010, VAT is to be recorded net, in the sense that output of goods and services and imports are valued excluding invoiced VAT. Purchases of goods and services are recorded inclusive of non-deductible VAT only. VAT is recorded as being borne by the purchasers, not suppliers, and only by those purchasers who are not included in the VAT system and not able to deduct it (generally final users). The greater part of VAT is therefore recorded as being paid on final uses, mainly on household consumption and government entities. In the Croatian case, entities exempted from VAT include a group of small pro-ducers (with sales lower than the VAT obligation limit), government entities, financial institutions and most non-profit organisations. According to the defini-tion of purchaser prices, non-deductible VAT is included in the purchaser price, but not deductible VAT. VAT and other taxes on products which are paid as part of the purchaser price by final users are directly included in components of final demand and do not affect the costs and competitiveness of productive sectors. The price level of a product is influenced not only by the general VAT rate (or other taxes on final uses), but also by taxes on production input (labour and profit taxes) which are incorporated in the overall product costs. The final tax burden related to non-deductible VAT is based on the identifica-tion of industries and final users that are exempted from VAT (entities that are not allowed to deduct VAT from their purchases). The Croatian Bureau of Sta-tistics (CBS) crosschecks VAT data reported to tax authorities with theoretical amounts based on the application of the corresponding VAT rates to the con-sumption of resident and non-resident households as well as to the intermediate consumption and investment of units that are not subject to VAT. A comparison of the VAT register and business register is used for identification of output and other categories related to producers not included in VAT system. The share of non-deductible VAT in different product groups depends on the actual VAT legislation. In the Croatian VAT system, three different VAT rates are valid: a standard rate and two reduced rates. The standard rate is 25% (23% in 2010), while the two reduced rates are 13% and 5%. The 13% reduced rate applies to services of accommodation or accom-modation with breakfast, full or half board in all kinds of commercial hospitality facilities and to agency commissions for such services; children’s seats; electrical
607
energy; public service for collecting bio waste; supplies of museums, libraries, theatres, orchestras and other cultural services; baby food, water supply and white sugar. The rate of 5% (zero rate in 2010) applies to bread and milk, certain types of books, scientific journals, medicines and public showings of films; and news-papers and magazines published daily or periodically unless they are used for advertisement purposes only. In the Croatian I-O tables, taxes on products are presented on a net basis, i.e. taxes minus subsidies on products. For analytical purposes, a more appropriate principle would be expression of taxes and subsides in I-O tables as separate items. The implications of those categories on an economy are different and taxes and subsidies should be treated and deflated separately. Subsidies on products are subsidies payable per unit of a good or service produced or imported. Simi-larly to taxes, subsidies could also be defined as a specific amount of money per unit of quantity of a good or service, or they may be calculated ad valorem as a specific percentage of the price per unit. Other taxes on production (otp) generally cover taxes on the ownership and use of land, buildings and other facilities, taxes on the use of fixed assets, taxes on the total wage bill and payroll taxes, taxes on pollution etc. (Eurostat, 2008). Those types of taxes are not related to the quantity of goods or services produced or distributed, but also impact the overall producer costs. Value added equals the difference between the output and intermediate con-sumption. The value added at basic prices equals the sum of compensation of employees, other taxes on production less other subsidies on production, the sum of gross operating surplus and gross mixed income. Compensation of employees includes all income received in cash or kind by employees as a compensation for their labour input and paid by an employer. Compensation of employees includes both employees’ and employers’ social con-tributions. The employers’ social contribution includes compulsory and voluntary social contributions. In the Croatian case, obligatory social contributions cover pension insurance (employee contributions), as well as health, public employment and accident insurance (employers’ social contributions). In the Croatian I-O table, the compensation of employees is expressed only on a gross basis and includes net wages and salaries, personal income tax and social contributions. However, by combining the officially defined tax and contribution rates and official figures of gross/net wage coefficients by industry, an estimate of personal income tax and social contributions could be provided for each production sector (pitsc). The tax burden of an industry influences not only the competitiveness of the sector which directly pays certain taxes, but also negatively influences other sec-tors which use their products as an intermediary input. For example, an increase
608
in excises on motor oils negatively affects the competitiveness of the oil indus-try, but also the sectors of transport, electricity and other producers which use oil derivatives as an intermediary input. 3. Empirical Results This section presents estimates of the indirect and induced tax effects of each productive sector on the overall Croatian economy as well as the type I and II tax multipliers based on the methodology and data sources described in the previous section. Based on the I-O model, the total taxes related to production could be distributed to the components of final demand. Net taxes on products are gene-rally paid by final users, but a certain percentage is included in intermediate consumption. However, producers determine the prices of their products so that all costs, including taxes on production, are fully included in the prices paid by a purchaser. Thus, taxes which are legally paid by producers are allocated to final users who pay prices including all taxes. The best example of the aforemen-tioned conclusion are contributions to social security funds. The total labour costs include net wages and salaries, but also funds directed to the social security system. When calculating the prices of their products, productive entities include all costs, and final users implicitly pay a price which includes social contribu-tions. The price paid by a purchaser includes not only the total labour costs of the entity which directly delivers the final products, but also a proportion of the labour costs (net wages and government revenues) of all domestic producers included in the overall value added chain of the direct supplier. In that way, an increase in the prices of certain producers due to an increased tax burden is transferred to the rest of the economy. Total taxes are distributed to components of final uses and individual eco-nomic sectors by the I-O model described in the methodological part of the paper. Table 1 presents decompositions of taxes and contributions on individual tax types distributed to components of final uses, while the total tax effects for all 64 economic sectors are presented in the Appendix. The first part of Table 1 presents data in absolute terms (millions of HRK), and the shares of each com-ponent of final demand in an individual tax type are presented in the second part of the table. Each type of taxes is decomposed to the component of final demand which directly or indirectly induces obligatory payment according to the results of the I-O model. Total taxes on production and inputs (labour and capital), which directly increase production costs of domestic units, formed approximately two-thirds of the total direct and indirect taxes (69.3 out of 105.8 billion of HRK). The results of the conducted analysis show that the total direct and indirect taxes
609
are the highest for final consumption expenditure by households where total direct and indirect taxes (presented in the last row) involve almost 60% of the total taxes and contributions. T a b l e 1
Decomposition of Taxes on Components of Final Uses in 2010 (in millions of HRK)
Final consumption
expenditure by households
Government + NPISH*
Capital formation
Exports Total
Social contributions 15,200 11,367 5,060 7,084 38,712 Personal income tax 4,588 3,064 1,630 2,091 11,373 Profit tax 2,593 630 905 922 5,050 Total direct taxes 22,381 15,061 7,595 10,097 55,135 Taxes less subsidies on products 4,488 2,246 1,946 2,411 11,090 Other taxes on production 1,577 446 531 546 3,101 Total taxes on production and inputs
28,446
17,753
10,072
13,054
69,326
Taxes on final demand (VAT, excises) minus subsidies
34,667
–432
2,014
236
36,485
Total direct and indirect taxes 63,113 17,321 12,086 13,290 105,811
Structure
Social contributions 39.3 29.4 13.1 18.3 100 Personal income tax 40.3 26.9 14.3 18.4 100 Profit tax 51.4 12.5 17.9 18.3 100 Total direct taxes 40.6 27.3 13.8 18.3 100 Taxes less subsidies on products 40.5 20.2 17.5 21.7 100 Other taxes on production 50.9 14.4 17.1 17.6 100 Total taxes on production and inputs
41
25.6
14.5
18.8
100
Taxes on final demand (VAT, excises) minus subsidies
95
–1.2
5.5
0.6
100
Total direct and indirect taxes 59.6 16.4 11.4 12.6 100
Source: Authors’ calculation. The total net taxes (taxes minus subsides) which are related to transactions with goods and services amounted to approximately 106 billion HRK in 2010, out of which 36.5 billion HRK was paid by final users in the form of taxes on final demand (indirect taxes). Taxes on final demand are generally related to final expenditures of households (35 out of 36.5 billion HRK). Goods and ser-vices purchased for final consumption by government and non-profit institutions cover products which are generally subsidised, and the net taxes on final demand are negative (subsidies higher than taxes). The total taxes on production and inputs paid by producing entities amounted to 69 billion HRK, but those taxes were finally transferred to purchasers via the price system. The personal consumption of households has a dominant share in this category, but as can be seen, the taxes and contributions are more diversified to other components of final uses. Producers who sell their products abroad are
610
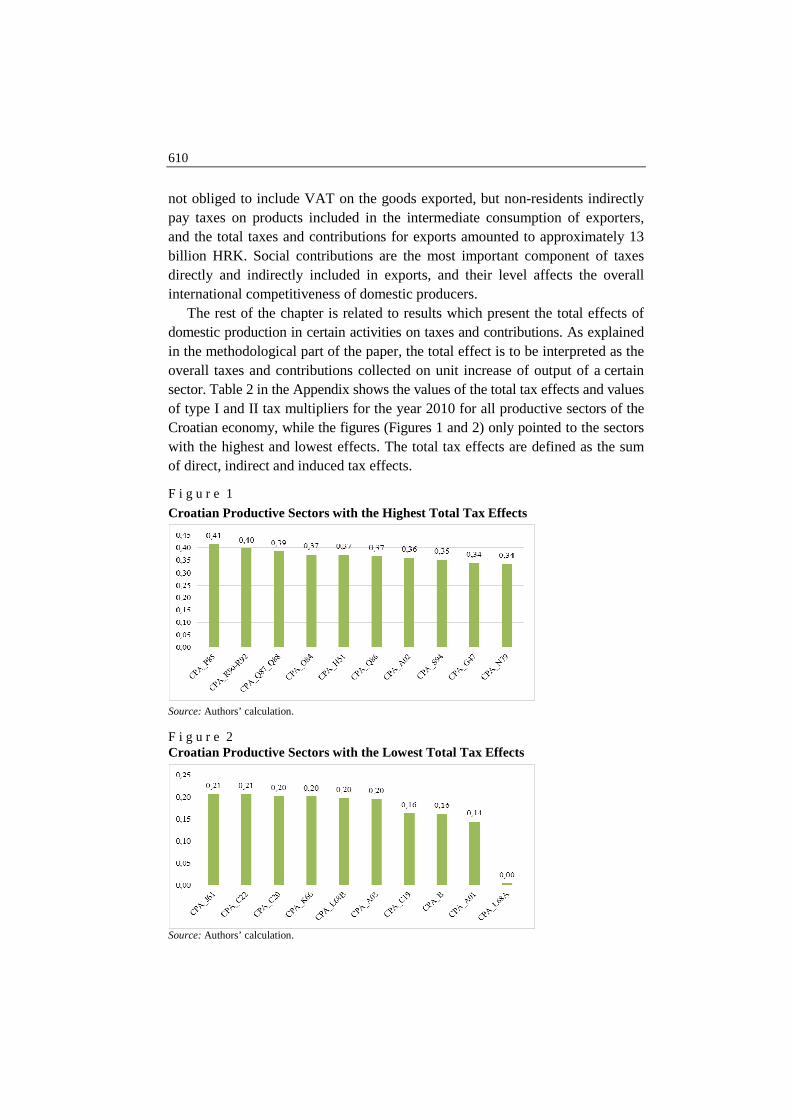
not obliged to include VAT on the goods exported, but non-residents indirectly pay taxes on products included in the intermediate consumption of exporters, and the total taxes and contributions for exports amounted to approximately 13 billion HRK. Social contributions are the most important component of taxes directly and indirectly included in exports, and their level affects the overall international competitiveness of domestic producers. The rest of the chapter is related to results which present the total effects of domestic production in certain activities on taxes and contributions. As explained in the methodological part of the paper, the total effect is to be interpreted as the overall taxes and contributions collected on unit increase of output of a certain sector. Table 2 in the Appendix shows the values of the total tax effects and values of type I and II tax multipliers for the year 2010 for all productive sectors of the Croatian economy, while the figures (Figures 1 and 2) only pointed to the sectors with the highest and lowest effects. The total tax effects are defined as the sum of direct, indirect and induced tax effects. F i g u r e 1
Croatian Productive Sectors with the Highest Total Tax Effects
Source: Authors’ calculation. F i g u r e 2 Croatian Productive Sectors with the Lowest Total Tax Effects
Source: Authors’ calculation.
611
According to the activity sections in the 2007 National Classification of Activi-ties, the highest values of total tax effects are mainly recorded in sector CPA_P85 – Education services, sector CPA_R90_R92 – Creative, arts and entertainment services, sector CPA_Q87_Q88 – Social work services and in sector CPA_O84 – Public administration and defence services (see Figure 1). Those sectors cover the activities of government entities such as schools, hospitals and other public services which are mainly non-market producers, but also labour-intensive sec-tors. The results can be explained by a high level of labour taxation in Croatia. On the other hand, as shown in Figure 2, the lowest values of total tax effects are mainly recorded in sector CPA_J61 – Telecommunications services, sector CPA_L68B – Real estate activities, sector CPA_A03 – Fish and other fishing products sector CPA_B – Mining and quarrying and some of the manufacturing industries that are related to coke and refined petroleum products, chemicals and chemical products, as well as rubber and plastics products, i.e. in sectors CPA_C19, CPA_C20, CPA_C22. This group comprises productive sectors where production is based on the dominant input of capital. Based on multiplier values, it becomes evident that the largest type I tax mul-tiplier of 2.223 is attributed to sector CPA_A01 – Products of agriculture, hunt-ing and related services, while the largest type II tax multiplier of 3.473 is in sector CPA_T – Services of households as employers, undifferentiated goods and services produced by households for own use. The lowest type I multipliers and the type II tax multiplier of 1.085 are attributed to sector CPA_L68A – Im-puted rents of owner-occupied dwellings. However, when drawing a conclusion on tax spillovers among economic sectors, a difference in the total effects and multiplier should be borne in mind. High multipliers for specified sectors could be the result of lower taxes paid directly by producers on those activities and a low denominator value, for exam-ple in agriculture or the own account services of the household sector, because of more favourable regulations on labour taxation in those entities and the avai-lability of subsidies. The structure of the total tax effects for all productive sectors of the Croatian economy is presented in Table 3 in the Appendix. The total tax effects are bro-ken down into labour taxes and all other taxes. The values in the labour taxes column are equal to the sum of social contributions and personal income taxes, while the other taxes column includes profit tax, taxes less subsidies on products and other taxes on production. It could be noted that the largest share of labour taxes in total induced taxes is borne by sector CPA_P85 – Education services (83.76%), followed by sector CPA_A02 – Products of forestry, logging and re-lated services (83.60%), while the same share in sector CPA_L68A – Imputed rents of owner-occupied dwellings is equal to zero.
612
Conclusion The results of this study have illustrated the sectoral linkages of taxes by using an I-O analysis for all economic sectors in Croatia and quantifying the total tax effects related to unit change of final demand for goods and services across the industries. The current tax system in Croatia is primarily based on taxation of labour and the final consumption of households. Taxes on production and primary inputs in Croatia formed approximately two-thirds of the total tax revenues, while the rest are VAT and other indirect taxes. However, labour and other production taxes are multiplicatively distributed to the competitiveness of the overall economy through the price system and sectoral linkages. High labour taxation negatively affects prices not only for personal expenditures, but also gross fixed capital formation and exports. According to the results of the I-O analysis, a unit change of final demand will affect the total production taxes in the range from 0.141 (agricultural products) to 0.41 (education). Labour-intensive production sectors induce the highest tax effects. This group covers non-market activities such as education, health and social care, but also some market sectors such as air transport, retail trade and travel agencies. On the other hand, activities which induce the least taxes per unit of output in the overall value added chain are mostly sectors based on capi-tal, such as telecommunications, production of refined petroleum products and the chemical industry. The group of economic sectors with the lowest tax effects induced by unit change of final demand includes agriculture as an activity which is highly subsidised. The highest ratio of total tax effects to direct tax effects in the closed I-O model (multiplier type II) is estimated for the production of un-differentiated goods and services produced by households for their own use. Labour taxes, including obligatory social contributions, present usually more than two-thirds of the total tax burden borne by economic sectors, except in a limited number of sectors, such as agriculture, financial, rental or telecommu-nication services. The results of the study could be of interest for policymakers and used for evaluation of alternative tax policy measures. The results could provide useful empirical grounds for understanding the consequences of a tax shift as recently introduced in Croatia by the 2017 Tax Reform. However, the high level of social contributions increases the costs not only in labour-intensive sectors, but also in other industries due to sectoral linkages. 1 The total effect for imputed housing rents is virtually zero. It is an item introduced in ESA 2010 in order to methodologically improve the comparability of standards of living of households and cover non-market services for own consumption which is not taxed.
613
The results of the paper highlight the process of tax burden redistribution across economic sectors. Due to a strong assumption of constant technical coeffi-cients, the I-O approach disregards potential changes in the mix of production in-puts and the effects of changes in relative prices. Future research on development of a general equilibrium model for the Croatian economy could provide a more robust tool for evaluation of the impact of changes in exogenous variables on the domestic economy. The general I-O model which is applied in this paper, could be augmented in future research to include price elasticity effects in order to focus on the impact of tax policy on specific Croatian key sectors, such as tourism. References ALESINA, A. – ARDAGNA, S. – PEROTTI, R. − SCHIANTARELLI, F. (2002): Fiscal Policy,
Profits and Investment. American Economic Review, 92, No. 3, pp. 571 – 589. ALLEN, P. R. (1972): Taxes and Subsidies in Leontief's Input-Output Model: Comment. The
Quarterly Journal of Economics, 86, No. 1, pp. 148 − 153. ATSUMI, H. (1981): Taxes and Subsidies in the Input-Output Model. The Quarterly Journal of
Economics, 96, No. 1, pp. 27 – 45. BARRO, R. J. (1991): Economic Growth in a Cross-section of Countries. The Quarterly Journal of
Economics, 106, No. 2, pp. 407 − 443. DALIC, M. (2013): Cyclical Properties of Fiscal Policy in NMS. Journal of Post-Communist
Economies, 25, No. 3, pp. 289 − 308. DI BELLA, G. (2002): Automatic Fiscal Stabilizers in France. [IMF Working Paper, No. 02/199.]
Washington, DC: International Monetary Fund. COHEN, D. − FOLLETTE, G. (2000): The Automatic Fiscal Stabilizers: Quietly Doing Their
Thing. Economic Policy Review, 6, No. 1, pp. 35 − 68. CROATIAN BUREAU OF STATISTICS (2017): Input-Output Table for 2010 Supply and Use Tables
for 2010. Available at: <http://www.dzs.hr/Hrv_Eng/publication/2015/12-01-04_01_2015.htm>. EUROPEAN COMMISSION (2018): Report on Public Finances in EMU 2017. [Institutional
Paper 069.] Luxembourg: Publications Office of the European Union. EUROPEAN COMMISSION (2017): Taxation Trends in the European Union. Luxembourg:
Publications Office of the European Union. EUROPEAN COMMISSION (2014): Tax Reforms in EU Member States: 2014 Report. [Taxation
Paper, No. 48.] Brussels: Directorate-General for Taxation and Customs Union and Direc-torate-General for Economic and Financial Affairs.
EUROSTAT (1995): European System of Accounts, ESA 1995. Luxembourg: Eurostat. Available at: <http://ec.europa.eu/eurostat/web/products-manuals-and-guidelines/-/CA-15-96-001>.
EUROSTAT (2008): Eurostat Manual of Supply, Use and Input-output Tables. Luxembourg: Eurostat.
EUROSTAT (2010): European System of Accounts, ESA 2010. Luxembourg: Eurostat. Doi:10.2785/16644. GRDINIĆ, M. – DREZGIĆ, S. – BLAŽIĆ, H. (2017): An Empirical Analysis of the Relationship
between Tax Structures and Economic Growth in CEE Countries, 65, No. 5, pp. 426 – 447. GRIER, K. B. – TULLOCK, G. (1989): An Empirical Analysis of Cross-National Economic Growth.
Journal of Monetary Economics, 24, No. 2, pp. 259 − 276. KORMENDI, R. C. − MEGUIRE, P. G. (1985): Macroeconomic Determinants of Growth: Cross-
Country Evidence. Journal of Monetary Economics, 16, No. 2, pp. 141 − 163.
614
LANDAU, D. (1983): Government Expenditure and Economic Growth: A Cross-Country Study. Southern Economic Journal, 49, No. 3, pp. 783 − 792.
LANDAU, D. (1986): Government and Economic Growth in the Less Developed Countries: An Empirical Study for 1960 – 1980. Economic Development and Cultural Change, 35, No. 1, pp. 35 − 75.
LUPTÁČIK, M.: Eco-Efficiency of an Economy. In: NECK, R. (ed.): Modelling and Control of Economic Systems 2001. [A Proceedings volume from the 10th IFAC Symposium Klagenfurt, Austria, September 6-8, 2001.] Elsevier IFAC Publications.
LUPTÁČIK, M. – BÖHM, B. (1994): Reconsideration of Non-Negative Solutions for the Aug-mented Leontief Model. Economic Systems Research, 6, No 2, pp. 167 – 170.
LUPTÁČIK M. – BÖHM, B. (2005): The Analysis of Eco-Efficiency in an Input-Output Fra-mework. [Paper Presented at the Ninth European Workshop on Efficiency and Productivity Analysis (EWEPA IX), June 29th to July 2nd, Brussels.]
LUPTÁČIK, M. − BÖHM, B. (2010): Efficiency Analysis of a Multisectoral Economic System. Central European Journal of Operations Research, 18, No. 4, pp. 609 – 619. Doi:10.1007/ s10100-010-0175-2.
MALINOWSKI, D. (2017): Barriers to Expansive Fiscal Policy Against the Background of the Macroeconomic Situation of the Euro Area. Economics and Law, 16, No. 1, pp. 87 – 105. Doi:10.12775/EiP.2017.006.
McLENNAN, W. (2006): Information Paper: Australian National Accounts: Introduction to Input- -output Multipliers. [Catalogue No. 5246.0.] Belconnen: Australian Bureau of Statistics.
METZLER, L. A. (1951): Taxes and Subsidies in Leontief’s Input-Output Model. The Quarterly Journal of Economics, 65, No. 3, pp. 433 − 438.
MILLER, R. E. – BLAIR, P. D. (2009): Input-Output Analysis: Foundations and Extensions. New York: Cambridge University Press.
MIRRLEES, J. A. (1971): An Exploration in the Theory of Optimal Income Taxation. Review of Economic Studies, 38, No. 2, pp. 175 − 208.
MORO, K. (2004): Government Size and Economic Growth: Reassessment of the Empirical Validity of the Empirical Validity of the Negative Relationship from an OECD Panel. [ESRI Discussion Paper Series, No. 103.] Tokyo, Japan: Economic and Social Research Institute.
NOORD, P. van den (2000): The Size and Role of Automatic Fiscal Stabilizers in the 1990s and Beyond. [OECD Economics Department Working Papers, No. 230.] Paris: OECD Publishing. Doi: 10.1787/816628410134.
SIXTA, J. – FISCHER, J. (2014): Using Input-output Tables for Estimates of Czech Gross Domes-tic Product 1970 – 1989. Economic Systems Research, 26, No. 2, pp. 177 – 196. Doi: 10.1080/ 09535314.2013.853651.
SIXTA, J. – VLTAVSKÁ, K. (2016): Regional Input-output Tables: Practical Aspects of Its Com-pilation for the Regions of the Czech Republic. Ekonomický časopis/Journal of Economics, 64, No. 1, pp. 56 – 69.
TRASBERG, V. (2013): Dynamics of European Tax Structure. DIEM: Dubrovnik International Economic Meeting, 1, No. 1, pp. 1 – 18.
WALSH, C. E. (2002): Can Expansion be Contractionary. Federal Reserve Bank of San Francisco. Economic Letter, 6, No 26, pp. 1 − 4.
ZAMAN, G. – SURUGIU, M. – SURUGIU, C. (2010): Propagation Effects of Taxes in Romania: An Input-output Analysis. Romania Journal of Economics, 30, No. 1(39), pp. 76 – 94.
ZBRANEK, J. – FISCHER, J. –SIXTA, J. (2016): Using Semi-dynamic Input-Output Model for the Analysis of Large Investment Projects. In: Mathematical Methods in Economics. [Confer-ence Proceedings of the 34th International Conference, pp. 922 – 927.] Liberec: Technical University of Liberec.