ELSEVIER Japan and the World Economy 9 (1997) 293-313
Sectoral shifts and structural change in the Japanese economy: Evidence and interpretation
Eswar Prasad*
Research Department, International Monetary Fund, Washington, DC 20431, USA
Received 3 November 1995; accepted 21 June 1996
Abstract
This paper documents long-term trends in the sectoral composition of employment and output in the Japanese economy over the last four decades. The share of the manufacturing sector in total employment has declined steadily while the share of service sector employment has trended upward. In real terms, however, the share of the manufacturing sector in the total output has remained stable over the last two decades, reflecting relatively rapid productivity growth in this sector. Various measures of productivity and changes in the inter-industry relative wage structure are examined in order to interpret these and other long-term trends. This paper also computes measures of inter-sectoral labor reallocation at different levels of disaggregation and finds no evidence of a recent increase in the pace of structural change in the Japanese economy.
Recent fluctuations in the external value of the Japanese yen have generated consider- able interest in the effects of these fluctuations on the structure of the Japanese economy. Much of this interest has focused on the notion of the 'hollowing-out' of the manufacturing sector, suggesting that a stronger yen and the availability of cheaper labor in other Asian economies have provided an impetus for the out-sourcing of production by Japanese manufacturing firms. The prospects of a shrinking manufacturing base have engendered concern about the long-term growth and competitiveness prospects of the Japanese
294 E. Prasad/Japan and the World Economy 9 (1997) 293-313
economy, particularly given the lower levels and growth rates of productivity in the service sector.
The objective of this paper is to provide some perspective on this issue by examining long-term trends in the sectoral composition of the Japanese economy. Employment and output data disaggregated at a broadly defined one-digit sectoral level are used to examine trends in the relative importance of different sectors in the aggregate economy. As in most other major industrialized economies, the share of the manufacturing sector in total employment in Japan has declined steadily over the last two decades. Some- what surprisingly, however, the share of manufacturing output in real GDP has remained stable, reflecting the relatively rapid growth of labor productivity in this sector. Longterm trends in the sectoral shares of nominal output, on the other hand, reveal a picture similar to that portrayed by sectoral employment shares. An examination of sectoral price deflators indicates that the relatively slow growth in the manufacturing price deflator, in large part attributable to a fall in the prices of computers and electronic equipment, accounts for much of this discrepancy. This paper also documents the marked divergence between the manufacturing and service sectors in terms of various measures of productivity.
Changes in the inter-industry relative wage structure are then examined in order to interpret trends in the sectoral composition of employment. A comparison of average compensation levels indicates that the structure of relative wages has not changed significantly over the last two decades, although there are differences in average wage growth across some industries. Many interesting patterns emerge in the empirical results. Wage growth has been relatively high in the service sector in the post-1973 period but average wage levels in this sector are still lower than in manufacturing. This suggests that labor demand, rather than labor supply factors, may have played a more important role in the sectoral reallocation of labor, at least across these two sectors. More formal tests of the sources of labor market fluctuations using vector autoregression models are then presented in an attempt to disentangle the relative importance of labor demand and labor supply factors in explaining changes in the sectoral composition of employment.
This paper then turns to another important issue of more immediate interest - whether there has been an increase in the pace of structural change in the Japanese economy in recent years. This is of particular relevance in the context of the continued trend appreciation of the Japanese yen and anecdotal evidence of the hollowing-out of the Japanese manufacturing sector in recent years. The approach taken in this paper is to construct various measures of inter-sectoral labor reallocation, and to examine if these measures show any signs of an increase in the pace of structural change in recent years. The results indicate that, at the broad level of disaggregation used in this paper, there is no clear evidence of a recent increase in the pace of structural change in Japan.
Section 2 of the paper documents the evolution of sectoral shares in output and employment, and examines differences in productivity growth across industries. Section 3 analyzes changes in absolute and relative sectoral wages in an attempt to understand the changes in sectoral employment shares. Section 4 presents more formal estimates of the sources of labor market fluctuations, both at the aggregate and sectoral levels. Section 5 presents various measures of inter-sectoral labor reallocation that serve as proxies for sectoral shifts in the economy. Section 6 concludes the paper.
E. Prasad/Japan and the World Economy 9 (1997) 293-313 295
2. Sectoral developments in employment, output, and productivity
This section explores trends in the composition of economic activity in Japan by examining developments in employment, and nominal and real output at the sectoral level. In addition, productivity growth in each sector is also examined.l Details of the data sources and the construction of the variables used in the analysis are presented in Appendix A at the end of the paper.
Fig. 1 presents the employment shares of each sector from 1968 to 1994. Among the notable features in the upper panel are the gradual but steady decline in the share of manufacturing sector employment - from a peak of 27 percent in the early 1970s to 23 percent in 1994 - and a sharp decline in the share of agriculture (including forestry and fisheries) in total employment, from about 20 percent in the late 1960s to 6 percent by 1993. Offsetting these declines, as shown in the lower panel, are a marked increase in the share of service sector employment and more gradual increases in trade and finance. 2 The total employment share of the service-related industries - trade, services, and finance - has risen from 37 percent in 1968 to 51 percent in 1994. These secular changes in employment shares are consistent with the notion that the Japanese economy is moving toward becoming a more service-oriented economy.
Fig. 2 shows the share of each sector in aggregate real output. This is a striking picture. It shows that, despite a declining employment share, the output share of the manufacturing sector continued to increase steadily during the last two decades, although at a slower pace than before the early 1970s. Since 1990, the share of manufacturing in the aggregate economy has remained close to 30 percent. This is in contrast to the experience of many other industrialized countries that have experienced steady declines in both the output and employment shares of the manufacturing sector since the early 1970s.
To reconcile this finding with the notion that the importance of the manufacturing sector in the Japanese economy is declining, it is also useful to examine nominal quantities and prices. Fig. 3 plots sectoral shares of aggregate nominal output. This chart shows that there has indeed been a steady decline in the share of the manufacturing sector in nominal output, from a peak of 35 percent in 1970 to 26 percent in 1993. Some of the other patterns are quite similar across Figs. 2 and 3. For instance, the share of agriculture in both aggregate real and nominal output has fallen considerably. On the other hand, despite an increase in the employment and nominal output shares of services, the share of this sector in real output has remained relatively stable around 14 percent since 1960. In nominal terms, however, this sector's share in output has risen steadily since the early 1960s.
Consistent with the different patterns of evolution of the real and nominal output shares, an examination of the price deflator for the manufacturing sector shows a marked and steady relative price decline for this sector. For instance, the manufacturing price deflator grew by only 0.1 percent per annum over the period 1975-1993. In contrast, the annual
~In the rest of this paper, except where otherwise noted, I use the terms 'sector' and 'industry' interchangeably to refer to the broad disaggregation of the economy at the 1-digit SIC level.
2At the 1-digit level of disaggregation, the service sector refers to community, business, and personal services. The utilities sector, which has had a relatively stable employment share of around 0.5 percent, is not shown in this chart.
296
30
E. Prasad/Japan and the World Economy 9 (1997) 293-313
J A P A N
INDUSTRY EMPLOYMENT SHARES 1/ (In percent)
30
30
f
M=nu/ac(uring
4 t
' " ' " ' " ° ' " " " % . . . . . . . . 4 ~ r ~ m l h ~ e
Source: Bank of Japan, Economic Statistics Monthly; Nikkei Telecom; and author's calculations.
1/ Services refers to community, personal, and business services. Trade refers to wholesale and retail trade.
Fig. 3. Industry shares of aggregate nominal output.
2.5
E. Prasad/Japan and the World Economy 9 (1997) 293-313
JAPAN
PRICES AND PRODUCTIVITY IN MANUFACTURING AND SERVICES (In logarithms)
2.5
299
2.0
1.5
1.0
0.5
0.0
-0.5 i 1955
PRICE DEFLATORS
J i I ~ L i , , , , t , J i , , t , , , , , L , , i L J , , , J , , . . . . 1960 1965 1970 1975 1980 1985 1990
2.0
1.5
1.0
0.5
0.0
-0.5
1.5
0.5
0.0
-0.,5
- L O
-1.5
-2.0 ' 1955
A COMPARISON OF ThE MANUFACTURING AND SERVICE SECTORS ,. ........................
1.0
0.5
0.0
-0.5
-1.0
-1.5
1960 1965 1970 1975 1980 19~5 1990
N o t e s : The variables in the second panel are constructed as levels of the relevant variables in manufactur ing minus the levels of the corresponding variabJes in the services sector. All variables are normalized to zero in the in i t ia l period.
Fig. 4. Prices and p roduc t iv i ty in manufac tu r ing and service sectors.
300 E. Prasad/Japan and the World Economy 9 (1997) 293-313
increase in the aggregate price deflator averaged 2.7 percent over the same period. The top panel of Fig. 4 shows a marked divergence between the price deflators for manufacturing and the aggregate economy since the early 1960s. The absolute decline of more than 6 percent since 1986 in the manufacturing price deflator appears to be attributable in large part to the sharply falling prices in metals, machinery, and equipment - an industry that includes information processing equipment such as computers. The apparently stable share of the manufacturing sector in the aggregate real output thus appears to be associated with large relative price declines. 3
The lower panel of Fig. 4 shows a measure of relative prices across the manufacturing and service sectors, which may be considered prototypical traded goods and non-traded goods sectors, respectively. It is clear that relative prices of traded goods versus non-traded goods have been falling steadily in Japan since the early 1960s. This phenomenon has obvious implications for trend movements in the real exchange rate. Another way of approaching the issue is to examine productivity growth in the traded and non-traded goods sectors. The lower panel of Fig. 4 also contains a plot of average labor productivity in manufacturing relative to that in services. This measure of relative productivity has shown a steady upward trend since 1960, indicating the importance of the Balassa-Samuelson effect for explaining the trend appreciation of the Japanese real exchange rate since that period. 4 An examination of total factor productivity (TFP) measures also shows that productivity in manufacturing has continued to increase relative to productivity in services since 1970.
Table 1 provides a more detailed tabulation of sectoral productivity growth in the Japanese economy. The numbers in the first panel show that labor productivity growth in virtually all sectors of the economy has moderated since 1974. The only exception is the utilities sector which had the lowest growth rate of productivity before 1974 and, interestingly enough, has had the highest productivity growth rate since then among all industries. Annual productivity growth in the manufacturing sector has averaged only 3.8 percent since 1974, well below the average of 9.7 percent over the period 1956-1973. Further, the trade and service sectors, which have witnessed rapid employment growth in recent years, have had much lower rates of productivity growth than manufacturing.
The second panel of Table 1 presents growth rates of a measure of total factor productivity constructed by the OECD. These data were available starting only in 1970 and for only seven of 10 sectors. Since 1974, TFP growth has been negative in agriculture, construction, and service sectors, and close to zero in finance. The manufacturing sector has had the most robust growth in TFP since 1974, averaging 2.5 percent per annum, followed by trade with 2.0 percent per annum.
31n part, this could reflect index number problems in the measurement of the real output of computers, electronics, and machinery.
4"I'he Balassa-Samuelson effect implies that if the differential between productivity growth in the traded goods and non-traded goods sectors is positive and higher in the home country in relation to its major trading partners, then the domestic real exchange rate will tend to appreciate. Among others, Hsieh (1982), Marston (1987), Faruqee (1995), and Chadha (1995) examine relative labor productivity growth, and find that a substantial fraction of the trend real appreciation of the Japanese yen can be attributed to the Balassa-Samuelson effect.
Tab
le 1
M
easu
res
of
sect
oral
prod
ucti
vity
and
com
pens
atio
n in
Jap
an:A
vera
ge a
nnua
l gr
owth
rat
es
Lab
or p
rodu
ctiv
ity
Tot
al f
acto
r pr
oduc
tivi
ty
Rea
l co
mpe
nsat
ion
1956
-199
3 19
56-1
973
1974
-199
3 19
71-1
993
1974
-199
3 19
59-1
993
1959
-197
3 19
74-1
993
Agg
rega
te e
cono
my
4.6
7.3
2.5
--
--
5.5
9.3
2.3
e,
Agr
icul
ture
3.
9 5.
9 2.
3 0.
2 -0
.6
6.3
10.5
3.
0 C
onst
ruct
ion
2.9
5.4
0.6
- 1.
0 -0
.7
4.8
7.6
2.0
t~
Fin
ance
4.
0 10
.4
2.4
0.3
-0.1
2.
9 6.
3 2.
1 M
anuf
actu
ring
6.
2 9.
7 3.
8 2.
8 2.
5 4.
4 7.
5 1.
9 :~
M
inin
g 8.
6 14
.5
3.7
3.8
4.6
2.7
Publ
ic a
dmin
istr
atio
n 1.
8 2.
3 1.
5 4.
7 8.
0 2.
3 ~
- S
ervi
ces
2.3
4.1
0.7
-2.2
-2
.3
6.2
9.7
3.1
Tra
de
4.7
9.4
3.2
2.4
2.0
3.9
9.7
2.1
Tra
nspo
rt a
nd c
omm
unic
atio
ns
2.7
5.1
2.1
0.5
0.9
2.8
7.6
1.6
Util
ities
3.
7 1.
8 4.
2 --
--
3.
9 7.
8 3.
0 '~
Sour
ces:
Mon
thly
Lab
or S
tatis
tics,
N
ikke
i T
elec
om,
OE
CD
Sec
tora
l D
atab
ase,
and
aut
hor'
s ca
lcul
atio
ns.
Not
es:
Lab
or p
rodu
ctiv
ity
is d
efin
ed a
s re
al o
utpu
t per
em
ploy
ee.
Ave
rage
com
pens
atio
n is
cal
cula
ted
as t
otal
com
pens
atio
n fo
r ea
ch s
ecto
r di
vide
d by
tot
al e
mpl
oym
ent
"~
in t
hat
sect
or a
nd d
efla
ted
by t
he a
ggre
gate
CP
I. D
ue t
o da
te l
imit
atio
ns,
labo
r pr
oduc
tivi
ty a
nd c
ompe
nsat
ion
mea
sure
s co
uld
only
be
cons
truc
ted
star
ting
fro
m m
id-
1960
s fo
r fo
ur s
ecto
rs:
fina
nce,
tra
de,
tran
spor
t and
com
mun
icat
ions
, and
util
ities
. T
FP
dat
a w
ere
obta
ined
dir
ectl
y fr
om th
e O
EC
D s
ecto
ral
data
base
and
wer
e av
aila
ble
only
fro
m 1
970.
302 E. Prasad/Japan and the World Economy 9 (1997) 293-313
In summary, the productivity slowdown starting in the early 1970s has affected virtually all sectors of the economy. Sharp differences in relative productivity growth between the manufacturing and service sectors have endured since the 1960s. Although the continued increase in the productivity differential between the manufacturing and service sectors is open to question, there is no evidence as yet to indicate a narrowing of this differential. The changing sectoral composition of employment in the Japanese economy away from high productivity growth sectors such as manufacturing toward low productivity growth sectors such as service sectors could affect aggregate labor productivity growth in the future. However, quantifying the effects of these factors on the prospects for medium-term potential output growth is difficult, particularly since labor productivity growth rates could in large part be endogenously determined along with sectoral employment growth rates. 5
Although many of the trends in sectoral output and employment shares are similar to those in other industrialized countries, it is useful to examine the proximate causes of the changes in the sectoral composition of employment. In order to do this, I now turn to an exploration of the inter-industry wage structure.
3. The inter-industry wage structure
In this section, I examine trends in industry real wages and relate them to the evolution of industry employment shares in order to understand if long-term trends in these shares are driven by demand or supply factors. Apart from being interesting from an analytical point of view, this issue has implications for interpreting structural change, and for determining the appropriate policy responses.
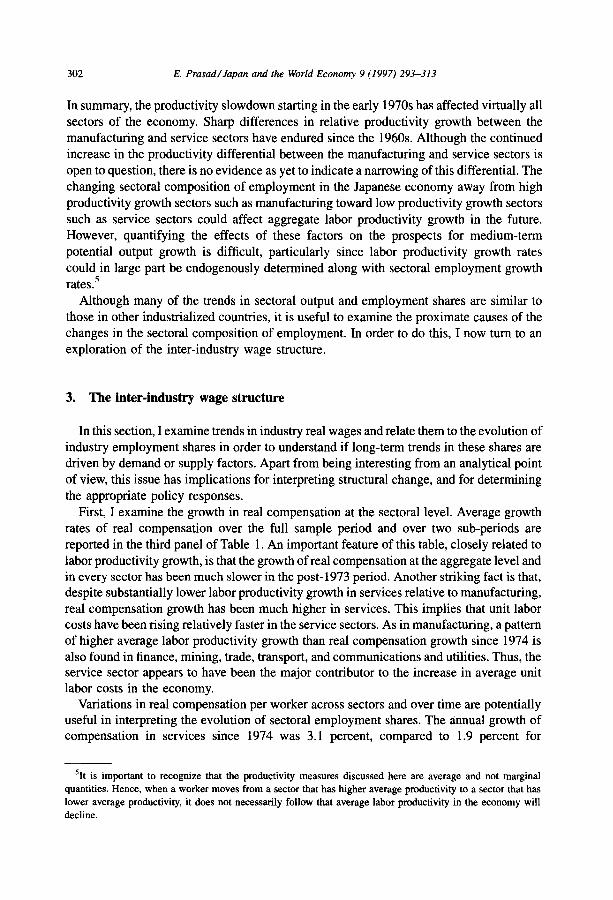
First, I examine the growth in real compensation at the sectoral level. Average growth rates of real compensation over the full sample period and over two sub-periods are reported in the third panel of Table 1. An important feature of this table, closely related to labor productivity growth, is that the growth of real compensation at the aggregate level and in every sector has been much slower in the post-1973 period. Another striking fact is that, despite substantially lower labor productivity growth in services relative to manufacturing, real compensation growth has been much higher in services. This implies that unit labor costs have been rising relatively faster in the service sectors. As in manufacturing, a pattern of higher average labor productivity growth than real compensation growth since 1974 is also found in finance, mining, trade, transport, and communications and utilities. Thus, the service sector appears to have been the major contributor to the increase in average unit labor costs in the economy.
Variations in real compensation per worker across sectors and over time are potentially useful in interpreting the evolution of sectoral employment shares. The annual growth of compensation in services since 1974 was 3.1 percent, compared to 1.9 percent for
5It is important to recognize that the productivity measures discussed here are average and not marginal quantities. Hence, when a worker moves from a sector that has higher average productivity to a sector that has lower average productivity, it does not necessarily follow that average labor productivity in the economy will decline.
E. Prasad/Japan and the World Economy 9 (1997) 293-313 303
manufacturing, and relative to an aggregate average of 2.3 percent. Thus, for these two important sectors - manufacturing and services - the positive relationship between relative wage growth and changes in employment shares suggests that labor demand factors could explain a major fraction of inter-sectoral labor flows over the last two decades.
However, in trying to explain changes in the sectoral composition of employment, it is not just growth rates but relative levels of sectoral wages that are important. For instance, high wage growth in one sector relative to another may not necessarily be sufficient to induce large inter-sectoral labor flows if the first sector had a much lower level of relative wages. To compare wage levels across industries, I construct a measure of relative wages that is defined as follows:
log rel wit = log W i t - - log wt (1)
where log wit is the logarithm of real compensation in industry i at time t, and log wt is the logarithm of average real compensation in the aggregate economy at time t. This measure of inter-industry relative wages is plotted in Fig. 5.
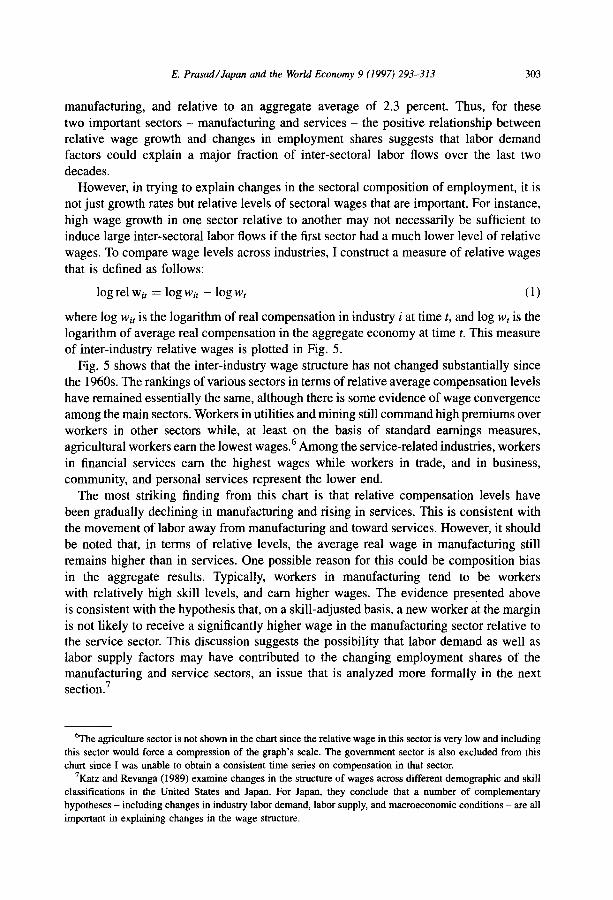
Fig. 5 shows that the inter-industry wage structure has not changed substantially since the 1960s. The rankings of various sectors in terms of relative average compensation levels have remained essentially the same, although there is some evidence of wage convergence among the main sectors. Workers in utilities and mining still command high premiums over workers in other sectors while, at least on the basis of standard earnings measures, agricultural workers earn the lowest wages. 6 Among the service-related industries, workers in financial services earn the highest wages while workers in trade, and in business, community, and personal services represent the lower end.
The most striking finding from this chart is that relative compensation levels have been gradually declining in manufacturing and rising in services. This is consistent with the movement of labor away from manufacturing and toward services. However, it should be noted that, in terms of relative levels, the average real wage in manufacturing still remains higher than in services. One possible reason for this could be composition bias in the aggregate results. Typically, workers in manufacturing tend to be workers with relatively high skill levels, and earn higher wages. The evidence presented above is consistent with the hypothesis that, on a skill-adjusted basis, a new worker at the margin is not likely to receive a significantly higher wage in the manufacturing sector relative to the service sector. This discussion suggests the possibility that labor demand as well as labor supply factors may have contributed to the changing employment shares of the manufacturing and service sectors, an issue that is analyzed more formally in the next section. 7
6The agriculture sector is not shown in the chart since the relative wage in this sector is very low and including this sector would force a compression of the graph's scale. The government sector is also excluded from this chart since I was unable to obtain a consistent time series on compensation in that sector.
7Katz and Revanga (1989) examine changes in the structure of wages across different demographic and skill classifications in the United States and Japan. For Japan, they conclude that a number of complementary hypotheses - including changes in industry labor demand, labor supply, and macroeconomic conditions - are all important in explaining changes in the wage structure.
304
1.2
E, Prasad/Japan and the World Economy 9 (1997) 293-313
JAPAN
RELATIVE AVERAGE COMPENSATION LEVELS 1/ ( in l o g a r i t h m s )
, , i | ~.12i i i i j.9~,61 . . . . . . . . . . . | ~ . . . . 1970 1914 19'79 19BO 1962 1964 19a6 1990 1992
Sources: Monthly Labor Statistics; Nikkel Telecom; and author's calculat ions.
1/ Derived by dividing tota l compensation in each industry by to ta l employment In tha t industry, and expr~sing ors deviations from average compensation for the aggregate economy.
Fig. 5. Relative average compensation levels,
-0.8
E. Prasad/Japan and the World Economy 9 (1997) 293-313 305
4. Some evidence on the sources of sectoral fluctuations
Having examined a few descriptive measures of the inter-industry wage structure, I now turn to a more formal test of the relationship between the growth rates of wages and employment at the sectoral level. The methodology I adopt is to estimate vector auto- regressions (VARs) for wages and employment, and use the correlations between the VAR innovations to derive implications about the sources of fluctuations in these variables. Although this exercise can only provide information about the sources of relatively short- term fluctuations, it is still of interest to investigate if these are dominated by shocks to labor demand or labor supply.
One important issue in the estimation is the effect of changes in labor productivity on employment and wages. One approach to address this would be to use real wages net of labor productivity in the VARs. However, this complicates the identification of labor supply and demand shocks, a Hence, the approach adopted here is to estimate trivariate vector autoregressions that include labor productivity growth, and allow for lagged productivity effects in both the wage and employment equations. Standard Dickey-Fuller and Augmented Dickey-Fuller regressions indicated that employment, real wages, and labor productivity were non-stationary in levels but stationary in first differences in all sectors. Hence, for each sector, I estimate trivariate VARs of the form
Awt =A(L) ImWt_l --~ / e2 t / , var(£) = J'2 (2) Apt L Apt-1 L eat I
where Ae represents employment growth, Aw is the growth in average real wages, Ap the labor productivity growth, t the time index, and A(L) is a 3 x 3 lag polynomial. These unconstrained VARs were estimated with one lag and a constant term, separately for the aggregate economy and for each sector. 9
Table 2 reports the correlations between the innovations of the wage and employment growth equations from the estimated VARs. A positive correlation between the innovations would be consistent with the notion that employment growth fluctuations were determined by fluctuations in labor demand. Intuitively, an unanticipated positive shock to labor demand would tend to raise wages and employment simultaneously, generating a positive correlation between the innovations in these two variables. A negative correlation would indicate a predominance of factors related to labor supply.
The first column of this table shows that, for the aggregate economy, innovations to employment growth and wage growth have essentially a zero correlation over the full sample, suggesting that neither demand nor supply shocks dominate aggregate labor market fluctuations. At the industry level, the results are mixed. The correlations are
8Consider, for instance, an increase in labor productivity that shifts out the labor demand curve. If, as is likely, the contemporaneous increase in real wages does not match the increase in labor productivity, then the real wage net of labor productivity would in fact decline, implying a negative correlation between the employment and wage innovations. These shocks would then be difficult to distinguish from labor supply shocks, that also imply a negative correlation between the employment and wage innovations.
9Since the data are annual and the number of data points is not large, only one lag was used in the VAR to conserve degrees of freedom. Using two lags did not affect the results significantly.
306 E. Prasad/Japan and the World Economy 9 (1997) 293-313
Table 2 Correlations of innovations to employment and wage growth
Absolute growth rates in VAR Relative growth rates in VAR
Notes: The numbers reported above are contemporaneous correlations of innovations from the employment and wage growth regressions from unrestricted trivariate vector autoregressions estimated with one lag. The first panel reports results using absolute measures of employment, wage, and productivity growth. The second panel reports results using relative measures of these variables (i.e. deviations from aggregate growth rates). * Indicates statistical significance at the 5 percent level, using approximate standard errors computed under the null hypothesis that the true correlation coefficient is zero.
significantly negative in finance, mining, government, and utilities. The correlations are
also negative in all other industries except services and trade, where the correlations are
positive but not statistically significant. The generally small correlations between the
employment and wage growth innovations indicate that labor supply and demand factors
have roughly balanced each other in determining employment and wage variation in a majority of the sectors.
The VARs were then re-estimated after restricting the sample to the post-1973 period.
The second column of Table 2, which reports the correlations for this subsample, indicates that most of the results remain unchanged except for two striking differences. In manufacturing and transportation, the wage and employment growth innovations now
become strongly negatively correlated, indicating the relatively larger role of labor supply factors in these sectors since 1974. This may appear to be a surprising result in that, a priori,
anecdotal evidence would seem to indicate that labor demand has been the key determinant of employment variation in manufacturing. However, it should be noted that labor productivity growth in this sector has risen concomitantly with a decline in relative employment, leading to this result.
The sectoral results reported above include the effects of aggregate as well as sector- specific shocks on sectoral labor market fluctuations. An obvious question at this juncture is the relative importance of sector-specific labor demand and labor supply shocks. In order to abstract from the effects of aggregate fluctuations, the VARs were re-estimated using relative sectoral measures of employment, wage, and productivity growth, where these relative measures were defined as deviations from aggregate employment, wage, and productivity growth, respectively. The results are reported in the second panel of Table 2. In the full sample, the major differences compared to the first panel are in agriculture,
E. Prasad/Japan and the World Economy 9 (1997) 293-313 307
construction, and manufacturing, where the correlations using the relative measures turn significantly negative. For the post-1973 sample, the main differences compared to the second column of the first panel are in manufacturing, where the correlations become less negative and insignificant, and in agriculture and trade, where the correlations become significantly negative using the relative measures. Although there are a few additional differences in magnitude, the remaining correlations are all quite similar to those obtained using the absolute employment, wage, and productivity growth measures. Overall, the results using the relative sectoral measures reveal a more important role for sector-specific labor supply shocks relative to sector-specific labor demand shocks.
Thus, although labor demand and labor supply factors appear to roughly balance each other in determining labor market fluctuations at the aggregate level and in many sectors, labor supply factors appear to play a more important role in a number of sectors. This suggests that any analysis of structural change that examined only the derived demand for labor based on measures of industry output would neglect a major determinant of inter- sectoral labor flows. The apparent importance of labor supply factors also indicates the need for a more disaggregated analysis of the inter-industry wage structure and other determinants of relative labor supply across industries.
5. Measures of labor reallocation
Although there are clearly important secular changes underway in the Japanese economy, it is also of interest to examine whether recent macroeconomic conditions, including the recession in the early 1990s, have increased the pace of structural change, lo One formal way to investigate whether there have been recent substantial shifts in the structure of the Japanese economy is to examine net inter-sectoral flows of labor. The earlier sections of this paper examined evidence on long-term labor flows by looking at employment shares. In this section, I examine sectoral labor reallocation over different time horizons.
A simple statistical measure that captures this phenomenon without examining actual data on labor flows was developed by Lilien (1982, 1990), who uses the following measure of the dispersion of employment growth rates across sectors:
O" t
where xit is employment in sector i at time t, Xt is aggregate employment at time t, and the operator A represents the growth rate of a variable. Each industry's weight was divided by the variance over time of that industry's employment growth rate in order to adjust for the effects of different cyclical sensitivities of employment growth rates across industries. Note that this measure captures only net rather than gross flows of labor across sectors. Typically, this measure of employment growth dispersion tends to rise during periods of
1°It is plausible, in fact, that an increase in the pace of structural change could be one of the reasons why the recent recovery in Japan has gathered momentum rather slowly.
308 E. Prasad/Japan and the World Economy 9 (1997) 293-313
major structural change and also during recessions, when there are increases in net flows of labor across sectors) 1 Since annual data are used here in constructing this variable, some of the higher frequency movements in employment growth dispersion that are related to the business cycle rather than longer-term structural change are smoothed over in this analysis.
The upper panel of Fig. 6 shows that this measure of employment growth dispersion has been relatively low over the last few years and well below its peak in the early 1970s when the economy was clearly undergoing considerable structural change. Thus, at first glance, there is little evidence of an increase in the pace of structural change in the Japanese economy at this broad level of disaggregation.
However, Davis (1987) has argued that Lilien's measure of the sectoral dispersion of employment growth rates may be inadequate for capturing longer-term flows of labor. In particular, sectoral or aggregate shocks that lead to labor flows in one direction could be reversed by a subsequent shock. Thus, Lilien's measure would tend to be dominated by short-term labor flows rather than longer-term labor reallocation. Davis constructed the following labor reallocation measure that attempts to measure whether net inter-sectoral flows of labor in one period are reinforced or reversed by subsequent flows of labor:
where Aj represents the percentage change in a variable over j periods. Relatively large (small) values for ~d indicate that the time t direction of labor reallocation reinforces (reverses) the time t - 1 reallocation over the preceding j-period horizon. This measure is designed to examine whether, over different time horizons, labor flows are consistent with patterns of structural change in the economy, where structural change is to be interpreted as reflecting changes in the 1-digit sectoral composition of total employment.
The labor reallocation measure, computed withj equal to 2, 4, and 8 is displayed in the lower panel of Fig. 6. Although all these measures of labor reallocation do show a gradual increase since 1985 and a sharper increase during the recent recession, they are well below the levels reached in the mid-1970s. In other words, all the measures of employment growth dispersion and labor reallocation studied above paint a similar picture of an economy that is undergoing structural change but at a modest rate that is fairly typical by historical standards.
It is possible, however, that results obtained from the broad one-digit level of disag- gregation used in this paper could mask more substantial structural change at finer levels of disaggregation. For instance, Davis and Haltiwanger (1990) find that in the United States there is a substantial dispersion in employment growth rates at the establishment level, even within narrowly defined sectors, and argue that these implied labor flows have a highly cyclical component. Blanchard and Diamond (1989), on the other hand, argue that
nGross flows of labor across sectors generally dominate net flows in terms of magnitudes. In recessions and periods of major structural change, however, the ratio of net flows to gross flows tends to rise. Lilien (1982, 1990) has argued that a significant fraction of cyclical unemployment in the United States is attributable to such sectoral shifts. The empirical validity of this hypothesis is not important for the purposes of the analysis in this paper.
0.0020
E. Prasad/Japan and theWo~dEconomy 9(1997) 293-313
JAPAN
MEASURES OF LABOR REALLOCATION
0.0020
309
0.0015
0 .0010
0.0005
O.O000 1970~
0.0060
l DISPERSION OF SECTORAL EMPLOYMENT GROWTH
0.0015
0.00 !0
0.0005
i i i I i 4
1978 1990 1002 t1994
0.0060
0.0050
0.0040
0.0030
0.0020
0.00 tO
o.oooo ,~,o'
LABOR REALLOCATION MEASURES
i 0.0050
i ./---4 i 0.0040
/
i ./ = a ] o.oo3o
• 0.0020
. / ....... "',, ........... - - . .... o oolo
1974 119'78 I 119781 'lOB4 I 1988 1002 1994
Source: Monthly Labor Statistics and author's calculations.
Note: The employment growth dispersion and labor reallocation measures in this figure ore computed using employment growJh at the one-diglt sectoral level.
Fig. 6. Measures of labor reallocation.
310 E. Prasad/Japan and the World Economy 9 (1997) 293-313
JAPAN
MEASURES OF LABOR REALLOCATION WITHIN THE MANUFACTURING SECTOR
0.I0 0,10
0.08
0.06
0.04
0.02
0.00
,-0.02
--O.04
i -0.06 1970
0.0015
",, :' ,
,; ,,,,,'" /
,/Anrm~[ £mpto~a~t growth "..;" in manulaehtring ( tota 0
\;
' 19T'd I J1974' 1976' '1978 t '1980 I '1982 I '19841 J19~ ' 1992 j 11986. '1996.
0.08
0.06
0.04
0.02
O.OO
-0.02
-0.04
'1994 -0.06
0.0015
O.OOlO
0.0005
0 . ~
-0.0005
LABOR REALLOCATION MEASURES
J = 4
/ • /
) = 8
0.0010
0.0005
0.0000
-0.0005
I i I i I t I J L i i J I I J I t ~ t i i i l g l } ~ I -0.0010 -0.0010 1970 1972 1974 1976 19"/8 1980 1982 1984 1986 1988 1990 1994
Sources: OqCD Analytical Database and author's calculations.
Note: The employment growth dispersion and labor reollacatlon measures in this figure are computed using fwa-dlgTt industry employment data within the manufacturing sector
Fig. 7. Measures of labor reallocation within the manufacturing sector.
E. Prasad/Japan and the World Economy 9 (1997) 293-313 311
sectoral shocks explain very little of the time series variation in either job vacancies or unemployment in the United States.
To investigate this further, I examine labor reallocation measures at a finer level of disaggregation using two-digit industry employment data within the manufacturing sector in Japan) 2 The upper panel of Fig. 7 shows Lilien's measure of the dispersion of employment growth across industries in the manufacturing sector. This measure peaked around 1980 and has remained quite low since then relative to its average level in the 1970s. There is a negative correlation of -0.27 between this measure and total employment growth in manufacturing, which is similar to the finding of countercyclical variation of Davis and Haltiwanger (1990) in net labor flows in the United States. The labor reallocation measure described in Eq. (4) was also computed over different time horizons using the two-digit manufacturing sector data. These measures, shown in the lower panel of Fig. 7, confirm that labor reallocation within the manufacturing sector has been relatively subdued since 1991.
In summary, although there are distinct trends in the employment and output shares of different sectors, there is no strong evidence of a recent substantial increase in the pace of structural change in the Japanese economy. However, it should be recognized that at even finer levels of disaggregation than those used in this paper, the evidence for structural change could be stronger.
6. Conclusions
This paper has examined long-term trends in the sectoral composition of employment and output in the Japanese economy. Based on the evolution of sectoral employment shares, the economy appears to be gradually decreasing its manufacturing base and moving toward becoming a more service-oriented economy. However, although recent develop- ments such as increases in foreign direct investment by Japanese companies abroad suggest the possibility of the increased hollowing-out of the Japanese manufacturing sector, the share of the manufacturing sector in aggregate real output has remained stable. But the share of this sector in nominal output has fallen steadily, similar to the decline in its employment share. Growth in labor productivity and total factor productivity have been strongest in the manufacturing sector and the divergence of these measures relative to the corresponding productivity measures for the service sector has not abated in recent years.
The inter-industry wage structure has remained surprisingly stable over the last two decades, although there has been a gradual convergence of relative wages among important sectors such as manufacturing and service. Simple econometric tests indicated that factors related to both labor supply and labor demand are important in explaining labor market fluctuations at the broad level of disaggregation used in this paper.
This paper has documented, using a number of different criteria and different levels of disaggregation, that the Japanese economy has undergone gradual but substantial structural
~2The eight two-digit industries included in the analysis are: food, beverages, and tobacco; textiles; paper, printing, and publishing; chemicals; non-metallic minerals; basic metals; machinery and equipment; and other manufacturing. No data were available for the wood and wood products industry.
312 E. Prasad/Japan and the World Economy 9 (1997) 293-313
change over the last two decades. The analysis of inter-sectoral labor flows using employment growth dispersion and labor reallocation measures did not reveal any clear evidence of a recent increase in the pace of structural change as measured by sustained net flows of labor across sectors. The results presented in this paper set the stage for a more ambitious disaggregated analysis of inter-sectoral labor flows as well as the inter-sectoral structure of wages. Understanding the sources and effects of structural change and preparing the appropriate policy responses could be crucial for Japan's long-term eco- nomic growth.
Acknowledgements
I would like to thank Tamim Bayoumi, Hamid Faruqee, Guy Meredith and two anonymous referees for helpful comments, and Jeffery Gable, Youkyong Kwon, and Susanna Mursula for research assistance. The views expressed in this paper do not necessarily reflect those of the IMF and its staff.
Appendix A
This appendix provides details about the data set, and describes the construction of the variables used in the paper. All data series for 1-digit industries were obtained from the database compiled by Nikkei Telecom. The original sources for some of the data are noted below. Many of the important series such as industry output were available only at an annual frequency, thereby constraining the use of higher frequency data in the analysis. For those data series that were available at a higher frequency, annual averages were taken. Hence, the issue of deseasonalizing the raw data did not arise.
The 1-digit sectoral employment data were drawn from the Monthly Report on the Labor Force Survey and were originally obtained in monthly, seasonally unadjusted form. A more appropriate measure of labor input would be hours worked, but this variable was available at the industry level only for recent years. In any case, since this paper focuses on long-term issues, most of the variation in total hours at lower frequencies is likely to be driven by variation in employment rather than average hours. Employment data could not be obtained on a consistent basis for the real estate sector which was, therefore, dropped from most of the analysis. Data on employment in 2-digit industries within the manu- facturing sector were drawn from the OECD database maintained by WEFA. The wood and wood products industry was excluded since employment data were not available for this industry.
Real GDP in each industry was used as a measure of industry output. Output data were obtained from the Annual Report on National Accounts. Labor productivity was defined as output per worker. For constructing the real wage series, total compensation in each industry was divided by total employment in that industry and deflated by the aggregate CPI. Total earnings measures were available only since 1973 for most industries, thereby limiting the use of this alternative measure. Total factor productivity data were obtained from the OECD sectoral database and were available starting only in 1970.
E. Prasad/Japan and the Worm Economy 9 (1997) 293-313 313
References
Blanchard, O. and E Diamond, 1989, The Beveridge curve, Brookings Papers on Economic Activity, 1 1-60. Chadha, B., 1995, The yen from a long-term perspective, Manuscript, IME Davis, S.J., 1987, Fluctuations in the pace of labor reallocation, Carnegie-Rochester Conference Series on
Public Policy, 27 335-402. Davis, S.J. and J. Haltiwanger, 1990, Gross job creation and destruction: Microeconomic evidence and
macroeconomic implications, NBER Macroeconomics Annual, 123-168. Faruqee, H., 1995, Long-run determinants of the real exchange rate: A stock-flow perspective, IMF Staff Papers,
42 80-107. Hsieh, D.A., 1982, The determination of the real exchange rate: The productivity approach, Journal of
International Economics, 12 355-362. Katz, L.E and A.L. Revanga, 1989, Changes in the structure of wages: The United States vs. Japan, Journal of
the Japanese and International Economies, 3 522-553. Lilien, D.M., 1982, Sectoral shifts and cyclical unemployment, Journal of Political Economy, 90 777-793. Lilien, D.M., 1990, Labor market dispersion and the natural rate of unemployment, Manuscript, University of
California, Irvine, CA. Marston, R., 1987, Real exchange rates and productivity growth in the United States and Japan, in: S.W. Amdt
and J.D. Richardson, eds., Real-financial Linkages among Open Economies (MIT Press, Cambridge, MA) pp.71-96.