Page 1
IDENT/IAFIS Interoperability Report 1/52U.S. Immigration and Customs Enforcement Page 1 of 52
Secure Communities
IDENT/IAFIS InteroperabilityMonthly Statistics through April 30, 2011
Prepared on: May 23, 2011
IDENT/IAFIS Interoperability Statistics Contents
1. Executive Summary 2. Metrics 3. Monthly Transmission Metrics 4. Monthly Outcome Metrics 5. Outcome Metrics by State 6. Outcome Metrics by AOR 7. Outcome Metrics by County 8. Frequently Asked Questions about Data 9. Interoperability Data Definitions
1. Executive Summary IDENT/IAFIS Interoperability produced over 192,000 Alien IDENT matches in the first seven months of FY11 compared to 248,000 Alien IDENT Matches in all of FY10. Since IDENT/IAFIS Interoperability was first activated in Harris County, TX, ICE on October 27, 2008, ICE has removed over 108,000 aliens and over 28,100 criminal aliens convicted of a Level 1 offense that were identified through IDENT/IAFIS Interoperability. Deployment continues to be the primary driver for increased identifications. In the first seven months of FY11, ICE deployed IDENT/IAFIS Interoperability to 595 new jurisdictions for a total of 1253 jurisdictions in 42 states covering 72% of the foreign born non-citizen population. ICE deployed IDENT/IAFIS Interoperability to 110 jurisdictions in April. The goal for the remainder of FY11 is to deploy IDENT/IAFIS Interoperability to an additional 302 jurisdictions for a total of 897 jurisdictions by the end of the Fiscal Year. There were 28,828 Alien IDENT matches in April compared to 30,285 Alien IDENT matches in March. In April, SC observed 7,842 Level 1 matches compared to 6,948 Level 1 matches in March. 6,755 aliens identified through IDENT/IAFIS interoperability were removed from the country in April. Of these, 1,505 removals were aliens convicted of a Level 1 offense.
Page 2
IDENT/IAFIS Interoperability Report 2/52U.S. Immigration and Customs Enforcement Page 2 of 52
2. Metrics
• 7% of all Interoperability transmissions have resulted in an Alien IDENT match since 10/27/2008. • 16% of all Alien IDENT matches have resulted in the identification of an alien charged with or convicted of a Level 1 offense since 10/27/2008. • 84% of all Alien IDENT matches have resulted in the identification of an alien charged with or convicted of a Level 2 or Level 3 offense since 10/27/2008.
FY2009 FY2009 YTD (10/08 - 04/09) FY2010
FY2010 YTD (10/09 - 04/10)
FY2011 YTD (10/10 - 04/11)
Cumulative (10/08 - 04/11)
Submissions Total 828,119 266,959 3,376,753 1,433,568 3,614,227 7,819,099
LESC L1 12,785 3,512 40,216 19,894 32,986 85,987
LESC L2/3 82,879 27,661 207,950 100,951 159,332 450,161 Alien IDENT
Matches* Total 95,664 31,173 248,166 120,845 192,318 536,148
L1 14,321 4,625 35,108 17,749 15,965 65,394
L2 4,783 1,635 14,839 6,793 10,876 30,498
L3 12,838 4,527 27,379 14,740 15,481 55,698
Non-Criminal Immigration Violator
10,193 3,176 33,767 15,212 31,144 75,104
Administratively Arrested or
Booked into ICE Custody**
Total 42,135 13,963 111,093 54,494 73,466 226,694
L1 3,361 850 14,011 6,747 10,784 28,156
L2 1,533 453 6,064 2,894 7,920 15,517
L3 5,835 1,899 16,044 8,823 11,608 33,487
Non-Criminal Immigration Violator
3,753 1,048 13,735 5,693 14,346 31,834
Removals and Returns**
Total 14,482 4,250 49,854 24,157 44,658 108,994
Jurisdictions Deployed 88 48 570 81 595 1253
Total Jurisdictions Scheduled for FY 80 N/A 190 N/A 897 1,167
Alien Pop. Coverage Deployed 31.0% 14.6% 32.8% 16.8% 8.1% 71.9%
* Aliens who are charged with or convicted of a Level 1 or Level2/3 offense as determined by the LESC during the referral include duplicate matches for aliens ** Aliens are classified by level based on conviction information available in EID. L1-3 are level 1-3 convicted criminal aliens. Non-Crim Img Violator is an abbreviation for Non-Criminal Immigration Violators.
Page 3
IDENT/IAFIS Interoperability Report 3/52U.S. Immigration and Customs Enforcement Page 3 of 52
3. Monthly Transmission Metrics
Data source: LESC-IIDS Data Match
Page 4
IDENT/IAFIS Interoperability Report 4/52U.S. Immigration and Customs Enforcement Page 4 of 52
4. Monthly Outcome Metrics
Submissions and IDENT Matches (From October 1, 2010 through April 30, 2011)
Alien IDENT Matches* Administratively Arrested or Booked into ICE Custody** Removals and Returns**
Month Total
Jurisdictions Deployed
Alien Population
Coverage % Submissions LESC L1 LESC L2/3 Total L1 L2 L3
Non-Criminal
Immigration Violator
Total L1 L2 L3
Non-Criminal
Immigration Violator
Total
Oct-10 745 64.38% 479,763 3,961 24,649 28,610 3,231 1,976 2,640 4,243 12,090 1,573 975 1,545 1,630 5,723
Nov-10 792 65.33% 448,199 3,495 22,322 25,817 2,580 1,758 2,378 4,046 10,762 1,471 977 1,582 1,789 5,819
Dec-10 891 66.43% 463,760 3,616 22,279 25,895 2,586 1,663 2,355 3,950 10,554 1,473 1,150 1,664 2,029 6,316
Jan-11 998 67.87% 525,305 3,517 23,495 27,012 2,272 1,680 2,385 4,141 10,478 1,532 1,095 1,652 1,763 6,042
Feb-11 1,067 69.86% 497,052 3,607 22,264 25,871 2,053 1,506 2,075 4,640 10,274 1,507 1,224 1,712 1,925 6,368
Mar-11 1,143 70.96% 606,442 6,948 23,337 30,285 1,992 1,406 2,141 5,293 10,832 1,723 1,341 1,849 2,722 7,635
Apr-11 1,253 71.87% 593,706 7,842 20,986 28,828 1,251 887 1,507 4,831 8,476 1,505 1,158 1,604 2,488 6,755
Total 1,253 71.87% 3,614,227 32,986 159,332 192,318 15,965 10,876 15,481 31,144 73,466 10,784 7,920 11,608 14,346 44,658
* Aliens who are charged with or convicted of a Level 1 or Level2/3 offense as determined by the LESC during the referral include duplicate matches for aliens ** Aliens are classified by level based on conviction information available in EID. L1-3 are level 1-3 convicted criminal aliens. Non-Crim Img Violator is an abbreviation for Non-Criminal Immigration Violators.
Page 5
IDENT/IAFIS Interoperability Report 5/52U.S. Immigration and Customs Enforcement Page 5 of 52
5. Outcome Metrics by State
Interoperability Statistics: U.S. States (From October 27, 2008 through April 30, 2011)
Alien IDENT Matches* Administratively Arrested or Booked into ICE Custody** Removals and Returns**
State Activation
Date Submissions LESC L1 LESC L2/3 Total L1 L2 L3
Non-Criminal
Immigration Violator
Total L1 L2 L3
Non-Criminal
Immigration Violator
Total
AL 4/26/11 1,134 5 7 12 1 0 0 1 2 0 0 0 0 0
AZ 12/23/08 719,567 11,810 49,029 60,839 13,470 4,396 11,934 9,885 39,685 4,096 1,606 5,665 4,239 15,606
AR 8/17/10 39,263 95 683 778 51 18 39 145 253 21 9 19 58 107
CA 5/26/09 1,909,540 32,036 150,197 182,233 28,038 12,733 19,833 30,714 91,318 12,733 6,088 10,929 12,133 41,883
CO 2/15/11 12,793 162 523 685 27 23 42 53 145 8 10 15 15 48
CT 6/29/10 14,708 65 1,053 1,118 22 35 71 135 263 8 14 29 26 77
DE 4/20/10 31,751 47 545 592 33 22 20 55 130 20 13 12 16 61
FL 1/22/09 1,257,630 15,211 80,400 95,611 5,724 2,184 2,824 7,068 17,800 1,418 928 1,602 2,950 6,898
GA 11/17/09 200,211 1,415 13,579 14,994 906 654 1,329 2,028 4,917 444 379 892 955 2,670
HI 4/13/10 31,617 78 1,064 1,142 24 4 14 58 100 1 1 7 21 30
ID 6/3/10 26,170 129 715 844 90 111 51 54 306 33 50 31 15 129
IL 11/24/09 144,746 609 7,712 8,321 294 227 655 1,111 2,287 165 128 318 162 773
IN 4/5/11 988 1 15 16 0 0 0 7 7 0 0 0 1 1
IA 8/31/10 12,014 63 298 361 15 8 29 38 90 6 3 16 10 35
KS 12/21/10 17,629 55 618 673 7 6 22 80 115 1 4 6 28 39
KY 10/5/10 11,409 40 509 549 17 16 47 112 192 7 11 18 43 79
LA 11/17/09 113,763 237 2,345 2,582 96 74 181 805 1,156 42 44 118 373 577
MD 12/22/09 58,807 261 2,286 2,547 121 47 118 429 715 41 21 61 213 336
MA 11/5/08 45,707 519 2,409 2,928 348 50 89 405 892 96 15 54 180 345
MI 10/27/09 213,521 379 2,887 3,266 179 115 177 434 905 59 48 102 203 412
MS 7/20/10 27,602 29 328 357 6 13 47 69 135 2 8 27 42 79
MO 9/21/10 72,768 137 827 964 18 19 38 166 241 10 5 23 60 98
MT 7/27/10 5,703 5 24 29 1 1 0 3 5 1 0 0 0 1
NE 8/17/10 17,868 76 737 813 46 61 70 91 268 13 30 31 28 102
NV 7/13/10 67,238 819 3,921 4,740 250 104 186 985 1,525 106 67 126 452 751
NM 6/24/09 69,000 461 2,275 2,736 171 78 279 423 951 86 57 202 199 544
NY 1/11/11 25,249 198 1,253 1,451 34 25 38 150 247 5 1 6 33 45
NC 11/12/08 331,677 1,432 18,884 20,316 1,144 688 1,465 2,787 6,084 606 452 1,090 1,427 3,575
b6, b7C
Page 6
IDENT/IAFIS Interoperability Report 6/52U.S. Immigration and Customs Enforcement Page 6 of 52
Interoperability Statistics: U.S. States (From October 27, 2008 through April 30, 2011)
Alien IDENT Matches* Administratively Arrested or Booked into ICE Custody** Removals and Returns**
State Activation
Date Submissions LESC L1 LESC L2/3 Total L1 L2 L3
Non-Criminal
Immigration Violator
Total L1 L2 L3
Non-Criminal
Immigration Violator
Total
OH 1/19/10 149,252 244 1,419 1,663 94 84 222 279 679 40 58 162 166 426
OK 11/3/09 80,343 221 2,036 2,257 203 193 240 460 1,096 132 164 195 290 781
OR 4/6/10 55,740 629 2,215 2,844 403 150 218 362 1,133 162 67 134 168 531
PA 12/16/08 180,605 649 7,473 8,122 428 200 438 895 1,961 118 63 184 304 669
RI 3/22/11 3,603 36 133 169 6 1 1 17 25 0 0 0 1 1
SC 9/8/10 68,471 131 1,756 1,887 67 116 305 462 950 33 63 210 275 581
SD 6/22/10 12,713 45 271 316 18 7 9 10 44 4 4 8 5 21
TN 6/17/10 139,285 279 2,899 3,178 168 184 308 548 1,208 107 120 203 190 620
TX 10/27/08 1,238,606 14,586 71,077 85,663 10,744 6,664 12,883 11,584 41,875 6,725 4,464 10,252 5,726 27,167
UT 3/23/10 73,835 661 2,563 3,224 508 275 320 415 1,518 260 163 220 281 924
VA 3/9/09 276,350 1,971 12,481 14,452 1,585 890 1,100 1,670 5,245 533 351 497 506 1,887
WV 10/26/10 9,754 2 38 40 0 0 1 6 7 0 0 1 3 4
WI 1/11/11 49,041 135 611 746 23 7 32 95 157 9 2 14 33 58
WY 1/19/11 1,428 24 66 90 14 15 23 10 62 5 6 8 4 23
Total 10/27/08 7,819,099 85,987 450,161 536,148 65,394 30,498 55,698 75,104 226,694 28,156 15,517 33,487 31,834 108,994
* Aliens who are charged with or convicted of a Level 1 or Level2/3 offense as determined by the LESC during the referral include duplicate matches for aliens ** Aliens are classified by level based on conviction information available in EID. L1-3 are level 1-3 convicted criminal aliens. Non-Crim Img Violator is an abbreviation for Non-Criminal Immigration Violators.
Page 7
IDENT/IAFIS Interoperability Report 7/52U.S. Immigration and Customs Enforcement Page 7 of 52
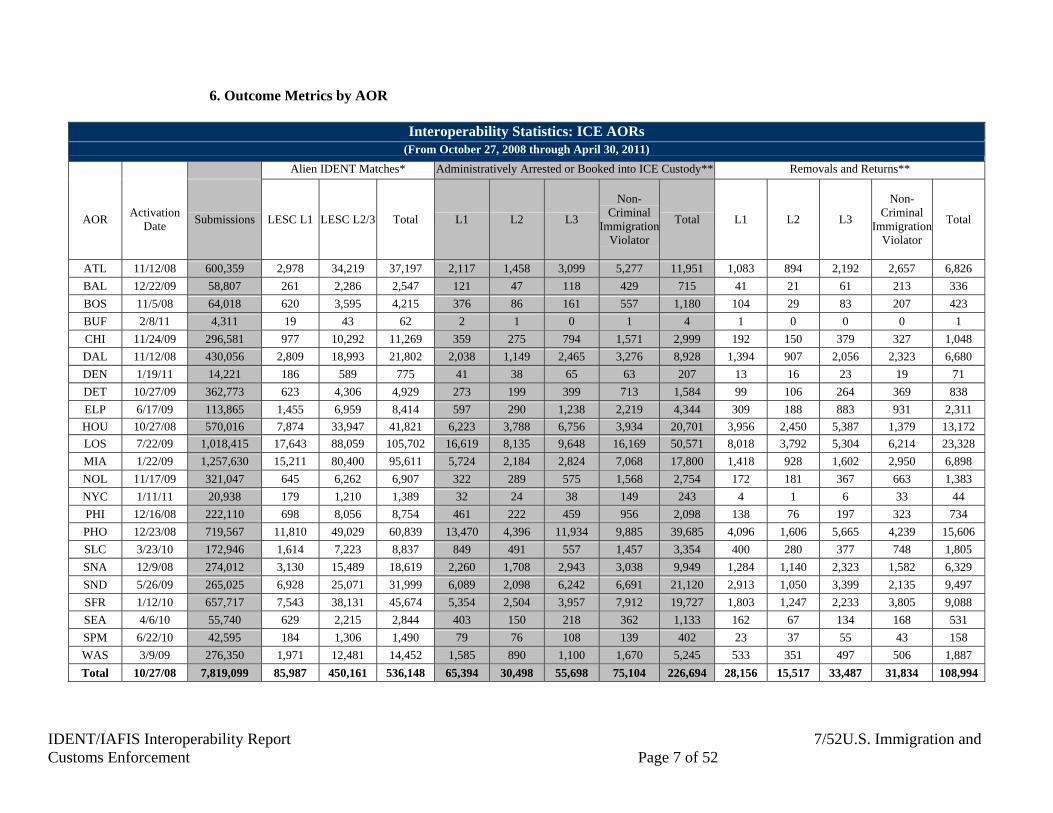
6. Outcome Metrics by AOR
Interoperability Statistics: ICE AORs (From October 27, 2008 through April 30, 2011)
Alien IDENT Matches* Administratively Arrested or Booked into ICE Custody** Removals and Returns**
AOR Activation
Date Submissions LESC L1 LESC L2/3 Total L1 L2 L3
Non-Criminal
Immigration Violator
Total L1 L2 L3
Non-Criminal
Immigration Violator
Total
ATL 11/12/08 600,359 2,978 34,219 37,197 2,117 1,458 3,099 5,277 11,951 1,083 894 2,192 2,657 6,826
BAL 12/22/09 58,807 261 2,286 2,547 121 47 118 429 715 41 21 61 213 336
BOS 11/5/08 64,018 620 3,595 4,215 376 86 161 557 1,180 104 29 83 207 423
BUF 2/8/11 4,311 19 43 62 2 1 0 1 4 1 0 0 0 1
CHI 11/24/09 296,581 977 10,292 11,269 359 275 794 1,571 2,999 192 150 379 327 1,048
DAL 11/12/08 430,056 2,809 18,993 21,802 2,038 1,149 2,465 3,276 8,928 1,394 907 2,056 2,323 6,680
DEN 1/19/11 14,221 186 589 775 41 38 65 63 207 13 16 23 19 71
DET 10/27/09 362,773 623 4,306 4,929 273 199 399 713 1,584 99 106 264 369 838
ELP 6/17/09 113,865 1,455 6,959 8,414 597 290 1,238 2,219 4,344 309 188 883 931 2,311
HOU 10/27/08 570,016 7,874 33,947 41,821 6,223 3,788 6,756 3,934 20,701 3,956 2,450 5,387 1,379 13,172
LOS 7/22/09 1,018,415 17,643 88,059 105,702 16,619 8,135 9,648 16,169 50,571 8,018 3,792 5,304 6,214 23,328
MIA 1/22/09 1,257,630 15,211 80,400 95,611 5,724 2,184 2,824 7,068 17,800 1,418 928 1,602 2,950 6,898
NOL 11/17/09 321,047 645 6,262 6,907 322 289 575 1,568 2,754 172 181 367 663 1,383
NYC 1/11/11 20,938 179 1,210 1,389 32 24 38 149 243 4 1 6 33 44
PHI 12/16/08 222,110 698 8,056 8,754 461 222 459 956 2,098 138 76 197 323 734
PHO 12/23/08 719,567 11,810 49,029 60,839 13,470 4,396 11,934 9,885 39,685 4,096 1,606 5,665 4,239 15,606
SLC 3/23/10 172,946 1,614 7,223 8,837 849 491 557 1,457 3,354 400 280 377 748 1,805
SNA 12/9/08 274,012 3,130 15,489 18,619 2,260 1,708 2,943 3,038 9,949 1,284 1,140 2,323 1,582 6,329
SND 5/26/09 265,025 6,928 25,071 31,999 6,089 2,098 6,242 6,691 21,120 2,913 1,050 3,399 2,135 9,497
SFR 1/12/10 657,717 7,543 38,131 45,674 5,354 2,504 3,957 7,912 19,727 1,803 1,247 2,233 3,805 9,088
SEA 4/6/10 55,740 629 2,215 2,844 403 150 218 362 1,133 162 67 134 168 531
SPM 6/22/10 42,595 184 1,306 1,490 79 76 108 139 402 23 37 55 43 158
WAS 3/9/09 276,350 1,971 12,481 14,452 1,585 890 1,100 1,670 5,245 533 351 497 506 1,887
Total 10/27/08 7,819,099 85,987 450,161 536,148 65,394 30,498 55,698 75,104 226,694 28,156 15,517 33,487 31,834 108,994
Page 8
IDENT/IAFIS Interoperability Report 8/52U.S. Immigration and Customs Enforcement Page 8 of 52
* Aliens who are charged with or convicted of a Level 1 or Level2/3 offense as determined by the LESC during the referral include duplicate matches for aliens ** Aliens are classified by level based on conviction information available in EID. L1-3 are level 1-3 convicted criminal aliens. Non-Crim Img Violator is an abbreviation for Non-Criminal Immigration Violators.
Page 9
IDENT/IAFIS Interoperability Report 9/52U.S. Immigration and Customs Enforcement Page 9 of 52
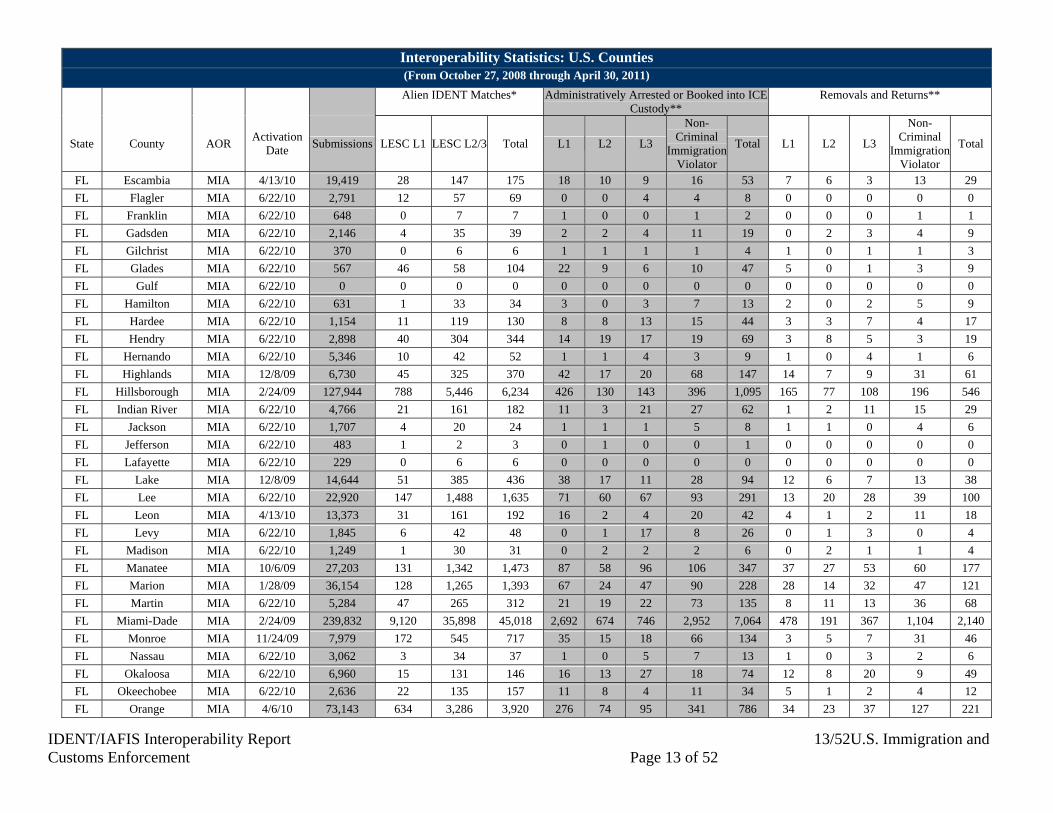
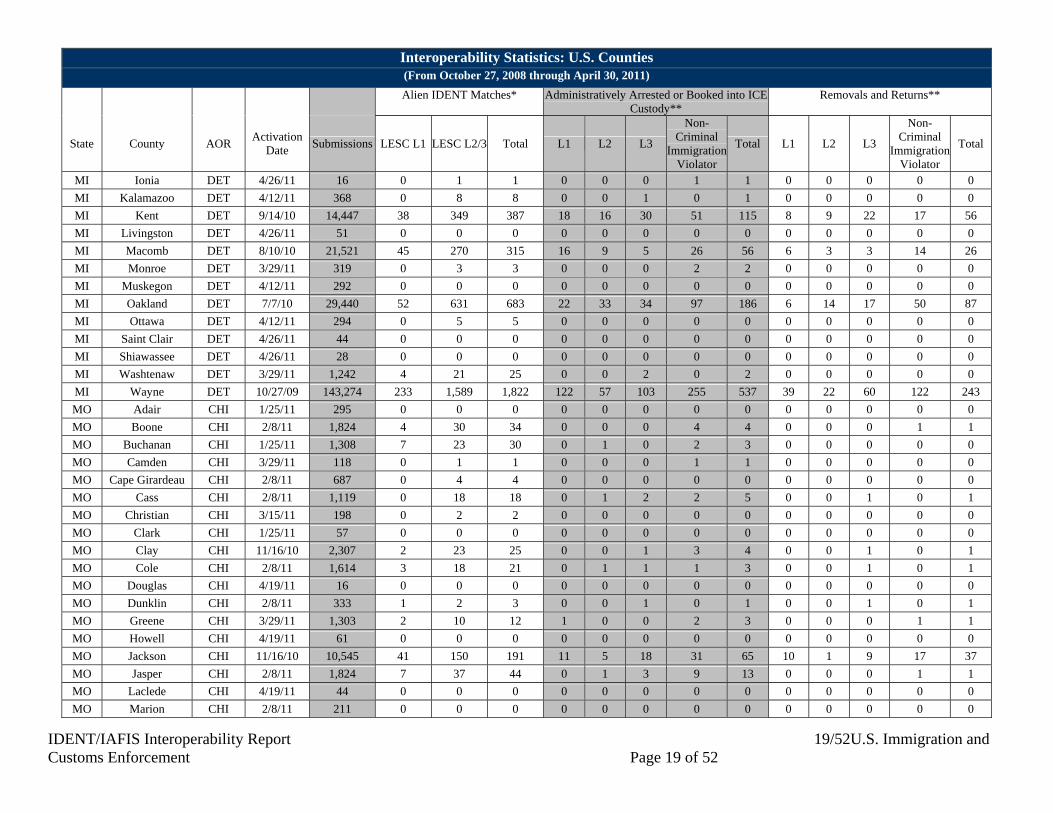
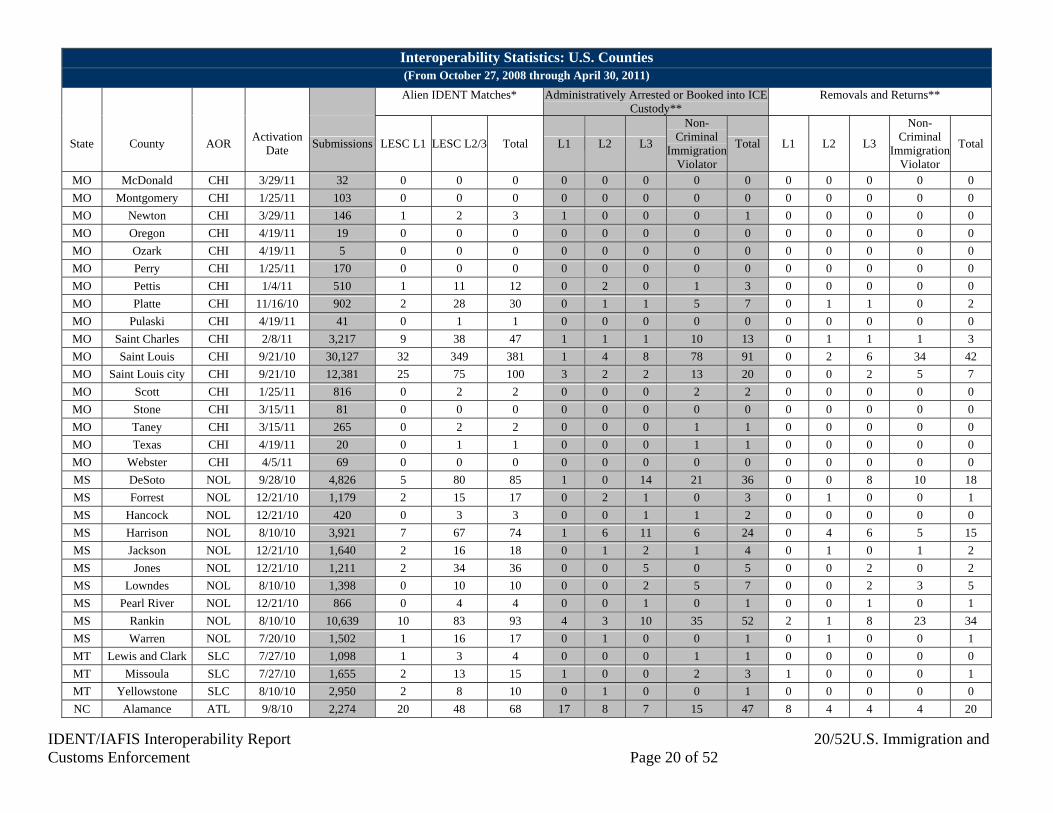
7. Outcome Metrics by County
Interoperability Statistics: U.S. Counties (From October 27, 2008 through April 30, 2011)
Alien IDENT Matches* Administratively Arrested or Booked into ICE Custody**
Removals and Returns**
State County AOR Activation
Date Submissions LESC L1 LESC L2/3 Total L1 L2 L3
Non-Criminal
Immigration Violator
Total L1 L2 L3
Non-Criminal
Immigration Violator
Total
AL Autauga NOL 4/26/11 11 0 0 0 0 0 0 0 0 0 0 0 0 0
AL Baldwin NOL 4/26/11 266 2 3 5 0 0 0 0 0 0 0 0 0 0
AL Blount NOL 4/26/11 10 0 0 0 0 0 0 0 0 0 0 0 0 0
AL Chilton NOL 4/26/11 17 0 0 0 0 0 0 0 0 0 0 0 0 0
AL Elmore NOL 4/26/11 21 0 0 0 0 0 0 0 0 0 0 0 0 0
AL Escambia NOL 4/26/11 5 0 0 0 0 0 0 0 0 0 0 0 0 0
AL Etowah NOL 4/26/11 4 0 0 0 0 0 0 0 0 0 0 0 0 0
AL Jefferson NOL 4/26/11 302 0 2 2 0 0 0 1 1 0 0 0 0 0
AL Lee NOL 4/26/11 15 0 0 0 0 0 0 0 0 0 0 0 0 0
AL Limestone NOL 4/26/11 21 0 1 1 0 0 0 0 0 0 0 0 0 0
AL Marshall NOL 4/26/11 9 0 0 0 0 0 0 0 0 0 0 0 0 0
AL Mobile NOL 4/26/11 246 3 1 4 1 0 0 0 1 0 0 0 0 0
AL Morgan NOL 4/26/11 85 0 0 0 0 0 0 0 0 0 0 0 0 0
AL Tallapoosa NOL 4/26/11 7 0 0 0 0 0 0 0 0 0 0 0 0 0
AL Tuscaloosa NOL 4/26/11 115 0 0 0 0 0 0 0 0 0 0 0 0 0
AR Benton NOL 8/24/10 6,335 19 235 254 19 4 13 61 97 7 2 4 21 34
AR Crawford NOL 12/7/10 1,476 2 18 20 0 0 1 2 3 0 0 0 1 1
AR Garland NOL 12/7/10 2,460 1 31 32 3 1 5 3 12 2 1 4 2 9
AR Jefferson NOL 12/7/10 4,275 17 21 38 1 0 0 0 1 0 0 0 0 0
AR Miller NOL 12/14/10 1,557 1 4 5 0 0 0 2 2 0 0 0 2 2
AR Pulaski NOL 8/17/10 10,187 10 115 125 10 4 4 18 36 5 2 3 11 21
AR Saline NOL 12/7/10 1,187 0 15 15 1 0 3 10 14 0 0 1 8 9
AR Sebastian NOL 12/7/10 2,789 16 60 76 5 5 3 10 23 3 1 2 1 7
AR Union NOL 12/7/10 525 1 6 7 0 0 1 3 4 0 0 0 2 2
AR Washington NOL 8/24/10 6,831 26 167 193 12 4 8 34 58 4 3 4 9 20
AR White NOL 12/7/10 1,641 2 11 13 0 0 1 2 3 0 0 1 1 2
AZ Apache PHO 7/27/10 702 5 5 10 2 2 0 2 6 1 2 0 0 3
Page 10
IDENT/IAFIS Interoperability Report 10/52U.S. Immigration and Customs Enforcement Page 10 of 52
Interoperability Statistics: U.S. Counties (From October 27, 2008 through April 30, 2011)
Alien IDENT Matches* Administratively Arrested or Booked into ICE Custody**
Removals and Returns**
State County AOR Activation
Date Submissions LESC L1 LESC L2/3 Total L1 L2 L3
Non-Criminal
Immigration Violator
Total L1 L2 L3
Non-Criminal
Immigration Violator
Total
AZ Cochise PHO 11/17/09 4,364 59 180 239 46 12 35 44 137 18 8 31 27 84
AZ Coconino PHO 8/10/10 7,382 45 261 306 28 33 67 33 161 18 24 59 27 128
AZ Gila PHO 10/26/10 1,881 7 29 36 1 1 4 5 11 1 1 2 1 5
AZ Graham PHO 10/26/10 622 3 5 8 2 0 2 0 4 1 0 2 0 3
AZ Greenlee PHO 10/26/10 182 0 6 6 0 1 0 2 3 0 0 0 1 1
AZ La Paz PHO 10/26/10 603 1 18 19 0 0 1 1 2 0 0 1 1 2
AZ Maricopa PHO 1/16/09 593,227 10,663 43,765 54,428 12,536 4,039 11,169 8,879 36,623 3,651 1,383 5,087 3,702 13,823
AZ Mohave PHO 7/20/10 6,766 12 78 90 13 3 5 26 47 3 1 2 10 16
AZ Navajo PHO 8/3/10 3,061 16 44 60 6 7 5 8 26 2 3 4 3 12
AZ Pima PHO 11/17/09 49,576 357 1,933 2,290 315 117 255 358 1,045 136 79 173 217 605
AZ Pinal PHO 12/23/08 20,264 294 829 1,123 221 81 161 167 630 146 53 132 92 423
AZ Santa Cruz PHO 11/17/09 1,596 32 205 237 30 11 19 31 91 9 5 13 12 39
AZ Yavapai PHO 1/16/09 10,980 71 471 542 94 31 85 145 355 54 20 73 118 265
AZ Yuma PHO 1/16/09 18,361 245 1,200 1,445 176 58 126 184 544 56 27 86 28 197
CA Alameda SFR 4/20/10 60,363 474 3,775 4,249 382 183 324 559 1,448 154 94 204 316 768
CA Alpine SFR 2/22/11 7 0 0 0 0 0 0 0 0 0 0 0 0 0
CA Amador SFR 2/1/11 269 0 2 2 0 0 0 0 0 0 0 0 0 0
CA Butte SFR 7/27/10 9,665 76 186 262 24 7 13 11 55 6 3 6 4 19
CA Calaveras SFR 2/1/11 208 0 1 1 0 0 0 0 0 0 0 0 0 0
CA Colusa SFR 1/25/11 315 4 39 43 2 4 8 8 22 1 2 5 6 14
CA Contra Costa SFR 4/6/10 49,456 693 3,561 4,254 624 272 524 1,140 2,560 184 83 205 406 878
CA Del Norte SFR 2/22/11 171 1 2 3 0 0 0 0 0 0 0 0 0 0
CA El Dorado SFR 7/27/10 4,790 22 127 149 12 14 19 25 70 6 9 12 12 39
CA Fresno SFR 3/23/10 44,429 601 2,489 3,090 328 108 156 537 1,129 106 65 94 347 612
CA Glenn SFR 2/1/11 210 0 0 0 0 0 0 0 0 0 0 0 0 0
CA Humboldt SFR 8/10/10 5,226 21 84 105 10 2 12 41 65 3 2 5 12 22
CA Imperial SND 9/9/09 16,205 1,256 2,518 3,774 743 256 467 1,187 2,653 526 204 389 226 1,345
CA Inyo SFR 2/1/11 222 0 5 5 0 0 2 1 3 0 0 1 0 1
CA Kern SFR 9/14/10 47,910 1,108 2,211 3,319 390 155 204 461 1,210 85 62 102 232 481
CA Kings SFR 9/14/10 4,835 51 272 323 15 12 15 36 78 6 9 9 15 39
CA Lake SFR 8/10/10 2,574 8 81 89 6 1 6 32 45 3 0 4 16 23
Page 11
IDENT/IAFIS Interoperability Report 11/52U.S. Immigration and Customs Enforcement Page 11 of 52
Interoperability Statistics: U.S. Counties (From October 27, 2008 through April 30, 2011)
Alien IDENT Matches* Administratively Arrested or Booked into ICE Custody**
Removals and Returns**
State County AOR Activation
Date Submissions LESC L1 LESC L2/3 Total L1 L2 L3
Non-Criminal
Immigration Violator
Total L1 L2 L3
Non-Criminal
Immigration Violator
Total
CA Lassen SFR 2/22/11 540 9 4 13 1 0 0 2 3 0 0 0 1 1
CA Los Angeles LOS 8/27/09 631,767 11,586 57,378 68,964 10,728 4,990 5,625 9,179 30,522 5,523 2,407 3,072 3,611 14,613
CA Madera SFR 9/14/10 7,716 60 373 433 38 24 49 73 184 12 16 31 52 111
CA Marin SFR 8/10/10 9,142 119 550 669 97 33 50 156 336 19 16 24 45 104
CA Mendocino SFR 8/10/10 3,960 14 210 224 16 10 11 73 110 7 3 9 40 59
CA Merced SFR 8/10/10 7,589 69 632 701 43 38 83 196 360 25 25 64 137 251
CA Modoc SFR 2/1/11 121 0 1 1 0 0 0 0 0 0 0 0 0 0
CA Mono SFR 12/14/10 259 3 13 16 1 0 0 2 3 0 0 0 2 2
CA Monterey SFR 4/6/10 20,900 196 2,408 2,604 219 104 213 587 1,123 117 65 142 321 645
CA Napa SFR 8/10/10 4,340 39 420 459 19 20 59 136 234 8 14 34 71 127
CA Nevada SFR 1/25/11 1,220 4 21 25 1 0 3 7 11 0 0 3 4 7
CA Orange LOS 3/16/10 119,610 3,551 13,492 17,043 3,737 2,025 1,727 2,856 10,345 1,263 707 677 566 3,213
CA Placer SFR 7/27/10 9,065 46 211 257 32 40 18 25 115 9 13 4 5 31
CA Plumas SFR 1/25/11 170 0 0 0 0 0 0 0 0 0 0 0 0 0
CA Riverside LOS 5/11/10 61,836 714 3,519 4,233 513 237 334 1,056 2,140 270 146 242 481 1,139
CA Sacramento SFR 1/12/10 69,729 1,006 2,972 3,978 794 362 341 664 2,161 272 193 187 319 971
CA San Benito SFR 2/1/11 378 1 26 27 0 0 1 12 13 0 0 1 5 6
CA San Bernardino LOS 4/13/10 101,535 782 5,012 5,794 652 350 576 1,220 2,798 386 215 408 588 1,597
CA San Diego SND 5/26/09 248,820 5,672 22,553 28,225 5,346 1,842 5,775 5,504 18,467 2,387 846 3,010 1,909 8,152
CA San Francisco SFR 6/8/10 23,324 392 1,386 1,778 262 52 193 357 864 61 17 96 128 302
CA San Joaquin SFR 2/16/10 44,859 493 2,232 2,725 364 141 244 429 1,178 142 84 178 306 710
CA San Luis Obispo LOS 1/5/10 17,502 94 726 820 54 37 92 171 354 32 26 50 96 204
CA San Mateo SFR 5/25/10 18,029 219 1,918 2,137 206 128 244 234 812 73 59 128 67 327
CA Santa Barbara LOS 1/5/10 29,078 261 2,702 2,963 270 198 477 500 1,445 177 128 344 254 903
CA Santa Clara SFR 5/4/10 49,791 698 3,882 4,580 587 292 289 436 1,604 203 160 174 171 708
CA Santa Cruz SFR 8/10/10 10,600 69 670 739 51 34 44 150 279 14 18 23 64 119
CA Shasta SFR 7/27/10 8,013 22 72 94 18 1 7 15 41 4 1 4 7 16
CA Sierra SFR 2/22/11 24 0 1 1 0 0 0 0 0 0 0 0 0 0
CA Siskiyou SFR 2/22/11 252 2 5 7 2 0 0 2 4 0 0 0 0 0
CA Solano SFR 1/12/10 20,593 106 731 837 88 46 70 177 381 47 24 40 103 214
CA Sonoma SFR 3/2/10 24,245 180 1,876 2,056 213 141 257 553 1,164 82 84 160 222 548
Page 12
IDENT/IAFIS Interoperability Report 12/52U.S. Immigration and Customs Enforcement Page 12 of 52
Interoperability Statistics: U.S. Counties (From October 27, 2008 through April 30, 2011)
Alien IDENT Matches* Administratively Arrested or Booked into ICE Custody**
Removals and Returns**
State County AOR Activation
Date Submissions LESC L1 LESC L2/3 Total L1 L2 L3
Non-Criminal
Immigration Violator
Total L1 L2 L3
Non-Criminal
Immigration Violator
Total
CA Stanislaus SFR 2/16/10 29,087 317 1,542 1,859 264 134 186 270 854 75 53 99 131 358
CA Sutter SFR 1/25/11 1,049 6 41 47 2 5 5 9 21 0 3 3 5 11
CA Tehama SFR 1/25/11 876 11 48 59 5 6 8 14 33 1 2 5 3 11
CA Trinity SFR 2/22/11 133 0 0 0 0 0 0 0 0 0 0 0 0 0
CA Tulare SFR 7/27/10 19,151 268 1,504 1,772 149 74 178 379 780 61 36 99 195 391
CA Tuolumne SFR 12/14/10 1,171 1 10 11 0 2 2 0 4 0 1 0 0 1
CA Ventura LOS 7/22/09 57,087 655 5,230 5,885 665 298 817 1,187 2,967 367 163 511 618 1,659
CA Yolo SFR 7/27/10 6,864 49 383 432 53 47 76 34 210 12 27 51 9 99
CA Yuba SFR 7/27/10 2,260 7 90 97 12 8 29 11 60 4 3 20 5 32
CO Arapahoe DEN 2/15/11 1,978 18 113 131 7 6 9 15 37 4 3 1 4 12
CO Denver DEN 2/15/11 8,967 135 377 512 19 16 31 36 102 3 7 14 11 35
CO El Paso DEN 2/15/11 1,848 9 33 42 1 1 2 2 6 1 0 0 0 1
CT Fairfield BOS 6/29/10 14,708 65 1,053 1,118 22 35 71 135 263 8 14 29 26 77
DE Kent PHI 4/20/10 10,724 7 49 56 1 0 0 3 4 1 0 0 1 2
DE New Castle PHI 4/20/10 14,269 31 314 345 22 14 12 31 79 12 7 8 8 35
DE Sussex PHI 4/20/10 6,758 9 182 191 10 8 8 21 47 7 6 4 7 24
FL Alachua MIA 6/22/10 13,788 26 153 179 7 8 4 13 32 4 4 4 3 15
FL Baker MIA 6/22/10 835 13 8 21 3 0 0 2 5 0 0 0 2 2
FL Bay MIA 6/22/10 10,733 17 139 156 11 6 7 34 58 7 4 1 22 34
FL Bradford MIA 6/22/10 1,086 0 9 9 0 0 1 0 1 0 0 0 0 0
FL Brevard MIA 10/12/09 34,981 106 1,003 1,109 33 10 23 63 129 8 4 12 22 46
FL Broward MIA 8/25/09 90,693 1,162 7,380 8,542 466 167 186 746 1,565 86 53 98 319 556
FL Calhoun MIA 6/22/10 916 0 7 7 0 2 0 0 2 0 0 0 0 0
FL Charlotte MIA 2/18/09 18,423 62 673 735 48 8 23 25 104 12 4 12 15 43
FL Citrus MIA 6/22/10 4,162 3 16 19 1 0 0 0 1 1 0 0 0 1
FL Clay MIA 2/10/09 16,802 36 1,126 1,162 20 15 47 27 109 10 10 27 13 60
FL Collier MIA 2/24/09 26,476 435 4,423 4,858 425 349 417 520 1,711 202 227 296 229 954
FL Columbia MIA 6/22/10 3,335 14 28 42 4 4 2 8 18 2 2 1 1 6
FL DeSoto MIA 6/22/10 1,904 20 178 198 12 8 15 41 76 3 2 6 13 24
FL Dixie MIA 6/22/10 676 1 5 6 1 0 0 0 1 0 0 0 0 0
FL Duval MIA 1/22/09 100,073 286 3,673 3,959 192 146 301 207 846 69 79 204 91 443
Page 13
IDENT/IAFIS Interoperability Report 13/52U.S. Immigration and Customs Enforcement Page 13 of 52
Interoperability Statistics: U.S. Counties (From October 27, 2008 through April 30, 2011)
Alien IDENT Matches* Administratively Arrested or Booked into ICE Custody**
Removals and Returns**
State County AOR Activation
Date Submissions LESC L1 LESC L2/3 Total L1 L2 L3
Non-Criminal
Immigration Violator
Total L1 L2 L3
Non-Criminal
Immigration Violator
Total
FL Escambia MIA 4/13/10 19,419 28 147 175 18 10 9 16 53 7 6 3 13 29
FL Flagler MIA 6/22/10 2,791 12 57 69 0 0 4 4 8 0 0 0 0 0
FL Franklin MIA 6/22/10 648 0 7 7 1 0 0 1 2 0 0 0 1 1
FL Gadsden MIA 6/22/10 2,146 4 35 39 2 2 4 11 19 0 2 3 4 9
FL Gilchrist MIA 6/22/10 370 0 6 6 1 1 1 1 4 1 0 1 1 3
FL Glades MIA 6/22/10 567 46 58 104 22 9 6 10 47 5 0 1 3 9
FL Gulf MIA 6/22/10 0 0 0 0 0 0 0 0 0 0 0 0 0 0
FL Hamilton MIA 6/22/10 631 1 33 34 3 0 3 7 13 2 0 2 5 9
FL Hardee MIA 6/22/10 1,154 11 119 130 8 8 13 15 44 3 3 7 4 17
FL Hendry MIA 6/22/10 2,898 40 304 344 14 19 17 19 69 3 8 5 3 19
FL Hernando MIA 6/22/10 5,346 10 42 52 1 1 4 3 9 1 0 4 1 6
FL Highlands MIA 12/8/09 6,730 45 325 370 42 17 20 68 147 14 7 9 31 61
FL Hillsborough MIA 2/24/09 127,944 788 5,446 6,234 426 130 143 396 1,095 165 77 108 196 546
FL Indian River MIA 6/22/10 4,766 21 161 182 11 3 21 27 62 1 2 11 15 29
FL Jackson MIA 6/22/10 1,707 4 20 24 1 1 1 5 8 1 1 0 4 6
FL Jefferson MIA 6/22/10 483 1 2 3 0 1 0 0 1 0 0 0 0 0
FL Lafayette MIA 6/22/10 229 0 6 6 0 0 0 0 0 0 0 0 0 0
FL Lake MIA 12/8/09 14,644 51 385 436 38 17 11 28 94 12 6 7 13 38
FL Lee MIA 6/22/10 22,920 147 1,488 1,635 71 60 67 93 291 13 20 28 39 100
FL Leon MIA 4/13/10 13,373 31 161 192 16 2 4 20 42 4 1 2 11 18
FL Levy MIA 6/22/10 1,845 6 42 48 0 1 17 8 26 0 1 3 0 4
FL Madison MIA 6/22/10 1,249 1 30 31 0 2 2 2 6 0 2 1 1 4
FL Manatee MIA 10/6/09 27,203 131 1,342 1,473 87 58 96 106 347 37 27 53 60 177
FL Marion MIA 1/28/09 36,154 128 1,265 1,393 67 24 47 90 228 28 14 32 47 121
FL Martin MIA 6/22/10 5,284 47 265 312 21 19 22 73 135 8 11 13 36 68
FL Miami-Dade MIA 2/24/09 239,832 9,120 35,898 45,018 2,692 674 746 2,952 7,064 478 191 367 1,104 2,140
FL Monroe MIA 11/24/09 7,979 172 545 717 35 15 18 66 134 3 5 7 31 46
FL Nassau MIA 6/22/10 3,062 3 34 37 1 0 5 7 13 1 0 3 2 6
FL Okaloosa MIA 6/22/10 6,960 15 131 146 16 13 27 18 74 12 8 20 9 49
FL Okeechobee MIA 6/22/10 2,636 22 135 157 11 8 4 11 34 5 1 2 4 12
FL Orange MIA 4/6/10 73,143 634 3,286 3,920 276 74 95 341 786 34 23 37 127 221
Page 14
IDENT/IAFIS Interoperability Report 14/52U.S. Immigration and Customs Enforcement Page 14 of 52
Interoperability Statistics: U.S. Counties (From October 27, 2008 through April 30, 2011)
Alien IDENT Matches* Administratively Arrested or Booked into ICE Custody**
Removals and Returns**
State County AOR Activation
Date Submissions LESC L1 LESC L2/3 Total L1 L2 L3
Non-Criminal
Immigration Violator
Total L1 L2 L3
Non-Criminal
Immigration Violator
Total
FL Osceola MIA 4/13/10 15,709 176 931 1,107 40 27 32 103 202 9 6 13 39 67
FL Palm Beach MIA 4/6/10 44,009 464 2,772 3,236 146 89 108 397 740 43 37 55 188 323
FL Pasco MIA 6/22/10 14,654 41 147 188 3 2 12 24 41 1 2 6 9 18
FL Pinellas MIA 11/10/09 68,299 219 1,322 1,541 99 44 64 80 287 23 19 31 38 111
FL Polk MIA 4/13/10 33,176 136 1,274 1,410 105 43 49 61 258 45 22 33 30 130
FL Putnam MIA 6/22/10 4,682 18 58 76 2 2 4 7 15 0 2 2 1 5
FL Saint Johns MIA 2/10/09 8,684 14 286 300 12 7 10 9 38 4 2 5 4 15
FL Saint Lucie MIA 2/18/09 29,642 168 1,559 1,727 121 47 72 182 422 30 21 47 94 192
FL Santa Rosa MIA 6/22/10 4,956 2 54 56 2 2 1 2 7 2 1 0 1 4
FL Sarasota MIA 4/6/10 15,135 42 400 442 26 7 6 38 77 4 1 4 17 26
FL Seminole MIA 6/22/10 15,734 61 360 421 12 5 10 19 46 2 1 3 10 16
FL Sumter MIA 6/22/10 2,123 13 55 68 6 1 1 3 11 2 1 0 0 3
FL Suwannee MIA 6/22/10 1,584 11 55 66 3 1 4 5 13 1 0 2 3 6
FL Taylor MIA 6/22/10 1,301 1 7 8 0 0 0 0 0 0 0 0 0 0
FL Union MIA 6/22/10 7,757 69 48 117 14 1 0 11 26 1 1 0 1 3
FL Volusia MIA 4/13/10 26,862 62 390 452 20 9 11 34 74 6 5 5 15 31
FL Wakulla MIA 6/22/10 970 1 3 4 1 0 1 0 2 0 0 1 0 1
FL Walton MIA 6/22/10 2,323 10 73 83 8 4 6 6 24 3 2 5 4 14
FL Washington MIA 6/22/10 1,034 3 10 13 0 1 0 3 4 0 0 0 1 1
GA Barrow ATL 2/15/11 809 6 17 23 2 0 1 2 5 0 0 0 0 0
GA Carroll ATL 4/12/11 335 3 9 12 0 0 0 2 2 0 0 0 0 0
GA Chatham ATL 3/15/11 1,959 7 41 48 1 2 0 5 8 0 0 0 0 0
GA Cherokee ATL 11/16/10 2,938 14 161 175 10 9 14 17 50 1 4 8 3 16
GA Clayton ATL 11/17/09 28,101 135 1,576 1,711 113 67 153 245 578 65 43 106 133 347
GA Cobb ATL 9/8/10 19,262 137 1,103 1,240 103 54 118 159 434 49 31 71 54 205
GA Colquitt ATL 4/5/11 180 0 7 7 0 0 0 0 0 0 0 0 0 0
GA Coweta ATL 3/15/11 680 3 28 31 0 1 2 2 5 0 0 1 0 1
GA DeKalb ATL 11/17/09 41,286 273 3,131 3,404 153 129 237 380 899 76 72 160 200 508
GA Douglas ATL 4/12/11 435 1 9 10 0 0 0 1 1 0 0 0 0 0
GA Fayette ATL 3/15/11 473 3 16 19 3 0 0 1 4 0 0 0 0 0
GA Forsyth ATL 12/14/10 1,606 5 113 118 6 3 7 10 26 2 0 2 4 8
Page 15
IDENT/IAFIS Interoperability Report 15/52U.S. Immigration and Customs Enforcement Page 15 of 52
Interoperability Statistics: U.S. Counties (From October 27, 2008 through April 30, 2011)
Alien IDENT Matches* Administratively Arrested or Booked into ICE Custody**
Removals and Returns**
State County AOR Activation
Date Submissions LESC L1 LESC L2/3 Total L1 L2 L3
Non-Criminal
Immigration Violator
Total L1 L2 L3
Non-Criminal
Immigration Violator
Total
GA Fulton ATL 9/8/10 32,618 183 1,274 1,457 57 37 85 104 283 20 23 47 47 137
GA Glynn ATL 3/15/11 739 0 13 13 0 0 0 2 2 0 0 0 0 0
GA Gwinnett ATL 11/17/09 43,737 537 5,382 5,919 413 313 637 943 2,306 207 178 444 461 1,290
GA Hall ATL 10/13/10 4,498 43 261 304 21 16 34 84 155 14 11 23 24 72
GA Henry ATL 1/19/11 2,804 14 83 97 4 3 4 5 16 1 2 3 0 6
GA Houston ATL 3/22/11 1,072 2 16 18 0 0 0 4 4 0 0 0 0 0
GA Lowndes ATL 4/5/11 694 1 16 17 0 1 0 0 1 0 0 0 0 0
GA Muscogee ATL 9/8/10 7,628 7 54 61 1 4 14 3 22 1 4 12 2 19
GA Newton ATL 2/15/11 772 4 11 15 0 2 0 1 3 0 1 0 1 2
GA Paulding ATL 4/12/11 167 0 2 2 0 0 0 0 0 0 0 0 0 0
GA Rockdale ATL 1/19/11 1,439 10 63 73 2 1 4 9 16 0 0 3 6 9
GA Spalding ATL 1/19/11 1,371 5 6 11 0 0 0 0 0 0 0 0 0 0
GA Troup ATL 3/15/11 710 4 16 20 0 1 0 0 1 0 0 0 0 0
GA Walton ATL 2/15/11 933 0 12 12 0 0 0 0 0 0 0 0 0 0
GA Whitfield ATL 10/13/10 2,965 18 159 177 17 11 19 49 96 8 10 12 20 50
HI Hawaii SFR 9/14/10 4,538 4 97 101 1 0 2 11 14 0 0 1 5 6
HI Maui SFR 9/14/10 3,845 8 109 117 0 0 3 15 18 0 0 1 7 8
HI Oahu SFR 4/13/10 23,234 66 858 924 23 4 9 32 68 1 1 5 9 16
IA Benton SPM 3/8/11 33 0 0 0 0 0 0 0 0 0 0 0 0 0
IA Black Hawk SPM 3/8/11 786 2 11 13 0 0 0 1 1 0 0 0 0 0
IA Clinton SPM 4/5/11 125 0 2 2 0 0 0 0 0 0 0 0 0 0
IA Dubuque SPM 4/5/11 155 0 0 0 0 0 0 0 0 0 0 0 0 0
IA Hardin SPM 1/25/11 112 0 0 0 0 0 0 0 0 0 0 0 0 0
IA Johnson SPM 3/8/11 567 7 12 19 0 0 0 4 4 0 0 0 0 0
IA Linn SPM 3/8/11 736 2 7 9 0 0 0 2 2 0 0 0 2 2
IA Muscatine SPM 4/5/11 91 2 1 3 0 1 0 1 2 0 0 0 0 0
IA Polk SPM 8/31/10 7,687 41 234 275 14 5 26 23 68 6 2 15 8 31
IA Pottawattamie SPM 12/7/10 966 3 18 21 1 1 1 3 6 0 1 1 0 2
IA Scott SPM 4/5/11 420 0 4 4 0 0 1 1 2 0 0 0 0 0
IA Woodbury SPM 3/8/11 336 6 9 15 0 1 1 3 5 0 0 0 0 0
ID Ada SLC 6/3/10 17,695 68 345 413 46 25 15 15 101 12 8 10 3 33
Page 16
IDENT/IAFIS Interoperability Report 16/52U.S. Immigration and Customs Enforcement Page 16 of 52
Interoperability Statistics: U.S. Counties (From October 27, 2008 through April 30, 2011)
Alien IDENT Matches* Administratively Arrested or Booked into ICE Custody**
Removals and Returns**
State County AOR Activation
Date Submissions LESC L1 LESC L2/3 Total L1 L2 L3
Non-Criminal
Immigration Violator
Total L1 L2 L3
Non-Criminal
Immigration Violator
Total
ID Canyon SLC 6/3/10 8,001 60 368 428 44 85 36 39 204 21 42 21 12 96
ID Kootenai SLC 4/5/11 474 1 2 3 0 1 0 0 1 0 0 0 0 0
IL Alexander CHI 9/14/10 138 0 0 0 0 0 0 0 0 0 0 0 0 0
IL Champaign CHI 10/5/10 2,507 4 77 81 2 0 1 7 10 2 0 1 2 5
IL Christian CHI 10/5/10 401 0 0 0 0 0 0 0 0 0 0 0 0 0
IL Clinton CHI 9/14/10 329 0 8 8 0 0 1 3 4 0 0 2 1 3
IL Crawford CHI 11/9/10 225 0 0 0 0 0 0 0 0 0 0 0 0 0
IL DeWitt CHI 11/9/10 209 0 1 1 0 0 1 0 1 0 0 0 0 0
IL DuPage CHI 11/24/09 28,613 133 2,605 2,738 81 86 239 358 764 46 45 107 41 239
IL Effingham CHI 10/5/10 1,218 3 35 38 0 1 3 11 15 0 2 2 3 7
IL Ford CHI 11/9/10 148 0 1 1 0 0 0 0 0 0 0 0 0 0
IL Franklin CHI 9/14/10 723 0 0 0 0 0 0 0 0 0 0 0 0 0
IL Jackson CHI 9/14/10 1,357 0 27 27 1 0 0 3 4 0 0 0 1 1
IL Kane CHI 11/24/09 22,269 129 2,470 2,599 97 70 160 333 660 59 35 72 54 220
IL Lake CHI 4/13/10 14,577 58 1,014 1,072 26 21 75 161 283 15 17 47 29 108
IL Madison CHI 4/13/10 10,681 0 83 83 0 0 7 23 30 0 0 4 8 12
IL Marion CHI 10/5/10 868 0 3 3 0 0 0 0 0 0 0 0 0 0
IL Massac CHI 9/14/10 348 0 0 0 0 0 0 0 0 0 0 0 0 0
IL McHenry CHI 4/13/10 6,941 20 543 563 8 14 43 95 160 2 4 10 9 25
IL Piatt CHI 11/9/10 186 0 0 0 0 0 0 0 0 0 0 0 0 0
IL Pulaski CHI 9/14/10 326 0 0 0 0 0 0 0 0 0 0 0 0 0
IL Saint Clair CHI 4/13/10 6,176 2 31 33 2 1 2 7 12 1 1 2 1 5
IL Stephenson CHI 10/26/10 1,027 0 7 7 0 0 0 1 1 0 0 0 0 0
IL Vermilion CHI 10/5/10 1,348 0 1 1 0 0 0 0 0 0 0 0 0 0
IL Washington CHI 9/14/10 227 0 0 0 0 0 0 0 0 0 0 0 0 0
IL Will CHI 4/13/10 33,432 241 607 848 72 30 116 56 274 39 23 68 5 135
IL Williamson CHI 10/5/10 1,154 1 0 1 1 0 0 0 1 0 0 0 0 0
IL Winnebago CHI 4/13/10 9,318 18 199 217 4 4 7 53 68 1 1 3 8 13
IN Benton CHI 4/26/11 1 0 0 0 0 0 0 0 0 0 0 0 0 0
IN Boone CHI 4/26/11 22 0 0 0 0 0 0 0 0 0 0 0 0 0
IN Carroll CHI 4/26/11 3 0 0 0 0 0 0 0 0 0 0 0 0 0
Page 17
IDENT/IAFIS Interoperability Report 17/52U.S. Immigration and Customs Enforcement Page 17 of 52
Interoperability Statistics: U.S. Counties (From October 27, 2008 through April 30, 2011)
Alien IDENT Matches* Administratively Arrested or Booked into ICE Custody**
Removals and Returns**
State County AOR Activation
Date Submissions LESC L1 LESC L2/3 Total L1 L2 L3
Non-Criminal
Immigration Violator
Total L1 L2 L3
Non-Criminal
Immigration Violator
Total
IN Cass CHI 4/5/11 89 0 3 3 0 0 0 1 1 0 0 0 0 0
IN Clark CHI 4/5/11 557 1 10 11 0 0 0 5 5 0 0 0 0 0
IN Clinton CHI 4/26/11 20 0 1 1 0 0 0 0 0 0 0 0 0 0
IN Jasper CHI 4/5/11 68 0 1 1 0 0 0 1 1 0 0 0 1 1
IN Miami CHI 4/5/11 52 0 0 0 0 0 0 0 0 0 0 0 0 0
IN Newton CHI 4/5/11 31 0 0 0 0 0 0 0 0 0 0 0 0 0
IN Pulaski CHI 4/5/11 27 0 0 0 0 0 0 0 0 0 0 0 0 0
IN Starke CHI 4/5/11 56 0 0 0 0 0 0 0 0 0 0 0 0 0
IN Steuben CHI 4/26/11 12 0 0 0 0 0 0 0 0 0 0 0 0 0
IN Wabash CHI 4/5/11 35 0 0 0 0 0 0 0 0 0 0 0 0 0
IN Warrick CHI 4/26/11 9 0 0 0 0 0 0 0 0 0 0 0 0 0
IN White CHI 4/26/11 6 0 0 0 0 0 0 0 0 0 0 0 0 0
KS Douglas CHI 3/15/11 764 0 16 16 0 0 0 4 4 0 0 0 2 2
KS Finney CHI 3/22/11 260 1 33 34 0 0 0 0 0 0 0 0 0 0
KS Ford CHI 4/5/11 177 5 13 18 0 0 0 1 1 0 0 0 0 0
KS Johnson CHI 3/15/11 2,662 9 145 154 2 2 0 15 19 0 1 0 6 7
KS Leavenworth CHI 3/15/11 429 0 1 1 0 0 0 0 0 0 0 0 0 0
KS Miami CHI 3/15/11 40 0 2 2 0 0 0 0 0 0 0 0 0 0
KS Saline CHI 1/11/11 1,524 5 35 40 1 0 2 6 9 0 0 0 2 2
KS Sedgwick CHI 12/21/10 9,796 28 321 349 2 4 14 41 61 1 3 5 14 23
KS Shawnee CHI 3/15/11 740 4 6 10 0 0 1 0 1 0 0 0 0 0
KS Wyandotte CHI 3/15/11 1,237 3 46 49 2 0 5 13 20 0 0 1 4 5
KY Fayette CHI 10/5/10 11,409 40 509 549 17 16 47 112 192 7 11 18 43 79
LA Caddo Parish NOL 11/23/10 10,182 9 40 49 1 0 6 17 24 1 0 6 3 10
LA East Baton Rouge
Parish NOL 6/2/10 24,069 37 215 252 9 11 26 50 96 5 6 21 21 53
LA Jefferson Parish NOL 11/17/09 43,849 134 1,549 1,683 65 32 111 584 792 25 18 64 269 376
LA Lafourche Parish NOL 8/3/10 5,357 8 85 93 2 7 12 18 39 2 4 8 10 24
LA Orleans Parish NOL 5/11/10 18,489 40 303 343 8 14 15 84 121 5 12 14 54 85
LA Saint Tammany
Parish NOL 11/23/10 5,713 4 46 50 3 3 2 14 22 2 1 0 7 10
LA Terrebonne Parish NOL 8/3/10 4,940 5 104 109 8 7 9 38 62 2 3 5 9 19
Page 18
IDENT/IAFIS Interoperability Report 18/52U.S. Immigration and Customs Enforcement Page 18 of 52
Interoperability Statistics: U.S. Counties (From October 27, 2008 through April 30, 2011)
Alien IDENT Matches* Administratively Arrested or Booked into ICE Custody**
Removals and Returns**
State County AOR Activation
Date Submissions LESC L1 LESC L2/3 Total L1 L2 L3
Non-Criminal
Immigration Violator
Total L1 L2 L3
Non-Criminal
Immigration Violator
Total
LA Washington
Parish NOL 12/14/10 1,164 0 3 3 0 0 0 0 0 0 0 0 0 0
MA Suffolk BOS 11/5/08 45,707 519 2,409 2,928 348 50 89 405 892 96 15 54 180 345
MD Allegany BAL 4/12/11 54 0 0 0 0 0 0 0 0 0 0 0 0 0
MD Anne Arundel BAL 12/28/10 7,410 26 173 199 4 2 7 16 29 1 0 2 5 8
MD Baltimore BAL 12/14/10 7,234 33 172 205 7 6 10 32 55 3 3 1 11 18
MD Calvert BAL 3/22/11 248 0 2 2 0 0 0 0 0 0 0 0 0 0
MD Caroline BAL 2/8/11 254 0 2 2 0 0 0 1 1 0 0 0 1 1
MD Carroll BAL 12/21/10 1,083 2 3 5 1 0 2 0 3 1 0 1 0 2
MD Cecil BAL 3/22/11 264 0 7 7 0 0 0 0 0 0 0 0 0 0
MD Charles BAL 3/22/11 749 0 7 7 0 0 0 2 2 0 0 0 0 0
MD Dorchester BAL 2/1/11 295 0 0 0 0 0 0 0 0 0 0 0 0 0
MD Frederick BAL 4/6/10 3,748 15 125 140 8 4 11 47 70 1 0 7 20 28
MD Garrett BAL 4/12/11 24 0 0 0 0 0 0 0 0 0 0 0 0 0
MD Harford BAL 3/22/11 709 1 6 7 0 0 0 0 0 0 0 0 0 0
MD Howard BAL 3/22/11 584 8 24 32 1 0 0 1 2 0 0 0 1 1
MD Kent BAL 2/15/11 214 0 1 1 0 0 0 0 0 0 0 0 0 0
MD Prince George's BAL 12/22/09 30,265 165 1,703 1,868 95 32 83 316 526 32 16 47 171 266
MD Queen Anne's BAL 4/6/10 851 3 15 18 1 1 3 2 7 1 1 2 1 5
MD Saint Mary's BAL 4/6/10 3,522 2 26 28 0 1 2 5 8 0 1 1 3 5
MD Somerset BAL 2/15/11 173 1 1 2 0 0 0 0 0 0 0 0 0 0
MD Talbot BAL 2/1/11 206 0 6 6 1 0 0 0 1 1 0 0 0 1
MD Washington BAL 4/12/11 239 1 1 2 0 0 0 0 0 0 0 0 0 0
MD Wicomico BAL 4/19/11 112 0 1 1 0 0 0 1 1 0 0 0 0 0
MD Worcester BAL 2/15/11 569 4 11 15 3 1 0 6 10 1 0 0 0 1
MI Allegan DET 4/12/11 140 1 2 3 0 0 0 1 1 0 0 0 0 0
MI Barry DET 4/12/11 67 0 0 0 0 0 0 0 0 0 0 0 0 0
MI Calhoun DET 4/12/11 279 0 2 2 0 0 1 0 1 0 0 0 0 0
MI Clinton DET 4/26/11 24 0 0 0 0 0 0 0 0 0 0 0 0 0
MI Eaton DET 4/26/11 29 0 0 0 0 0 0 0 0 0 0 0 0 0
MI Genesee DET 3/29/11 731 2 0 2 0 0 0 0 0 0 0 0 0 0
MI Ingham DET 4/26/11 915 4 6 10 1 0 1 1 3 0 0 0 0 0
Page 19
IDENT/IAFIS Interoperability Report 19/52U.S. Immigration and Customs Enforcement Page 19 of 52
Interoperability Statistics: U.S. Counties (From October 27, 2008 through April 30, 2011)
Alien IDENT Matches* Administratively Arrested or Booked into ICE Custody**
Removals and Returns**
State County AOR Activation
Date Submissions LESC L1 LESC L2/3 Total L1 L2 L3
Non-Criminal
Immigration Violator
Total L1 L2 L3
Non-Criminal
Immigration Violator
Total
MI Ionia DET 4/26/11 16 0 1 1 0 0 0 1 1 0 0 0 0 0
MI Kalamazoo DET 4/12/11 368 0 8 8 0 0 1 0 1 0 0 0 0 0
MI Kent DET 9/14/10 14,447 38 349 387 18 16 30 51 115 8 9 22 17 56
MI Livingston DET 4/26/11 51 0 0 0 0 0 0 0 0 0 0 0 0 0
MI Macomb DET 8/10/10 21,521 45 270 315 16 9 5 26 56 6 3 3 14 26
MI Monroe DET 3/29/11 319 0 3 3 0 0 0 2 2 0 0 0 0 0
MI Muskegon DET 4/12/11 292 0 0 0 0 0 0 0 0 0 0 0 0 0
MI Oakland DET 7/7/10 29,440 52 631 683 22 33 34 97 186 6 14 17 50 87
MI Ottawa DET 4/12/11 294 0 5 5 0 0 0 0 0 0 0 0 0 0
MI Saint Clair DET 4/26/11 44 0 0 0 0 0 0 0 0 0 0 0 0 0
MI Shiawassee DET 4/26/11 28 0 0 0 0 0 0 0 0 0 0 0 0 0
MI Washtenaw DET 3/29/11 1,242 4 21 25 0 0 2 0 2 0 0 0 0 0
MI Wayne DET 10/27/09 143,274 233 1,589 1,822 122 57 103 255 537 39 22 60 122 243
MO Adair CHI 1/25/11 295 0 0 0 0 0 0 0 0 0 0 0 0 0
MO Boone CHI 2/8/11 1,824 4 30 34 0 0 0 4 4 0 0 0 1 1
MO Buchanan CHI 1/25/11 1,308 7 23 30 0 1 0 2 3 0 0 0 0 0
MO Camden CHI 3/29/11 118 0 1 1 0 0 0 1 1 0 0 0 0 0
MO Cape Girardeau CHI 2/8/11 687 0 4 4 0 0 0 0 0 0 0 0 0 0
MO Cass CHI 2/8/11 1,119 0 18 18 0 1 2 2 5 0 0 1 0 1
MO Christian CHI 3/15/11 198 0 2 2 0 0 0 0 0 0 0 0 0 0
MO Clark CHI 1/25/11 57 0 0 0 0 0 0 0 0 0 0 0 0 0
MO Clay CHI 11/16/10 2,307 2 23 25 0 0 1 3 4 0 0 1 0 1
MO Cole CHI 2/8/11 1,614 3 18 21 0 1 1 1 3 0 0 1 0 1
MO Douglas CHI 4/19/11 16 0 0 0 0 0 0 0 0 0 0 0 0 0
MO Dunklin CHI 2/8/11 333 1 2 3 0 0 1 0 1 0 0 1 0 1
MO Greene CHI 3/29/11 1,303 2 10 12 1 0 0 2 3 0 0 0 1 1
MO Howell CHI 4/19/11 61 0 0 0 0 0 0 0 0 0 0 0 0 0
MO Jackson CHI 11/16/10 10,545 41 150 191 11 5 18 31 65 10 1 9 17 37
MO Jasper CHI 2/8/11 1,824 7 37 44 0 1 3 9 13 0 0 0 1 1
MO Laclede CHI 4/19/11 44 0 0 0 0 0 0 0 0 0 0 0 0 0
MO Marion CHI 2/8/11 211 0 0 0 0 0 0 0 0 0 0 0 0 0
Page 20
IDENT/IAFIS Interoperability Report 20/52U.S. Immigration and Customs Enforcement Page 20 of 52
Interoperability Statistics: U.S. Counties (From October 27, 2008 through April 30, 2011)
Alien IDENT Matches* Administratively Arrested or Booked into ICE Custody**
Removals and Returns**
State County AOR Activation
Date Submissions LESC L1 LESC L2/3 Total L1 L2 L3
Non-Criminal
Immigration Violator
Total L1 L2 L3
Non-Criminal
Immigration Violator
Total
MO McDonald CHI 3/29/11 32 0 0 0 0 0 0 0 0 0 0 0 0 0
MO Montgomery CHI 1/25/11 103 0 0 0 0 0 0 0 0 0 0 0 0 0
MO Newton CHI 3/29/11 146 1 2 3 1 0 0 0 1 0 0 0 0 0
MO Oregon CHI 4/19/11 19 0 0 0 0 0 0 0 0 0 0 0 0 0
MO Ozark CHI 4/19/11 5 0 0 0 0 0 0 0 0 0 0 0 0 0
MO Perry CHI 1/25/11 170 0 0 0 0 0 0 0 0 0 0 0 0 0
MO Pettis CHI 1/4/11 510 1 11 12 0 2 0 1 3 0 0 0 0 0
MO Platte CHI 11/16/10 902 2 28 30 0 1 1 5 7 0 1 1 0 2
MO Pulaski CHI 4/19/11 41 0 1 1 0 0 0 0 0 0 0 0 0 0
MO Saint Charles CHI 2/8/11 3,217 9 38 47 1 1 1 10 13 0 1 1 1 3
MO Saint Louis CHI 9/21/10 30,127 32 349 381 1 4 8 78 91 0 2 6 34 42
MO Saint Louis city CHI 9/21/10 12,381 25 75 100 3 2 2 13 20 0 0 2 5 7
MO Scott CHI 1/25/11 816 0 2 2 0 0 0 2 2 0 0 0 0 0
MO Stone CHI 3/15/11 81 0 0 0 0 0 0 0 0 0 0 0 0 0
MO Taney CHI 3/15/11 265 0 2 2 0 0 0 1 1 0 0 0 0 0
MO Texas CHI 4/19/11 20 0 1 1 0 0 0 1 1 0 0 0 0 0
MO Webster CHI 4/5/11 69 0 0 0 0 0 0 0 0 0 0 0 0 0
MS DeSoto NOL 9/28/10 4,826 5 80 85 1 0 14 21 36 0 0 8 10 18
MS Forrest NOL 12/21/10 1,179 2 15 17 0 2 1 0 3 0 1 0 0 1
MS Hancock NOL 12/21/10 420 0 3 3 0 0 1 1 2 0 0 0 0 0
MS Harrison NOL 8/10/10 3,921 7 67 74 1 6 11 6 24 0 4 6 5 15
MS Jackson NOL 12/21/10 1,640 2 16 18 0 1 2 1 4 0 1 0 1 2
MS Jones NOL 12/21/10 1,211 2 34 36 0 0 5 0 5 0 0 2 0 2
MS Lowndes NOL 8/10/10 1,398 0 10 10 0 0 2 5 7 0 0 2 3 5
MS Pearl River NOL 12/21/10 866 0 4 4 0 0 1 0 1 0 0 1 0 1
MS Rankin NOL 8/10/10 10,639 10 83 93 4 3 10 35 52 2 1 8 23 34
MS Warren NOL 7/20/10 1,502 1 16 17 0 1 0 0 1 0 1 0 0 1
MT Lewis and Clark SLC 7/27/10 1,098 1 3 4 0 0 0 1 1 0 0 0 0 0
MT Missoula SLC 7/27/10 1,655 2 13 15 1 0 0 2 3 1 0 0 0 1
MT Yellowstone SLC 8/10/10 2,950 2 8 10 0 1 0 0 1 0 0 0 0 0
NC Alamance ATL 9/8/10 2,274 20 48 68 17 8 7 15 47 8 4 4 4 20
Page 21
IDENT/IAFIS Interoperability Report 21/52U.S. Immigration and Customs Enforcement Page 21 of 52
Interoperability Statistics: U.S. Counties (From October 27, 2008 through April 30, 2011)
Alien IDENT Matches* Administratively Arrested or Booked into ICE Custody**
Removals and Returns**
State County AOR Activation
Date Submissions LESC L1 LESC L2/3 Total L1 L2 L3
Non-Criminal
Immigration Violator
Total L1 L2 L3
Non-Criminal
Immigration Violator
Total
NC Alexander ATL 10/13/10 161 0 3 3 0 0 0 0 0 0 0 0 0 0
NC Alleghany ATL 10/13/10 84 1 2 3 0 0 0 3 3 0 0 0 2 2
NC Anson ATL 11/16/10 154 0 0 0 0 0 0 0 0 0 0 0 0 0
NC Ashe ATL 10/13/10 182 3 12 15 0 2 0 5 7 0 0 0 2 2
NC Avery ATL 10/13/10 232 1 4 5 0 0 0 1 1 0 0 0 0 0
NC Beaufort ATL 2/15/11 327 2 1 3 0 1 0 1 2 0 0 0 0 0
NC Bertie ATL 12/14/10 66 0 0 0 0 0 0 0 0 0 0 0 0 0
NC Bladen ATL 9/8/10 333 0 9 9 0 0 1 4 5 0 0 1 2 3
NC Brunswick ATL 3/30/10 3,034 11 58 69 2 1 7 10 20 1 1 1 5 8
NC Buncombe ATL 11/17/08 22,493 71 1,257 1,328 56 30 69 86 241 24 18 52 43 137
NC Burke ATL 8/10/10 582 3 6 9 0 3 0 3 6 0 0 0 0 0
NC Cabarrus ATL 1/28/09 3,250 27 201 228 18 11 14 25 68 12 10 12 6 40
NC Caldwell ATL 8/10/10 473 2 6 8 2 1 0 1 4 2 1 0 0 3
NC Camden ATL 3/15/11 13 0 0 0 0 0 0 0 0 0 0 0 0 0
NC Carteret ATL 2/15/11 191 0 5 5 0 0 0 1 1 0 0 0 0 0
NC Caswell ATL 12/14/10 71 0 1 1 0 0 0 0 0 0 0 0 0 0
NC Catawba ATL 1/28/09 13,571 30 1,011 1,041 25 15 36 69 145 7 8 24 33 72
NC Chatham ATL 9/8/10 375 4 22 26 1 3 6 5 15 1 1 4 4 10
NC Cherokee ATL 7/13/10 325 0 2 2 0 0 1 0 1 0 0 0 0 0
NC Chowan ATL 3/15/11 29 0 0 0 0 0 0 0 0 0 0 0 0 0
NC Clay ATL 7/13/10 256 1 3 4 0 0 0 0 0 0 0 0 0 0
NC Cleveland ATL 8/10/10 710 1 6 7 1 0 0 2 3 0 0 0 0 0
NC Columbus ATL 3/30/10 2,670 5 22 27 2 1 5 8 16 0 0 1 4 5
NC Craven ATL 2/15/11 426 1 2 3 0 0 0 0 0 0 0 0 0 0
NC Cumberland ATL 2/3/09 18,846 51 1,614 1,665 14 6 10 26 56 10 5 7 15 37
NC Currituck ATL 3/15/11 57 0 0 0 0 0 0 0 0 0 0 0 0 0
NC Dare ATL 3/30/10 1,979 3 59 62 4 5 3 9 21 1 3 1 7 12
NC Davidson ATL 8/10/10 2,509 8 30 38 9 1 5 8 23 2 0 2 5 9
NC Davie ATL 11/16/10 378 3 7 10 0 2 3 1 6 0 1 1 0 2
NC Duplin ATL 1/6/09 1,571 16 111 127 16 4 8 20 48 7 4 4 10 25
NC Durham ATL 2/10/09 23,291 137 2,239 2,376 122 63 95 172 452 54 33 60 91 238
Page 22
IDENT/IAFIS Interoperability Report 22/52U.S. Immigration and Customs Enforcement Page 22 of 52
Interoperability Statistics: U.S. Counties (From October 27, 2008 through April 30, 2011)
Alien IDENT Matches* Administratively Arrested or Booked into ICE Custody**
Removals and Returns**
State County AOR Activation
Date Submissions LESC L1 LESC L2/3 Total L1 L2 L3
Non-Criminal
Immigration Violator
Total L1 L2 L3
Non-Criminal
Immigration Violator
Total
NC Edgecombe ATL 9/8/10 1,165 5 9 14 1 0 0 6 7 1 0 0 1 2
NC Forsyth ATL 8/10/10 6,427 21 167 188 22 19 19 45 105 9 10 17 29 65
NC Franklin ATL 1/19/11 101 0 1 1 0 0 0 0 0 0 0 0 0 0
NC Gaston ATL 11/17/08 22,174 27 874 901 20 13 57 118 208 13 10 49 79 151
NC Gates ATL 3/15/11 16 0 0 0 0 0 0 0 0 0 0 0 0 0
NC Graham ATL 7/13/10 106 0 2 2 1 1 0 0 2 1 0 0 0 1
NC Granville ATL 9/8/10 453 2 2 4 2 0 0 0 2 0 0 0 0 0
NC Greene ATL 1/19/11 58 0 2 2 0 0 0 2 2 0 0 0 0 0
NC Guilford ATL 11/16/10 4,022 32 75 107 5 7 3 14 29 1 5 2 5 13
NC Halifax ATL 3/30/10 912 0 3 3 0 0 0 0 0 0 0 0 0 0
NC Harnett ATL 1/21/09 9,761 27 436 463 21 4 32 34 91 13 3 20 17 53
NC Haywood ATL 7/13/10 537 0 1 1 0 0 0 0 0 0 0 0 0 0
NC Henderson ATL 11/17/08 12,667 50 916 966 64 31 105 121 321 40 23 83 67 213
NC Hertford ATL 3/15/11 59 1 0 1 0 0 1 0 1 0 0 0 0 0
NC Hoke ATL 9/8/10 1,229 7 18 25 0 2 2 8 12 0 1 0 1 2
NC Hyde ATL 2/15/11 5 0 0 0 0 0 0 0 0 0 0 0 0 0
NC Iredell ATL 8/10/10 2,442 12 50 62 3 3 5 17 28 1 1 4 4 10
NC Jackson ATL 3/30/10 617 4 18 22 0 1 4 8 13 0 0 2 2 4
NC Johnston ATL 9/8/10 1,502 18 66 84 4 12 16 17 49 1 6 14 6 27
NC Jones ATL 1/19/11 122 0 3 3 0 0 1 2 3 0 0 0 0 0
NC Lee ATL 3/30/10 2,511 8 60 68 5 1 7 14 27 2 1 2 7 12
NC Lenoir ATL 1/19/11 495 3 10 13 1 0 0 1 2 1 0 0 0 1
NC Lincoln ATL 8/10/10 1,221 4 16 20 2 0 3 6 11 0 0 3 2 5
NC Macon ATL 7/13/10 317 0 23 23 3 3 3 5 14 2 2 3 1 8
NC Madison ATL 7/13/10 202 0 0 0 0 0 0 0 0 0 0 0 0 0
NC Martin ATL 12/14/10 219 0 4 4 0 0 0 1 1 0 0 0 1 1
NC McDowell ATL 8/10/10 310 1 8 9 0 0 1 3 4 0 0 1 0 1
NC Mecklenburg ATL 10/27/09 48,835 256 2,337 2,593 192 144 351 706 1,393 96 110 265 351 822
NC Mitchell ATL 10/13/10 65 0 3 3 0 0 1 1 2 0 0 0 1 1
NC Montgomery ATL 11/16/10 215 0 9 9 1 1 0 5 7 0 1 0 1 2
NC Moore ATL 9/8/10 1,403 4 16 20 1 0 1 4 6 0 0 0 2 2
Page 23
IDENT/IAFIS Interoperability Report 23/52U.S. Immigration and Customs Enforcement Page 23 of 52
Interoperability Statistics: U.S. Counties (From October 27, 2008 through April 30, 2011)
Alien IDENT Matches* Administratively Arrested or Booked into ICE Custody**
Removals and Returns**
State County AOR Activation
Date Submissions LESC L1 LESC L2/3 Total L1 L2 L3
Non-Criminal
Immigration Violator
Total L1 L2 L3
Non-Criminal
Immigration Violator
Total
NC Nash ATL 9/8/10 392 3 5 8 0 0 1 4 5 0 0 1 2 3
NC New Hanover ATL 1/6/09 8,022 81 687 768 52 27 53 89 221 22 11 31 53 117
NC Northampton ATL 3/15/11 17 0 0 0 0 0 0 0 0 0 0 0 0 0
NC Onslow ATL 1/19/11 828 5 11 16 1 1 1 0 3 0 1 1 0 2
NC Orange ATL 1/13/09 4,878 19 277 296 17 10 3 29 59 8 5 2 13 28
NC Pamlico ATL 2/15/11 55 0 1 1 0 0 0 0 0 0 0 0 0 0
NC Pasquotank ATL 3/15/11 120 0 0 0 0 0 0 0 0 0 0 0 0 0
NC Pender ATL 12/14/10 152 1 0 1 0 0 0 1 1 0 0 0 0 0
NC Perquimans ATL 3/15/11 9 0 0 0 0 0 0 0 0 0 0 0 0 0
NC Person ATL 12/14/10 303 1 4 5 0 0 1 3 4 0 0 1 0 1
NC Pitt ATL 12/14/10 1,591 10 16 26 0 0 4 6 10 0 0 3 1 4
NC Polk ATL 8/10/10 210 0 4 4 0 0 1 0 1 0 0 1 0 1
NC Randolph ATL 11/16/10 614 6 10 16 1 1 1 6 9 0 1 0 3 4
NC Richmond ATL 11/16/10 394 0 1 1 0 0 0 0 0 0 0 0 0 0
NC Robeson ATL 1/19/11 552 2 1 3 0 0 1 0 1 0 0 0 0 0
NC Rockingham ATL 10/13/10 744 5 9 14 5 1 4 3 13 2 0 3 1 6
NC Rowan ATL 11/16/10 1,672 10 19 29 4 1 0 9 14 0 0 0 1 1
NC Rutherford ATL 8/10/10 595 1 7 8 0 0 0 3 3 0 0 0 2 2
NC Sampson ATL 12/14/10 507 4 20 24 1 1 3 5 10 0 0 2 0 2
NC Scotland ATL 11/16/10 221 1 0 1 0 0 0 0 0 0 0 0 0 0
NC Stanly ATL 11/16/10 530 1 3 4 2 0 1 1 4 1 0 1 0 2
NC Stokes ATL 10/13/10 264 0 2 2 0 0 0 1 1 0 0 0 0 0
NC Surry ATL 10/13/10 349 1 11 12 0 2 1 5 8 0 0 0 1 1
NC Swain ATL 7/13/10 272 1 5 6 0 1 2 1 4 0 1 1 0 2
NC Transylvania ATL 3/30/10 1,317 2 18 20 1 0 4 6 11 0 0 2 1 3
NC Tyrrell ATL 2/15/11 11 0 1 1 0 0 0 0 0 0 0 0 0 0
NC Union ATL 3/30/10 5,792 20 168 188 12 17 43 60 132 7 13 24 31 75
NC Vance ATL 12/14/10 601 0 10 10 0 0 0 1 1 0 0 0 0 0
NC Wake ATL 11/12/08 77,452 364 5,698 6,062 408 223 457 932 2,020 255 157 376 507 1,295
NC Warren ATL 1/19/11 125 0 0 0 0 0 0 0 0 0 0 0 0 0
NC Washington ATL 2/15/11 25 0 0 0 0 0 0 0 0 0 0 0 0 0
Page 24
IDENT/IAFIS Interoperability Report 24/52U.S. Immigration and Customs Enforcement Page 24 of 52
Interoperability Statistics: U.S. Counties (From October 27, 2008 through April 30, 2011)
Alien IDENT Matches* Administratively Arrested or Booked into ICE Custody**
Removals and Returns**
State County AOR Activation
Date Submissions LESC L1 LESC L2/3 Total L1 L2 L3
Non-Criminal
Immigration Violator
Total L1 L2 L3
Non-Criminal
Immigration Violator
Total
NC Watauga ATL 10/13/10 208 2 6 8 0 0 1 4 5 0 0 1 1 2
NC Wayne ATL 12/14/10 650 3 8 11 1 2 0 1 4 1 0 0 0 1
NC Wilkes ATL 10/13/10 395 2 5 7 0 0 1 2 3 0 0 1 0 1
NC Wilson ATL 1/19/11 417 4 3 7 2 1 0 2 5 0 0 0 0 0
NC Yadkin ATL 10/13/10 199 0 3 3 0 1 0 0 1 0 1 0 0 1
NC Yancey ATL 7/13/10 113 0 1 1 0 0 0 0 0 0 0 0 0 0
NE Adams SPM 11/2/10 244 2 4 6 1 1 0 0 2 0 1 0 0 1
NE Buffalo SPM 11/16/10 1,038 1 33 34 1 3 3 2 9 1 1 1 0 3
NE Dodge SPM 2/22/11 285 1 10 11 0 1 2 3 6 0 0 0 0 0
NE Douglas SPM 8/17/10 7,072 41 305 346 27 25 30 49 131 8 14 16 18 56
NE Hall SPM 11/2/10 1,472 8 170 178 4 17 16 17 54 1 6 3 4 14
NE Hamilton SPM 11/2/10 171 0 2 2 0 0 0 0 0 0 0 0 0 0
NE Howard SPM 11/2/10 42 0 2 2 0 0 0 2 2 0 0 0 0 0
NE Lancaster SPM 8/17/10 5,089 16 117 133 5 7 8 7 27 0 4 4 1 9
NE Madison SPM 11/2/10 708 3 32 35 3 4 2 4 13 1 3 1 0 5
NE Merrick SPM 11/2/10 66 0 0 0 0 0 0 0 0 0 0 0 0 0
NE Sarpy SPM 12/14/10 1,681 4 62 66 5 3 9 7 24 2 1 6 5 14
NM Bernalillo ELP 9/28/09 33,820 271 1,033 1,304 88 31 121 231 471 41 25 88 136 290
NM Catron ELP 11/9/10 6 1 1 2 1 0 0 1 2 0 0 0 0 0
NM Chaves ELP 11/9/10 986 0 6 6 0 0 0 2 2 0 0 0 1 1
NM Cibola ELP 11/9/10 490 0 0 0 0 0 0 0 0 0 0 0 0 0
NM Colfax ELP 12/7/10 321 0 0 0 0 0 0 0 0 0 0 0 0 0
NM Curry ELP 11/9/10 552 0 0 0 0 0 0 0 0 0 0 0 0 0
NM DeBaca ELP 12/7/10 26 0 1 1 0 0 0 0 0 0 0 0 0 0
NM Dona Ana ELP 6/24/09 15,911 140 1,075 1,215 77 43 155 167 442 42 31 111 55 239
NM Eddy ELP 11/9/10 994 0 0 0 0 0 0 0 0 0 0 0 0 0
NM Grant ELP 7/14/09 930 0 0 0 0 0 0 0 0 0 0 0 0 0
NM Guadalupe ELP 12/7/10 35 0 0 0 0 0 0 0 0 0 0 0 0 0
NM Hidalgo ELP 7/14/09 173 0 1 1 0 0 0 0 0 0 0 0 0 0
NM Lea ELP 11/9/10 985 3 18 21 2 0 1 7 10 1 0 0 5 6
NM Lincoln ELP 12/7/10 381 0 0 0 0 0 0 0 0 0 0 0 0 0
Page 25
IDENT/IAFIS Interoperability Report 25/52U.S. Immigration and Customs Enforcement Page 25 of 52
Interoperability Statistics: U.S. Counties (From October 27, 2008 through April 30, 2011)
Alien IDENT Matches* Administratively Arrested or Booked into ICE Custody**
Removals and Returns**
State County AOR Activation
Date Submissions LESC L1 LESC L2/3 Total L1 L2 L3
Non-Criminal
Immigration Violator
Total L1 L2 L3
Non-Criminal
Immigration Violator
Total
NM Los Alamos ELP 12/7/10 88 0 4 4 0 0 0 0 0 0 0 0 0 0
NM Luna ELP 7/14/09 1,516 7 57 64 1 3 1 8 13 1 1 2 2 6
NM McKinley ELP 11/9/10 2,365 0 1 1 0 0 0 0 0 0 0 0 0 0
NM Otero ELP 11/9/10 1,179 1 2 3 0 0 0 0 0 0 0 0 0 0
NM Quay ELP 12/7/10 123 2 2 4 0 0 0 0 0 0 0 0 0 0
NM Rio Arriba ELP 12/7/10 933 2 5 7 0 0 0 0 0 0 0 0 0 0
NM Roosevelt ELP 12/7/10 279 2 2 4 0 0 0 0 0 0 0 0 0 0
NM San Juan ELP 12/7/10 1,966 0 0 0 0 0 0 0 0 0 0 0 0 0
NM San Miguel ELP 12/7/10 513 0 0 0 0 0 0 0 0 0 0 0 0 0
NM Sandoval ELP 11/9/10 456 2 2 4 0 0 1 1 2 0 0 1 0 1
NM Santa Fe ELP 2/8/11 1,375 11 59 70 0 1 0 6 7 0 0 0 0 0
NM Sierra ELP 11/9/10 201 0 0 0 0 0 0 0 0 0 0 0 0 0
NM Socorro ELP 11/9/10 435 0 0 0 0 0 0 0 0 0 0 0 0 0
NM Taos ELP 12/7/10 206 0 0 0 0 0 0 0 0 0 0 0 0 0
NM Torrance ELP 11/9/10 35 0 0 0 0 0 0 0 0 0 0 0 0 0
NM Union ELP 12/7/10 16 0 0 0 0 0 0 0 0 0 0 0 0 0
NM Valencia ELP 11/9/10 1,704 19 6 25 2 0 0 0 2 1 0 0 0 1
NV Carson City SLC 10/5/10 604 7 19 26 3 2 1 3 9 1 1 0 2 4
NV Churchill SLC 10/19/10 4 0 0 0 0 0 0 0 0 0 0 0 0 0
NV Clark SLC 7/27/10 56,464 754 3,483 4,237 208 82 155 907 1,352 84 52 106 423 665
NV Douglas SLC 10/13/10 566 0 22 22 0 2 1 3 6 0 1 1 1 3
NV Humboldt SLC 4/19/11 5 0 1 1 0 0 0 0 0 0 0 0 0 0
NV Lincoln SLC 11/23/10 31 0 0 0 0 0 0 0 0 0 0 0 0 0
NV Lyon SLC 10/13/10 384 1 7 8 1 0 0 2 3 0 0 0 0 0
NV Mineral SLC 2/15/11 29 0 0 0 0 0 0 0 0 0 0 0 0 0
NV Nye SLC 11/23/10 309 1 4 5 0 0 0 1 1 0 0 0 1 1
NV Storey SLC 1/11/11 7 0 0 0 0 0 0 0 0 0 0 0 0 0
NV Washoe SLC 7/13/10 8,835 56 385 441 38 18 29 69 154 21 13 19 25 78
NY Cayuga BUF 4/26/11 53 0 0 0 0 0 0 0 0 0 0 0 0 0
NY Chautauqua BUF 4/12/11 208 1 4 5 0 0 0 0 0 0 0 0 0 0
NY Dutchess NYC 2/8/11 1,004 2 27 29 0 0 0 1 1 0 0 0 1 1
Page 26
IDENT/IAFIS Interoperability Report 26/52U.S. Immigration and Customs Enforcement Page 26 of 52
Interoperability Statistics: U.S. Counties (From October 27, 2008 through April 30, 2011)
Alien IDENT Matches* Administratively Arrested or Booked into ICE Custody**
Removals and Returns**
State County AOR Activation
Date Submissions LESC L1 LESC L2/3 Total L1 L2 L3
Non-Criminal
Immigration Violator
Total L1 L2 L3
Non-Criminal
Immigration Violator
Total
NY Fulton BUF 4/26/11 25 0 0 0 0 0 0 0 0 0 0 0 0 0
NY Genesee BUF 2/8/11 228 1 2 3 2 0 0 0 2 1 0 0 0 1
NY Livingston BUF 4/19/11 53 0 0 0 0 0 0 0 0 0 0 0 0 0
NY Monroe BUF 3/15/11 2,751 15 31 46 0 0 0 1 1 0 0 0 0 0
NY Nassau NYC 2/8/11 4,140 59 413 472 11 6 13 54 84 3 0 2 10 15
NY Niagara BUF 4/12/11 301 0 0 0 0 0 0 0 0 0 0 0 0 0
NY Ontario BUF 4/19/11 122 1 1 2 0 0 0 0 0 0 0 0 0 0
NY Orange NYC 2/22/11 2,363 14 72 86 5 3 1 7 16 0 0 0 4 4
NY Orleans BUF 2/8/11 163 0 4 4 0 0 0 0 0 0 0 0 0 0
NY Otsego BUF 4/19/11 49 1 0 1 0 0 0 0 0 0 0 0 0 0
NY Putnam NYC 1/11/11 607 1 34 35 0 0 0 12 12 0 0 0 2 2
NY Rockland NYC 1/11/11 1,396 11 104 115 2 0 2 10 14 0 0 1 3 4
NY Schuyler BUF 3/15/11 66 0 0 0 0 0 0 0 0 0 0 0 0 0
NY Seneca BUF 4/19/11 43 0 0 0 0 0 0 0 0 0 0 0 0 0
NY Steuben BUF 4/19/11 66 0 1 1 0 1 0 0 1 0 0 0 0 0
NY Suffolk NYC 2/22/11 6,452 58 335 393 12 14 14 41 81 0 1 0 9 10
NY Sullivan NYC 2/8/11 300 0 5 5 0 0 0 0 0 0 0 0 0 0
NY Ulster NYC 2/8/11 1,286 3 9 12 0 0 1 2 3 0 0 0 0 0
NY Westchester NYC 2/22/11 3,390 31 211 242 2 1 7 22 32 1 0 3 4 8
NY Wyoming BUF 3/15/11 154 0 0 0 0 0 0 0 0 0 0 0 0 0
NY Yates BUF 4/19/11 29 0 0 0 0 0 0 0 0 0 0 0 0 0
OH Adams DET 4/19/11 11 0 0 0 0 0 0 0 0 0 0 0 0 0
OH Allen DET 3/29/11 189 0 0 0 0 0 0 0 0 0 0 0 0 0
OH Ashland DET 3/29/11 67 0 0 0 0 0 0 0 0 0 0 0 0 0
OH Ashtabula DET 2/1/11 298 0 0 0 0 0 0 0 0 0 0 0 0 0
OH Athens DET 1/19/11 204 0 0 0 0 0 0 0 0 0 0 0 0 0
OH Belmont DET 2/22/11 247 0 0 0 0 0 0 0 0 0 0 0 0 0
OH Brown DET 4/26/11 18 0 0 0 0 0 0 0 0 0 0 0 0 0
OH Butler DET 7/13/10 6,313 14 88 102 6 6 15 6 33 4 5 10 3 22
OH Champaign DET 12/28/10 118 0 0 0 0 0 0 0 0 0 0 0 0 0
OH Clark DET 11/9/10 1,939 1 11 12 0 0 7 3 10 0 0 6 3 9
Page 27
IDENT/IAFIS Interoperability Report 27/52U.S. Immigration and Customs Enforcement Page 27 of 52
Interoperability Statistics: U.S. Counties (From October 27, 2008 through April 30, 2011)
Alien IDENT Matches* Administratively Arrested or Booked into ICE Custody**
Removals and Returns**
State County AOR Activation
Date Submissions LESC L1 LESC L2/3 Total L1 L2 L3
Non-Criminal
Immigration Violator
Total L1 L2 L3
Non-Criminal
Immigration Violator
Total
OH Clermont DET 4/26/11 60 0 0 0 0 0 0 0 0 0 0 0 0 0
OH Clinton DET 4/5/11 71 0 0 0 0 0 0 0 0 0 0 0 0 0
OH Coshocton DET 2/8/11 77 0 0 0 0 0 0 0 0 0 0 0 0 0
OH Crawford DET 4/12/11 62 0 0 0 0 0 0 0 0 0 0 0 0 0
OH Cuyahoga DET 1/19/10 56,308 83 242 325 37 9 17 44 107 5 6 4 11 26
OH Darke DET 4/19/11 24 0 0 0 0 0 0 0 0 0 0 0 0 0
OH Delaware DET 3/1/11 436 1 1 2 0 0 0 1 1 0 0 0 1 1
OH Fairfield DET 2/8/11 422 0 4 4 0 0 2 1 3 0 0 1 0 1
OH Fayette DET 2/8/11 499 0 0 0 0 0 0 0 0 0 0 0 0 0
OH Franklin DET 1/19/10 30,934 102 789 891 29 41 115 188 373 17 25 99 135 276
OH Gallia DET 4/5/11 75 0 0 0 0 0 0 0 0 0 0 0 0 0
OH Geauga DET 3/1/11 158 1 1 2 0 0 0 0 0 0 0 0 0 0
OH Greene DET 4/19/11 81 0 0 0 0 0 0 0 0 0 0 0 0 0
OH Guernsey DET 2/8/11 168 0 1 1 0 0 0 1 1 0 0 0 0 0
OH Hamilton DET 7/20/10 21,990 11 162 173 11 16 49 12 88 9 14 33 6 62
OH Hancock DET 3/29/11 70 0 2 2 0 0 1 0 1 0 0 1 0 1
OH Hardin DET 3/29/11 29 0 0 0 0 0 0 0 0 0 0 0 0 0
OH Harrison DET 3/1/11 71 0 0 0 0 0 0 0 0 0 0 0 0 0
OH Henry DET 4/26/11 6 0 0 0 0 0 0 0 0 0 0 0 0 0
OH Highland DET 4/5/11 121 0 0 0 0 0 0 0 0 0 0 0 0 0
OH Hocking DET 2/8/11 65 0 0 0 0 0 0 0 0 0 0 0 0 0
OH Huron DET 3/29/11 45 0 1 1 0 0 0 0 0 0 0 0 0 0
OH Jackson DET 4/5/11 124 0 0 0 0 0 0 0 0 0 0 0 0 0
OH Jefferson DET 2/1/11 243 0 0 0 0 0 0 0 0 0 0 0 0 0
OH Knox DET 3/1/11 200 0 1 1 0 0 0 0 0 0 0 0 0 0
OH Lake DET 2/8/11 1,129 2 11 13 2 0 0 1 3 1 0 0 0 1
OH Lawrence DET 4/19/11 22 0 0 0 0 0 0 0 0 0 0 0 0 0
OH Licking DET 1/4/11 1,180 0 2 2 0 0 1 0 1 0 0 0 0 0
OH Logan DET 12/28/10 60 0 0 0 0 0 0 0 0 0 0 0 0 0
OH Lorain DET 3/22/11 1,299 2 0 2 0 0 0 0 0 0 0 0 0 0
OH Lucas DET 4/26/11 111 0 1 1 0 0 1 0 1 0 0 0 0 0
Page 28
IDENT/IAFIS Interoperability Report 28/52U.S. Immigration and Customs Enforcement Page 28 of 52
Interoperability Statistics: U.S. Counties (From October 27, 2008 through April 30, 2011)
Alien IDENT Matches* Administratively Arrested or Booked into ICE Custody**
Removals and Returns**
State County AOR Activation
Date Submissions LESC L1 LESC L2/3 Total L1 L2 L3
Non-Criminal
Immigration Violator
Total L1 L2 L3
Non-Criminal
Immigration Violator
Total
OH Madison DET 12/28/10 229 0 0 0 0 0 0 0 0 0 0 0 0 0
OH Marion DET 3/29/11 203 0 0 0 0 0 0 0 0 0 0 0 0 0
OH Miami DET 4/12/11 90 0 0 0 0 0 0 0 0 0 0 0 0 0
OH Monroe DET 2/22/11 26 0 0 0 0 0 0 0 0 0 0 0 0 0
OH Montgomery DET 7/13/10 9,005 10 52 62 4 8 4 11 27 2 7 3 4 16
OH Morgan DET 2/22/11 11 0 0 0 0 0 0 0 0 0 0 0 0 0
OH Morrow DET 2/22/11 88 0 1 1 0 0 0 0 0 0 0 0 0 0
OH Muskingum DET 12/28/10 467 0 0 0 0 0 0 0 0 0 0 0 0 0
OH Noble DET 2/22/11 8 0 0 0 0 0 0 0 0 0 0 0 0 0
OH Ottawa DET 3/29/11 62 0 0 0 0 0 0 0 0 0 0 0 0 0
OH Paulding DET 3/29/11 9 0 0 0 0 0 0 0 0 0 0 0 0 0
OH Perry DET 2/22/11 51 0 0 0 0 0 0 0 0 0 0 0 0 0
OH Pickaway DET 3/1/11 1,893 9 2 11 1 2 2 2 7 0 0 0 0 0
OH Pike DET 4/19/11 1 0 0 0 0 0 0 0 0 0 0 0 0 0
OH Portage DET 3/1/11 393 0 0 0 0 0 0 0 0 0 0 0 0 0
OH Preble DET 4/19/11 24 0 0 0 0 0 0 0 0 0 0 0 0 0
OH Putnam DET 4/26/11 10 0 0 0 0 0 0 0 0 0 0 0 0 0
OH Ross DET 4/26/11 35 0 0 0 0 0 0 0 0 0 0 0 0 0
OH Sandusky DET 3/29/11 140 1 0 1 0 0 0 0 0 0 0 0 0 0
OH Scioto DET 4/19/11 11 0 0 0 0 0 0 0 0 0 0 0 0 0
OH Seneca DET 3/29/11 107 0 0 0 0 0 0 0 0 0 0 0 0 0
OH Shelby DET 4/12/11 46 0 0 0 0 0 0 0 0 0 0 0 0 0
OH Summit DET 8/24/10 5,782 2 27 29 4 0 2 4 10 2 0 1 1 4
OH Trumbull DET 3/1/11 758 0 1 1 0 0 0 0 0 0 0 0 0 0
OH Union DET 12/28/10 876 0 0 0 0 0 0 0 0 0 0 0 0 0
OH Van Wert DET 4/26/11 4 0 0 0 0 0 0 0 0 0 0 0 0 0
OH Vinton DET 2/22/11 31 0 0 0 0 0 0 0 0 0 0 0 0 0
OH Warren DET 11/9/10 2,847 5 17 22 0 2 6 4 12 0 1 4 1 6
OH Washington DET 2/22/11 228 0 0 0 0 0 0 0 0 0 0 0 0 0
OH Wayne DET 4/12/11 83 0 1 1 0 0 0 0 0 0 0 0 0 0
OH Williams DET 3/29/11 45 0 1 1 0 0 0 1 1 0 0 0 1 1
Page 29
IDENT/IAFIS Interoperability Report 29/52U.S. Immigration and Customs Enforcement Page 29 of 52
Interoperability Statistics: U.S. Counties (From October 27, 2008 through April 30, 2011)
Alien IDENT Matches* Administratively Arrested or Booked into ICE Custody**
Removals and Returns**
State County AOR Activation
Date Submissions LESC L1 LESC L2/3 Total L1 L2 L3
Non-Criminal
Immigration Violator
Total L1 L2 L3
Non-Criminal
Immigration Violator
Total
OH Wood DET 3/29/11 126 0 0 0 0 0 0 0 0 0 0 0 0 0
OH Wyandot DET 3/29/11 19 0 0 0 0 0 0 0 0 0 0 0 0 0
OK Bryan DAL 12/7/10 660 0 6 6 1 0 0 0 1 1 0 0 0 1
OK Canadian DAL 11/30/10 995 1 10 11 0 0 1 1 2 0 0 1 1 2
OK Carter DAL 12/7/10 759 0 5 5 0 0 0 0 0 0 0 0 0 0
OK Cherokee DAL 12/7/10 613 0 5 5 0 1 0 1 2 0 1 0 1 2
OK Cleveland DAL 11/30/10 5,382 17 85 102 9 3 4 7 23 4 3 2 5 14
OK Comanche DAL 12/7/10 1,406 0 7 7 0 1 0 0 1 0 1 0 0 1
OK Creek DAL 12/7/10 922 1 6 7 0 0 2 0 2 0 0 2 0 2
OK Garfield DAL 11/30/10 1,060 0 17 17 1 2 0 0 3 1 1 0 0 2
OK Grady DAL 11/30/10 561 0 3 3 0 0 0 0 0 0 0 0 0 0
OK Kay DAL 12/7/10 495 1 3 4 0 1 0 0 1 0 0 0 0 0
OK Lincoln DAL 11/30/10 466 0 2 2 0 0 0 0 0 0 0 0 0 0
OK Logan DAL 11/30/10 371 1 1 2 0 0 1 0 1 0 0 0 0 0
OK McClain DAL 11/30/10 488 2 7 9 1 0 0 0 1 0 0 0 0 0
OK McIntosh DAL 12/14/10 250 0 1 1 0 0 0 0 0 0 0 0 0 0
OK Muskogee DAL 12/14/10 1,370 0 8 8 0 1 2 0 3 0 1 1 0 2
OK Okfuskee DAL 12/14/10 110 0 0 0 0 0 0 0 0 0 0 0 0 0
OK Oklahoma DAL 11/3/09 32,642 125 1,286 1,411 108 73 150 392 723 70 61 122 262 515
OK Okmulgee DAL 12/14/10 428 0 1 1 0 0 0 1 1 0 0 0 1 1
OK Osage DAL 12/7/10 237 0 0 0 0 0 0 0 0 0 0 0 0 0
OK Pawnee DAL 12/14/10 231 0 0 0 0 0 0 0 0 0 0 0 0 0
OK Payne DAL 12/7/10 1,018 0 9 9 1 0 0 0 1 1 0 0 0 1
OK Pittsburg DAL 12/14/10 146 0 2 2 0 0 1 0 1 0 0 1 0 1
OK Pontotoc DAL 12/7/10 311 1 1 2 0 0 0 0 0 0 0 0 0 0
OK Pottawatomie DAL 11/30/10 1,562 0 2 2 0 0 0 0 0 0 0 0 0 0
OK Rogers DAL 12/14/10 832 1 4 5 0 0 0 0 0 0 0 0 0 0
OK Sequoyah DAL 12/14/10 440 0 0 0 0 0 0 0 0 0 0 0 0 0
OK Stephens DAL 12/7/10 473 0 1 1 0 0 0 0 0 0 0 0 0 0
OK Tulsa DAL 11/3/09 25,028 68 560 628 78 111 78 58 325 53 96 65 20 234
OK Wagoner DAL 12/14/10 541 1 1 2 1 0 1 0 2 0 0 1 0 1
Page 30
IDENT/IAFIS Interoperability Report 30/52U.S. Immigration and Customs Enforcement Page 30 of 52
Interoperability Statistics: U.S. Counties (From October 27, 2008 through April 30, 2011)
Alien IDENT Matches* Administratively Arrested or Booked into ICE Custody**
Removals and Returns**
State County AOR Activation
Date Submissions LESC L1 LESC L2/3 Total L1 L2 L3
Non-Criminal
Immigration Violator
Total L1 L2 L3
Non-Criminal
Immigration Violator
Total
OK Washington DAL 12/14/10 546 2 3 5 3 0 0 0 3 2 0 0 0 2
OR Clackamas SEA 4/6/10 17,605 252 498 750 100 33 41 88 262 37 11 23 36 107
OR Columbia SEA 4/26/11 4 0 0 0 0 0 0 0 0 0 0 0 0 0
OR Marion SEA 5/4/10 13,629 128 605 733 115 30 59 163 367 57 11 46 83 197
OR Multnomah SEA 5/18/10 12,474 141 549 690 85 20 45 81 231 31 10 25 40 106
OR Washington SEA 8/31/10 12,028 108 563 671 103 67 73 30 273 37 35 40 9 121
PA Bucks PHI 12/16/08 34,557 133 2,838 2,971 146 72 156 167 541 33 20 54 50 157
PA Montgomery PHI 12/16/08 43,895 194 3,065 3,259 150 92 215 380 837 55 32 95 139 321
PA Philadelphia PHI 7/21/09 102,153 322 1,570 1,892 132 36 67 348 583 30 11 35 115 191
RI Bristol BOS 3/22/11 132 1 1 2 0 0 0 0 0 0 0 0 0 0
RI Kent BOS 3/22/11 423 2 3 5 0 0 0 2 2 0 0 0 0 0
RI Newport BOS 3/22/11 308 2 13 15 0 0 0 1 1 0 0 0 0 0
RI Providence BOS 3/22/11 2,368 30 111 141 5 1 1 14 21 0 0 0 1 1
RI Washington BOS 3/22/11 372 1 5 6 1 0 0 0 1 0 0 0 0 0
SC Abbeville ATL 2/15/11 193 0 0 0 0 0 0 0 0 0 0 0 0 0
SC Allendale ATL 11/16/10 24 0 0 0 0 0 0 0 0 0 0 0 0 0
SC Bamberg ATL 11/16/10 400 0 5 5 0 0 0 0 0 0 0 0 0 0
SC Barnwell ATL 11/16/10 613 0 1 1 0 0 0 0 0 0 0 0 0 0
SC Beaufort ATL 10/13/10 3,036 7 100 107 8 6 11 20 45 5 2 5 10 22
SC Berkeley ATL 10/13/10 2,965 4 77 81 4 1 7 15 27 1 1 2 5 9
SC Charleston ATL 9/8/10 19,262 40 787 827 28 66 226 324 644 16 38 166 214 434
SC Cherokee ATL 1/19/11 926 0 12 12 0 0 3 1 4 0 0 3 1 4
SC Chester ATL 3/15/11 559 0 6 6 0 0 0 2 2 0 0 0 0 0
SC Colleton ATL 12/14/10 762 1 8 9 0 0 2 0 2 0 0 2 0 2
SC Dorchester ATL 10/13/10 2,267 2 15 17 0 0 1 2 3 0 0 0 0 0
SC Greenville ATL 9/8/10 16,754 36 446 482 19 18 36 49 122 7 9 20 23 59
SC Greenwood ATL 1/19/11 682 1 10 11 0 0 1 1 2 0 0 1 0 1
SC Hampton ATL 12/14/10 164 0 0 0 0 0 0 0 0 0 0 0 0 0
SC Horry ATL 9/8/10 6,855 23 168 191 5 15 8 22 50 4 7 6 7 24
SC Jasper ATL 12/14/10 767 0 0 0 0 0 0 0 0 0 0 0 0 0
SC Kershaw ATL 4/12/11 218 0 0 0 0 0 0 0 0 0 0 0 0 0
Page 31
IDENT/IAFIS Interoperability Report 31/52U.S. Immigration and Customs Enforcement Page 31 of 52
Interoperability Statistics: U.S. Counties (From October 27, 2008 through April 30, 2011)
Alien IDENT Matches* Administratively Arrested or Booked into ICE Custody**
Removals and Returns**
State County AOR Activation
Date Submissions LESC L1 LESC L2/3 Total L1 L2 L3
Non-Criminal
Immigration Violator
Total L1 L2 L3
Non-Criminal
Immigration Violator
Total
SC Lancaster ATL 4/12/11 180 1 3 4 0 0 0 1 1 0 0 0 0 0
SC Laurens ATL 1/19/11 1,401 0 6 6 0 0 0 0 0 0 0 0 0 0
SC McCormick ATL 3/15/11 52 0 0 0 0 0 0 0 0 0 0 0 0 0
SC Oconee ATL 1/19/11 881 0 0 0 0 0 0 0 0 0 0 0 0 0
SC Orangeburg ATL 4/12/11 388 0 0 0 0 0 0 0 0 0 0 0 0 0
SC Richland ATL 4/12/11 1,590 3 10 13 1 0 0 1 2 0 0 0 0 0
SC Spartanburg ATL 2/15/11 2,730 6 43 49 1 5 3 6 15 0 4 1 5 10
SC Union ATL 3/15/11 268 0 0 0 0 0 0 0 0 0 0 0 0 0
SC York ATL 10/13/10 4,534 7 59 66 1 5 7 18 31 0 2 4 10 16
SD Custer SPM 8/31/10 65 0 0 0 0 0 0 0 0 0 0 0 0 0
SD Fall River SPM 8/31/10 163 0 2 2 0 0 1 0 1 0 0 0 0 0
SD Jackson SPM 8/31/10 30 0 0 0 0 0 0 0 0 0 0 0 0 0
SD Minnehaha SPM 6/22/10 7,807 41 245 286 15 6 6 8 35 1 3 6 4 14
SD Pennington SPM 6/22/10 4,648 4 24 28 3 1 2 2 8 3 1 2 1 7
TN Anderson NOL 12/28/10 1,302 2 3 5 2 1 0 0 3 0 0 0 0 0
TN Bedford NOL 12/28/10 680 0 18 18 1 0 1 4 6 1 0 1 4 6
TN Blount NOL 12/28/10 1,740 0 19 19 1 0 1 4 6 1 0 1 2 4
TN Bradley NOL 12/28/10 1,874 3 17 20 0 2 4 4 10 0 2 2 1 5
TN Carter NOL 12/28/10 1,261 1 5 6 2 0 1 0 3 0 0 0 0 0
TN Coffee NOL 12/28/10 1,171 1 13 14 2 1 0 1 4 1 0 0 0 1
TN Davidson NOL 8/10/10 38,859 151 1,145 1,296 76 64 160 361 661 48 45 105 105 303
TN Greene NOL 12/28/10 989 1 12 13 2 0 1 0 3 2 0 0 0 2
TN Hamblen NOL 12/28/10 1,149 6 38 44 1 2 0 4 7 1 1 0 3 5
TN Hamilton NOL 6/22/10 16,131 13 205 218 8 11 31 17 67 7 11 21 7 46
TN Jefferson NOL 12/28/10 1,003 0 3 3 0 0 0 0 0 0 0 0 0 0
TN Knox NOL 6/17/10 17,595 15 314 329 18 15 30 52 115 13 13 25 29 80
TN Madison NOL 12/28/10 2,263 1 21 22 1 0 4 5 10 1 0 3 2 6
TN McMinn NOL 12/28/10 1,076 1 10 11 2 0 2 1 5 0 0 1 1 2
TN Obion NOL 12/28/10 615 1 8 9 1 2 0 1 4 1 1 0 1 3
TN Roane NOL 12/28/10 990 0 1 1 0 1 0 0 1 0 0 0 0 0
TN Sevier NOL 12/28/10 1,655 2 37 39 2 0 0 1 3 1 0 0 0 1
Page 32
IDENT/IAFIS Interoperability Report 32/52U.S. Immigration and Customs Enforcement Page 32 of 52
Interoperability Statistics: U.S. Counties (From October 27, 2008 through April 30, 2011)
Alien IDENT Matches* Administratively Arrested or Booked into ICE Custody**
Removals and Returns**
State County AOR Activation
Date Submissions LESC L1 LESC L2/3 Total L1 L2 L3
Non-Criminal
Immigration Violator
Total L1 L2 L3
Non-Criminal
Immigration Violator
Total
TN Shelby NOL 6/22/10 42,777 73 940 1,013 42 83 69 83 277 27 46 40 27 140
TN Sullivan NOL 12/28/10 2,553 1 8 9 1 0 0 0 1 1 0 0 0 1
TN Warren NOL 12/28/10 616 1 23 24 4 2 2 3 11 0 1 2 2 5
TN Washington NOL 12/28/10 2,986 6 59 65 2 0 2 7 11 2 0 2 6 10
TX Anderson DAL 7/7/10 964 1 15 16 2 1 0 0 3 2 0 0 0 2
TX Andrews ELP 7/7/10 496 4 19 23 0 0 0 1 1 0 0 0 0 0
TX Angelina HOU 7/20/10 1,504 10 34 44 4 1 0 9 14 3 1 0 3 7
TX Aransas HOU 6/15/10 1,041 0 9 9 0 1 0 0 1 0 1 0 0 1
TX Archer DAL 8/10/10 201 0 1 1 0 0 0 0 0 0 0 0 0 0
TX Armstrong DAL 9/28/10 20 0 2 2 0 0 0 0 0 0 0 0 0 0
TX Atascosa SNA 6/8/10 1,338 5 37 42 2 3 7 5 17 1 3 3 3 10
TX Austin HOU 9/14/10 318 0 2 2 0 0 0 1 1 0 0 0 0 0
TX Bailey DAL 9/28/10 116 0 4 4 0 0 0 0 0 0 0 0 0 0
TX Bandera SNA 6/8/10 440 1 4 5 1 0 0 0 1 0 0 0 0 0
TX Bastrop SNA 6/22/10 2,667 80 266 346 64 58 75 30 227 7 7 20 7 41
TX Baylor DAL 8/10/10 74 0 0 0 0 0 0 0 0 0 0 0 0 0
TX Bee HOU 6/15/10 872 2 6 8 0 2 0 0 2 0 1 0 0 1
TX Bell SNA 5/25/10 8,449 16 138 154 12 6 12 24 54 5 3 8 18 34
TX Bexar SNA 6/16/09 88,010 504 3,491 3,995 427 317 693 443 1,880 273 215 549 185 1,222
TX Blanco SNA 6/22/10 112 1 3 4 0 0 0 0 0 0 0 0 0 0
TX Borden DAL 8/17/10 6 0 0 0 0 0 0 0 0 0 0 0 0 0
TX Bosque SNA 6/29/10 233 0 0 0 0 0 0 0 0 0 0 0 0 0
TX Bowie DAL 7/7/10 1,910 2 11 13 2 0 1 0 3 1 0 1 0 2
TX Brazoria HOU 9/16/09 4,141 22 125 147 10 4 2 20 36 7 3 2 10 22
TX Brazos HOU 9/14/10 3,521 19 93 112 4 6 10 20 40 3 5 9 4 21
TX Brewster ELP 6/24/09 340 0 4 4 0 0 0 2 2 0 0 0 1 1
TX Briscoe DAL 9/21/10 21 0 0 0 0 0 0 0 0 0 0 0 0 0
TX Brooks HOU 6/9/09 937 17 58 75 2 1 5 50 58 1 1 5 3 10
TX Brown DAL 8/10/10 1,072 3 6 9 0 0 0 0 0 0 0 0 0 0
TX Burleson HOU 9/14/10 252 1 6 7 0 0 0 0 0 0 0 0 0 0
TX Burnet SNA 6/8/10 1,171 2 30 32 1 6 6 1 14 0 4 2 0 6
Page 33
IDENT/IAFIS Interoperability Report 33/52U.S. Immigration and Customs Enforcement Page 33 of 52
Interoperability Statistics: U.S. Counties (From October 27, 2008 through April 30, 2011)
Alien IDENT Matches* Administratively Arrested or Booked into ICE Custody**
Removals and Returns**
State County AOR Activation
Date Submissions LESC L1 LESC L2/3 Total L1 L2 L3
Non-Criminal
Immigration Violator
Total L1 L2 L3
Non-Criminal
Immigration Violator
Total
TX Caldwell SNA 6/22/10 997 5 30 35 3 4 3 4 14 1 1 2 2 6
TX Calhoun HOU 6/15/10 661 4 12 16 1 1 1 1 4 0 1 0 0 1
TX Callahan DAL 8/10/10 158 0 0 0 0 0 0 0 0 0 0 0 0 0
TX Cameron SNA 7/27/10 7,333 22 92 114 8 7 12 24 51 2 2 10 11 25
TX Camp DAL 7/7/10 274 0 11 11 0 1 0 1 2 0 1 0 1 2
TX Carson DAL 9/28/10 102 1 1 2 0 0 0 0 0 0 0 0 0 0
TX Cass DAL 7/7/10 383 0 0 0 0 0 0 0 0 0 0 0 0 0
TX Castro DAL 9/28/10 89 0 8 8 0 0 3 1 4 0 0 3 1 4
TX Chambers HOU 7/20/10 738 2 19 21 0 2 3 3 8 0 0 2 3 5
TX Cherokee DAL 7/7/10 1,376 0 23 23 1 3 3 1 8 1 3 3 1 8
TX Childress DAL 9/28/10 135 0 1 1 0 0 0 0 0 0 0 0 0 0
TX Clay DAL 8/10/10 101 0 0 0 0 0 0 0 0 0 0 0 0 0
TX Cochran DAL 9/21/10 30 2 1 3 1 0 1 0 2 0 0 1 0 1
TX Coke DAL 8/24/10 31 0 0 0 0 0 0 0 0 0 0 0 0 0
TX Coleman DAL 8/10/10 118 0 2 2 0 0 0 0 0 0 0 0 0 0
TX Collin DAL 1/21/09 28,356 180 1,795 1,975 132 66 189 283 670 89 48 155 204 496
TX Collingsworth DAL 9/28/10 32 0 1 1 0 0 0 1 1 0 0 0 1 1
TX Colorado HOU 7/20/10 386 0 0 0 0 0 0 0 0 0 0 0 0 0
TX Comal SNA 6/29/10 3,770 9 116 125 7 7 24 26 64 4 4 14 10 32
TX Comanche DAL 8/10/10 316 0 8 8 0 2 1 0 3 0 2 1 0 3
TX Concho DAL 8/24/10 62 0 0 0 0 0 0 0 0 0 0 0 0 0
TX Cooke DAL 8/3/10 505 3 18 21 2 3 2 4 11 1 2 2 4 9
TX Coryell SNA 6/29/10 1,281 1 7 8 0 0 1 1 2 0 0 1 1 2
TX Cottle DAL 9/21/10 12 0 0 0 0 0 0 0 0 0 0 0 0 0
TX Crane ELP 7/7/10 87 2 7 9 0 0 0 1 1 0 0 0 1 1
TX Crockett DAL 8/24/10 162 1 5 6 0 0 0 0 0 0 0 0 0 0
TX Crosby DAL 9/21/10 61 0 2 2 2 0 0 0 2 0 0 0 0 0
TX Culberson ELP 7/14/09 112 0 7 7 0 0 0 1 1 0 0 0 0 0
TX Dallam DAL 9/28/10 138 0 5 5 0 0 1 0 1 0 0 1 0 1
TX Dallas DAL 11/12/08 154,603 1,610 10,017 11,627 1,280 616 1,511 1,685 5,092 918 486 1,294 1,228 3,926
TX Dawson DAL 8/24/10 240 0 0 0 0 0 0 0 0 0 0 0 0 0
Page 34
IDENT/IAFIS Interoperability Report 34/52U.S. Immigration and Customs Enforcement Page 34 of 52
Interoperability Statistics: U.S. Counties (From October 27, 2008 through April 30, 2011)
Alien IDENT Matches* Administratively Arrested or Booked into ICE Custody**
Removals and Returns**
State County AOR Activation
Date Submissions LESC L1 LESC L2/3 Total L1 L2 L3
Non-Criminal
Immigration Violator
Total L1 L2 L3
Non-Criminal
Immigration Violator
Total
TX Deaf Smith DAL 9/28/10 391 1 23 24 1 2 4 7 14 1 1 3 7 12
TX Delta DAL 7/7/10 154 0 0 0 0 0 0 0 0 0 0 0 0 0
TX Denton DAL 1/28/09 17,163 127 875 1,002 103 49 162 166 480 68 39 131 129 367
TX DeWitt HOU 7/20/10 524 1 4 5 1 0 0 1 2 0 0 0 0 0
TX Dickens DAL 9/21/10 16 0 1 1 0 0 0 0 0 0 0 0 0 0
TX Dimmit SNA 6/16/09 663 7 16 23 0 0 2 8 10 0 0 0 1 1
TX Donley DAL 9/28/10 41 0 0 0 0 0 0 0 0 0 0 0 0 0
TX Duval SNA 6/8/10 421 1 1 2 0 0 0 0 0 0 0 0 0 0
TX Eastland DAL 8/10/10 336 2 10 12 0 0 0 2 2 0 0 0 1 1
TX Ector ELP 7/7/10 4,007 21 98 119 5 6 9 16 36 2 3 7 3 15
TX Edwards SNA 6/8/10 41 0 0 0 0 0 0 0 0 0 0 0 0 0
TX El Paso ELP 6/17/09 33,966 923 4,392 5,315 403 195 927 1,740 3,265 214 122 664 719 1,719
TX Ellis DAL 8/3/10 2,120 8 43 51 2 2 1 6 11 0 2 0 3 5
TX Erath DAL 8/10/10 518 0 2 2 0 0 0 1 1 0 0 0 1 1
TX Falls SNA 6/29/10 346 2 9 11 1 0 1 3 5 0 0 1 1 2
TX Fannin DAL 7/7/10 578 0 1 1 0 0 0 1 1 0 0 0 0 0
TX Fayette HOU 6/15/10 361 1 12 13 0 1 0 2 3 0 1 0 2 3
TX Fisher DAL 8/10/10 33 0 2 2 0 0 0 0 0 0 0 0 0 0
TX Floyd DAL 9/21/10 49 0 1 1 0 0 0 0 0 0 0 0 0 0
TX Foard DAL 8/10/10 37 0 0 0 0 0 0 0 0 0 0 0 0 0
TX Fort Bend HOU 9/16/09 12,967 86 645 731 57 29 49 76 211 28 20 30 22 100
TX Franklin DAL 7/7/10 147 2 1 3 0 0 1 0 1 0 0 1 0 1
TX Freestone SNA 6/29/10 344 2 11 13 0 2 0 2 4 0 0 0 1 1
TX Frio SNA 6/8/10 596 1 11 12 1 0 0 2 3 1 0 0 2 3
TX Gaines DAL 8/17/10 251 1 5 6 0 0 1 0 1 0 0 0 0 0
TX Galveston HOU 9/22/09 15,880 57 319 376 26 25 37 38 126 19 16 31 14 80
TX Garza DAL 9/21/10 100 0 1 1 0 0 0 0 0 0 0 0 0 0
TX Gillespie SNA 6/8/10 490 5 29 34 1 5 8 2 16 1 2 5 2 10
TX Glasscock DAL 8/24/10 15 0 0 0 0 0 0 0 0 0 0 0 0 0
TX Goliad HOU 7/20/10 144 0 3 3 0 0 0 0 0 0 0 0 0 0
TX Gonzales SNA 6/8/10 602 6 32 38 0 1 7 14 22 0 1 6 9 16
Page 35
IDENT/IAFIS Interoperability Report 35/52U.S. Immigration and Customs Enforcement Page 35 of 52
Interoperability Statistics: U.S. Counties (From October 27, 2008 through April 30, 2011)
Alien IDENT Matches* Administratively Arrested or Booked into ICE Custody**
Removals and Returns**
State County AOR Activation
Date Submissions LESC L1 LESC L2/3 Total L1 L2 L3
Non-Criminal
Immigration Violator
Total L1 L2 L3
Non-Criminal
Immigration Violator
Total
TX Gray DAL 9/28/10 384 0 10 10 0 0 1 1 2 0 0 1 2 3
TX Grayson DAL 2/9/09 9,138 41 239 280 19 12 27 42 100 12 8 21 31 72
TX Gregg DAL 7/7/10 3,834 22 110 132 6 9 12 15 42 4 5 7 10 26
TX Grimes HOU 9/14/10 292 1 2 3 1 0 0 0 1 1 0 0 0 1
TX Guadalupe SNA 6/8/10 1,967 12 52 64 11 4 7 8 30 2 4 4 4 14
TX Hale DAL 9/28/10 677 3 20 23 0 0 1 7 8 0 0 1 6 7
TX Hall DAL 9/28/10 53 1 0 1 0 0 0 0 0 0 0 0 0 0
TX Hamilton SNA 6/29/10 218 0 0 0 0 0 0 0 0 0 0 0 0 0
TX Hansford DAL 9/28/10 33 0 3 3 0 0 1 0 1 0 0 1 0 1
TX Hardeman DAL 8/10/10 109 0 2 2 0 0 0 0 0 0 0 0 0 0
TX Hardin HOU 7/20/10 1,146 0 8 8 1 1 2 1 5 0 1 1 1 3
TX Harris HOU 10/27/08 322,068 3,288 27,372 30,660 4,159 2,606 5,610 2,943 15,318 3,141 1,945 4,758 1,184 11,028
TX Harrison DAL 7/7/10 1,362 4 40 44 2 4 11 12 29 0 3 9 6 18
TX Hartley DAL 9/28/10 9 0 0 0 0 0 0 0 0 0 0 0 0 0
TX Haskell DAL 8/10/10 77 1 1 2 0 0 0 0 0 0 0 0 0 0
TX Hays SNA 6/8/10 4,154 26 143 169 14 18 21 17 70 4 10 15 7 36
TX Hemphill DAL 5/4/10 67 1 5 6 1 0 2 0 3 2 0 2 0 4
TX Henderson DAL 7/7/10 1,616 6 14 20 0 0 1 0 1 0 0 0 0 0
TX Hidalgo SNA 6/10/09 32,361 1,256 3,903 5,159 930 672 707 744 3,053 515 485 590 311 1,901
TX Hill SNA 6/29/10 1,010 8 40 48 2 3 4 8 17 1 1 4 3 9
TX Hockley DAL 9/21/10 615 1 9 10 1 0 1 1 3 1 0 0 1 2
TX Hood DAL 8/3/10 823 4 20 24 1 0 5 1 7 1 0 4 1 6
TX Hopkins DAL 7/7/10 832 4 7 11 0 0 1 4 5 0 0 1 3 4
TX Houston HOU 9/14/10 313 2 1 3 2 0 0 0 2 0 0 0 0 0
TX Howard DAL 8/24/10 1,065 2 8 10 0 1 2 1 4 0 0 2 0 2
TX Hudspeth ELP 7/14/09 577 14 21 35 2 1 10 13 26 0 1 8 3 12
TX Hunt DAL 2/3/09 4,835 17 95 112 17 3 6 23 49 10 3 6 20 39
TX Hutchinson DAL 9/28/10 455 2 12 14 2 0 2 2 6 0 0 1 2 3
TX Irion DAL 8/24/10 17 1 0 1 0 0 0 0 0 0 0 0 0 0
TX Jack DAL 8/3/10 87 0 0 0 0 0 0 0 0 0 0 0 0 0
TX Jackson HOU 6/15/10 474 3 10 13 1 0 0 1 2 0 0 0 0 0
Page 36
IDENT/IAFIS Interoperability Report 36/52U.S. Immigration and Customs Enforcement Page 36 of 52
Interoperability Statistics: U.S. Counties (From October 27, 2008 through April 30, 2011)
Alien IDENT Matches* Administratively Arrested or Booked into ICE Custody**
Removals and Returns**
State County AOR Activation
Date Submissions LESC L1 LESC L2/3 Total L1 L2 L3
Non-Criminal
Immigration Violator
Total L1 L2 L3
Non-Criminal
Immigration Violator
Total
TX Jasper HOU 7/20/10 1,088 1 8 9 2 1 0 3 6 1 0 0 2 3
TX Jeff Davis ELP 6/24/09 5 0 0 0 0 0 0 0 0 0 0 0 0 0
TX Jefferson HOU 9/28/09 10,386 46 204 250 10 14 12 32 68 5 12 8 16 41
TX Jim Hogg SNA 6/8/10 197 1 3 4 0 0 0 3 3 0 0 0 0 0
TX Jim Wells HOU 6/9/09 1,706 1 10 11 0 0 0 1 1 0 0 0 0 0
TX Johnson DAL 2/10/09 5,373 24 165 189 18 7 18 24 67 8 6 16 18 48
TX Jones DAL 8/10/10 181 0 0 0 0 0 0 0 0 0 0 0 0 0
TX Karnes SNA 6/8/10 266 0 6 6 0 0 1 1 2 0 0 1 0 1
TX Kaufman DAL 2/24/09 4,614 25 76 101 14 6 7 18 45 6 6 5 10 27
TX Kendall SNA 6/8/10 455 6 17 23 1 2 4 2 9 0 2 4 1 7
TX Kenedy HOU 6/10/09 454 0 26 26 1 1 3 18 23 0 0 1 1 2
TX Kent DAL 8/10/10 7 0 0 0 0 0 0 0 0 0 0 0 0 0
TX Kerr SNA 6/29/10 2,134 13 68 81 6 8 15 10 39 3 2 7 6 18
TX Kimble SNA 6/8/10 141 1 3 4 0 0 0 0 0 0 0 0 0 0
TX King DAL 8/10/10 3 0 0 0 0 0 0 0 0 0 0 0 0 0
TX Kinney SNA 12/16/08 108 1 5 6 0 0 0 2 2 0 0 0 0 0
TX Kleberg HOU 6/9/09 2,146 17 84 101 7 3 8 48 66 3 0 3 3 9
TX Knox DAL 8/10/10 69 0 0 0 0 0 0 0 0 0 0 0 0 0
TX La Salle SNA 6/8/10 175 1 4 5 0 0 0 3 3 0 0 0 1 1
TX Lamar DAL 7/7/10 2,079 1 12 13 0 0 1 1 2 0 0 1 0 1
TX Lamb DAL 9/28/10 229 0 0 0 0 0 0 0 0 0 0 0 0 0
TX Lampasas SNA 6/29/10 450 0 13 13 0 0 1 4 5 0 1 1 3 5
TX Lavaca HOU 6/15/10 337 0 7 7 0 0 0 4 4 0 0 0 2 2
TX Lee HOU 9/14/10 317 1 15 16 0 0 2 4 6 0 0 1 2 3
TX Leon HOU 9/14/10 145 1 4 5 0 0 2 0 2 0 0 2 0 2
TX Liberty HOU 7/20/10 1,911 5 32 37 4 3 7 3 17 3 2 5 2 12
TX Limestone SNA 6/29/10 803 0 11 11 2 1 1 3 7 0 0 1 2 3
TX Lipscomb DAL 9/28/10 19 0 2 2 0 0 1 1 2 0 0 1 1 2
TX Live Oak HOU 6/15/10 217 0 0 0 0 0 0 0 0 0 0 0 0 0
TX Llano SNA 6/22/10 423 0 8 8 1 0 0 2 3 1 0 0 0 1
TX Loving ELP 7/7/10 0 0 0 0 0 0 0 0 0 0 0 0 0 0
Page 37
IDENT/IAFIS Interoperability Report 37/52U.S. Immigration and Customs Enforcement Page 37 of 52
Interoperability Statistics: U.S. Counties (From October 27, 2008 through April 30, 2011)
Alien IDENT Matches* Administratively Arrested or Booked into ICE Custody**
Removals and Returns**
State County AOR Activation
Date Submissions LESC L1 LESC L2/3 Total L1 L2 L3
Non-Criminal
Immigration Violator
Total L1 L2 L3
Non-Criminal
Immigration Violator
Total
TX Lubbock DAL 5/4/10 7,473 17 72 89 1 2 6 12 21 0 1 6 8 15
TX Lynn DAL 9/21/10 68 0 0 0 0 0 0 0 0 0 0 0 0 0
TX Madison HOU 9/14/10 203 0 9 9 2 0 1 0 3 0 0 1 0 1
TX Marion DAL 7/7/10 238 1 0 1 0 0 0 0 0 0 0 0 0 0
TX Martin ELP 7/7/10 55 0 1 1 0 1 0 0 1 0 1 0 0 1
TX Mason SNA 6/22/10 65 0 1 1 0 0 0 0 0 0 0 0 0 0
TX Matagorda HOU 6/15/10 965 1 25 26 3 2 1 1 7 2 1 0 0 3
TX Maverick SNA 12/9/08 1,147 15 51 66 1 5 4 14 24 1 4 6 2 13
TX McCulloch SNA 6/22/10 0 0 0 0 0 0 0 0 0 0 0 0 0 0
TX McLennan SNA 1/26/10 10,369 47 238 285 15 11 19 73 118 10 5 15 40 70
TX McMullen SNA 6/8/10 19 2 2 4 0 1 0 0 1 0 1 0 0 1
TX Medina SNA 6/8/10 1,105 2 27 29 2 0 2 3 7 1 0 1 2 4
TX Menard DAL 8/24/10 60 0 0 0 0 0 0 0 0 0 0 0 0 0
TX Midland ELP 7/7/10 3,808 17 90 107 8 9 11 16 44 2 4 1 5 12
TX Milam HOU 9/14/10 387 0 4 4 0 0 1 2 3 0 0 1 0 1
TX Mills DAL 8/10/10 61 0 0 0 0 0 0 0 0 0 0 0 0 0
TX Mitchell DAL 8/17/10 144 0 0 0 0 0 0 0 0 0 0 0 0 0
TX Montague DAL 8/3/10 349 0 1 1 0 0 0 0 0 0 0 0 0 0
TX Montgomery HOU 9/16/09 13,561 96 522 618 89 49 94 105 337 63 31 81 39 214
TX Moore DAL 9/28/10 443 8 64 72 1 0 2 4 7 1 0 0 0 1
TX Morris DAL 7/7/10 291 1 1 2 0 1 0 1 2 0 1 0 1 2
TX Motley DAL 9/21/10 7 0 0 0 0 0 0 0 0 0 0 0 0 0
TX Nacogdoches HOU 7/20/10 2,193 12 70 82 3 2 5 16 26 3 2 4 4 13
TX Navarro DAL 8/3/10 1,414 11 62 73 2 4 6 8 20 2 3 4 5 14
TX Newton HOU 7/20/10 230 0 0 0 0 0 0 0 0 0 0 0 0 0
TX Nolan DAL 9/21/10 358 1 6 7 0 0 1 2 3 0 0 1 1 2
TX Nueces HOU 6/19/09 19,092 66 298 364 26 19 24 72 141 12 14 17 29 72
TX Ochiltree DAL 9/28/10 148 3 17 20 1 1 1 6 9 1 0 1 4 6
TX Oldham DAL 9/28/10 15 0 0 0 0 0 0 0 0 0 0 0 0 0
TX Orange HOU 7/20/10 2,763 4 21 25 0 0 0 2 2 0 0 0 1 1
TX Palo Pinto DAL 8/10/10 434 3 4 7 0 0 1 0 1 0 0 1 0 1
Page 38
IDENT/IAFIS Interoperability Report 38/52U.S. Immigration and Customs Enforcement Page 38 of 52
Interoperability Statistics: U.S. Counties (From October 27, 2008 through April 30, 2011)
Alien IDENT Matches* Administratively Arrested or Booked into ICE Custody**
Removals and Returns**
State County AOR Activation
Date Submissions LESC L1 LESC L2/3 Total L1 L2 L3
Non-Criminal
Immigration Violator
Total L1 L2 L3
Non-Criminal
Immigration Violator
Total
TX Panola DAL 7/7/10 422 0 2 2 0 0 0 1 1 0 0 0 1 1
TX Parker DAL 8/3/10 1,466 4 23 27 1 1 0 7 9 0 0 0 2 2
TX Parmer DAL 9/28/10 130 0 9 9 0 0 1 0 1 0 0 1 0 1
TX Pecos ELP 6/24/09 545 4 24 28 2 0 0 1 3 0 0 0 0 0
TX Polk HOU 7/20/10 938 3 5 8 0 0 0 1 1 0 0 0 0 0
TX Potter DAL 5/4/10 8,815 57 293 350 10 11 15 28 64 4 9 8 22 43
TX Presidio ELP 6/17/09 14 0 0 0 0 0 0 0 0 0 0 0 0 0
TX Rains DAL 7/7/10 251 0 6 6 0 0 2 1 3 0 0 0 1 1
TX Randall DAL 5/4/10 1,465 3 14 17 1 0 1 0 2 0 0 1 0 1
TX Reagan DAL 8/24/10 90 0 5 5 0 0 0 1 1 0 0 0 0 0
TX Real SNA 12/16/08 131 0 1 1 0 0 0 0 0 0 0 0 0 0
TX Red River DAL 7/7/10 267 0 0 0 0 0 0 0 0 0 0 0 0 0
TX Reeves ELP 7/7/10 283 3 5 8 0 0 0 0 0 0 0 0 0 0
TX Refugio HOU 7/20/10 163 5 6 11 0 0 0 1 1 0 1 0 0 1
TX Roberts DAL 9/28/10 3 0 0 0 0 0 0 0 0 0 0 0 0 0
TX Robertson HOU 9/14/10 409 0 3 3 0 0 0 0 0 0 0 0 0 0
TX Rockwall DAL 8/3/10 1,528 9 59 68 4 3 6 11 24 4 3 4 6 17
TX Runnels DAL 8/10/10 179 0 2 2 0 0 0 0 0 0 0 0 0 0
TX Rusk DAL 7/7/10 687 1 10 11 0 0 0 3 3 0 0 0 2 2
TX Sabine HOU 8/3/10 108 0 0 0 0 0 0 0 0 0 0 0 0 0
TX San Augustine HOU 7/20/10 271 1 0 1 0 0 0 1 1 0 0 0 1 1
TX San Jacinto HOU 9/14/10 300 1 1 2 0 0 0 0 0 0 0 0 0 0
TX San Patricio HOU 6/15/10 1,386 4 9 13 0 1 0 0 1 0 0 0 0 0
TX San Saba SNA 6/22/10 117 1 0 1 0 0 0 1 1 0 0 0 1 1
TX Schleicher DAL 8/24/10 69 0 4 4 0 0 0 0 0 0 0 0 0 0
TX Scurry DAL 8/17/10 673 1 16 17 0 0 1 1 2 0 0 1 0 1
TX Shackelford DAL 8/10/10 43 0 0 0 0 0 0 0 0 0 0 0 0 0
TX Shelby HOU 7/20/10 507 0 1 1 0 0 0 0 0 0 0 0 0 0
TX Sherman DAL 9/28/10 22 0 1 1 0 0 0 1 1 0 0 0 0 0
TX Smith DAL 7/7/10 3,954 19 98 117 7 4 9 10 30 2 2 5 8 17
TX Somervell SNA 6/29/10 178 1 4 5 0 0 0 0 0 0 0 0 0 0
Page 39
IDENT/IAFIS Interoperability Report 39/52U.S. Immigration and Customs Enforcement Page 39 of 52
Interoperability Statistics: U.S. Counties (From October 27, 2008 through April 30, 2011)
Alien IDENT Matches* Administratively Arrested or Booked into ICE Custody**
Removals and Returns**
State County AOR Activation
Date Submissions LESC L1 LESC L2/3 Total L1 L2 L3
Non-Criminal
Immigration Violator
Total L1 L2 L3
Non-Criminal
Immigration Violator
Total
TX Starr SNA 6/9/09 2,281 88 291 379 51 28 48 55 182 26 20 33 30 109
TX Stephens DAL 8/10/10 218 0 7 7 0 0 0 2 2 0 0 0 2 2
TX Sterling DAL 8/17/10 27 0 1 1 0 0 0 0 0 0 0 0 0 0
TX Stonewall DAL 8/31/10 33 1 0 1 0 0 0 0 0 0 0 0 0 0
TX Sutton DAL 8/24/10 60 0 1 1 0 0 0 0 0 0 0 0 0 0
TX Swisher DAL 9/28/10 76 2 2 4 1 0 0 0 1 1 0 0 1 2
TX Tarrant DAL 8/18/09 49,959 308 2,224 2,532 190 138 182 380 890 117 106 147 266 636
TX Taylor DAL 8/10/10 3,311 4 29 33 1 0 0 3 4 1 0 0 1 2
TX Terrell ELP 6/17/09 29 2 10 12 6 0 1 5 12 5 0 1 0 6
TX Terry DAL 9/21/10 214 1 1 2 0 0 0 1 1 0 0 0 1 1
TX Throckmorton DAL 8/10/10 11 0 0 0 0 0 0 0 0 0 0 0 0 0
TX Titus DAL 7/7/10 859 6 26 32 2 0 1 12 15 1 0 1 6 8
TX Tom Green DAL 8/24/10 3,408 6 45 51 1 0 0 4 5 0 0 0 2 2
TX Travis SNA 6/16/09 65,579 530 4,101 4,631 502 451 941 823 2,717 329 314 773 478 1,894
TX Trinity HOU 9/14/10 221 1 0 1 0 0 0 0 0 0 0 0 0 0
TX Tyler HOU 7/20/10 299 0 1 1 0 0 0 1 1 0 0 0 0 0
TX Upshur DAL 7/7/10 619 0 5 5 1 0 0 0 1 1 0 0 0 1
TX Upton ELP 7/7/10 70 0 0 0 0 0 0 0 0 0 0 0 0 0
TX Uvalde SNA 1/21/09 2,077 5 39 44 2 0 1 8 11 1 0 2 1 4
TX Val Verde SNA 12/9/08 1,691 27 113 140 17 5 5 18 45 10 4 4 8 26
TX Van Zandt DAL 7/7/10 634 1 9 10 0 0 1 0 1 0 0 1 0 1
TX Victoria HOU 6/15/10 2,147 14 27 41 2 2 1 13 18 2 1 1 1 5
TX Walker HOU 5/18/09 133,699 4,059 3,680 7,739 1,794 1,008 869 415 4,086 658 387 419 23 1,487
TX Waller HOU 9/14/10 715 11 39 50 4 1 2 14 21 0 1 2 5 8
TX Ward ELP 7/7/10 285 3 3 6 0 0 1 0 1 0 0 0 0 0
TX Washington HOU 9/14/10 650 0 15 15 0 1 1 1 3 0 1 1 0 2
TX Webb SNA 6/16/09 12,303 318 1,449 1,767 134 46 191 540 911 63 28 159 375 625
TX Wharton HOU 6/15/10 1,562 8 81 89 7 1 4 10 22 1 1 2 2 6
TX Wheeler DAL 9/28/10 63 1 2 3 0 0 0 0 0 0 0 0 0 0
TX Wichita DAL 8/10/10 4,359 8 45 53 1 0 6 2 9 1 0 2 1 4
TX Wilbarger DAL 8/31/10 308 0 0 0 0 0 0 0 0 0 0 0 0 0
Page 40
IDENT/IAFIS Interoperability Report 40/52U.S. Immigration and Customs Enforcement Page 40 of 52
Interoperability Statistics: U.S. Counties (From October 27, 2008 through April 30, 2011)
Alien IDENT Matches* Administratively Arrested or Booked into ICE Custody**
Removals and Returns**
State County AOR Activation
Date Submissions LESC L1 LESC L2/3 Total L1 L2 L3
Non-Criminal
Immigration Violator
Total L1 L2 L3
Non-Criminal
Immigration Violator
Total
TX Willacy SNA 6/15/09 342 2 1 3 0 0 0 0 0 0 0 0 0 0
TX Williamson SNA 1/26/10 10,390 56 408 464 28 31 94 56 209 17 15 62 24 118
TX Wilson SNA 6/8/10 466 2 3 5 0 0 1 2 3 0 0 0 0 0
TX Winkler ELP 7/7/10 186 1 3 4 0 0 0 0 0 0 0 0 0 0
TX Wise DAL 8/3/10 869 3 20 23 1 2 1 0 4 1 2 1 0 4
TX Wood DAL 7/7/10 571 3 11 14 0 0 1 1 2 0 0 1 0 1
TX Yoakum DAL 9/21/10 47 1 6 7 0 2 0 2 4 0 1 0 0 1
TX Young DAL 8/10/10 221 0 2 2 0 0 0 0 0 0 0 0 0 0
TX Zapata SNA 6/16/09 1,146 38 148 186 13 6 24 47 90 5 2 19 30 56
TX Zavala SNA 1/28/09 440 1 13 14 0 0 1 2 3 0 0 1 0 1
UT Beaver SLC 6/8/10 175 0 4 4 1 0 0 0 1 1 0 0 0 1
UT Box Elder SLC 4/20/10 920 7 17 24 2 1 4 4 11 1 1 3 4 9
UT Cache SLC 5/18/10 1,855 5 29 34 0 0 2 3 5 0 0 1 2 3
UT Davis SLC 3/30/10 5,863 20 139 159 19 7 11 29 66 8 3 8 11 30
UT Iron SLC 7/27/10 998 6 28 34 11 5 9 1 26 9 4 8 0 21
UT Millard SLC 7/27/10 250 1 9 10 2 2 0 1 5 0 2 0 1 3
UT Salt Lake SLC 3/23/10 40,676 489 1,783 2,272 366 198 195 311 1,070 176 112 137 230 655
UT Sevier SLC 6/8/10 576 2 7 9 0 0 2 0 2 0 0 1 0 1
UT Summit SLC 3/15/11 114 3 9 12 1 1 0 0 2 1 1 0 0 2
UT Tooele SLC 3/15/11 121 2 1 3 0 0 0 0 0 0 0 0 0 0
UT Utah SLC 3/30/10 9,390 52 230 282 47 21 32 27 127 31 14 21 15 81
UT Washington SLC 6/8/10 3,981 33 97 130 30 12 22 10 74 14 8 13 4 39
UT Weber SLC 4/27/10 8,916 41 210 251 29 28 43 29 129 19 18 28 14 79
VA Accomack WAS 6/8/10 414 1 15 16 3 0 4 2 9 0 0 3 0 3
VA Albemarle WAS 6/8/10 2,310 9 82 91 12 10 4 18 44 3 4 1 4 12
VA Alexandria city WAS 3/30/10 3,308 65 309 374 41 15 22 29 107 11 4 7 7 29
VA Alleghany WAS 6/15/10 494 0 1 1 0 0 0 0 0 0 0 0 0 0
VA Amelia WAS 6/2/10 352 1 1 2 0 0 0 0 0 0 0 0 0 0
VA Amherst WAS 6/15/10 1,164 0 12 12 1 0 1 1 3 0 0 0 1 1
VA Appomattox WAS 6/15/10 335 0 1 1 0 0 0 0 0 0 0 0 0 0
VA Arlington WAS 4/1/10 4,716 90 604 694 34 25 33 63 155 13 14 20 18 65
Page 41
IDENT/IAFIS Interoperability Report 41/52U.S. Immigration and Customs Enforcement Page 41 of 52
Interoperability Statistics: U.S. Counties (From October 27, 2008 through April 30, 2011)
Alien IDENT Matches* Administratively Arrested or Booked into ICE Custody**
Removals and Returns**
State County AOR Activation
Date Submissions LESC L1 LESC L2/3 Total L1 L2 L3
Non-Criminal
Immigration Violator
Total L1 L2 L3
Non-Criminal
Immigration Violator
Total
VA Augusta WAS 6/8/10 1,358 1 11 12 0 0 0 0 0 0 0 0 0 0
VA Bath WAS 6/15/10 46 0 0 0 0 0 0 0 0 0 0 0 0 0
VA Bedford WAS 6/15/10 1,278 0 9 9 4 0 0 1 5 0 0 0 0 0
VA Bedford city WAS 6/15/10 0 0 0 0 0 0 0 0 0 0 0 0 0 0
VA Bland WAS 6/15/10 79 0 0 0 0 0 0 0 0 0 0 0 0 0
VA Botetourt WAS 6/15/10 807 1 13 14 0 0 2 4 6 0 0 0 0 0
VA Bristol city WAS 6/15/10 814 1 3 4 0 1 0 0 1 0 0 0 0 0
VA Brunswick WAS 5/18/10 681 1 7 8 1 1 0 0 2 0 1 0 0 1
VA Buchanan WAS 6/15/10 599 1 0 1 0 1 0 0 1 0 1 0 0 1
VA Buckingham WAS 6/2/10 393 1 2 3 0 0 0 0 0 0 0 0 0 0
VA Buena Vista city WAS 6/15/10 239 0 1 1 0 0 1 0 1 0 0 0 0 0
VA Campbell WAS 6/15/10 1,199 0 10 10 0 0 1 1 2 0 0 0 0 0
VA Caroline WAS 5/18/10 968 4 17 21 0 0 3 5 8 0 0 0 3 3
VA Carroll WAS 6/15/10 556 3 1 4 0 0 0 1 1 0 0 0 0 0
VA Charles City WAS 6/2/10 91 0 0 0 0 0 0 0 0 0 0 0 0 0
VA Charlotte WAS 6/15/10 265 1 2 3 1 0 0 0 1 1 0 0 0 1
VA Charlottesville
city WAS 6/8/10 2,421 4 53 57 2 8 5 2 17 1 1 1 0 3
VA Chesapeake city WAS 6/8/10 7,369 8 71 79 4 6 14 16 40 1 3 7 8 19
VA Chesterfield WAS 5/11/10 8,167 59 303 362 51 42 38 48 179 3 6 8 8 25
VA Clarke WAS 6/8/10 275 1 14 15 0 0 3 5 8 0 0 1 0 1
VA Colonial Heights
city WAS 5/18/10 1,383 4 11 15 1 1 1 1 4 0 0 1 1 2
VA Covington city WAS 6/15/10 157 0 0 0 0 0 0 0 0 0 0 0 0 0
VA Craig WAS 6/15/10 84 1 0 1 0 0 0 0 0 0 0 0 0 0
VA Culpeper WAS 6/8/10 1,674 5 37 42 5 4 8 3 20 3 2 2 1 8
VA Cumberland WAS 6/2/10 142 0 1 1 0 0 0 0 0 0 0 0 0 0
VA Danville city WAS 6/15/10 2,503 8 15 23 4 2 2 4 12 2 2 0 1 5
VA Dickenson WAS 6/15/10 521 0 0 0 0 0 0 0 0 0 0 0 0 0
VA Dinwiddie WAS 5/18/10 939 4 8 12 3 0 0 2 5 0 0 0 0 0
VA Essex WAS 6/2/10 359 0 4 4 1 0 0 0 1 0 0 0 0 0
VA Fairfax WAS 3/9/09 35,934 855 5,078 5,933 660 264 345 639 1,908 242 120 169 213 744
Page 42
IDENT/IAFIS Interoperability Report 42/52U.S. Immigration and Customs Enforcement Page 42 of 52
Interoperability Statistics: U.S. Counties (From October 27, 2008 through April 30, 2011)
Alien IDENT Matches* Administratively Arrested or Booked into ICE Custody**
Removals and Returns**
State County AOR Activation
Date Submissions LESC L1 LESC L2/3 Total L1 L2 L3
Non-Criminal
Immigration Violator
Total L1 L2 L3
Non-Criminal
Immigration Violator
Total
VA Falls Church city WAS 5/25/10 80 0 1 1 0 0 0 0 0 0 0 0 0 0
VA Fauquier WAS 3/30/10 1,895 5 58 63 3 3 4 4 14 0 1 4 1 6
VA Floyd WAS 6/15/10 189 1 1 2 1 0 0 0 1 0 0 0 0 0
VA Fluvanna WAS 6/8/10 369 0 5 5 0 0 2 0 2 0 0 1 0 1
VA Franklin WAS 6/8/10 832 0 5 5 0 0 0 0 0 0 0 0 0 0
VA Franklin city WAS 6/15/10 306 0 0 0 0 0 0 0 0 0 0 0 0 0
VA Frederick WAS 6/8/10 1,729 9 39 48 3 2 3 6 14 2 0 1 2 5
VA Fredericksburg
city WAS 6/8/10 1,493 4 23 27 2 3 3 1 9 2 3 0 0 5
VA Galax city WAS 6/15/10 495 2 7 9 2 0 1 1 4 1 0 0 1 2
VA Giles WAS 6/15/10 515 0 0 0 0 0 0 0 0 0 0 0 0 0
VA Gloucester WAS 6/8/10 567 0 4 4 0 0 0 0 0 0 0 0 0 0
VA Goochland WAS 6/2/10 368 0 4 4 0 0 0 2 2 0 0 0 2 2
VA Grayson WAS 6/15/10 265 0 4 4 0 1 0 0 1 0 1 0 0 1
VA Greene WAS 6/8/10 314 1 6 7 0 0 1 3 4 0 0 1 1 2
VA Greensville WAS 5/18/10 810 2 7 9 0 1 0 1 2 0 0 0 0 0
VA Halifax WAS 6/15/10 971 0 8 8 3 0 0 0 3 0 0 0 0 0
VA Hampton city WAS 6/8/10 4,546 4 23 27 3 0 0 5 8 0 0 0 1 1
VA Hanover WAS 5/11/10 3,718 6 64 70 4 0 10 22 36 3 0 6 7 16
VA Harrisonburg city WAS 6/8/10 1,248 21 80 101 17 7 4 15 43 5 0 1 1 7
VA Henrico WAS 4/20/10 11,649 48 327 375 66 16 25 51 158 20 7 7 14 48
VA Henry WAS 6/15/10 1,811 2 27 29 3 3 4 0 10 0 2 3 0 5
VA Highland WAS 6/8/10 31 0 0 0 0 0 0 0 0 0 0 0 0 0
VA Hopewell city WAS 5/18/10 685 1 9 10 2 0 0 1 3 1 0 0 0 1
VA Isle of Wight WAS 6/8/10 604 1 0 1 0 0 0 0 0 0 0 0 0 0
VA James City WAS 6/8/10 1,384 3 26 29 6 0 5 1 12 3 0 2 0 5
VA King and Queen WAS 6/2/10 176 0 0 0 0 0 0 0 0 0 0 0 0 0
VA King George WAS 6/8/10 546 0 10 10 0 0 0 0 0 0 0 0 0 0
VA King William WAS 6/2/10 254 0 2 2 0 0 0 0 0 0 0 0 0 0
VA Lancaster WAS 6/2/10 248 0 1 1 0 0 0 0 0 0 0 0 0 0
VA Lee WAS 6/15/10 706 0 1 1 0 0 0 0 0 0 0 0 0 0
VA Lexington city WAS 6/15/10 0 0 0 0 0 0 0 0 0 0 0 0 0 0
Page 43
IDENT/IAFIS Interoperability Report 43/52U.S. Immigration and Customs Enforcement Page 43 of 52
Interoperability Statistics: U.S. Counties (From October 27, 2008 through April 30, 2011)
Alien IDENT Matches* Administratively Arrested or Booked into ICE Custody**
Removals and Returns**
State County AOR Activation
Date Submissions LESC L1 LESC L2/3 Total L1 L2 L3
Non-Criminal
Immigration Violator
Total L1 L2 L3
Non-Criminal
Immigration Violator
Total
VA Loudoun WAS 3/30/10 5,699 76 735 811 53 25 52 97 227 15 10 23 26 74
VA Louisa WAS 6/8/10 909 1 7 8 0 0 0 1 1 0 0 0 1 1
VA Lunenburg WAS 6/2/10 276 0 5 5 1 0 0 0 1 0 0 0 0 0
VA Lynchburg city WAS 6/15/10 3,667 3 24 27 2 0 3 7 12 0 0 1 1 2
VA Madison WAS 6/8/10 242 0 7 7 0 2 1 3 6 0 0 0 0 0
VA Martinsville city WAS 6/15/10 1,101 3 3 6 0 0 2 0 2 0 0 1 0 1
VA Mathews WAS 6/2/10 167 0 1 1 0 0 0 0 0 0 0 0 0 0
VA Mecklenburg WAS 6/2/10 981 0 12 12 0 2 0 0 2 0 1 0 0 1
VA Middlesex WAS 6/2/10 234 0 2 2 0 0 0 0 0 0 0 0 0 0
VA Montgomery WAS 6/15/10 2,379 4 30 34 2 4 3 4 13 0 1 2 1 4
VA Nelson WAS 6/8/10 327 0 0 0 0 0 0 0 0 0 0 0 0 0
VA New Kent WAS 6/2/10 404 2 2 4 2 0 0 0 2 0 0 0 0 0
VA Newport News
city WAS 5/11/10 6,010 12 116 128 4 7 23 28 62 3 5 8 7 23
VA Norfolk city WAS 4/20/10 17,289 23 157 180 7 6 19 24 56 1 3 9 11 24
VA Northampton WAS 6/8/10 341 3 7 10 0 2 0 1 3 0 1 0 0 1
VA Northumberland WAS 6/2/10 327 0 6 6 0 0 1 0 1 0 0 1 0 1
VA Norton city WAS 6/15/10 264 0 4 4 0 0 0 0 0 0 0 0 0 0
VA Nottoway WAS 5/18/10 445 2 5 7 0 3 0 0 3 0 1 0 0 1
VA Orange WAS 6/8/10 510 0 2 2 0 0 0 0 0 0 0 0 0 0
VA Page WAS 6/8/10 572 0 3 3 0 0 0 1 1 0 0 0 0 0
VA Patrick WAS 6/15/10 700 0 3 3 0 1 0 1 2 0 0 0 0 0
VA Petersburg city WAS 5/11/10 2,372 2 10 12 1 0 0 1 2 0 0 0 1 1
VA Pittsylvania WAS 6/15/10 1,233 1 4 5 1 0 1 0 2 0 0 1 0 1
VA Portsmouth city WAS 6/8/10 5,010 13 25 38 5 4 4 1 14 0 1 1 0 2
VA Powhatan WAS 6/2/10 382 0 4 4 1 0 0 1 2 1 0 0 0 1
VA Prince Edward WAS 5/18/10 900 1 3 4 0 0 0 0 0 0 0 0 0 0
VA Prince George WAS 5/18/10 1,109 6 15 21 1 4 3 1 9 1 2 2 0 5
VA Prince William WAS 9/28/09 16,980 265 1,902 2,167 300 258 243 201 1,002 102 101 109 50 362
VA Pulaski WAS 6/15/10 1,693 1 6 7 1 1 1 0 3 1 0 1 0 2
VA Radford city WAS 6/15/10 494 0 10 10 0 0 1 0 1 0 0 1 0 1
VA Rappahannock WAS 4/13/10 146 0 1 1 0 0 0 1 1 0 0 0 1 1
Page 44
IDENT/IAFIS Interoperability Report 44/52U.S. Immigration and Customs Enforcement Page 44 of 52
Interoperability Statistics: U.S. Counties (From October 27, 2008 through April 30, 2011)
Alien IDENT Matches* Administratively Arrested or Booked into ICE Custody**
Removals and Returns**
State County AOR Activation
Date Submissions LESC L1 LESC L2/3 Total L1 L2 L3
Non-Criminal
Immigration Violator
Total L1 L2 L3
Non-Criminal
Immigration Violator
Total
VA Richmond WAS 5/25/10 225 0 1 1 0 0 0 0 0 0 0 0 0 0
VA Richmond city WAS 4/20/10 28,847 148 1,191 1,339 171 98 129 233 631 63 34 55 77 229
VA Roanoke WAS 6/15/10 3,348 11 52 63 2 6 4 5 17 0 2 2 1 5
VA Roanoke city WAS 6/15/10 6,263 25 101 126 15 3 11 20 49 3 0 5 7 15
VA Rockbridge WAS 6/15/10 533 2 5 7 0 0 0 1 1 0 0 0 1 1
VA Rockingham WAS 6/8/10 1,272 8 43 51 9 3 1 3 16 4 0 0 0 4
VA Russell WAS 6/15/10 733 3 2 5 0 0 0 3 3 0 0 0 2 2
VA Salem city WAS 6/15/10 10 0 0 0 0 0 0 0 0 0 0 0 0 0
VA Scott WAS 6/15/10 547 0 1 1 0 0 0 0 0 0 0 0 0 0
VA Shenandoah WAS 6/8/10 768 7 13 20 2 0 3 4 9 1 0 0 0 1
VA Smyth WAS 6/15/10 863 1 4 5 0 0 1 1 2 0 0 0 0 0
VA Southampton WAS 6/8/10 393 0 0 0 0 0 0 0 0 0 0 0 0 0
VA Spotsylvania WAS 6/8/10 2,742 14 64 78 4 2 7 5 18 3 2 3 3 11
VA Stafford WAS 5/11/10 2,966 26 90 116 21 10 9 4 44 4 2 6 0 12
VA Staunton city WAS 6/8/10 677 4 6 10 0 3 0 1 4 0 0 0 0 0
VA Suffolk city WAS 6/8/10 2,245 3 5 8 3 0 1 1 5 1 0 1 0 2
VA Surry WAS 6/2/10 84 0 0 0 0 0 0 0 0 0 0 0 0 0
VA Sussex WAS 6/2/10 369 2 11 13 2 0 0 0 2 0 0 0 0 0
VA Tazewell WAS 6/15/10 1,779 1 3 4 0 0 0 0 0 0 0 0 0 0
VA Virginia Beach
city WAS 4/20/10 16,620 32 209 241 11 20 17 30 78 7 10 13 11 41
VA Warren WAS 6/8/10 1,639 1 18 19 2 1 3 2 8 0 0 2 0 2
VA Washington WAS 6/15/10 0 0 0 0 0 0 0 0 0 0 0 0 0 0
VA Waynesboro city WAS 6/8/10 826 3 14 17 1 2 0 0 3 1 0 0 0 1
VA Westmoreland WAS 6/2/10 459 0 2 2 0 0 0 0 0 0 0 0 0 0
VA Williamsburg city WAS 6/8/10 462 1 17 18 1 0 0 4 5 0 0 0 0 0
VA Winchester city WAS 6/8/10 2,011 17 58 75 15 6 7 18 46 5 2 4 8 19
VA Wise WAS 6/15/10 1,317 2 4 6 0 0 1 1 2 0 0 0 1 1
VA Wythe WAS 6/15/10 840 0 3 3 0 0 0 1 1 0 0 0 0 0
VA York WAS 6/8/10 1,151 3 15 18 2 1 0 2 5 0 1 0 1 2
WI Adams CHI 1/11/11 206 0 1 1 0 0 0 0 0 0 0 0 0 0
WI Ashland CHI 1/11/11 258 0 0 0 0 0 0 0 0 0 0 0 0 0
Page 45
IDENT/IAFIS Interoperability Report 45/52U.S. Immigration and Customs Enforcement Page 45 of 52
Interoperability Statistics: U.S. Counties (From October 27, 2008 through April 30, 2011)
Alien IDENT Matches* Administratively Arrested or Booked into ICE Custody**
Removals and Returns**
State County AOR Activation
Date Submissions LESC L1 LESC L2/3 Total L1 L2 L3
Non-Criminal
Immigration Violator
Total L1 L2 L3
Non-Criminal
Immigration Violator
Total
WI Barron CHI 1/11/11 749 0 5 5 0 0 1 1 2 0 0 1 0 1
WI Bayfield CHI 1/11/11 134 0 0 0 0 0 0 0 0 0 0 0 0 0
WI Brown CHI 1/11/11 2,415 6 41 47 3 0 7 5 15 2 0 4 2 8
WI Buffalo CHI 1/11/11 125 0 1 1 0 0 0 0 0 0 0 0 0 0
WI Burnett CHI 1/11/11 270 0 0 0 0 0 0 0 0 0 0 0 0 0
WI Calumet CHI 1/11/11 138 2 1 3 0 0 0 0 0 0 0 0 0 0
WI Chippewa CHI 1/11/11 510 2 0 2 0 0 0 0 0 0 0 0 0 0
WI Clark CHI 1/11/11 290 1 11 12 0 1 3 1 5 0 0 2 0 2
WI Columbia CHI 1/11/11 536 1 6 7 1 0 0 2 3 0 0 0 2 2
WI Crawford CHI 1/11/11 52 0 1 1 0 0 0 0 0 0 0 0 0 0
WI Dane CHI 1/11/11 3,034 14 40 54 0 0 1 8 9 0 0 0 3 3
WI Dodge CHI 1/11/11 2,061 16 13 29 0 0 1 2 3 0 0 0 0 0
WI Door CHI 1/11/11 172 0 1 1 0 0 0 0 0 0 0 0 0 0
WI Douglas CHI 1/11/11 438 0 1 1 0 0 0 0 0 0 0 0 0 0
WI Dunn CHI 1/11/11 568 1 3 4 0 0 1 0 1 0 0 0 0 0
WI Eau Claire CHI 1/11/11 1,057 1 8 9 0 0 0 0 0 0 0 0 0 0
WI Florence CHI 1/11/11 67 0 0 0 0 0 0 0 0 0 0 0 0 0
WI Fond du Lac CHI 1/11/11 781 1 4 5 0 0 1 0 1 0 0 0 0 0
WI Forest CHI 1/11/11 110 1 0 1 0 0 0 0 0 0 0 0 0 0
WI Grant CHI 1/11/11 193 0 2 2 0 0 1 0 1 0 0 1 0 1
WI Green CHI 1/11/11 212 2 2 4 0 0 0 3 3 0 0 0 1 1
WI Green Lake CHI 1/11/11 123 0 0 0 0 0 0 0 0 0 0 0 0 0
WI Iowa CHI 1/11/11 248 0 1 1 0 0 0 0 0 0 0 0 0 0
WI Iron CHI 1/11/11 97 0 0 0 0 0 0 0 0 0 0 0 0 0
WI Jackson CHI 1/11/11 349 0 5 5 0 0 0 0 0 0 0 0 0 0
WI Jefferson CHI 1/11/11 912 8 19 27 1 0 0 6 7 1 0 0 0 1
WI Juneau CHI 1/11/11 250 0 2 2 0 0 0 0 0 0 0 0 0 0
WI Kenosha CHI 1/11/11 1,448 3 49 52 0 0 2 2 4 0 0 1 1 2
WI Kewaunee CHI 1/11/11 149 0 2 2 0 0 0 0 0 0 0 0 0 0
WI La Crosse CHI 1/11/11 861 0 5 5 0 0 0 0 0 0 0 0 0 0
WI Lafayette CHI 1/11/11 107 0 5 5 0 0 0 0 0 0 0 0 0 0
Page 46
IDENT/IAFIS Interoperability Report 46/52U.S. Immigration and Customs Enforcement Page 46 of 52
Interoperability Statistics: U.S. Counties (From October 27, 2008 through April 30, 2011)
Alien IDENT Matches* Administratively Arrested or Booked into ICE Custody**
Removals and Returns**
State County AOR Activation
Date Submissions LESC L1 LESC L2/3 Total L1 L2 L3
Non-Criminal
Immigration Violator
Total L1 L2 L3
Non-Criminal
Immigration Violator
Total
WI Langlade CHI 1/11/11 128 0 0 0 0 0 0 0 0 0 0 0 0 0
WI Lincoln CHI 1/11/11 260 0 3 3 0 0 0 0 0 0 0 0 0 0
WI Manitowoc CHI 1/11/11 354 2 6 8 0 1 0 2 3 0 1 0 1 2
WI Marathon CHI 1/11/11 496 3 4 7 0 0 0 1 1 0 0 0 1 1
WI Marinette CHI 1/11/11 226 0 0 0 0 0 0 0 0 0 0 0 0 0
WI Marquette CHI 1/11/11 190 1 1 2 0 0 0 0 0 0 0 0 0 0
WI Milwaukee CHI 1/11/11 11,496 35 141 176 9 3 7 35 54 2 1 1 8 12
WI Monroe CHI 1/11/11 288 0 11 11 0 0 0 4 4 0 0 0 2 2
WI Oconto CHI 1/11/11 319 0 2 2 0 0 0 0 0 0 0 0 0 0
WI Oneida CHI 1/11/11 538 0 1 1 0 0 0 0 0 0 0 0 0 0
WI Outagamie CHI 1/11/11 479 2 5 7 1 0 0 1 2 1 0 0 0 1
WI Ozaukee CHI 1/11/11 399 0 12 12 0 0 0 0 0 0 0 0 0 0
WI Pepin CHI 1/11/11 46 0 1 1 0 0 0 0 0 0 0 0 0 0
WI Pierce CHI 1/11/11 309 0 0 0 0 0 0 0 0 0 0 0 0 0
WI Polk CHI 1/11/11 371 0 1 1 0 0 1 0 1 0 0 1 0 1
WI Portage CHI 1/11/11 256 0 3 3 0 0 1 2 3 0 0 1 1 2
WI Price CHI 1/11/11 80 0 1 1 0 0 0 0 0 0 0 0 0 0
WI Racine CHI 1/11/11 1,518 6 20 26 1 1 0 1 3 0 0 0 0 0
WI Richland CHI 1/11/11 89 1 2 3 0 0 0 0 0 0 0 0 0 0
WI Rock CHI 1/11/11 993 4 14 18 0 0 0 1 1 0 0 0 0 0
WI Rusk CHI 1/11/11 103 0 0 0 0 0 0 0 0 0 0 0 0 0
WI Saint Croix CHI 1/11/11 287 0 2 2 0 0 0 0 0 0 0 0 0 0
WI Sauk CHI 1/11/11 750 2 27 29 0 0 0 1 1 0 0 0 0 0
WI Sawyer CHI 1/11/11 434 1 0 1 0 0 0 0 0 0 0 0 0 0
WI Shawano CHI 1/11/11 358 0 4 4 0 0 0 0 0 0 0 0 0 0
WI Sheboygan CHI 1/11/11 807 3 15 18 0 0 0 4 4 0 0 0 2 2
WI Taylor CHI 1/11/11 168 0 2 2 0 0 0 1 1 0 0 0 1 1
WI Trempealeau CHI 1/11/11 347 3 11 14 0 0 0 2 2 0 0 0 2 2
WI Vernon CHI 1/11/11 125 0 0 0 0 0 0 0 0 0 0 0 0 0
WI Vilas CHI 1/11/11 420 0 2 2 0 0 0 0 0 0 0 0 0 0
WI Walworth CHI 1/11/11 773 1 19 20 4 0 2 4 10 1 0 1 2 4
Page 47
IDENT/IAFIS Interoperability Report 47/52U.S. Immigration and Customs Enforcement Page 47 of 52
Interoperability Statistics: U.S. Counties (From October 27, 2008 through April 30, 2011)
Alien IDENT Matches* Administratively Arrested or Booked into ICE Custody**
Removals and Returns**
State County AOR Activation
Date Submissions LESC L1 LESC L2/3 Total L1 L2 L3
Non-Criminal
Immigration Violator
Total L1 L2 L3
Non-Criminal
Immigration Violator
Total
WI Washburn CHI 1/11/11 153 0 0 0 0 0 0 0 0 0 0 0 0 0
WI Washington CHI 1/11/11 910 0 6 6 0 0 0 0 0 0 0 0 0 0
WI Waukesha CHI 1/11/11 2,817 4 40 44 1 1 1 1 4 0 0 0 1 1
WI Waupaca CHI 1/11/11 472 1 2 3 0 0 0 1 1 0 0 0 0 0
WI Waushara CHI 1/11/11 424 2 9 11 1 0 0 0 1 1 0 0 0 1
WI Winnebago CHI 1/11/11 1,034 4 7 11 1 0 0 1 2 1 0 0 1 2
WI Wood CHI 1/11/11 904 1 8 9 0 0 2 3 5 0 0 1 2 3
WV Barbour PHI 10/26/10 37 0 0 0 0 0 0 0 0 0 0 0 0 0
WV Berkeley PHI 10/26/10 530 0 6 6 0 0 0 1 1 0 0 0 1 1
WV Boone PHI 10/26/10 189 0 0 0 0 0 0 0 0 0 0 0 0 0
WV Braxton PHI 10/26/10 168 0 0 0 0 0 0 0 0 0 0 0 0 0
WV Brooke PHI 10/26/10 44 0 0 0 0 0 0 0 0 0 0 0 0 0
WV Cabell PHI 10/26/10 245 0 0 0 0 0 0 0 0 0 0 0 0 0
WV Calhoun PHI 10/26/10 35 0 0 0 0 0 0 0 0 0 0 0 0 0
WV Clay PHI 10/26/10 63 0 0 0 0 0 0 0 0 0 0 0 0 0
WV Fayette PHI 10/26/10 83 0 0 0 0 0 0 0 0 0 0 0 0 0
WV Gilmer PHI 10/26/10 27 0 0 0 0 0 0 0 0 0 0 0 0 0
WV Greenbrier PHI 10/26/10 103 0 0 0 0 0 0 0 0 0 0 0 0 0
WV Hampshire PHI 10/26/10 169 0 1 1 0 0 0 0 0 0 0 0 0 0
WV Hancock PHI 10/26/10 394 0 0 0 0 0 0 0 0 0 0 0 0 0
WV Harrison PHI 10/26/10 101 0 0 0 0 0 0 0 0 0 0 0 0 0
WV Jackson PHI 10/26/10 64 0 0 0 0 0 0 0 0 0 0 0 0 0
WV Jefferson PHI 10/26/10 164 0 4 4 0 0 1 0 1 0 0 1 0 1
WV Kanawha PHI 10/26/10 2,511 1 7 8 0 0 0 3 3 0 0 0 2 2
WV Lewis PHI 10/26/10 70 0 0 0 0 0 0 0 0 0 0 0 0 0
WV Lincoln PHI 10/26/10 173 0 0 0 0 0 0 0 0 0 0 0 0 0
WV Logan PHI 10/26/10 234 0 0 0 0 0 0 0 0 0 0 0 0 0
WV Marion PHI 10/26/10 346 0 1 1 0 0 0 1 1 0 0 0 0 0
WV Marshall PHI 10/26/10 81 0 0 0 0 0 0 0 0 0 0 0 0 0
WV Mason PHI 10/26/10 66 0 0 0 0 0 0 0 0 0 0 0 0 0
WV McDowell PHI 10/26/10 107 0 0 0 0 0 0 0 0 0 0 0 0 0
Page 48
IDENT/IAFIS Interoperability Report 48/52U.S. Immigration and Customs Enforcement Page 48 of 52
Interoperability Statistics: U.S. Counties (From October 27, 2008 through April 30, 2011)
Alien IDENT Matches* Administratively Arrested or Booked into ICE Custody**
Removals and Returns**
State County AOR Activation
Date Submissions LESC L1 LESC L2/3 Total L1 L2 L3
Non-Criminal
Immigration Violator
Total L1 L2 L3
Non-Criminal
Immigration Violator
Total
WV Mercer PHI 10/26/10 580 0 1 1 0 0 0 0 0 0 0 0 0 0
WV Mineral PHI 10/26/10 100 0 0 0 0 0 0 0 0 0 0 0 0 0
WV Mingo PHI 10/26/10 109 0 0 0 0 0 0 0 0 0 0 0 0 0
WV Monongalia PHI 10/26/10 626 0 10 10 0 0 0 0 0 0 0 0 0 0
WV Monroe PHI 10/26/10 41 0 0 0 0 0 0 0 0 0 0 0 0 0
WV Morgan PHI 10/26/10 25 0 0 0 0 0 0 0 0 0 0 0 0 0
WV Nicholas PHI 10/26/10 45 0 1 1 0 0 0 0 0 0 0 0 0 0
WV Ohio PHI 10/26/10 68 0 0 0 0 0 0 0 0 0 0 0 0 0
WV Pendleton PHI 10/26/10 28 1 0 1 0 0 0 0 0 0 0 0 0 0
WV Pleasants PHI 10/26/10 17 0 0 0 0 0 0 0 0 0 0 0 0 0
WV Pocahontas PHI 10/26/10 41 0 0 0 0 0 0 0 0 0 0 0 0 0
WV Preston PHI 10/26/10 85 0 0 0 0 0 0 0 0 0 0 0 0 0
WV Putnam PHI 10/26/10 127 0 0 0 0 0 0 0 0 0 0 0 0 0
WV Raleigh PHI 10/26/10 1,021 0 7 7 0 0 0 1 1 0 0 0 0 0
WV Randolph PHI 10/26/10 179 0 0 0 0 0 0 0 0 0 0 0 0 0
WV Ritchie PHI 10/26/10 98 0 0 0 0 0 0 0 0 0 0 0 0 0
WV Roane PHI 10/26/10 78 0 0 0 0 0 0 0 0 0 0 0 0 0
WV Summers PHI 10/26/10 51 0 0 0 0 0 0 0 0 0 0 0 0 0
WV Taylor PHI 10/26/10 11 0 0 0 0 0 0 0 0 0 0 0 0 0
WV Tucker PHI 10/26/10 34 0 0 0 0 0 0 0 0 0 0 0 0 0
WV Tyler PHI 10/26/10 21 0 0 0 0 0 0 0 0 0 0 0 0 0
WV Upshur PHI 10/26/10 52 0 0 0 0 0 0 0 0 0 0 0 0 0
WV Wayne PHI 10/26/10 81 0 0 0 0 0 0 0 0 0 0 0 0 0
WV Webster PHI 10/26/10 58 0 0 0 0 0 0 0 0 0 0 0 0 0
WV Wetzel PHI 10/26/10 2 0 0 0 0 0 0 0 0 0 0 0 0 0
WV Wirt PHI 10/26/10 28 0 0 0 0 0 0 0 0 0 0 0 0 0
WV Wood PHI 10/26/10 121 0 0 0 0 0 0 0 0 0 0 0 0 0
WV Wyoming PHI 10/26/10 23 0 0 0 0 0 0 0 0 0 0 0 0 0
WY Laramie DEN 1/19/11 1,428 24 66 90 14 15 23 10 62 5 6 8 4 23
Page 49
IDENT/IAFIS Interoperability Report 49/52U.S. Immigration and Customs Enforcement Page 49 of 52
* Aliens who are charged with or convicted of a Level 1 or Level2/3 offense as determined by the LESC during the referral include duplicate matches for aliens ** Aliens are classified by level based on conviction information available in EID. L1-3 are level 1-3 convicted criminal aliens. Non-Crim Img Violator is an abbreviation for Non-Criminal Immigration Violators.
Page 50
IDENT/IAFIS Interoperability Report 50/52U.S. Immigration and Customs Enforcement Page 50 of 52
8. Frequently Asked Questions about Data
What is the Methodology for this Data Collection?
The data contained in this monthly report is based on a merge of LESC data and ICE enforcement data. The data is compiled to remove individuals who have their fingerprints submitted through IDENT/IAFIS Interoperability multiple times for the same encounter (e.g., an individual who is transferred from one correctional facility to another correctional facility and has fingerprints submitted at both locations). Data provided on a daily or weekly basis by LESC is not compiled. As a result, the cumulative number of Level 1s presented in this report is slightly lower than the data provided on a weekly basis.
Why does Past Data Change?
Data from previous months is subject to change based on three potential factors:
New data from the IDENT Fingerprint Identification database allows for an increased number of IDENT/IAFIS Interoperability Queries to be joined to EID Case Files Case, arrest, or detainer information may be entered into the EID systems for the first time, or updated within the systems, resulting in IDENT/IAFIS Interoperability Queries from previous months being joined to cases for the first time
Some interoperability queries have more than one LESC record with the same query ID. If the second (follow-up) query with the same ID falls in a different month than the original query, the follow-up query could provide updated data used for matching to EID data that was unavailable in the first query
Why are there U.S. Citizens (USC) in IDENT?
There are two types of USCs in IDENT. The first are individuals who were citizens when prints were collected and these individuals could be in IDENT for the following reasons:
Active wants/warrants provided by CJIS An adoption involving USCIS Trusted traveler programs such as GES, IRT, NEXUS, SENTRI, FASTNORTH, FASTSOUTH Credentialing for TSA Aviation Workers
The second type of USCs in IDENT are individuals who were not citizens when prints were collected, but who subsequently became USCs, such as:
Visa applicant through DOS Benefits applicant through USCIS Entry or Exit through CBP Apprehension by ICE, CBP-OFO, USCG, or OBP
What applications are reviewed as part of the LESC query?
SEVIS – Student & Exchange Visitor Information System US-VISIT – U.S. Visitor and Immigrant Status Indicator Technology
NCIC – National Crime Information Center
b7E
b7E
b7E
Page 51
IDENT/IAFIS Interoperability Report 51/52U.S. Immigration and Customs Enforcement Page 51 of 52
9. Interoperability Data Definitions
SC IDENT/IAFIS Interoperability Data Definitions Submissions
All fingerprint submissions that have been processed through ICE use of SC IDENT/IAFIS interoperability.
Alien IDENT Matches*
Aliens that had a match in the IDENT system and who were charged with or convicted of any level offense. IDENT Matches include duplicate entries for cases as an individual may go through interoperability several times for one unique case.
Enforcement Actions
Administratively Arrested or Booked into ICE Custody**
Aliens that had a match in IDENT and booked into ICE custody or administratively arrested by ICE. The date the individual is booked into ICE custody or administratively arrested is based on the month that the individual was checked via ICE use of SC IDENT/IAFIS Interoperability, not the month they were administratively arrested or booked into ICE custody. Threat levels are based on convictions as described in “Civil Immigration Enforcement: Priorities for the Apprehension, Detention and Removal of Aliens,” which, “[f]or purposes of prioritizing the removal of aliens convicted of crimes” and are retroactively applied to all data.
Outcomes
Removals and Returns**
Aliens that had a match in IDENT and was removed. Threat levels are based on the levels described in “Civil Immigration Enforcement: Priorities for the Apprehension, Detention and Removal of Aliens,” which, “[f]or purposes of prioritizing the removal of aliens convicted of crimes” and are retroactively applied to all data.
Other Definitions
Alien Population Coverage % The total alien population that is covered by ICE use of SC IDENT/IAFIS interoperability.
Activation Date The date that ICE use of SC IDENT/IAFIS interoperability was deployed to each area. A jurisdiction is not necessarily 100% covered at this date. This data was refreshed in November 2010.
Total Jurisdictions Deployed
The total number of counties, parishes, or independent cities to which ICE use of SC IDENT/IAFIS Interoperability has been deployed by the date of the report. A jurisdiction does not need to be 100% covered to be included in this count.
AOR Area of Responsibility covered by a specific ICE field office.
Level 1 (L1) Includes aliens convicted of “aggravated felonies,” as defined in § 101(a)(43) of the Immigration and Nationality Act, or two or more crimes punishable by more than one year, commonly referred to as “felonies”
Level 2 (L2) Includes aliens convicted of any felony or three or more offenses punishable by less than one year, commonly referred to as “misdemeanors”
Level 3 (L3) Includes aliens convicted of offenses punishable by less than one year
LESC L1 (Level 1) Includes aliens charged or convicted of a L1 offense at the time of the IDENT Match
LESC L2/3 (Level 2/3) Includes aliens not charged or convicted of a L1 offense at the time of the IDENT Match
Non-criminal immigration violators (Noncrim)
Aliens that have not been convicted of a criminal offense, but have violated immigration law. In this report, all have been arrested and/or charged with a criminal offense. These individuals may have a criminal conviction, but ICE does not currently have data confirming a conviction. Examples of non-criminal immigration violators are overstays and those who have entered the United States without inspection.
* Aliens who are charged with or convicted of a Level 1 or Level2/3 offense as determined by the LESC during the referral include duplicate matches for aliens ** Aliens are classified by level based on conviction information available in EID. L1-3 are level 1-3 convicted criminal aliens. Non-Crim Img Violator is an abbreviation for Non-Criminal Immigration Violators.
Page 52
IDENT/IAFIS Interoperability Report 52/52U.S. Immigration and Customs Enforcement Page 52 of 52