UNITED STATES SECURITIES AND EXCHANGE COMMISSION Washington, D.C. 20549 ________________________ FORM 8-K CURRENT REPORT Pursuant to Section 13 or 15(d) of the Securities Exchange Act of 1934 Date of Report: (Date of earliest event reported): December 8, 2017 WestRock Company (Exact name of registrant as specified in charter) Delaware 001 -37484 47-3335141 (State or Other Jurisdiction (Commission File Number) (IRS Employer Identification No.) of Incorporation) 1000 Abernathy Road, Atlanta, GA 30328 (Address of principal executive offices) (Zip Code) 770-448-2193 (Registrant’s telephone number, including area code) Check the appropriate box below if the Form 8-K filing is intended to simultaneously satisfy the filing obligation of the registrant under any of the following provisions: [ ] Written communications pursuant to Rule 425 under the Securities Act (17 CFR 230.425) [ ] Soliciting material pursuant to Rule 14a-12 under the Exchange Act (17 CFR 240.14a-12) [ ] Pre-commencement communications pursuant to Rule 14d-2(b) under the Exchange Act (17 CFR 240.14d-2(b)) [ ] Pre-commencement communications pursuant to Rule 13e-4(c) under the Exchange Act (17 CFR 240.13e-4(c)) Indicate by check mark whether the registrant is an emerging growth company as defined in Rule 405 of the Securities Act of 1933 (17 CFR §230.405) or Rule 12b-2 of the Securities Exchange Act of 1934 (17 CFR §240.12b-2). Emerging growth company [ ] If an emerging growth company, indicate by check mark if the registrant has elected not to use the extended transition period for complying with any new or revised financial accounting standards provided pursuant to Section 13(a) of the Exchange Act. [ ]
Transcript
UNITED STATES
SECURITIES AND EXCHANGE COMMISSION
Washington, D.C. 20549
________________________
FORM 8-K
CURRENT REPORTPursuant to Section 13 or 15(d) of the Securities Exchange Act of 1934
Date of Report: (Date of earliest event reported): December 8, 2017
WestRock Company
(Exact name of registrant as specified in charter)
Delaware 001 -37484 47-3335141(State or Other Jurisdiction (Commission File Number) (IRS Employer Identification No.)
of Incorporation)
1000 Abernathy Road, Atlanta, GA 30328(Address of principal executive offices) (Zip Code)
770-448-2193(Registrant’s telephone number, including area code)
Check the appropriate box below if the Form 8-K filing is intended to simultaneously satisfy the filing obligation of the registrant under any of the following provisions: [ ] Written communications pursuant to Rule 425 under the Securities Act (17 CFR 230.425)[ ] Soliciting material pursuant to Rule 14a-12 under the Exchange Act (17 CFR 240.14a-12)[ ] Pre-commencement communications pursuant to Rule 14d-2(b) under the Exchange Act (17 CFR 240.14d-2(b))[ ] Pre-commencement communications pursuant to Rule 13e-4(c) under the Exchange Act (17 CFR 240.13e-4(c)) Indicate by check mark whether the registrant is an emerging growth company as defined in Rule 405 of the Securities Act of 1933 (17 CFR §230.405) or Rule 12b-2 of theSecurities Exchange Act of 1934 (17 CFR §240.12b-2). Emerging growth company [ ] If an emerging growth company, indicate by check mark if the registrant has elected not to use the extended transition period for complying with any new or revised financialaccounting standards provided pursuant to Section 13(a) of the Exchange Act. [ ]
Item 7.01. Regulation FD Disclosure As previously announced, WestRock Company hosted an analyst investor day in New York City on December 8, 2017. A webcast of the event is accessible in the investorrelations section of the Company’s website at www.westrock.com. A copy of the presentation materials is attached as Exhibit 99.1 and incorporated herein by reference. By filing this current report and furnishing the information contained herein, the Company makes no admission as to the materiality of any information in this report that isrequired to be disclosed solely by reason of Regulation FD. The information provided pursuant to this Item 7.01 (including Exhibit 99.1) is “furnished” and shall not be deemed to be “filed” with the Securities and ExchangeCommission or incorporated by reference in any filing under the Securities Exchange Act of 1934 or the Securities Act of 1933, except as shall be expressly set forth byspecific reference in any such filings. Item 9.01. Financial Statements and Exhibits.
(d) Exhibits 99.1 Presentation (“The Story of WestRock – Investor Day 2017”), dated December 8, 2017
SIGNATURES
Pursuant to the requirements of the Securities Exchange Act of 1934, the Registrant has duly caused this report to be signed on its behalf by the undersigned hereunto dulyauthorized. WESTROCK COMPANY (Registrant) Date: December 8, 2017 By: Robert B. McIntosh Robert B. McIntosh Executive Vice-President, General Counsel and
Secretary
Exhibit 99.1
The Story of WestRock Investor Day 2017 December 8, 2017
Forward Looking Statements 2 This presentation contains forward - looking statements within the meaning of the Private Securities Litigation Reform Act of 1995 . Forward - looking statements are based on our current expectations, beliefs, plans or forecasts and are typically identified by words or phrases such as "may," "will," "could," "s hou ld," "would," "anticipate," "estimate," "expect," "project," "intend," "plan," "believe," "target," "prospects," "potential" and "forecast," and other words, terms and phrases of similar meaning. Forward - looking statements include statements such as that (a) margin expansion and deployment of capital provide the opportunit y to grow adjusted EBITDA to more than $4 billion in 2022, (b) WestRock has the strategy and capabilities to generate attractive returns over the long term, (c) Pizza Hut’s HOT packagi ng will increase the temperatures of delivered pizza by 15% and the percentage of hot deliveries from 74% to 96%, (d) we are on track to achieve our $1B productivity and performance improve men t goal by the end of Q3 FY18, (e) we forecast $16.3 billion of net sales in fiscal 2018, with 55% from our Corrugated Packaging segment and 45% from our Consumer Packaging segment, (f) we have attractive synergy opportunities and upside from commercial and cross - sell opportunities related to the MPS acquisition, (g) we have a significant opportunity to penetrate our o ther 15,000+ customers with our enterprise sales approach, (h) our Corrugated Packaging segment has an integration target of 80%, ( i ) our investment in our Florence, SC mill will ( i ) create a first quartile mill, (ii) cost $410 million and (iii) be completed in the first half of 2020, (j) our N.A. Corrugated Packaging business’ adjusted EBITDA will be greater than 20% in fiscal 2018 a nd greater than 22% in fiscal 2022, (k) our investment in the Porto Feliz plant will ( i ) cost $125 million net, (ii) make the plant the largest, most productive box plant in the Americas and (iii) be completed in th e third quarter of fiscal 2019, (l) Grupo Gondi’s investment in a new paper mill will ( i ) result in 400,000 metric tons of annual lightweight, 100% recycled, containerboard, (ii) result in total annual paper produ cti on capacity to exceed 1 million tons and (iii) start up by the end of thefourth quarter of 2019, (m) we are on track to capture $85 million in synergies fro m t he MPS acquisition by end of FY19, (n) our Consumer Packaging segment’s adjusted EBITDA will be greater than 15% in fiscal 2018 and greater than 17% in fiscal 2022, (o) in fiscal 2018, ou r c onsolidated revenue will be greater than $16.3 billion, our adjusted EBITDA will be greater than $2.8 billion and our adjusted operating cash flow will be greater than $2.3 billion, (p) in fiscal 2018, our consolidated adjusted EBITDA margin will expand by more than 170 basis points, our North American corrugated adjusted EBTIDA margin will exceed 20% and our capex will be app rox imately $1.0 billion, (q) productivity should outpace normal inflation, (r) we expect to generate more than $2.8 billion of adjusted segment EBITDA in fiscal 2018 and more than $4 bi llion in fiscal 2022, (s) we expect to have more than $5 billion of re - deployable capital through fiscal 2022, (t) we have a broad pipeline of high return capital investment opportunities, (u) we will generate adjusted segment EBITDA of more than $2.8 billion in fiscal 2018, more than $3.3 billion under the base case (a 19% margin) and more than $4 billion in fiscal 2022, (v ) a second 18 station press will be installed in Indianapolis in fiscal 2018 (w) we expect approximately 20% unlevered after - tax returns on our capital investments, (x) we expect to invest between $17 5 - 200 million in fiscal years 2018 - 19 in the Mahrt curtain coater and Brazil box plant, and (y) MPS will generate revenue of $1.9 million in fiscal 2018. Forward - looking statements involve estimates, expectations, projections, goals, forecasts, assumptions, risks and uncertainties. WestRock cautions readers that a forward - looking statement is not a guarantee of future performance and that actual results could differ materially from those contained in the forward - lookin g statement. WestRock’s businesses are subject to a number of general risks that would affect any such forward - looking statements, including, among others, decreases in demand for their prod ucts; increases in energy, raw materials, shipping and capital equipment costs; reduced supply of raw materials; fluctuations in selling prices and volumes; intense competition; the potent ial loss of certain
customers; the scope, costs, timing and impact of any restructuring of our operations and corporate and tax structure; the occurrence of a natural disaster, such as a hurrican e, winter or tropical storm, earthquake, tornado, flood, fire, or other unanticipated problems such as labor difficulties, equipment failure or unscheduled maintenance and repair, which could resul t i n operational disruptions of varied duration; our desire or ability to continue to repurchase company stock; and adverse changes in general market and industry conditions. Further, WestRock's bus inesses are subject to a number of general risks that would affect any such forward - looking statements. Such risks and other factors that may impact management's assumptions are more particularly described in our filings with the Securities and Exchange Commission, including in Item 1A under the caption "Risk Factors" in our Annual Report on Form 10 - K for the year en ded September 30, 2017. Key assumptions related to forward - looking statements presented in this release include, but are not limited to, stable pricing, normal inflation offset by ongoing productivity and incremental returns from high - return projects and acquisitions. The information contained herein speaks as of the date hereof and WestRock does not have or undert ake any obligation to update or revise its forward - looking statements, whether as a result of new information, future events or otherwise.
Non - GAAP Financial Measures We report our financial results in accordance with accounting principles generally accepted in the United States ("GAAP"). Ho wev er, management believes certain non - GAAP financial measures provide users with additional meaningful financial information that shou ld be considered when assessing our ongoing performance. Management also uses these non - GAAP financial measures in making financial, operating and planning decisions and in evaluating our performance. Non - GAAP financial measures should be viewed in addition to, and not as an alternative for, our GAAP results. The non - GAAP financial measures we present may differ from similarly captioned measures p resented by other companies. See the Appendix for details about these non - GAAP financial measures, as well as the required reconciliations. 3
4 Chapter 1: Introduction Steve Voorhees Chief Executive Officer
Agenda Chapter 1: Introduction Steve Voorhees Chapter 2: WestRock’s Differentiated Strategy Pete Durette Chapter 3: North American Corrugated Packaging Jeff Chalovich Chapter 4: Corrugated Focus: Latin America Jim Porter, Jairo Lorenzatto Break (15 minutes) Chapter 5: Consumer Packaging Bob Feeser Chapter 6: Consumer Focus: Multi Packaging Solutions Marc Shore, Dennis Kaltman Chapter 7: Delivering Results for Investors Ward Dickson Chapter 8: Q&A All Chapter 9: Closing Remarks Steve Voorhees 5
Key Takeaways 6 Paper and packaging are attractive businesses where scale and differentiation matter WestRock is building a paper and packaging leader with the strategy and capabilities to generate attractive returns over the long term Margin expansion and deployment of capital provide the opportunity to grow adjusted EBITDA 1 to more than $4 billion in 2022 1) Non - GAAP Financial Measure. See Non - GAAP Financial Measures and Forward - looking Guidance in the Appendix.
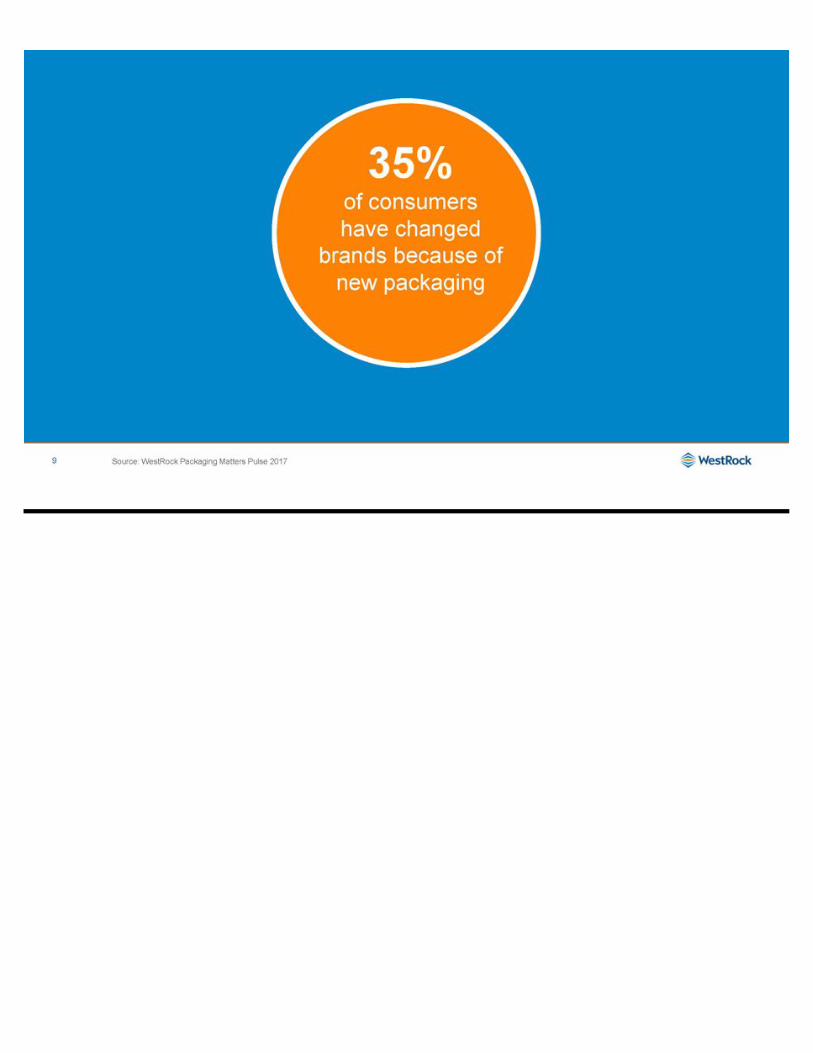
35% of consumers have changed brands because of new packaging 9 Source: WestRock Packaging Matters Pulse 2017
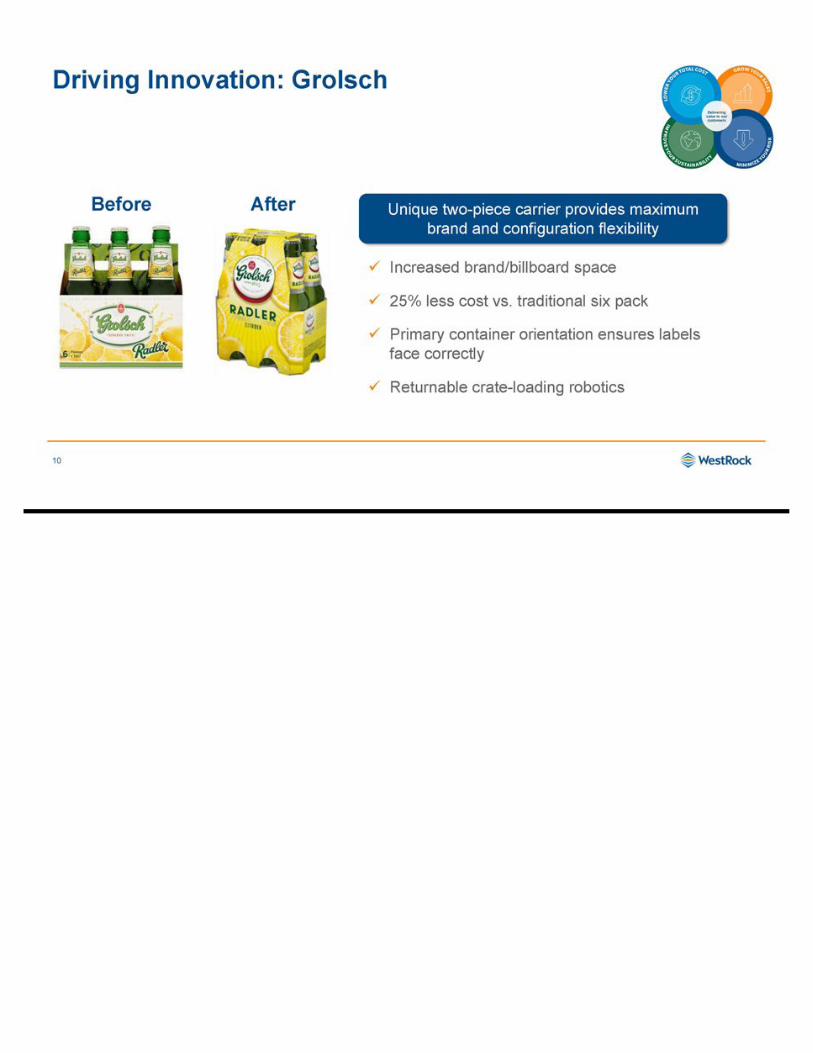
Driving Innovation: Grolsch 10 Before x Increased brand/billboard space x 25% less cost vs. traditional six pack x Primary container orientation ensures labels face correctly x Returnable crate - loading robotics Unique two - piece carrier provides maximum brand and configuration flexibility After
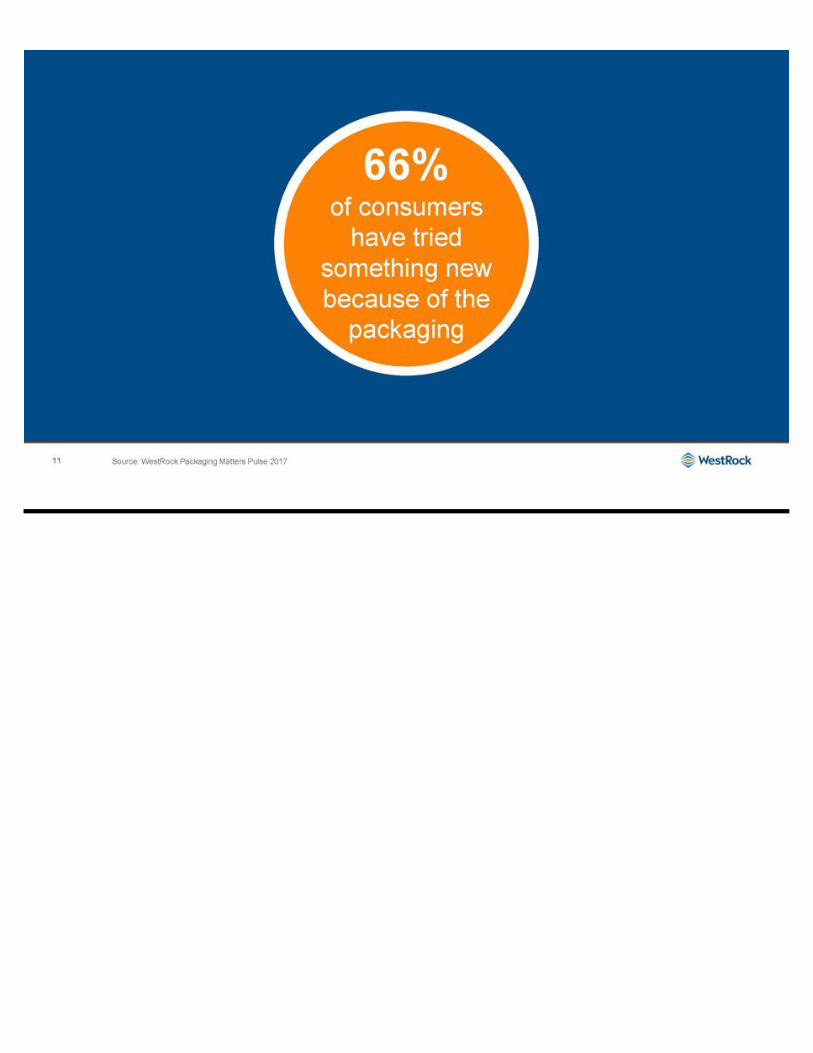
66% of consumers have tried something new because of the packaging Source: WestRock Packaging Matters Pulse 2017 11
Driving Innovation: Pizza Hut 12 x Enhancements include a better insulated delivery pouch, inclusion of a grease resistant single face insert, and an increase in basis weight of the double back liner x Delivered pizza temperatures will increase by 15 degrees and the percentage of hot deliveries will increase from 74% to 96% Developed and commercialized Pizza Hut’s HOT packaging
13 x Advanced strategy to provide differentiated solutions to customers x Expanded presence in attractive end markets x On track to achieve $1B synergy and performance improvement goal b y end of Q3 FY18, ahead of initial guidance Markets & Operations Portfolio Management x Invested $3.4B in M&A, completing 8 acquisitions / investments • MPS expands product offering, market participation, and geographic footprint • Increased ownership in the Grupo Gondi joint venture to 32% • Improved Corrugated integration from 69% to 75% x Spun off Ingevity, creating >$12 of value per share x Sold HH&B generating $1B of net proceeds x Generated >$2.2B of combined Adjusted Free Cash Flow 1 in FY16 and FY17, exceeding targets in each year x Invested over $1.8B to maintain and improve mill and converting network x Announced a 7.5% dividend increase, a combined increase of 15% since the merger x Repurchased $756M of WestRock stock Capital Allocation 1: Adjusted free cash flow is a non - GAAP figure. See Non - GAAP Financial Measures and Forward - looking Guidance in the Appendix. We’ve Been Building a Paper and Packaging Leader
>$16.3B 45% CONSUMER PACKAGING 55% CORRUGATED PACKAGING WestRock Today: Scale and Differentiation Matter 14 NET SALES 1 $25B IN ASSETS INVESTED ACROSS >300 OPERATING AND BUSINESS LOCATIONS # 1 or # 2 MARKET POSITIONS HELD IN GROWING CONSUMER AND CORRUGATED PACKAGING MARKETS $ 16B 1 GLOBAL PAPER AND PACKAGING COMPANY 1. Forecasted FY18 sales
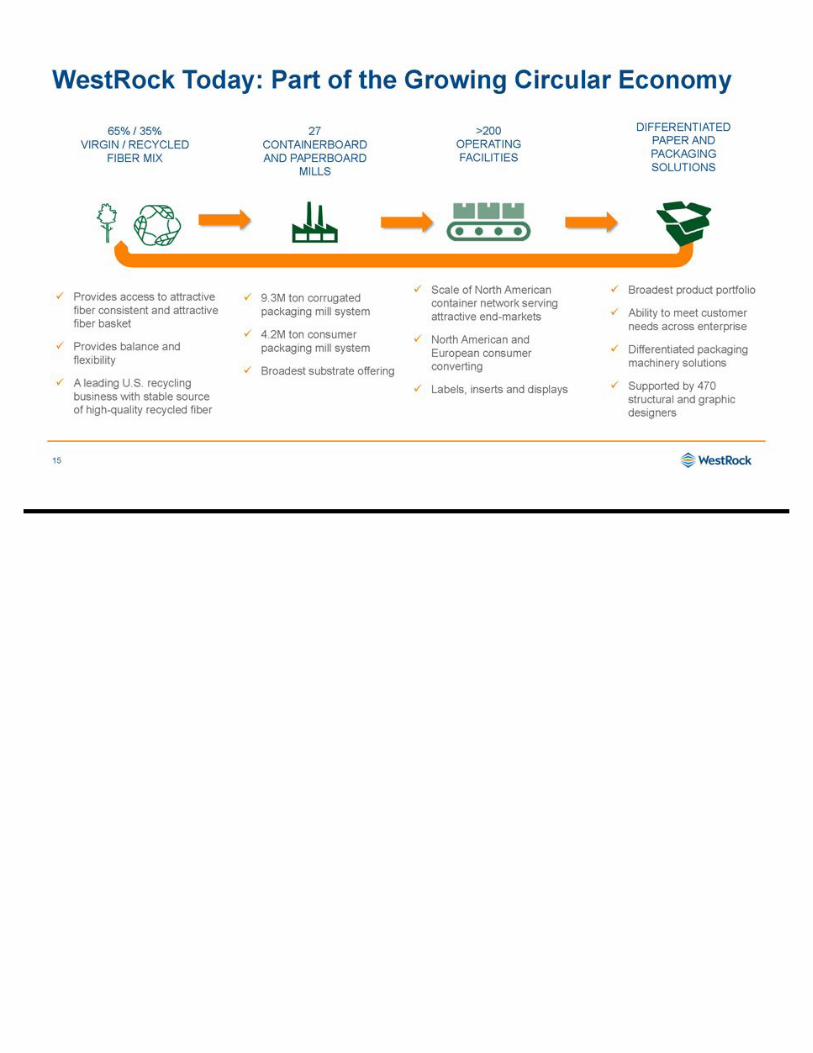
WestRock Today: Part of the Growing Circular Economy 15 27 CONTAINERBOARD AND PAPERBOARD MILLS x 9.3M ton corrugated packaging mill system x 4.2M ton consumer packaging mill system x Broadest substrate offering 65% / 35% VIRGIN / RECYCLED FIBER MIX x Provides access to attractive fiber consistent and attractive fiber basket x Provides balance and flexibility x A leading U.S. recycling business with stable source of high - quality recycled fiber DIFFERENTIATED PAPER AND PACKAGING SOLUTIONS x Broadest product portfolio x Ability to meet customer needs across enterprise x Differentiated packaging machinery solutions x Supported by 470 structural and graphic designers >200 OPERATING FACILITIES x Scale of North American container network serving attractive end - markets x North American and European consumer converting x Labels, inserts and displays
16 Our vision is to be the premier partner and unrivaled provider of winning solutions to our customers
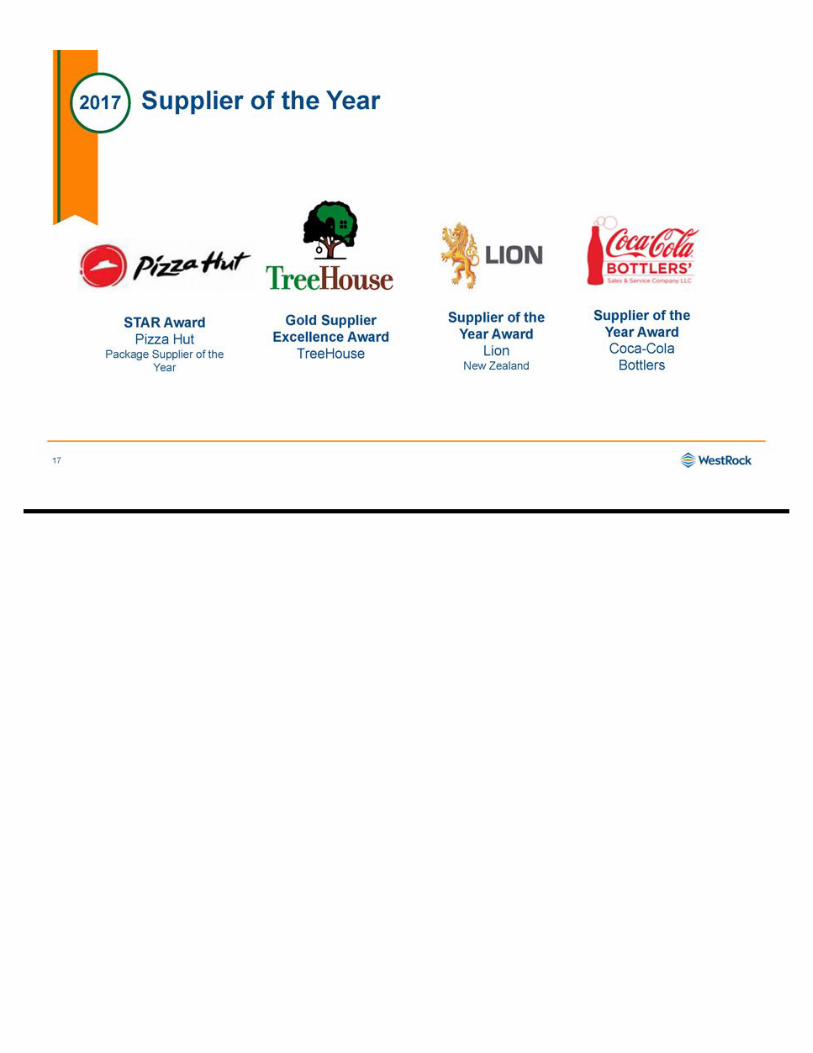
Supplier of the Year 2017 17 Gold Supplier Excellence Award TreeHouse STAR Award Pizza Hut Package Supplier of the Year Supplier of the Year Award Lion New Zealand Supplier of the Year Award Coca - Cola Bottlers
WestRock: Creating Shareholder Value 18 Outstanding Execution & Delivery Disciplined Capital Allocation Broad Portfolio of Differentiated Solutions x Delivering our broad portfolio of differentiated solutions to customers x Executing on productivity opportunities and generating strong cash flow x Reinvesting our cash flow back into the business and returning capital to stockholders We are building a leading paper and packaging company with the strategy and capabilities to generate attractive returns
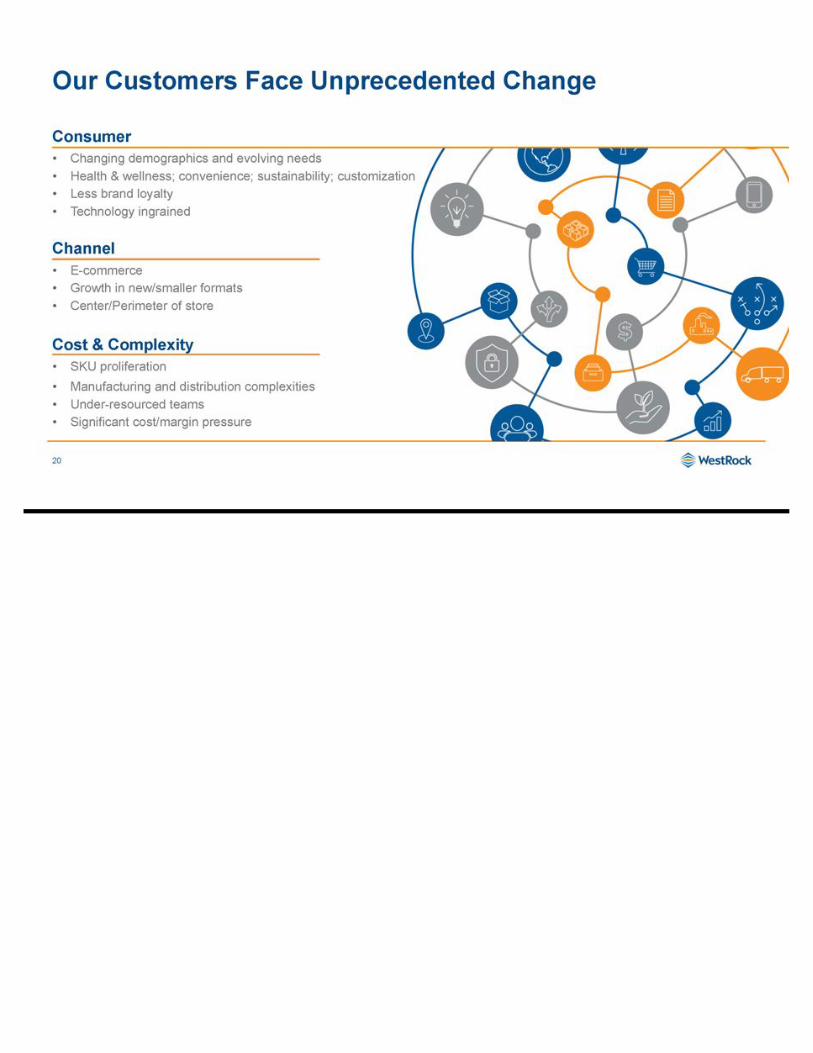
Our Customers Face Unprecedented Change 20 Channel • E - commerce • Growth in new/smaller formats • Center/Perimeter of store Cost & Complexity • SKU proliferation • Manufacturing and distribution complexities • Under - resourced teams • Significant cost/margin pressure Consumer • Changing demographics and evolving needs • Health & wellness; convenience; sustainability; customization • Less brand loyalty • Technology ingrained
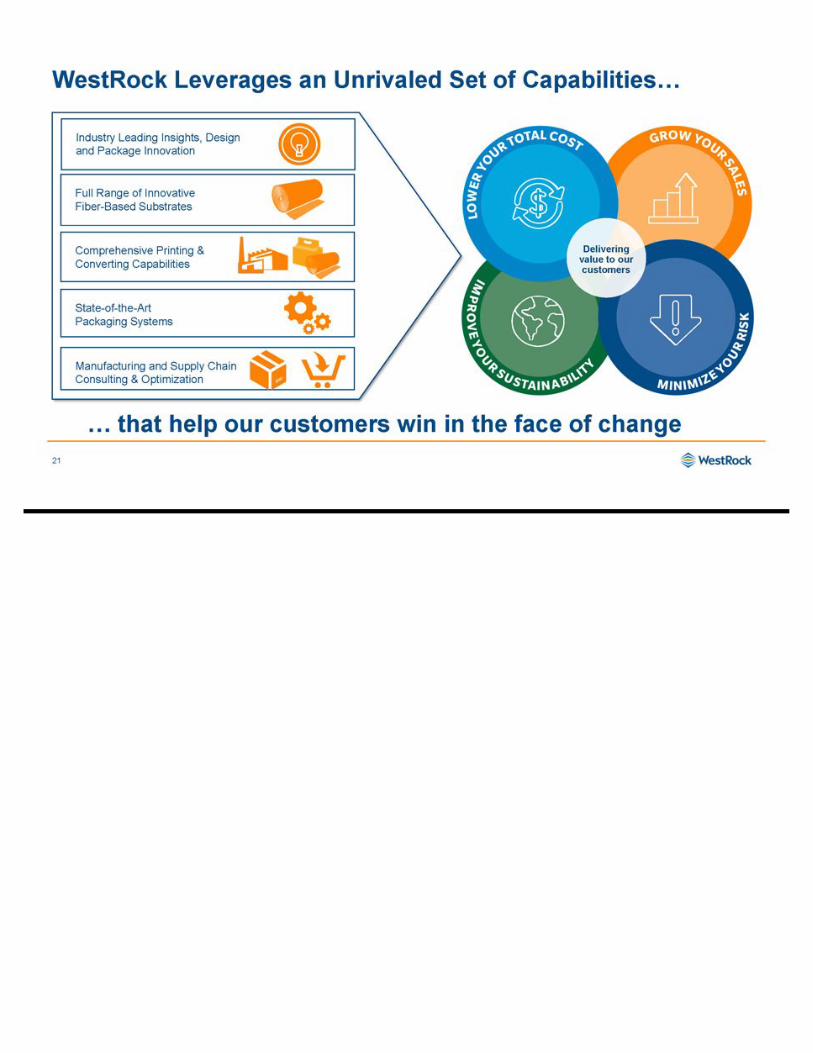
WestRock Leverages an Unrivaled Set of Capabilities… 21 Full Range of Innovative Fiber - Based Substrates Comprehensive Printing & Converting Capabilities State - of - the - Art Packaging Systems Manufacturing and Supply Chain Consulting & Optimization Industry Leading Insights, Design and Package Innovation Delivering value to our customers … that help our customers win in the face of change
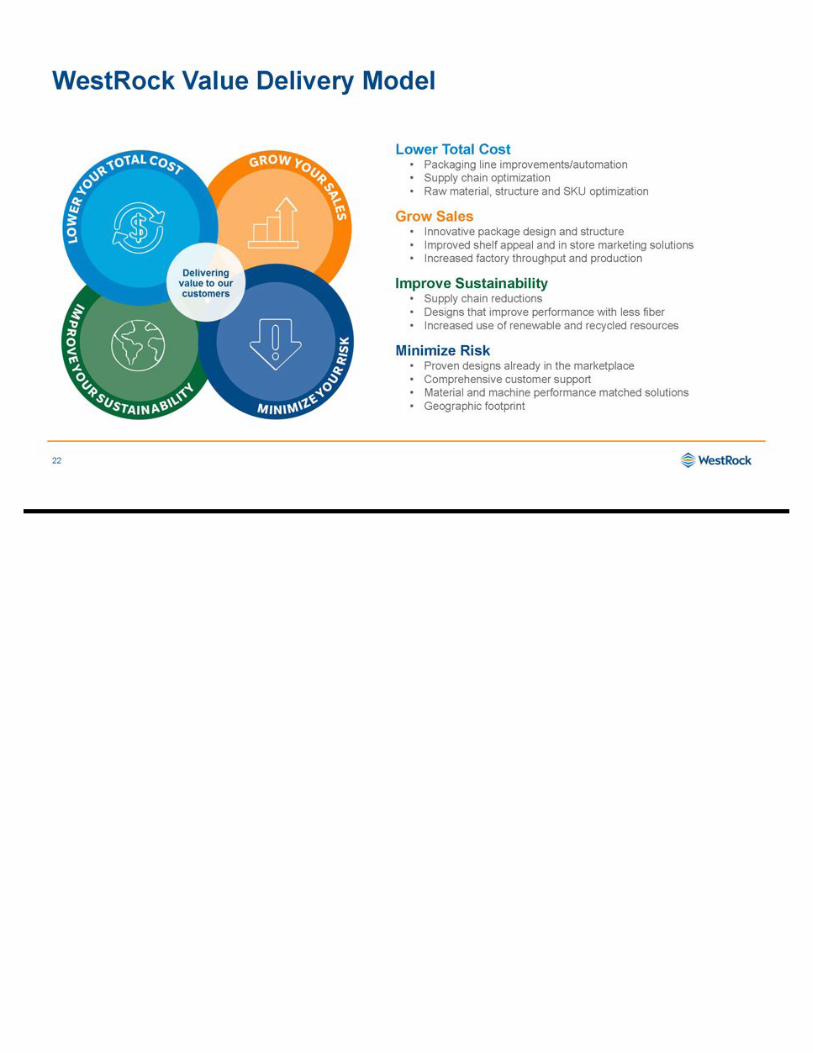
WestRock Value Delivery Model 22 Lower Total Cost • Packaging line improvements/automation • Supply chain optimization • Raw material, structure and SKU optimization Grow Sales • Innovative package design and structure • Improved shelf appeal and in store marketing solutions • Increased factory throughput and production Improve Sustainability • Supply chain reductions • Designs that improve performance with less fiber • Increased use of renewable and recycled resources Minimize Risk • Proven designs already in the marketplace • Comprehensive customer support • Material and machine performance matched solutions • Geographic footprint
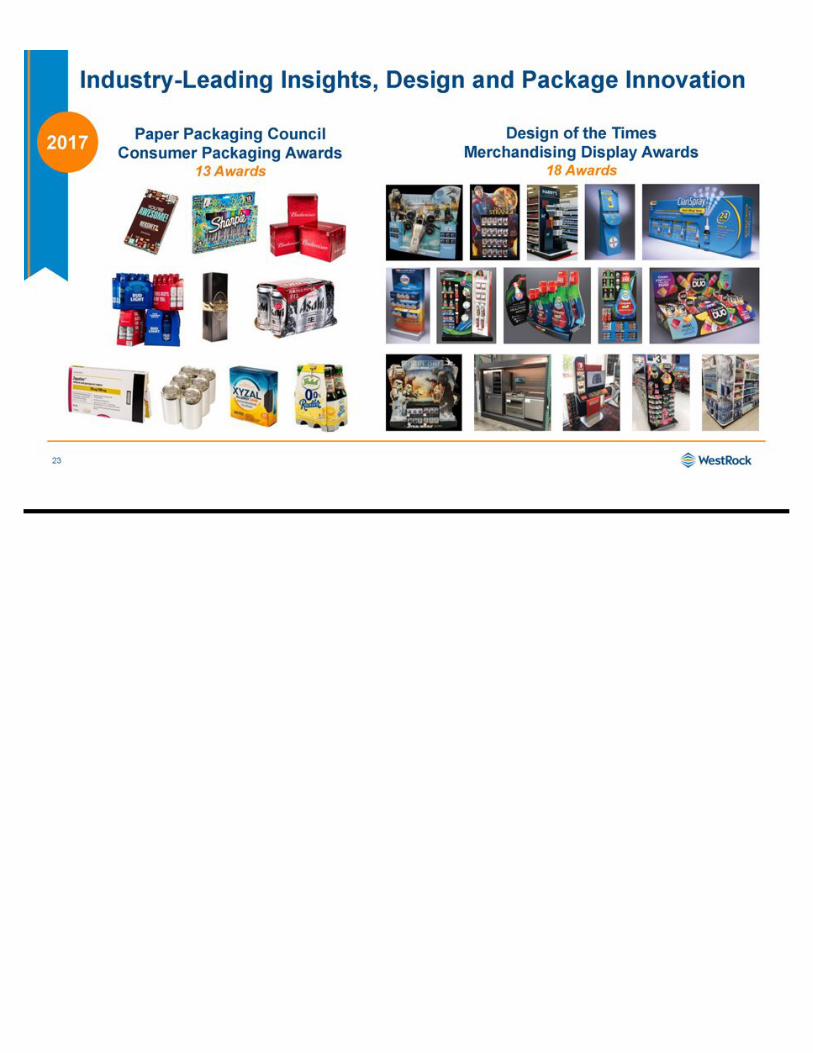
Industry - Leading Insights, Design and Package Innovation 23 2017 Paper Packaging Council Consumer Packaging Awards 13 Awards Design of the Times Merchandising Display Awards 18 Awards
Winning Together: Chattem (a Sanofi company) 24 The Challenge: Develop packaging and in - store merchandising for Chattem’s critical consumer launch of Xyzal® • Educate and attract pharmacists and consumers • Meet tight launch window on Rx to OTC The Solution: Differentiated packaging and in - store merchandising that drove a highly successful launch with market - leading speed • MPS: Cartons with embossing, windowing, hinged covers and application of CheckPoint ®/ Sensormatic ® security tags • Merchandising Displays: Engaging in - store display helping educate and attract consumers and tailored to different retail outlets Lower Your Total Cost • Optimized packaging and displays fit for purpose for launch Grow Your Sales • Differentiated packaging and highly effective in - store marketing helped Chattem with a highly successful launch Improve Sustainability • Mix of recyclable and renewable materials were used Minimize Your Risk • Managed complex requirements and special service needs of an RX to OTC switch in a very tight launch window Winning Together:
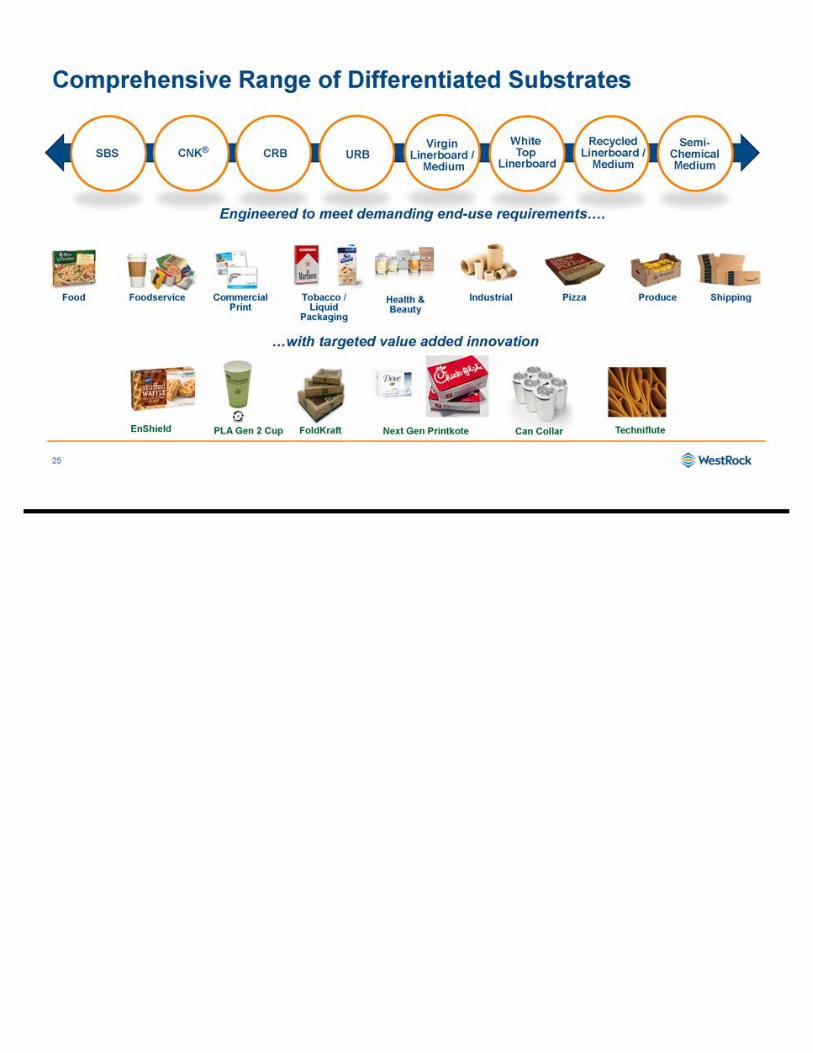
SBS CNK ® C RB URB Virgin Linerboard / Medium White Top Linerboard Recycled Linerboard / Medium Semi - Chemical Medium Food Foodservice Commercial Print Tobacco / Liquid Packaging Health & Beauty Industrial Pizza Produce Shipping Comprehensive Range of Differentiated Substrates PLA Gen 2 Cup EnShield Can Collar FoldKraft Techniflute Next Gen Printkote Engineered to meet demanding end - use requirements…. …with targeted value added innovation 25
Packaging Systems: Value Added Solutions 26 Corrugated Automated Packaging Systems Beverage Packaging Systems Embedded solutions enhance customer integration and retention 2,000 Deployed 1,000 Deployed
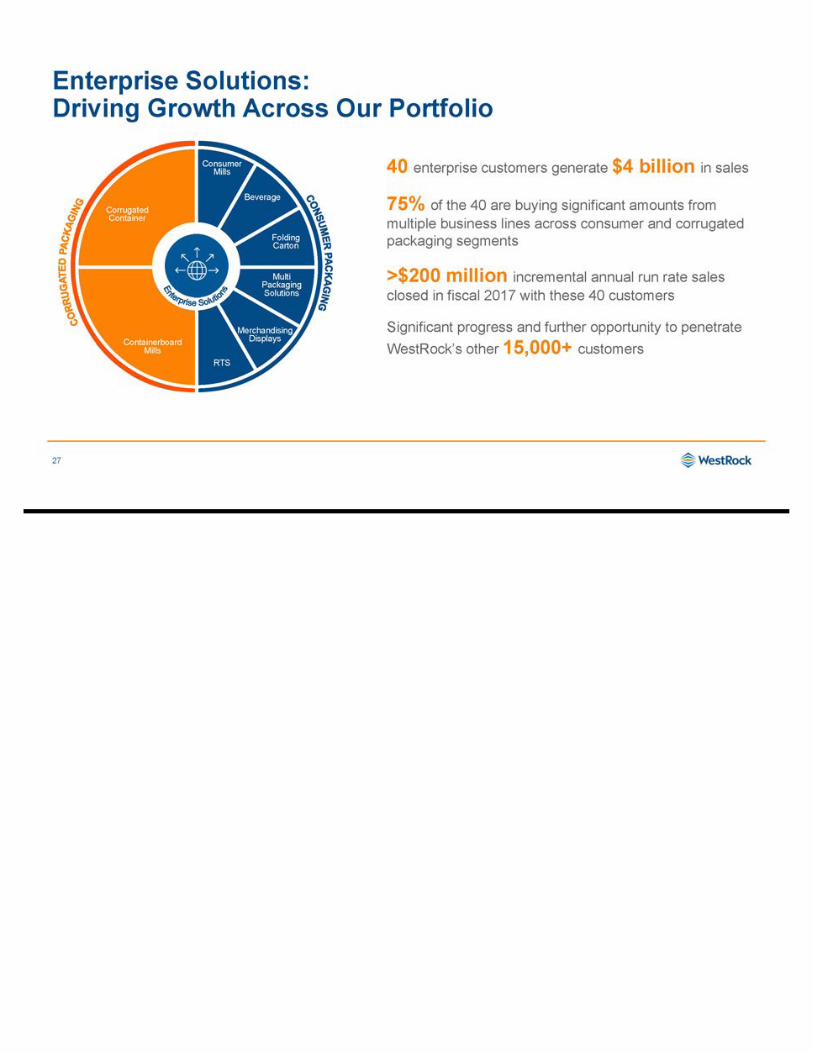
Enterprise Solutions: Driving Growth Across Our Portfolio 27 Enterprise Solutions gives you unfettered access to the broadest portfolio of products, capabilities and assets in the industry – and an expert team dedicated to help you navigate all that we do. The result? A holistic – and comprehensive – approach to solution development that will ensure your success in today’s complex environment. Corrugated Container Containerboard Mills Beverage Folding Carton Merchandising Displays Multi Packaging Solutions RTS Consumer Mills 40 enterprise customers generate $4 billion in sales 75% of the 40 are buying significant amounts from multiple business lines across consumer and corrugated packaging segments >$200 million incremental annual run rate sales closed in fiscal 2017 with these 40 customers Significant progress and further opportunity to penetrate WestRock’s other 15,000+ customers
Differentiated Strategy Drives Results 28 x Customers are facing unprecedented change and challenges x WestRock is uniquely positioned to help customers win in the face of their challenges with unmatched breadth of innovative solutions and unrivaled capabilities x WestRock’s differentiation strategy is an important driver of future value creation Outstanding Execution & Delivery Disciplined Capital Allocation Broad Portfolio of Differentiated Solutions
Chapter 3: North American Corrugated Packaging Delivering value beyond the box Jeff Chalovich President, Corrugated Packaging 29
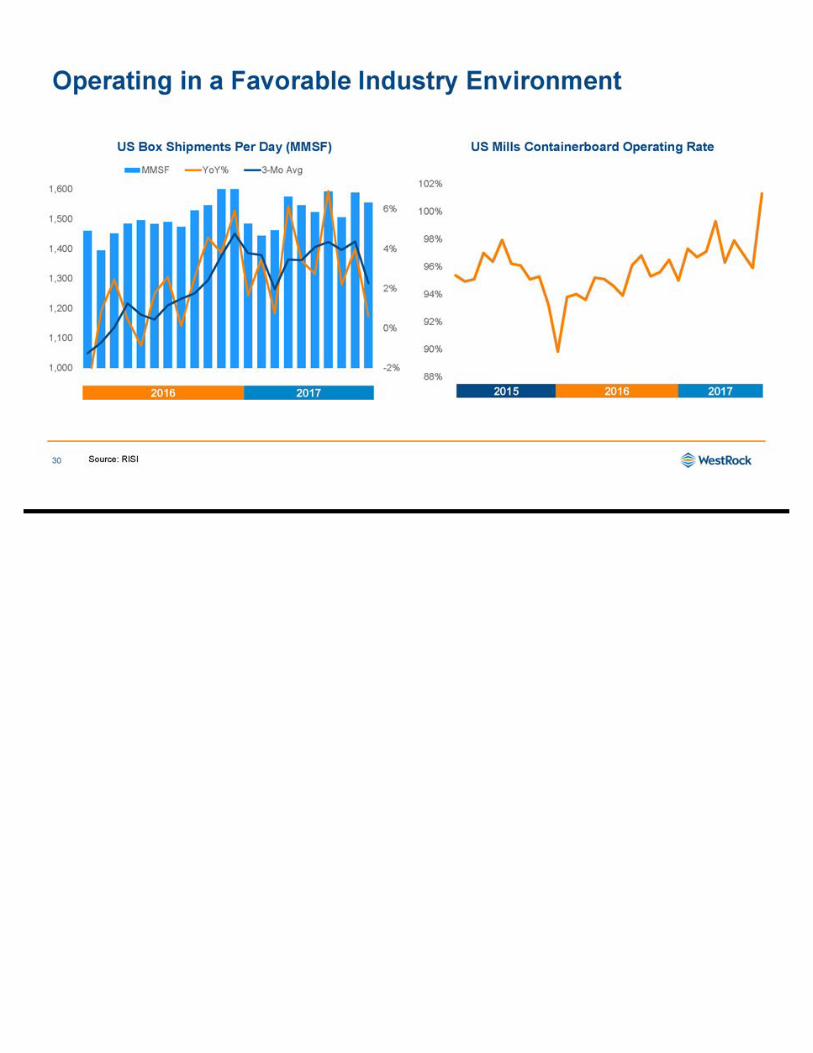
Operating in a Favorable Industry Environment 30 US Box Shipments Per Day (MMSF) US Mills Containerboard Operating Rate -2% 0% 2% 4% 6% 1,000 1,100 1,200 1,300 1,400 1,500 1,600 MMSF YoY% 3-Mo Avg 88% 90% 92% 94% 96% 98% 100% 102% 2015 2017 2016 2017 2016 Source: RISI
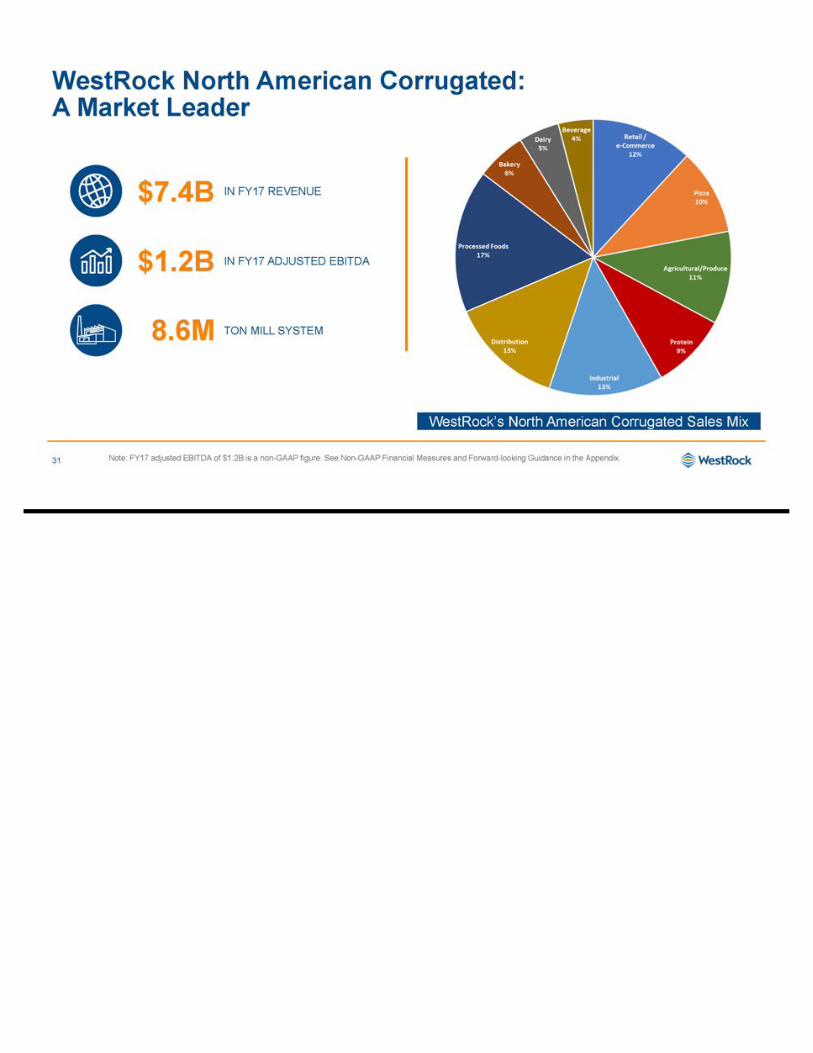
WestRock North American Corrugated: A Market Leader 31 $1.2B IN FY17 ADJUSTED EBITDA 8.6M TON MILL SYSTEM $7.4B IN FY17 REVENUE Note: FY17 adjusted EBITDA of $1.2B is a non - GAAP figure. See Non - GAAP Financial Measures and Forward - looking Guidance in the Ap pendix. WestRock’s North American Corrugated Sales Mix
WestRock North American Corrugated System 32 13 CORRUGATED MILLS x 8.6M ton corrugated packaging mill system x Broad range of products from lightweight used in foodservice packaging to heavyweight liners used in produce and protein packaging x Largest white top linerboard producer 60% / 40% VIRGIN / RECYCLED FIBER MIX x Access to stable and attractive virgin fiber basket x Provides balance and flexibility x A leading U.S. recycling business providing stable source of high - quality recycled fiber DIFFERENTIATED PAPER AND PACKAGING SOLUTIONS x Broad product portfolio x Investing in innovation to meet customer needs across enterprise x Differentiated Automated Packaging Systems 94 OPERATING FACILITIES x Scale of North American container network serving attractive end markets x 75% vertically integrated x Preprint capabilities
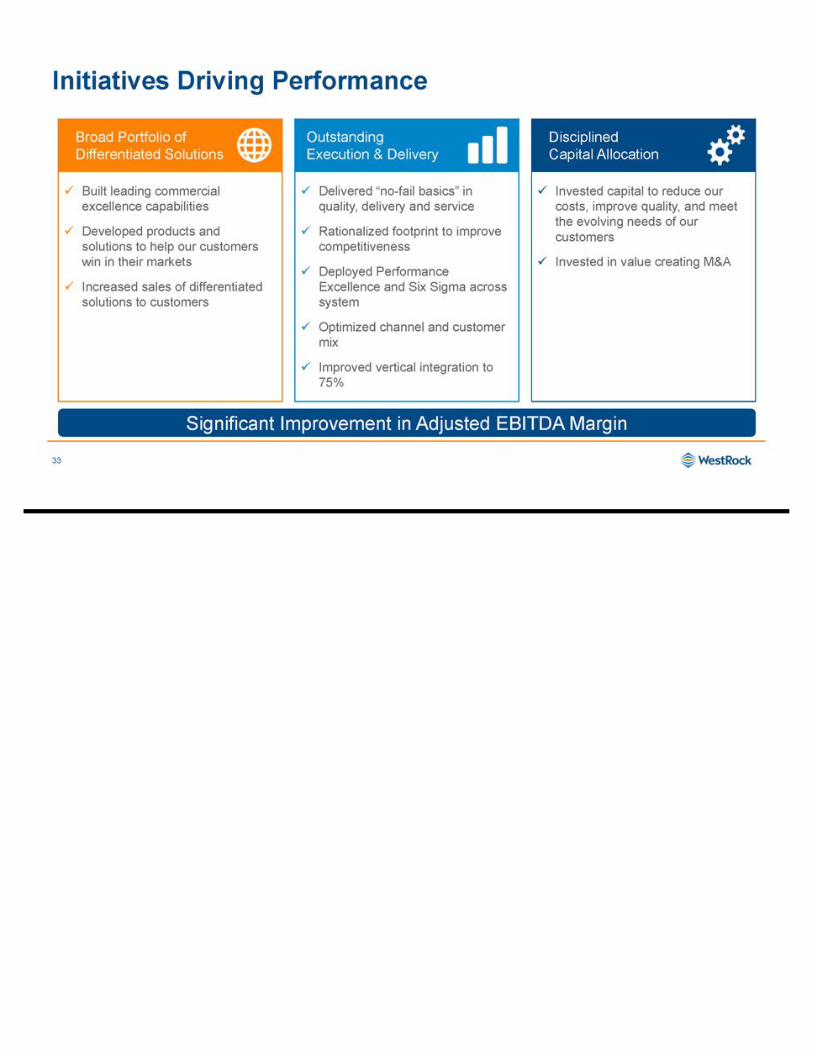
Initiatives Driving Performance Outstanding Execution & Delivery x Delivered “no - fail basics” in quality, delivery and service x Rationalized footprint to improve competitiveness x Deployed Performance Excellence and Six Sigma across system x Optimized channel and customer mix x Improved vertical integration to 75% x Built leading commercial excellence capabilities x Developed products and solutions to help our customers win in their markets x Increased sales of differentiated solutions to customers Broad Portfolio of Differentiated Solutions x Invested capital to reduce our costs, improve quality, and meet the evolving needs of our customers x Invested in value creating M&A Disciplined Capital Allocation Significant Improvement in Adjusted EBITDA Margin 33
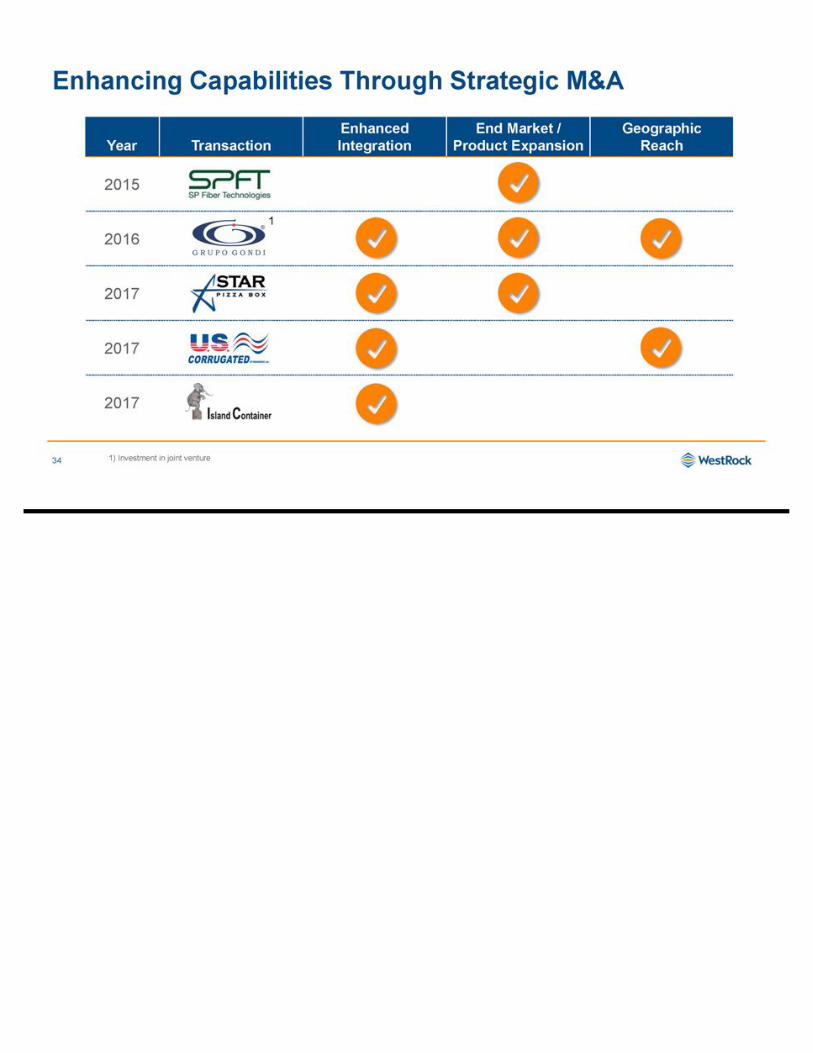
Enhancing Capabilities Through Strategic M&A Year Transaction Enhanced Integration End Market / Product Expansion Geographic Reach 2015 2016 2017 2017 2017 34 1 1) Investment in joint venture
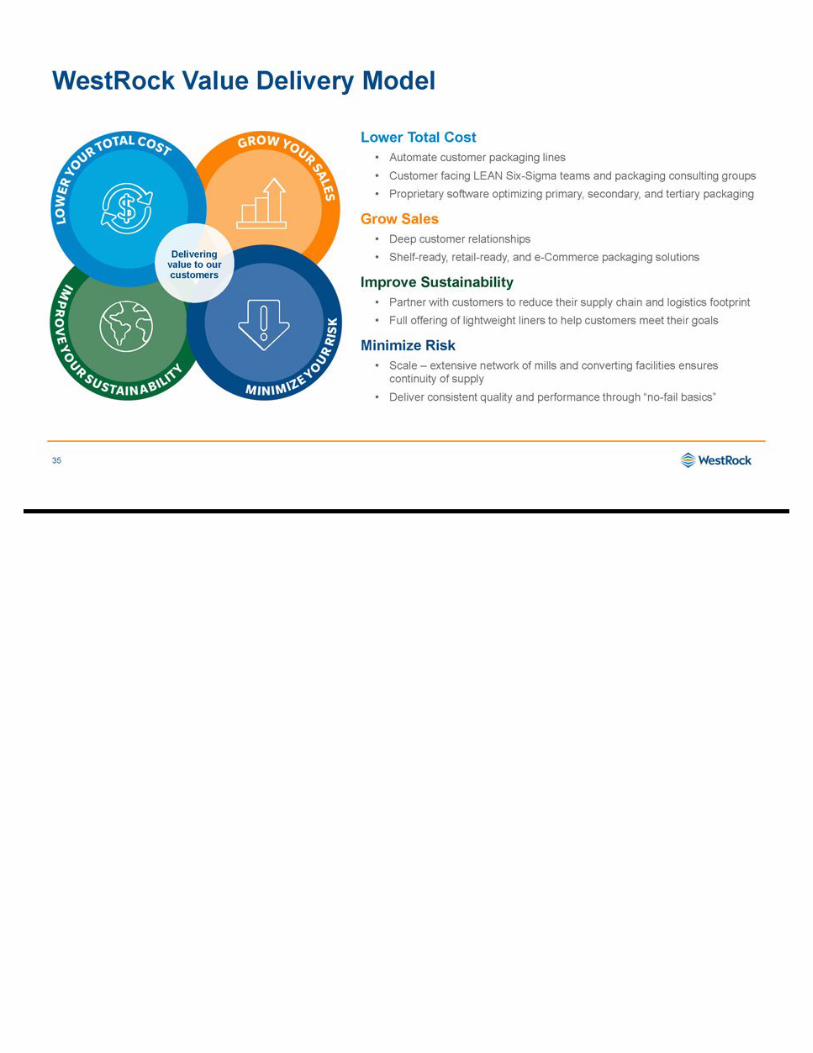
WestRock Value Delivery Model 35 Lower Total Cost • Automate customer packaging lines • Customer facing LEAN Six - Sigma teams and packaging consulting groups • Proprietary software optimizing primary, secondary, and tertiary packaging Grow Sales • Deep customer relationships • Shelf - ready, retail - ready, and e - Commerce packaging solutions Improve Sustainability • Partner with customers to reduce their supply chain and logistics footprint • Full offering of lightweight liners to help customers meet their goals Minimize Risk • Scale – extensive network of mills and converting facilities ensures continuity of supply • Deliver consistent quality and performance through “no - fail basics” Delivering value to our customers
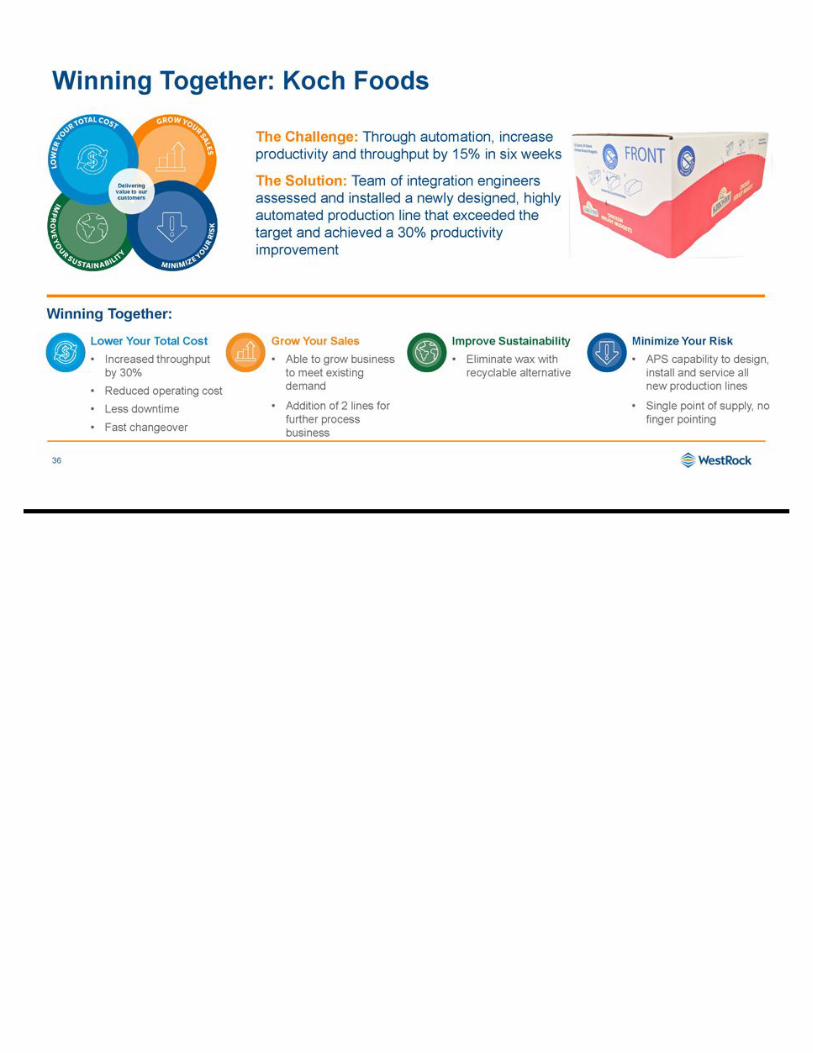
Winning Together: Koch Foods 36 The Challenge: Through automation, increase productivity and throughput by 15% in six weeks The Solution: Team of integration engineers assessed and installed a newly designed, highly automated production line that exceeded the target and achieved a 30% productivity improvement Lower Your Total Cost • Increased throughput by 30% • Reduced operating cost • Less downtime • Fast changeover Grow Your Sales • Able to grow business to meet existing demand • Addition of 2 lines for further process business Improve Sustainability • Eliminate wax with recyclable alternative Minimize Your Risk • APS capability to design, install and service all new production lines • Single point of supply, no finger pointing Winning Together:
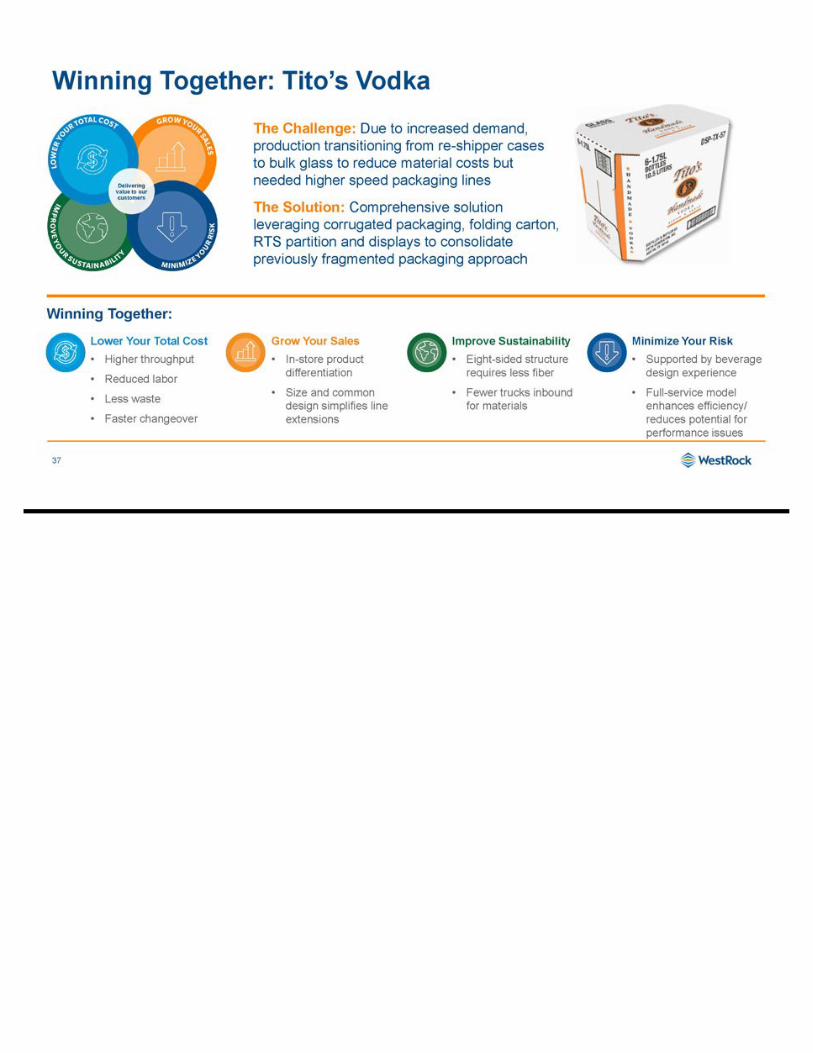
Winning Together: Tito’s Vodka 37 The Challenge: Due to increased demand, production transitioning from re - shipper cases to bulk glass to reduce material costs but needed higher speed packaging lines The Solution: Comprehensive solution leveraging corrugated packaging, folding carton, RTS partition and displays to consolidate previously fragmented packaging approach Lower Your Total Cost • Higher throughput • Reduced labor • Less waste • Faster changeover Grow Your Sales • In - store product differentiation • Size and common design simplifies line extensions Improve Sustainability • Eight - sided structure requires less fiber • Fewer trucks inbound for materials Minimize Your Risk • Supported by beverage design experience • Full - service model enhances efficiency/ reduces potential for performance issues Winning Together:
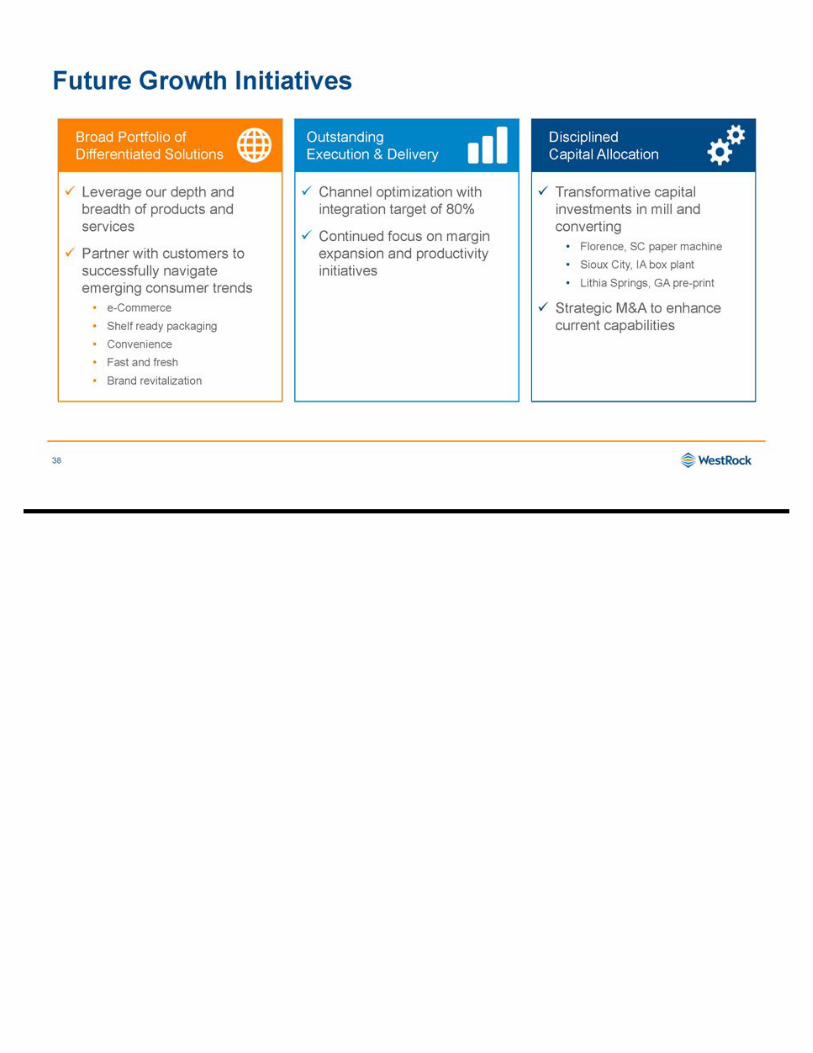
Future Growth Initiatives Outstanding Execution & Delivery x Channel optimization with integration target of 80% x Continued focus on margin expansion and productivity initiatives x Leverage our depth and breadth of products and services x Partner with customers to successfully navigate emerging consumer trends • e - Commerce • Shelf ready packaging • Convenience • Fast and fresh • Brand revitalization Broad Portfolio of Differentiated Solutions x Transformative capital investments in mill and converting • Florence, SC paper machine • Sioux City, IA box plant • Lithia Springs, GA pre - print x Strategic M&A to enhance current capabilities Disciplined Capital Allocation 38
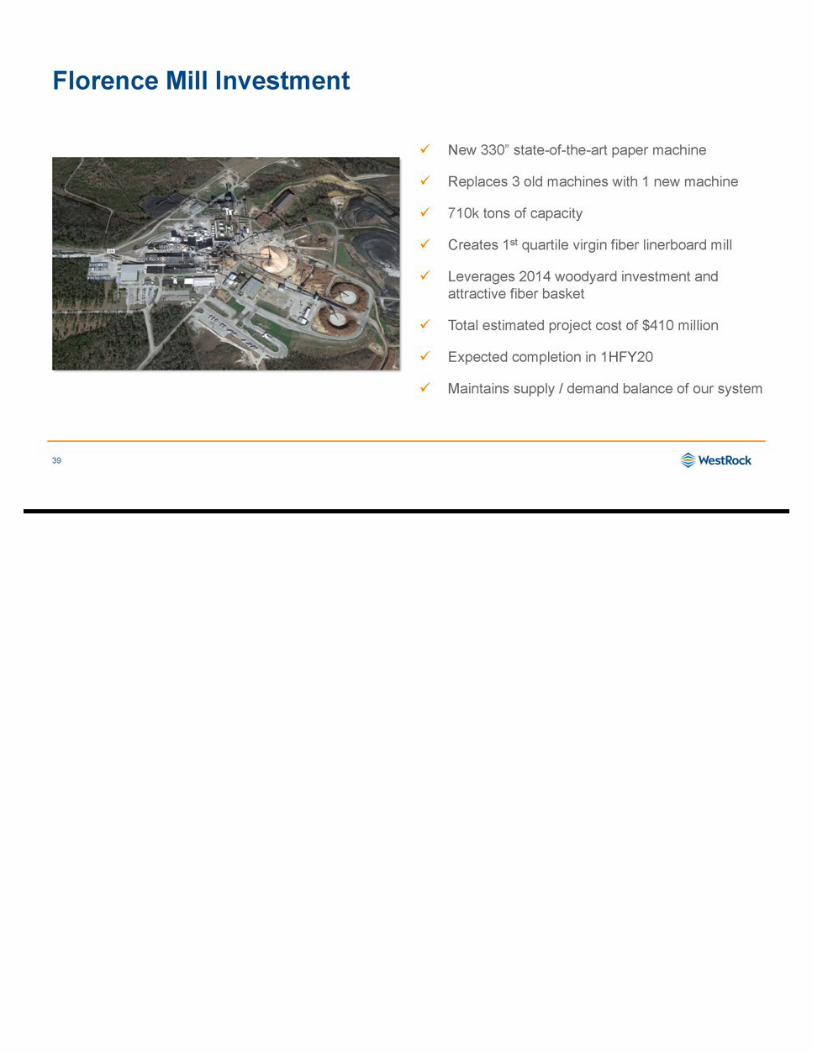
Florence Mill Investment 39 x New 330” state - of - the - art paper machine x Replaces 3 old machines with 1 new machine x 710k tons of capacity x Creates 1 st quartile virgin fiber linerboard mill x Leverages 2014 woodyard investment and attractive fiber basket x Total estimated project cost of $410 million x Expected completion in 1HFY20 x Maintains supply / demand balance of our system
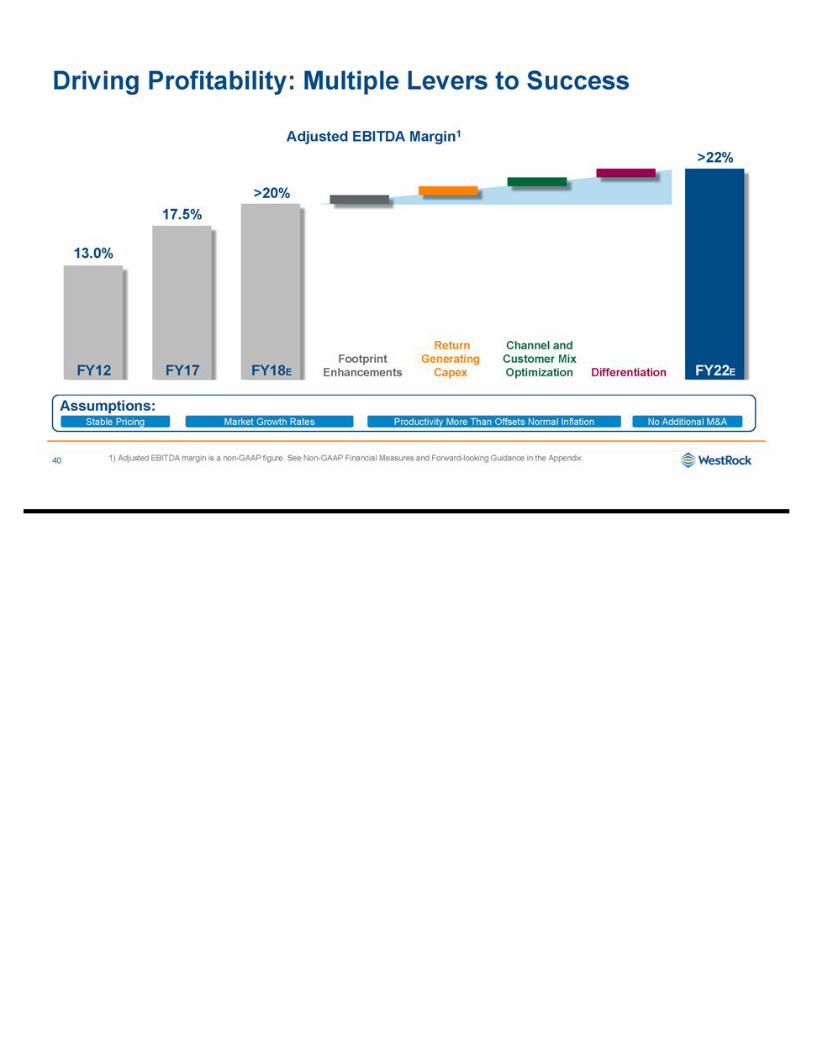
Driving Profitability: Multiple Levers to Success 40 The image part with relationship ID rId3 was not found in the file. >20% >22% 17.5% 13.0% Footprint Enhancements Return Generating Capex Channel and Customer Mix Optimization Differentiation FY12 FY17 FY18 E FY22 E Adjusted EBITDA Margin 1 Assumptions: Stable Pricing Market Growth Rates Productivity More Than Offsets Normal Inflation No Additional M&A 1) Adjusted EBITDA margin is a non - GAAP figure. See Non - GAAP Financial Measures and Forward - looking Guidance in the Appendix.
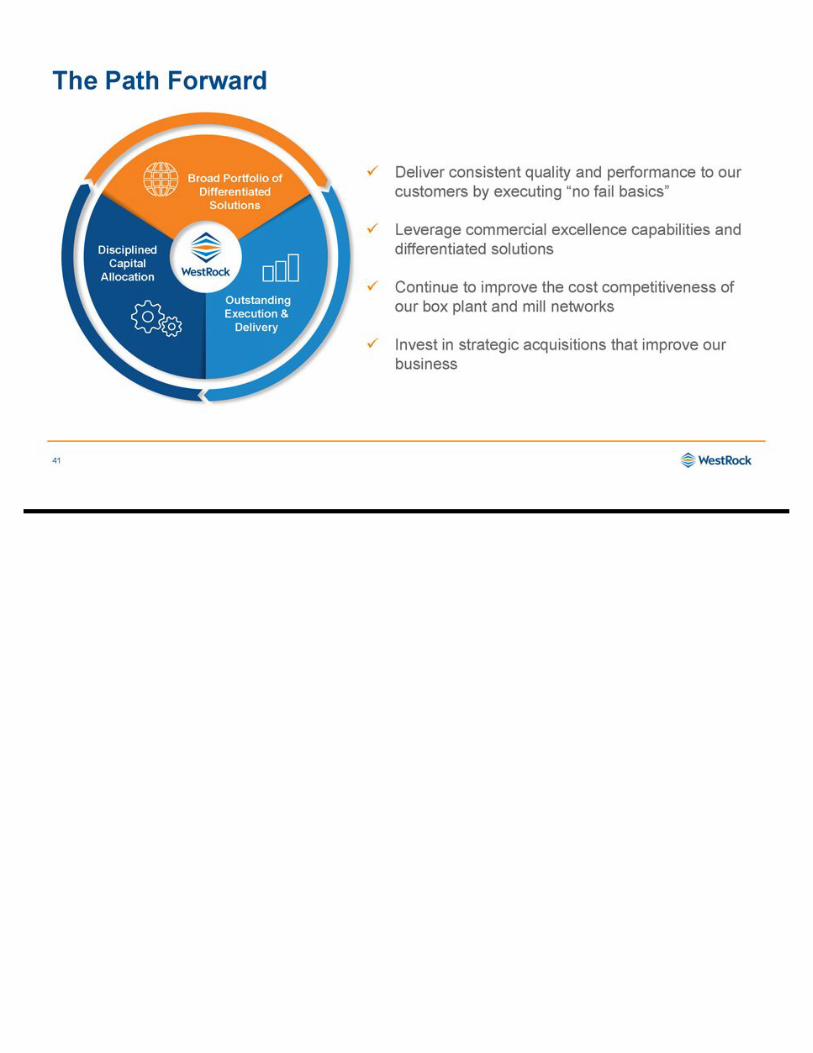
The Path Forward 41 x Deliver consistent quality and performance to our customers by executing “no fail basics” x Leverage commercial excellence capabilities and differentiated solutions x Continue to improve the cost competitiveness of our box plant and mill networks x Invest in strategic acquisitions that improve our business Outstanding Execution & Delivery Disciplined Capital Allocation Broad Portfolio of Differentiated Solutions
Chapter 4: Corrugated Focus – Latin America Jim Porter President, Business Development & Latin America Jairo Lorenzatto President, Brazil 42
Why Latin America? 43 x Attractive and growing packaging markets in Mexico and Brazil x Operating and investing in high - quality assets x Leverage our scale - Deep relationships across broad global customer base providing strong enterprise growth opportunity
Mexican Packaging Market Overview 44 Mexican Market Dynamics 2 x Big, young population of 128 million and growing quickly x Low - cost manufacturer and natural supplier to North American markets x Large and growing agricultural market, requiring virgin containerboard x 5 million metric ton containerboard and boxboard market x 3,000+ companies along Mexican border shipping products worldwide 2. Source: RISI, INEGI and World Bank 1. Source: WestRock estimates based on publicly available data including RISI, ANFEC, The Mexican Paper Chamber; and financi al research Mexican Packaging Market Overview 1
Grupo Gondi Overview 45 #1 HIGH GRAPHICS PACKAGING 15 PRODUCTION SITES #2 RECYCLED CONTAINERBOARD, BOXBOARD and CORRUGATED PACKAGING Mill Location Packaging Facility Future Greenfield Facility Grupo Gondi Source: Data provided by The Mexican Paper Chamber WestRock is 32% Equity Partner
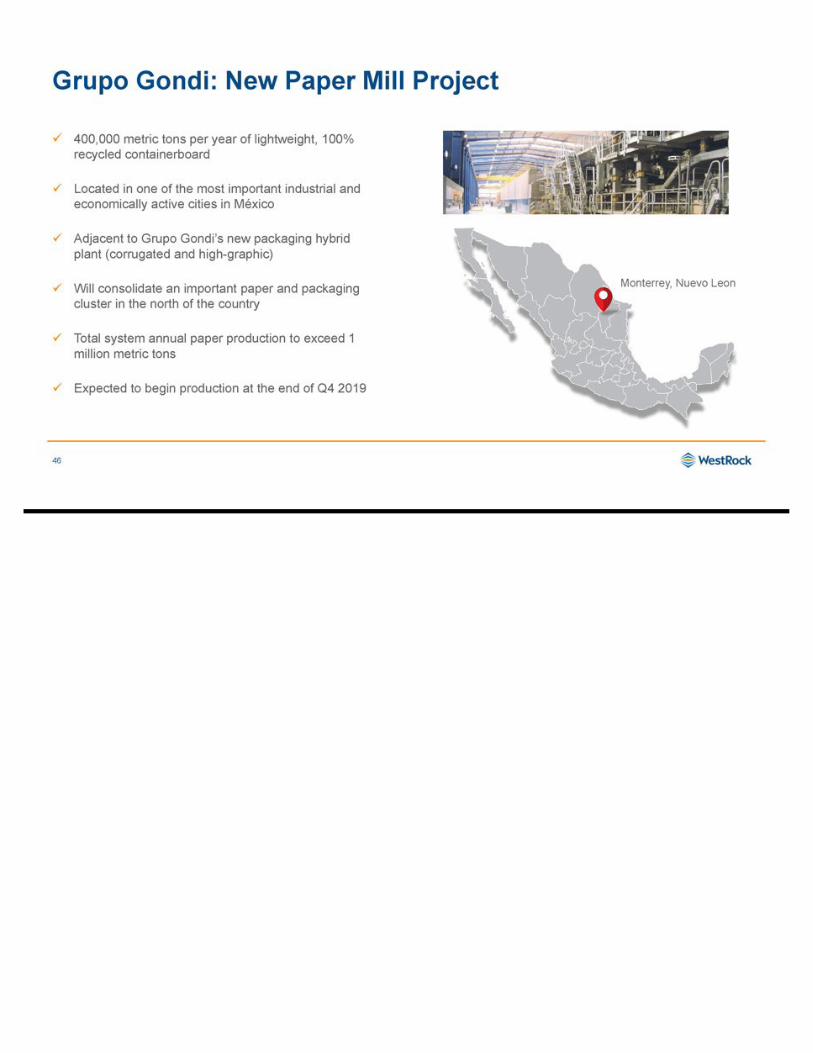
Grupo Gondi: New Paper Mill Project 46 Monterrey, Nuevo Leon x 400,000 metric tons per year of lightweight, 100% recycled containerboard x Located in one of the most important industrial and economically active cities in México x Adjacent to Grupo Gondi’s new packaging hybrid plant (corrugated and high - graphic) x Will consolidate an important paper and packaging cluster in the north of the country x Total system annual paper production to exceed 1 million metric tons x Expected to begin production at the end of Q4 2019
Brazilian Packaging Market Overview 47 Brazil Market Dynamics x Very large population: 208 million x 5 million metric ton corrugated market x Improving economic conditions x Growing household income x Robust protein and agriculture markets x Low e - Commerce penetration – growing quickly Sources: RISI and World Bank Meat 23% Health & Beauty 9% Textile & Footware 9% Chemicals 8% Produce 8% Food 8% Sheets 7% Oils And Fats 7% Machines 3% Beverage 2% Materials 3% Metal 2% Dairy 1% All Other 10% WestRock Brazil Sales Mix
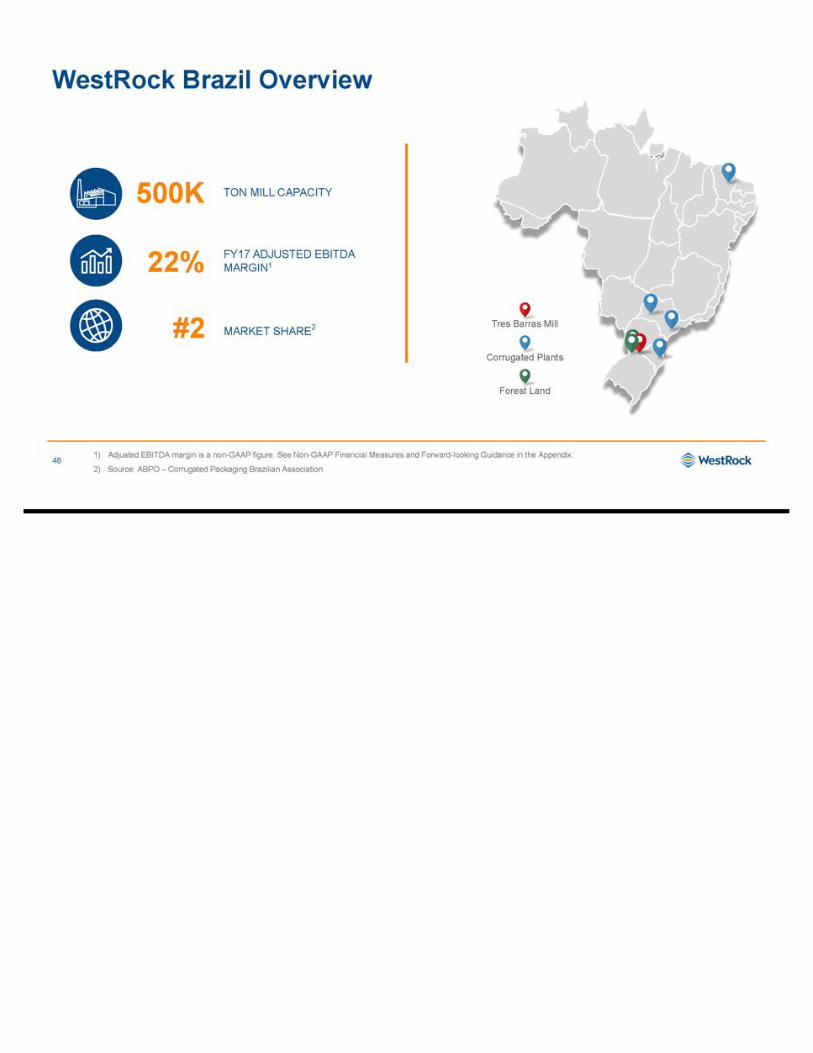
WestRock Brazil Overview 48 22% FY17 ADJUSTED EBITDA MARGIN 1 500K TON MILL CAPACITY #2 MARKET SHARE 2 1) Adjusted EBITDA margin is a non - GAAP figure. See Non - GAAP Financial Measures and Forward - looking Guidance in the Appendix. 2) Source : ABPO – Corrugated Packaging Brazilian Association Forest Land Corrugated Plants Tres Barras Mill
WestRock Brazil: Growth Strategy 49 Porto Feliz Corrugated Plant x $125 million (1) state - of - the - art plant will increase capacity, reduce costs, enhance product capabilities x Largest, most productive box plant in the Americas x Enhanced capability with high - graphic technology x Best - in - class lead time, service and reliability x Expected completion in Q3 - FY19 x Increased integration with Tres Barras virgin containerboard mill 1. Net of sales proceeds from existing facility
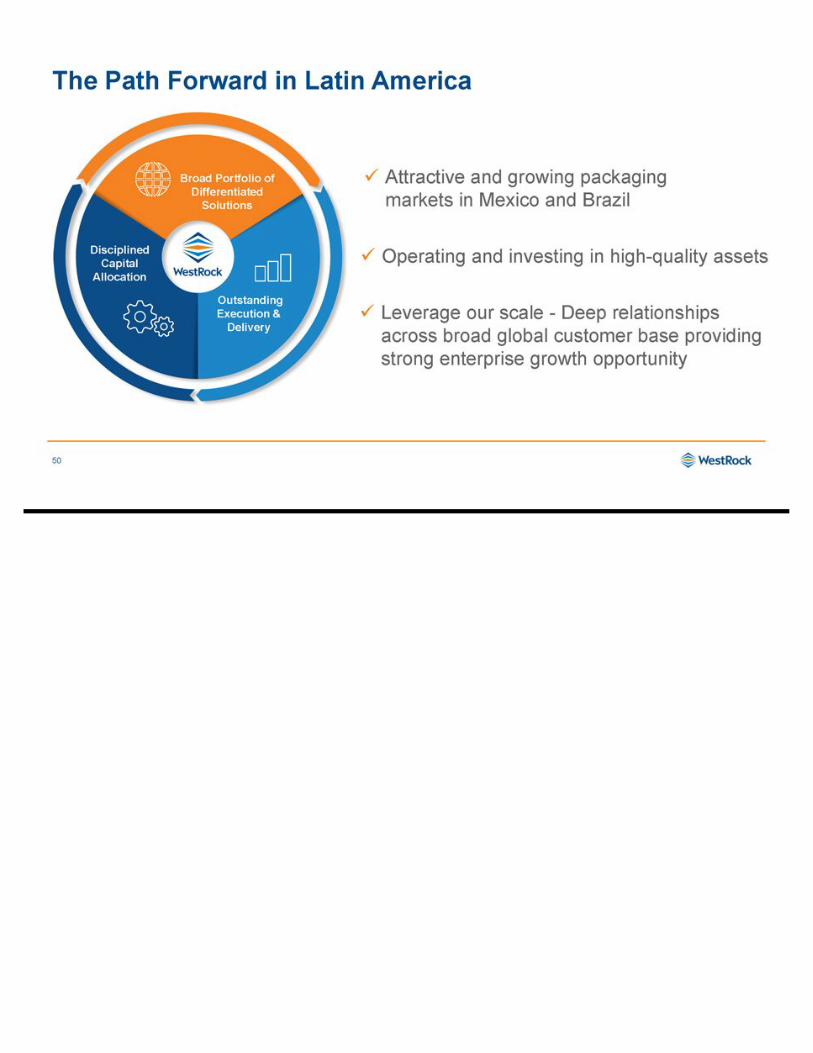
The Path Forward in Latin America 50 x Attractive and growing packaging markets in Mexico and Brazil x Operating and investing in high - quality assets x Leverage our scale - Deep relationships across broad global customer base providing strong enterprise growth opportunity Outstanding Execution & Delivery Disciplined Capital Allocation Broad Portfolio of Differentiated Solutions
Chapter 5: Consumer Packaging — Winning through differentiation Bob Feeser President, Consumer Business Segment 51
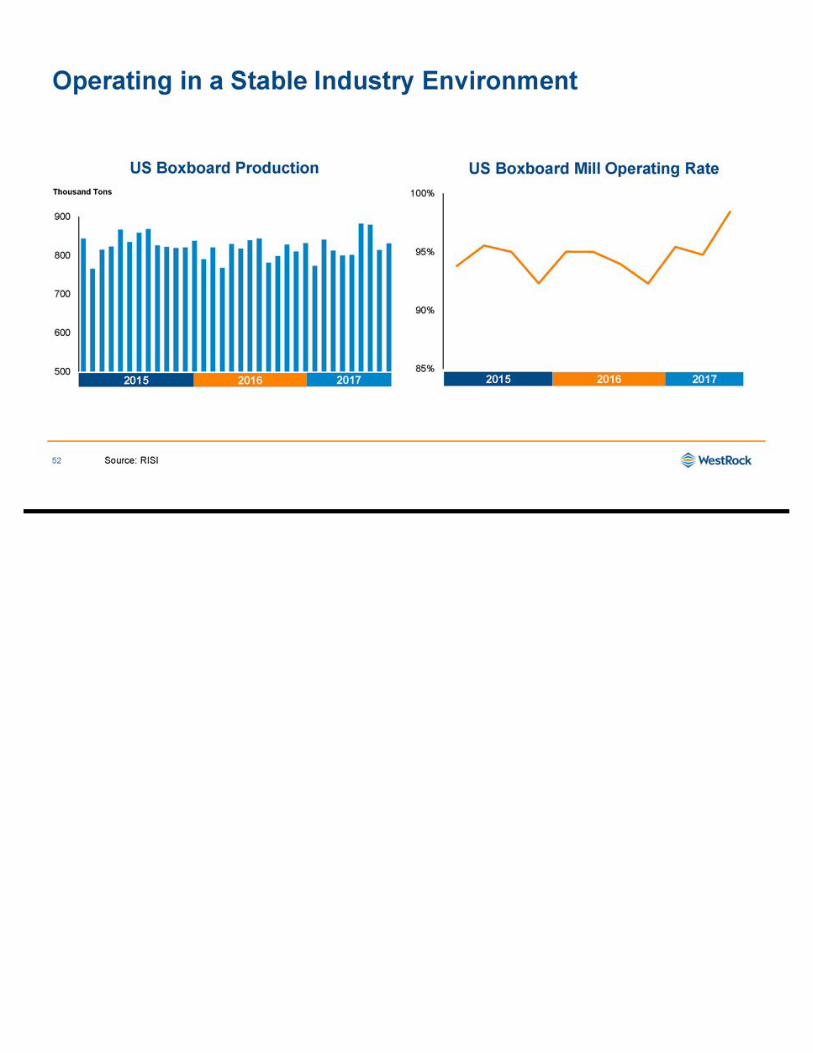
US Boxboard Production 500 600 700 800 900 Thousand Tons 85% 90% 95% 100% US Boxboard Mill Operating Rate Operating in a Stable Industry Environment 52 2015 2017 2016 2015 2017 2016 Source: RISI
WestRock Consumer Packaging: A Market Leader 53 $ 959M IN ADJUSTED FY17 EBITDA 4.2M TON MILL SYSTEM $ 6.5 B IN FY17 CONSUMER PACKAGING REVENUE Note: adjusted EBITDA is a non - GAAP figure. See Non - GAAP Financial Measures and Forward - looking Guidance in the Appendix. WestRock’s Consumer Sales Mix
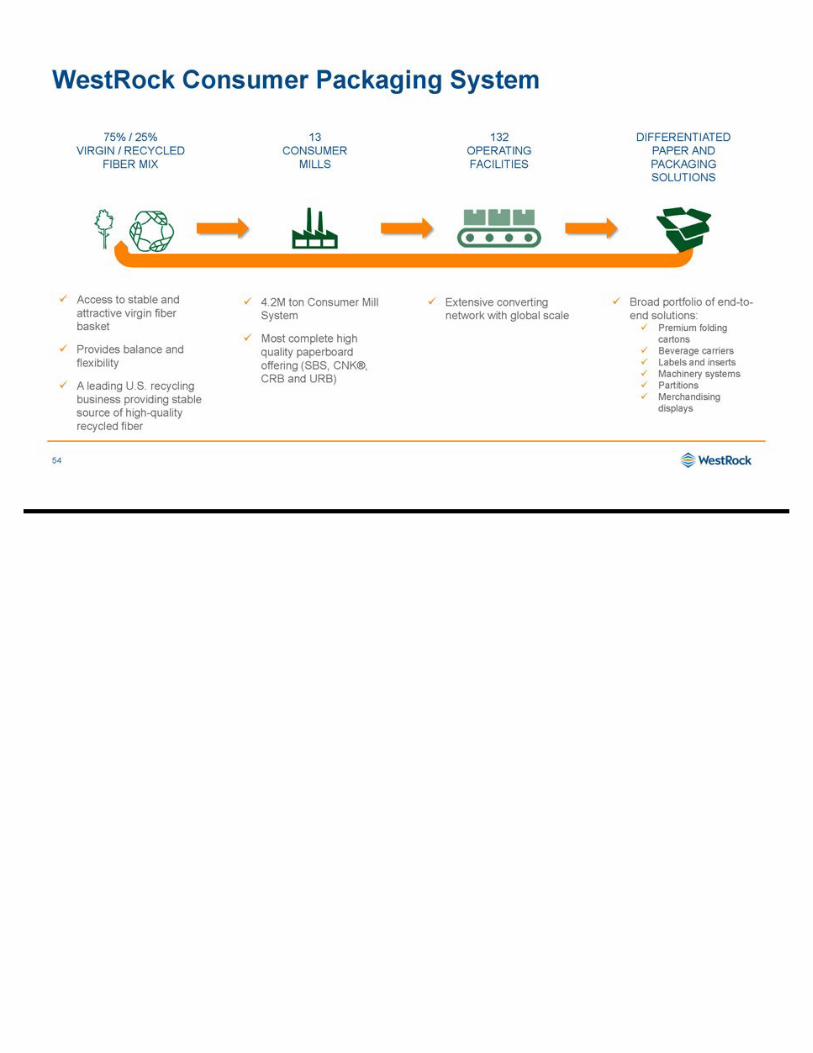
WestRock Consumer Packaging System 54 13 CONSUMER MILLS x 4.2M ton Consumer Mill System x Most complete high quality paperboard offering (SBS, CNK®, CRB and URB) 75% / 2 5% VIRGIN / RECYCLED FIBER MIX x Access to stable and attractive virgin fiber basket x Provides balance and flexibility x A leading U.S. recycling business providing stable source of high - quality recycled fiber DIFFERENTIATED PAPER AND PACKAGING SOLUTIONS x Broad portfolio of end - to - end solutions: x Premium folding cartons x Beverage carriers x Labels and inserts x Machinery systems x Partitions x Merchandising displays 132 OPERATING FACILITIES x Extensive converting network with global scale
SOUTH AMERICA 2 facilities 2 RTS Consumer Packaging Operations NORTH AMERICA 100 facilities 30 MPS 21 Displays + Assembly 17 Folding Carton 15 Mills + Sheeting 13 RTS 4 Beverage 74% of sales EUROPE 37 facilities 31 MPS 5 Beverage 1 Sheeting 13% of sales ASIA - PACIFIC 6 facilities 4 MPS 2 Beverage 9% of sales 4% of sales 55
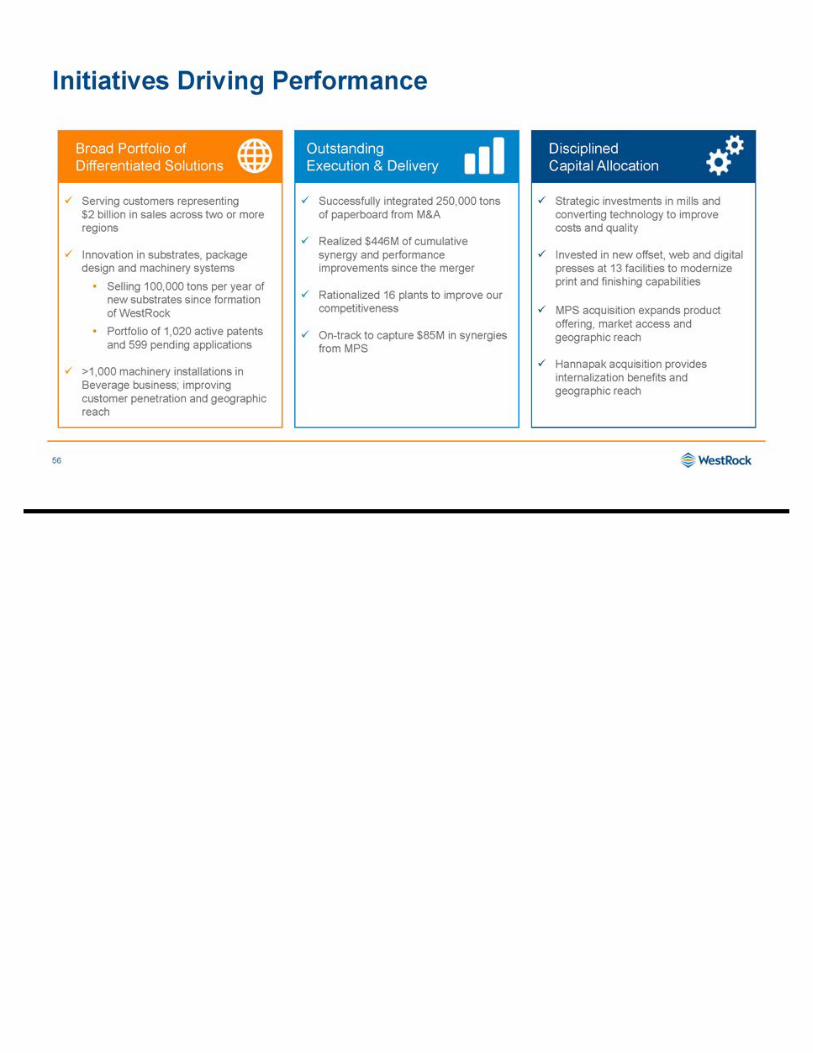
Initiatives Driving Performance x Serving customers representing $2 billion in sales across two or more regions x Innovation in substrates, package design and machinery systems • Selling 100,000 tons per year of new substrates since formation of WestRock • Portfolio of 1,020 active patents and 599 pending applications x >1,000 machinery installations in Beverage business; improving customer penetration and geographic reach Broad Portfolio of Differentiated Solutions x Strategic investments in mills and converting technology to improve costs and quality x Invested in new offset, web and digital presses at 13 facilities to modernize print and finishing capabilities x MPS acquisition expands product offering, market access and geographic reach x Hannapak acquisition provides internalization benefits and geographic reach Disciplined Capital Allocation Outstanding Execution & Delivery x Successfully integrated 250,000 tons of paperboard from M&A x Realized $446M of cumulative synergy and performance improvements since the merger x Rationalized 16 plants to improve our competitiveness x On - track to capture $85M in synergies from MPS 56
Enhancing Capabilities Through Strategic M&A 57 Year Transaction Enhanced Integration End Market / Product Expansion Geographic Reach 2016 2017 2017 Packaging
WestRock Value Delivery Model 58 Lower Total Cost • Provide the best substrate for targeted application • High performance materials engineered for end - use • In - plant productivity assistance and diagnostics Grow Sales • Insight - driven innovative packaging design that revitalizes brands • Extensive print and finishing treatments to create differentiation • Highly productive and flexible machinery systems • End - to - end capabilities to execute new product launches Improve Sustainability • Packaging designed to deliver less weight, freight savings • Lowest density SBS products in the world • New recyclable substrates and printing treatments Minimize Risk • Tailored supply chain solutions ensuring high reliability • Multi - region packaging capabilities • Extensive mill and converting network ensuring supply • Bundled solutions covering cartons, labels and inserts Delivering value to our customers
Winning Together: Riverside Natural Foods Ltd. 59 The Challenge: Support a rising nutrition snack company experiencing over 5X growth in the last year. Address packaging supply disruptions, simplify procurement, and reduce inventory requirements. The Solution: Partner with WestRock Folding Carton and Corrugated businesses to provide a reliable, turn - key supply chain solution for packaging materials. Lower Your Total Cost • Single point, bundled supply • Improved supply chain efficiencies Grow Your Sales • Leverage WestRock package design enhancements and merchandising capabilities Improve Sustainability • Provide forestry certifications for brand positioning Minimize Your Risk • Consulting on new machinery and automation Winning Together:
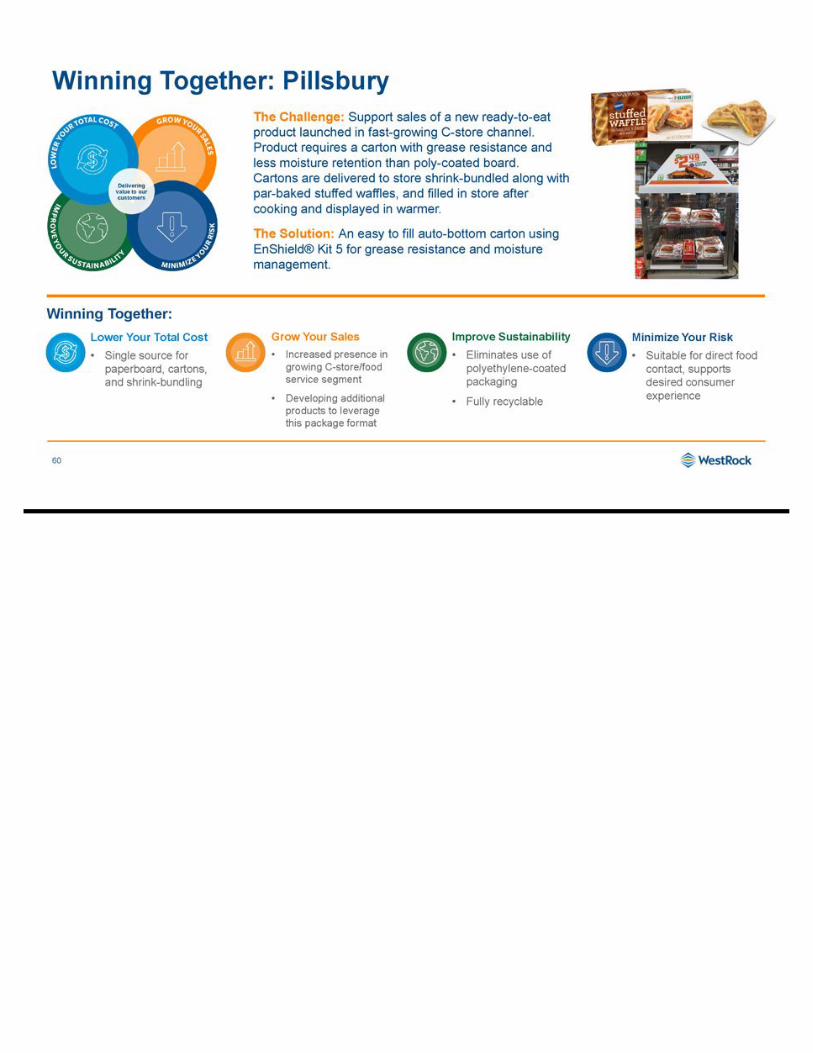
Winning Together: Pillsbury 60 The Challenge: Support sales of a new ready - to - eat product launched in fast - growing C - store channel. Product requires a carton with grease resistance and less moisture retention than poly - coated board. Cartons are delivered to store shrink - bundled along with par - baked stuffed waffles, and filled in store after cooking and displayed in warmer. The Solution: An easy to fill auto - bottom carton using EnShield® Kit 5 for grease resistance and moisture management. Lower Your Total Cost • Single source for paperboard, cartons, and shrink - bundling Grow Your Sales • Increased presence in growing C - store/food service segment • Developing additional products to leverage this package format Improve Sustainability • Eliminates use of polyethylene - coated packaging • Fully recyclable Minimize Your Risk • Suitable for direct food contact, supports desired consumer experience Winning Together:
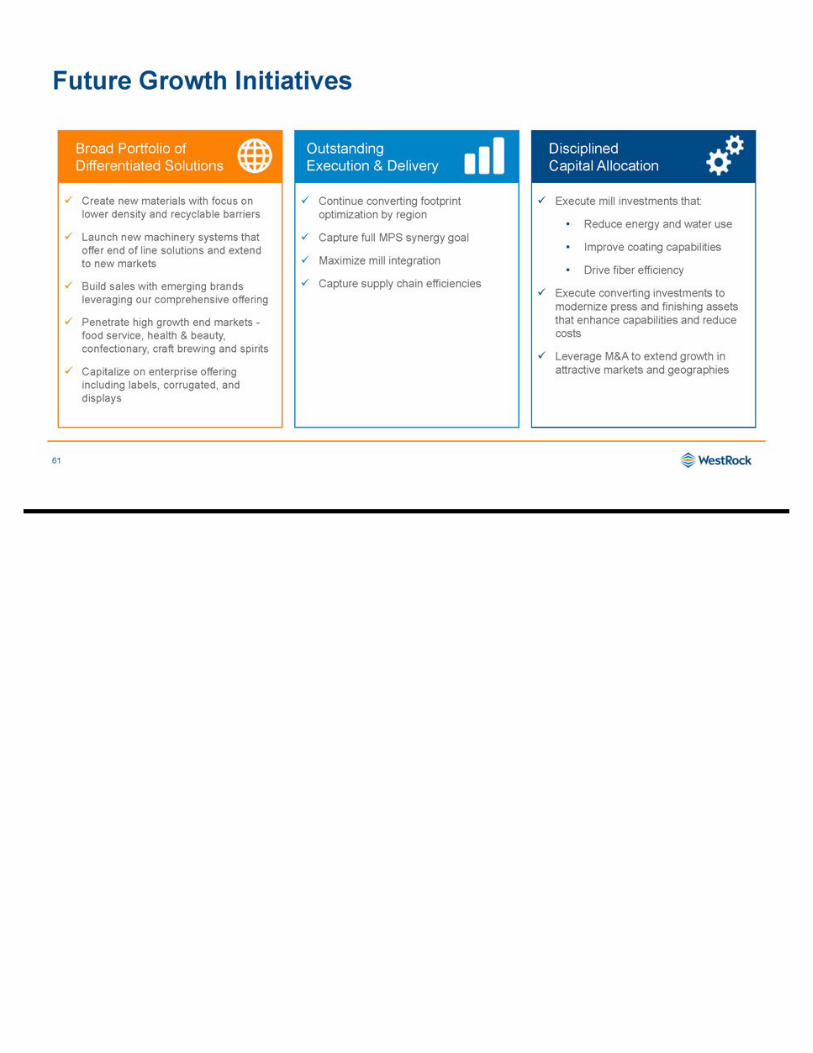
Future Growth Initiatives x Create new materials with focus on lower density and recyclable barriers x Launch new machinery systems that offer end of line solutions and extend to new markets x Build sales with emerging brands leveraging our comprehensive offering x Penetrate high growth end markets - food service, health & beauty, confectionary, craft brewing and spirits x Capitalize on enterprise offering including labels, corrugated, and displays Broad Portfolio of Differentiated Solutions x Execute mill investments that: • Reduce energy and water use • Improve coating capabilities • Drive fiber efficiency x Execute converting investments to modernize press and finishing assets that enhance capabilities and reduce costs x Leverage M&A to extend growth in attractive markets and geographies Disciplined Capital Allocation Outstanding Execution & Delivery x Continue converting footprint optimization by region x Capture full MPS synergy goal x Maximize mill integration x Capture supply chain efficiencies 61
The image part with relationship ID rId3 was not found in the file. Driving Profitability: Multiple Levers to Success 62 14.9% >17% >15% Capital Investment Footprint Enhancements MPS Synergies Differentiation FY17 FY18 E FY22 E Assumptions: Stable Pricing Market Growth Rates Productivity More Than Offsets Normal Inflation No Additional M&A Adjusted EBITDA Margin 1 1) Adjusted EBITDA margin is a non - GAAP figure. See Non - GAAP Financial Measures and Forward - looking Guidance in the Appendix.
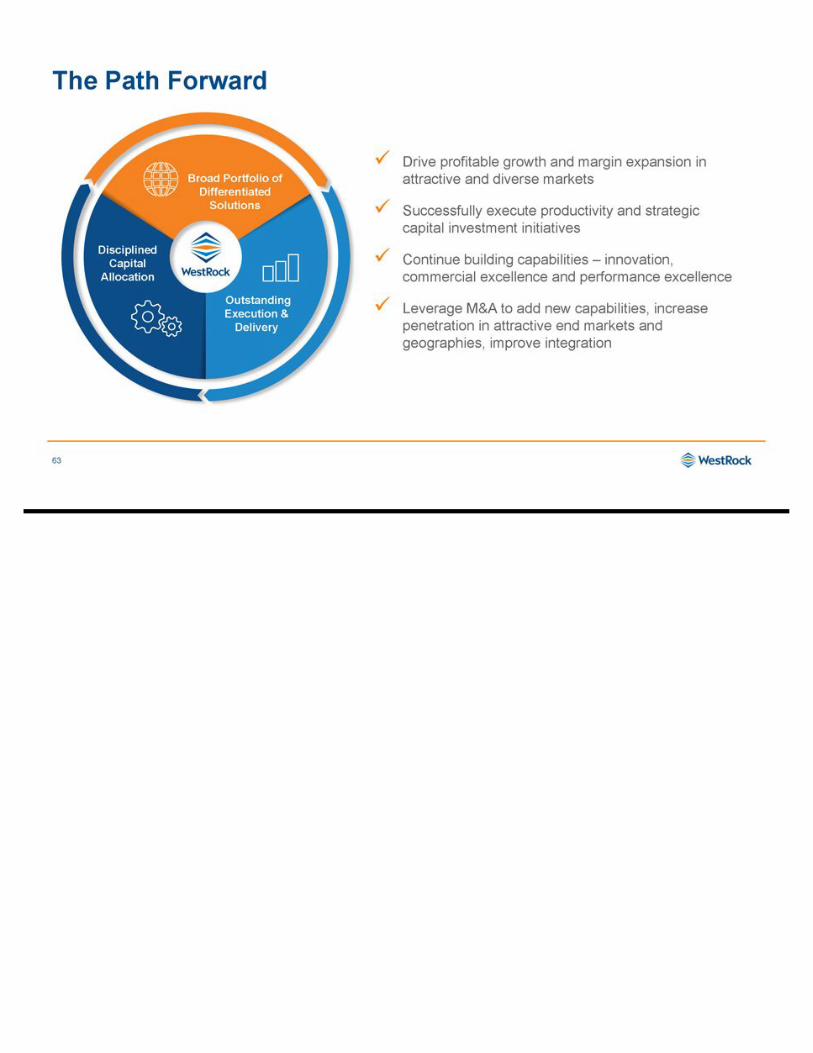
The Path Forward 63 x Drive profitable growth and margin expansion in attractive and diverse markets x Successfully execute productivity and strategic capital investment initiatives x Continue building capabilities – innovation, commercial excellence and performance excellence x Leverage M&A to add new capabilities, increase penetration in attractive end markets and geographies, improve integration Outstanding Execution & Delivery Disciplined Capital Allocation Broad Portfolio of Differentiated Solutions
Chapter 6: Consumer Focus – Multi Packaging Solutions Marc Shore President, Multi Packaging Solutions Dennis Kaltman Executive Vice President, Multi Packaging Solutions 64
Multi Packaging Solutions: Differentiated Solutions for Consumer Branded, Pharma, Health Care and Media Markets 65 Pharma and Healthcare 41% Multi - media 8% Consumer Branded 51% 14 COUNTRIES WITH OPERATIONS 65 MANUFACTURING LOCATIONS $1.9B TOTAL SALES Multi Packaging Solutions is part of WestRock’s Consumer Packaging segment and broken out in this presentation for educationa l p urposes only 1. Forecasted FY18 sales
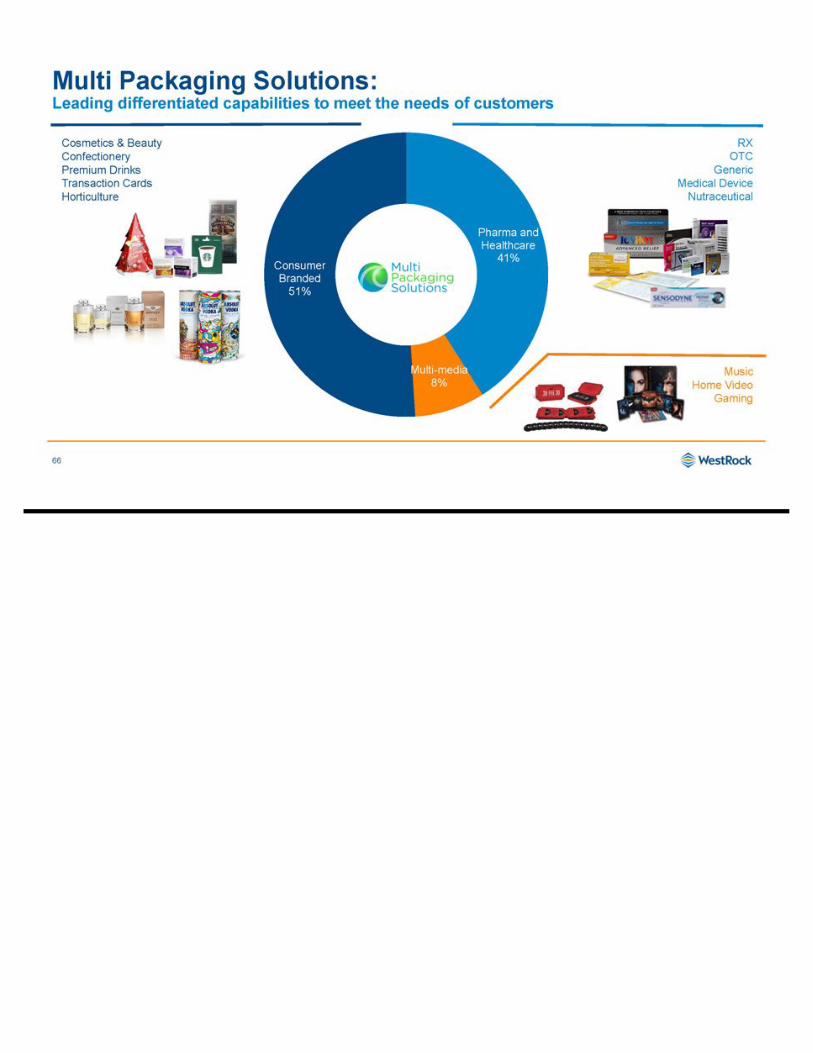
Pharma and Healthcare 41% Multi - media 8% Consumer Branded 51% Multi Packaging Solutions: Leading differentiated capabilities to meet the needs of customers RX OTC Generic Medical Device Nutraceutical Cosmetics & Beauty Confectionery Premium Drinks Transaction Cards Horticulture Music Home Video Gaming 66
Strategic Global Locations Our footprint supports differentiated solutions locally, regionally and globally NORTH AMERICA 30 facilities 12 Folding Carton 7 Label 7 Literature 3 Card 1 Tube 48% of sales EUROPE 31 facilities 15 Folding Carton 7 Label 7 Literature 1 Rigid Pack 1 Tube 47% of sales ASIA 4 facilities 3 Folding Carton 1 Literature 5% of sales 67
Winning Together: Nutra/GNC 68 The Challenge: MPS has a 20 - year relationship with Nutra / General Nutrition Corporation (GNC) supplying all of their folding carton needs. How do we expand this relationship and win their remaining secondary packaging? The Solution: Developed a “Big Picture” offering for Nutra/GNC to consolidate suppliers and leverage their overall packaging spend to include cartons, labels, and inserts Lower Your Total Cost • MPS offers a complete range of secondary packaging which allows customer to realize multiple benefits of one - stop - shopping Grow Your Sales • Brand consistency across packaging types • Leverage wider WestRock offerings in display and corrugated Improve Sustainability • Increased efficiency and simultaneous delivery of main packaging components Minimize Your Risk • Multiple manufacturing sites with redundant capabilities minimize risk of single sourcing Winning Together:
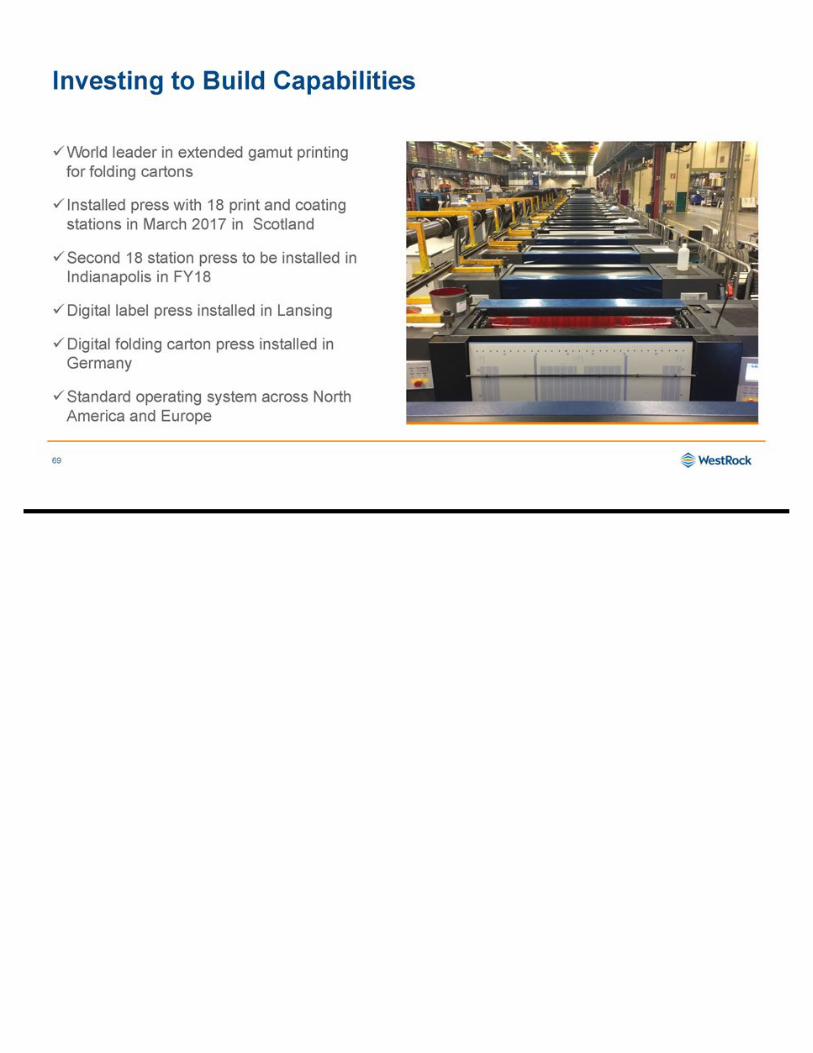
Investing to Build Capabilities x World leader in extended gamut printing for folding cartons x Installed press with 18 print and coating stations in March 2017 in Scotland x Second 18 station press to be installed in Indianapolis in FY18 x Digital label press installed in Lansing x Digital folding carton press installed in Germany x Standard operating system across North America and Europe 69
$85 Million Opportunity for Synergies and Performance Improvements by End of FY19 Attractive synergy opportunities and upside from commercial and cross - sell opportunities 70 Paperboard Integration Ongoing Performance Improvements Procurement & Supply Chain SG&A and Public Co Costs Asset Optimization
The Path Forward 71 x Enhance our delivery of differentiated solutions through investment, focus on execution and by integrating WestRock paper and packaging into our offerings (and vice versa) x Capture $85 million synergy and performance improvement opportunities x Use M&A to add new capabilities and to increase participation in attractive end markets and geographies Outstanding Execution & Delivery Disciplined Capital Allocation Broad Portfolio of Differentiated Solutions
We’ve Been Building a Paper and Packaging Leader 73 x Advanced strategy to provide differentiated solutions to customers x Expanded presence in attractive end markets x On track to achieve $1B synergy and performance improvement goal by end of Q3 FY18, ahead of initial guidance Markets & Operations Portfolio Management x Invested $3.4B in M&A, completing 8 acquisitions / investments • MPS expands product offering, market participation, and geographic footprint • Increased ownership in the Grupo Gondi joint venture to 32% • Improved Corrugated integration from 69% to 75% x Spun off Ingevity, creating >$12 of value per share x Sold HH&B generating $1B of net proceeds x Generated >$2.2B of combined Adjusted Free Cash Flow 1 in FY16 and FY17, exceeding targets in each year x Invested over $1.8B to maintain and improve mill and converting network x Announced a 7.5% dividend increase, a combined increase of 15% since the merger x Repurchased $756M of WestRock stock Capital Allocation 1: Adjusted free cash flow is a non - GAAP figure. See Non - GAAP Financial Measures and Forward - looking Guidance in the Appendix.
Building the Portfolio 74 JULY 2015 FUTURE GROWTH 2015 2016 2017 JANUARY 2016 MAY 2016 2017 2017 2017 2017 2017 LEGEND: Spin - off/Sale Enhanced Integration End Market/Product Expansion Geographic Expansion Packaging
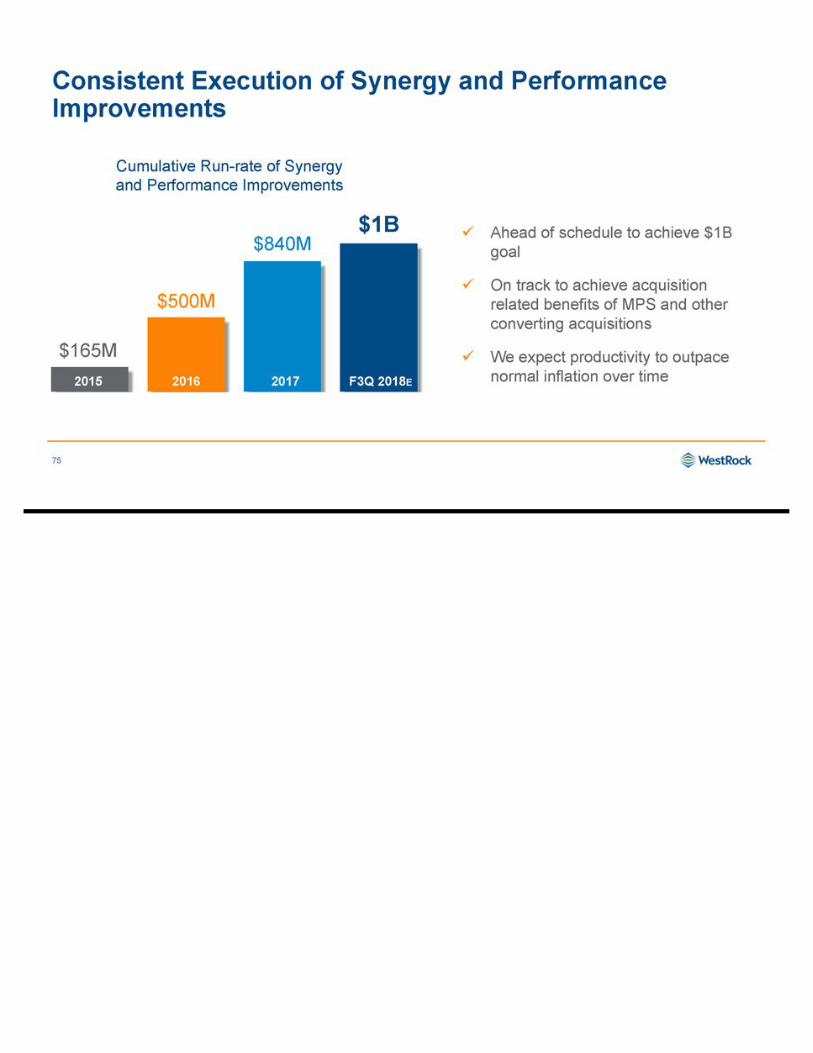
Consistent Execution of Synergy and Performance Improvements $100M $250M $350M $165M $500M $840M 2016 2017 F3Q 2018 E 2015 $1B x Ahead of schedule to achieve $1B goal x On track to achieve acquisition related benefits of MPS and other converting acquisitions x We expect productivity to outpace normal inflation over time Cumulative Run - rate of Synergy and Performance Improvements 75
Financial Strength Provides Platform for Growth Diversification of business across corrugated and consumer packaging provides stability 76 Fully - funded U.S. pension plan >$2.5 billion of available committed liquidity Strong foundation of consistent, robust cash flow generation Investment grade credit rating provides access to capital markets Financial discipline with appropriate leverage
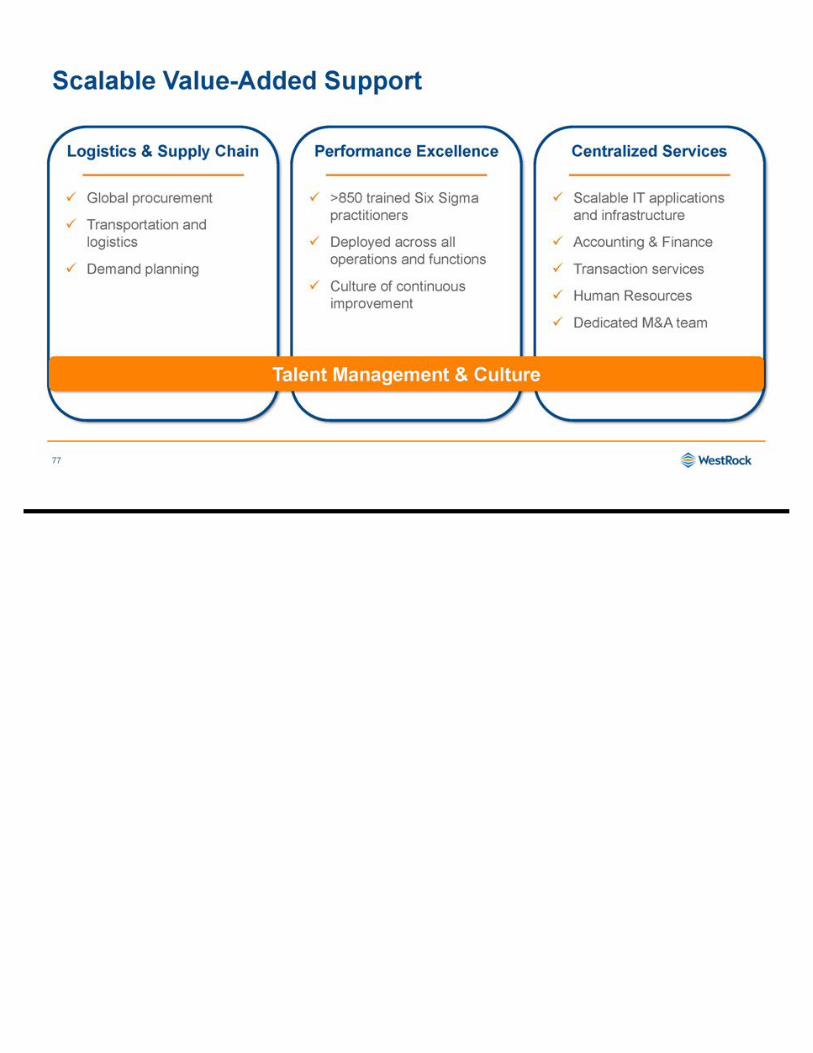
Scalable Value - Added Support Performance Excellence x >850 trained Six Sigma practitioners x Deployed across all operations and functions x Culture of continuous improvement Logistics & Supply Chain x Global procurement x Transportation and logistics x Demand planning Centralized Services x Scalable IT applications and infrastructure x Accounting & Finance x Transaction services x Human Resources x Dedicated M&A team Talent Management & Culture 77
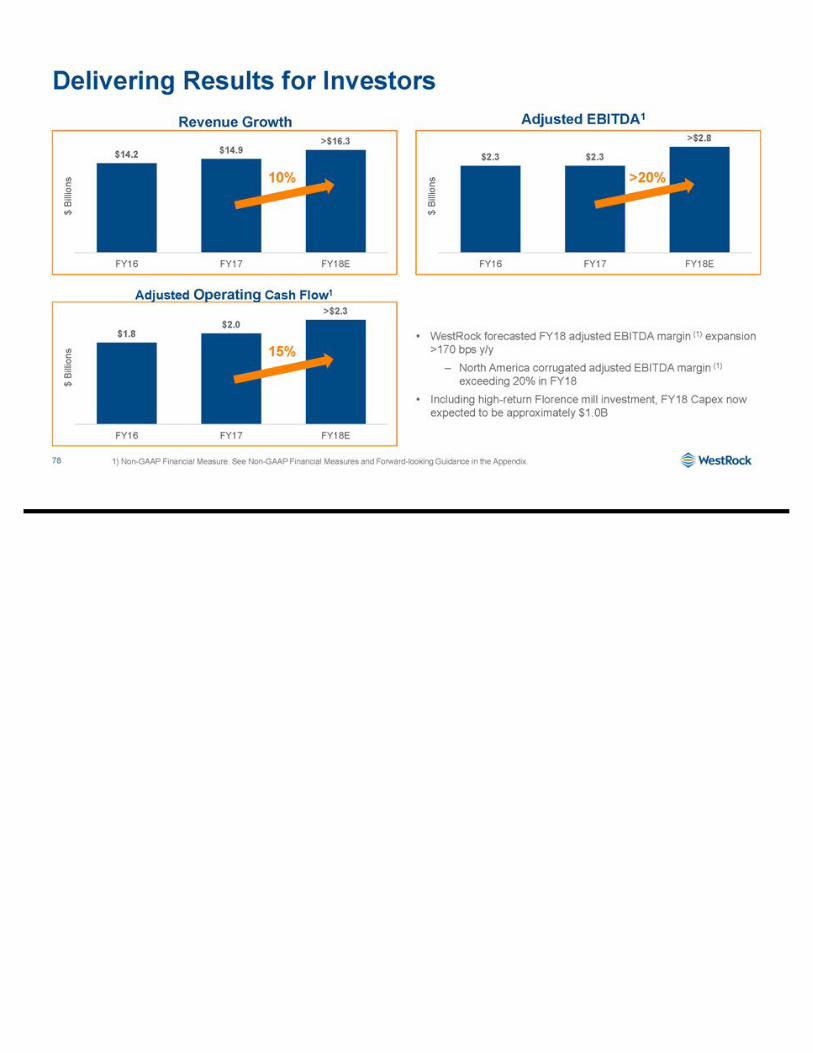
Delivering Results for Investors $14.2 $14.9 > $16.3 FY16 FY17 FY18E $ Billions $2.3 $2.3 > $2.8 FY16 FY17 FY18E $ Billions $1.8 $2.0 > $2.3 FY16 FY17 FY18E $ Billions • WestRock forecasted FY18 adjusted EBITDA margin (1) expansion >170 bps y/y ‒ North America corrugated adjusted EBITDA margin (1) exceeding 20% in FY18 • Including high - return Florence mill investment, FY18 Capex now expected to be approximately $1.0B 78 1) Non - GAAP Financial Measure. See Non - GAAP Financial Measures and Forward - looking Guidance in the Appendix. Revenue Growth Adjusted Operating Cash Flow 1 Adjusted EBITDA 1 15% 10% >20%
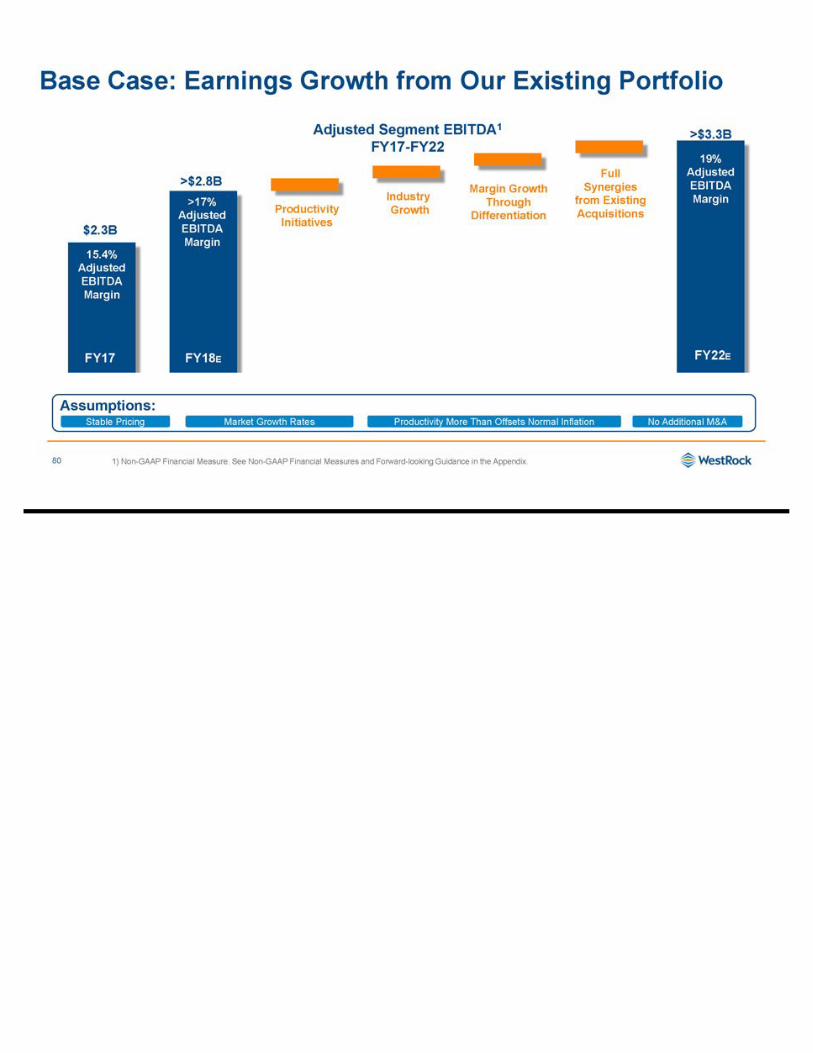
79 x Strong fundamentals for North American Corrugated market x Stable US Consumer packaging demand, growing global demand x Increasing participation in attractive, high - growth markets and applications x Improving growth in Brazil and Mexico x Leverage Enterprise Sales opportunities Market Growth and Enterprise Sales Multiple Sources of Earnings Growth x Strategic capital projects include: x Florence, SC paper machine • $410M total investment • FY18 - FY20 x Mahrt curtain coater and Brazil box plant • $175 - $ 200M investment • FY18 – FY19 x Attractive financial returns from announced capital projects expected to begin in FY19 and grow in future periods x Additional future strategic projects dependent on return profile, cash flow generation, and ongoing needs of the business Strategic Capital Investments x Long - term maintenance capital (50%) and normal, high - return capital investments (50%) of $800 - $850 million per year x Leverage our procurement scale x Logistics system optimization x Deployment of Performance Excellence and Six Sigma initiatives x Achievement of MPS synergies by FY19 x Integration benefits from recent acquisitions x Scalable back office and IT infrastructure Synergy and Performance Improvements
Base Case: Earnings Growth from Our Existing Portfolio 80 The image part with relationship ID rId3 was not found in the file. The image part with relationship ID rId5 was not found in the file. >$2.8B $2.3B >$3.3B Adjusted Segment EBITDA 1 FY17 - FY22 1) Non - GAAP Financial Measure. See Non - GAAP Financial Measures and Forward - looking Guidance in the Appendix. Full Synergies from Existing Acquisitions Productivity Initiatives Industry Growth Margin Growth Through Differentiation FY18 E FY17 FY22 E Assumptions: Stable Pricing Market Growth Rates Productivity More Than Offsets Normal Inflation No Additional M&A >17% Adjusted EBITDA Margin 19% Adjusted EBITDA Margin 15.4% Adjusted EBITDA Margin
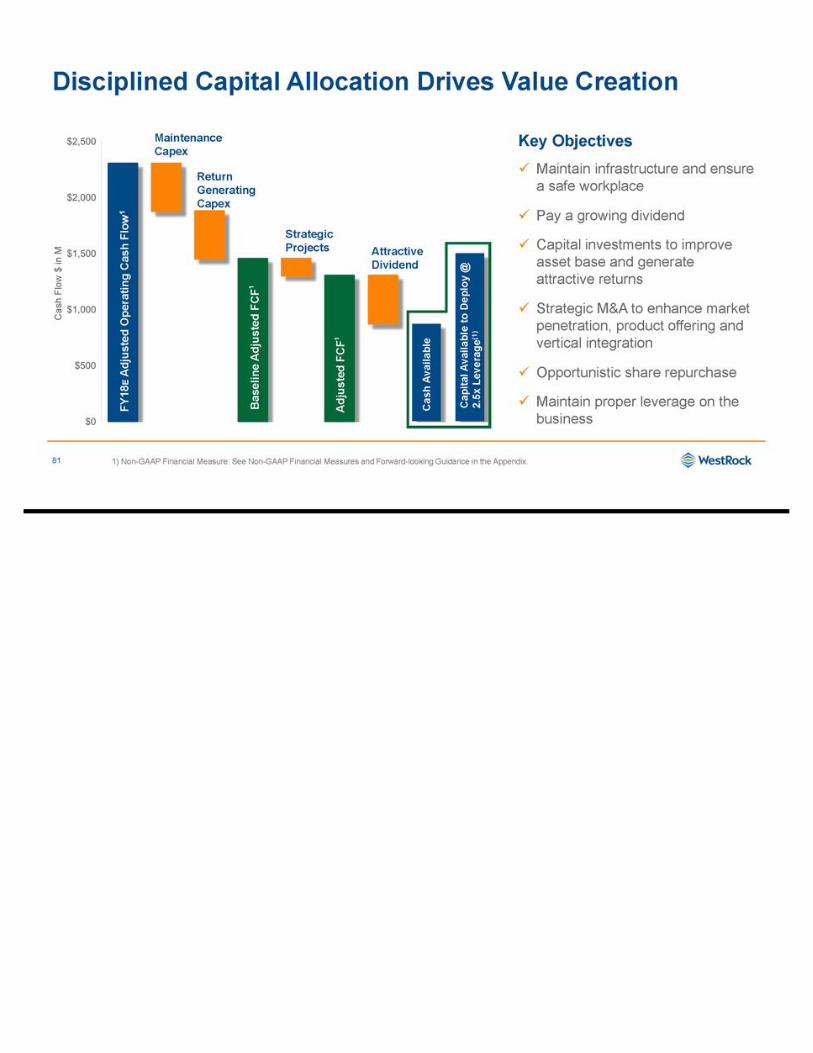
Disciplined Capital Allocation Drives Value Creation 81 Key Objectives x Maintain infrastructure and ensure a safe workplace x Pay a growing dividend x Capital investments to improve asset base and generate attractive returns x Strategic M&A to enhance market penetration, product offering and vertical integration x Opportunistic share repurchase x Maintain proper leverage on the business The image part with relationship ID rId3 was not found in the file. Maintenance Capex Return Generating Capex FY18 E Adjusted Operating Cash Flow 1 Adjusted FCF 1 Baseline Adjusted FCF 1 Cash Available Strategic Projects Attractive Dividend Capital Available to Deploy @ 2.5x Leverage (1) Cash Flow $ in M 1) Non - GAAP Financial Measure. See Non - GAAP Financial Measures and Forward - looking Guidance in the Appendix.
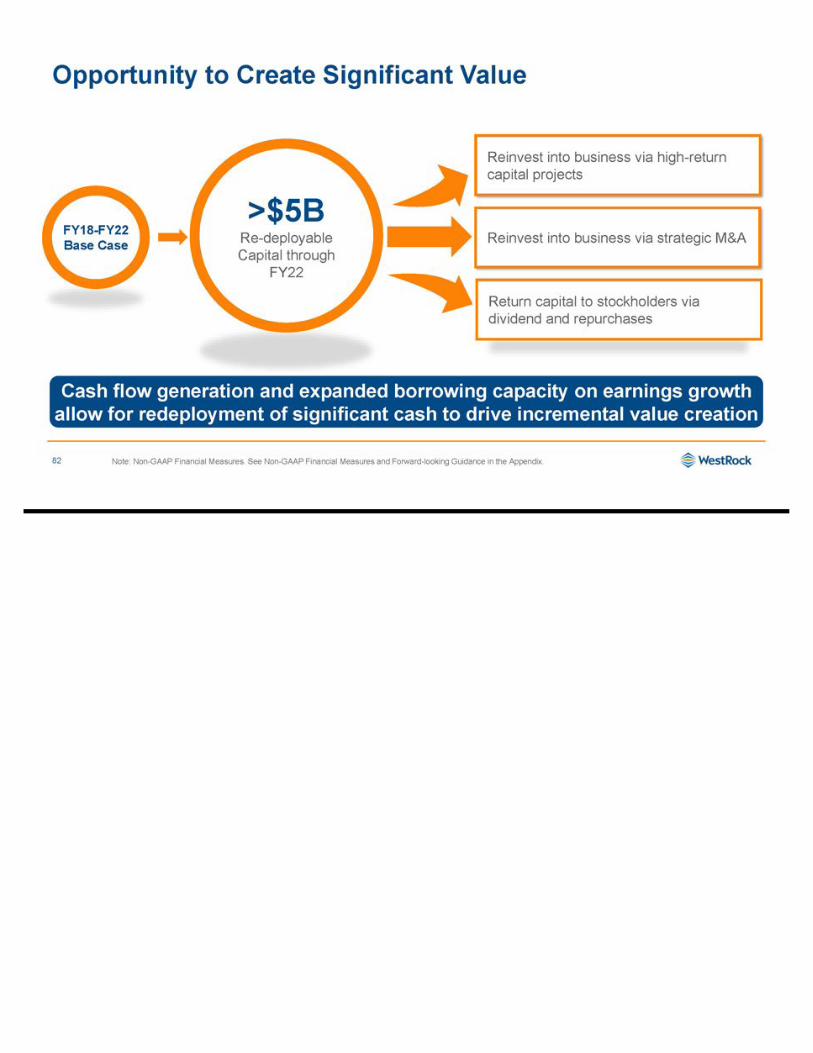
Opportunity to Create Significant Value 82 Cash flow generation and expanded borrowing capacity on earnings growth allow for redeployment of significant cash to drive incremental value creation >$5B Re - deployable Capital through FY22 Reinvest into business via high - return capital projects Return capital to stockholders via dividend and repurchases Note: Non - GAAP Financial Measures. See Non - GAAP Financial Measures and Forward - looking Guidance in the Appendix. Reinvest into business via strategic M&A FY18 - FY22 Base Case
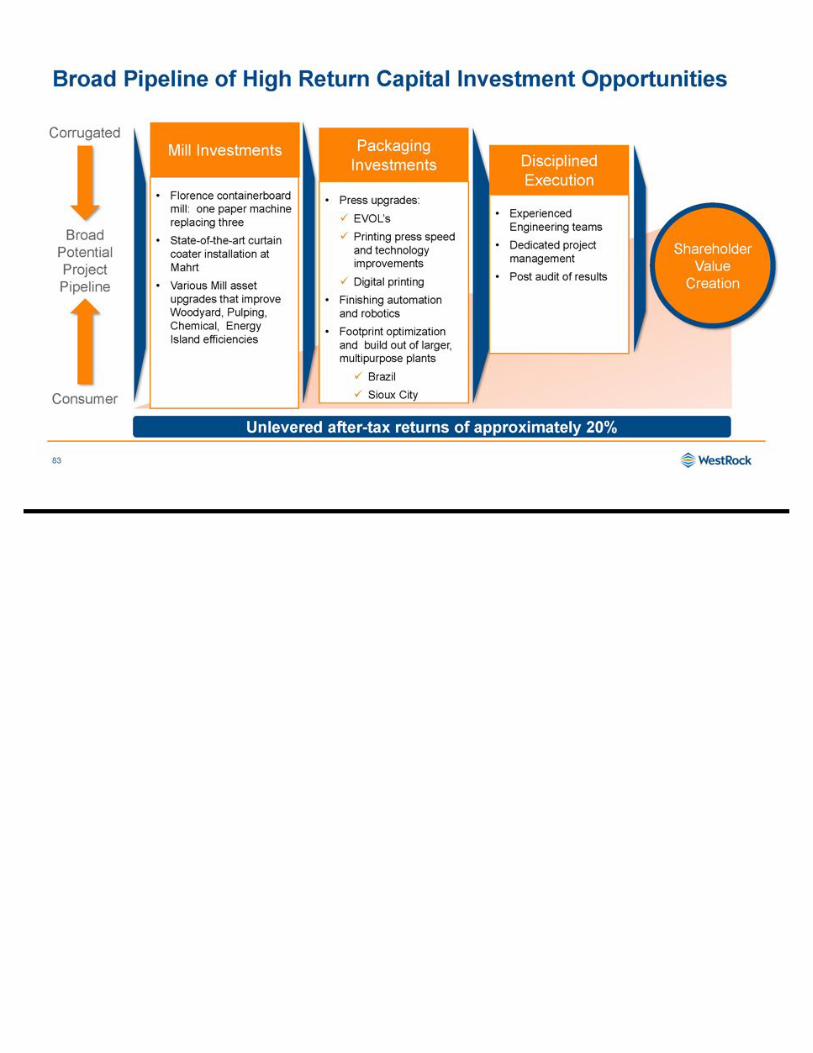
Broad Pipeline of High Return Capital Investment Opportunities 83 Broad Potential Project Pipeline Corrugated Consumer Shareholder Value Creation • Florence containerboard mill: one paper machine replacing three • State - of - the - art curtain coater installation at Mahrt • Various Mill asset upgrades that improve Woodyard, Pulping, Chemical, Energy Island efficiencies Mill Investments • Press upgrades: x EVOL’s x Printing press speed and technology improvements x Digital printing • Finishing automation and robotics • Footprint optimization and build out of larger, multipurpose plants x Brazil x Sioux City Packaging Investments • Experienced Engineering teams • Dedicated project management • Post audit of results Disciplined Execution Unlevered after - tax returns of approximately 20%
Disciplined Approach to M&A 84 Broad Opportunity Pipeline Corrugated Consumer Shareholder Value Creation • Expand in targeted geographies / end markets • Enhance our portfolio of differentiated solutions • Drive additional synergy generation Strict Screening Criteria • Business leadership supported by dedicated M&A team • Strict valuation parameters • Deep - dive due diligence across the enterprise Disciplined Transaction Process • Integration • Synergy generation Disciplined Execution Proven Ability to Successfully Execute M&A
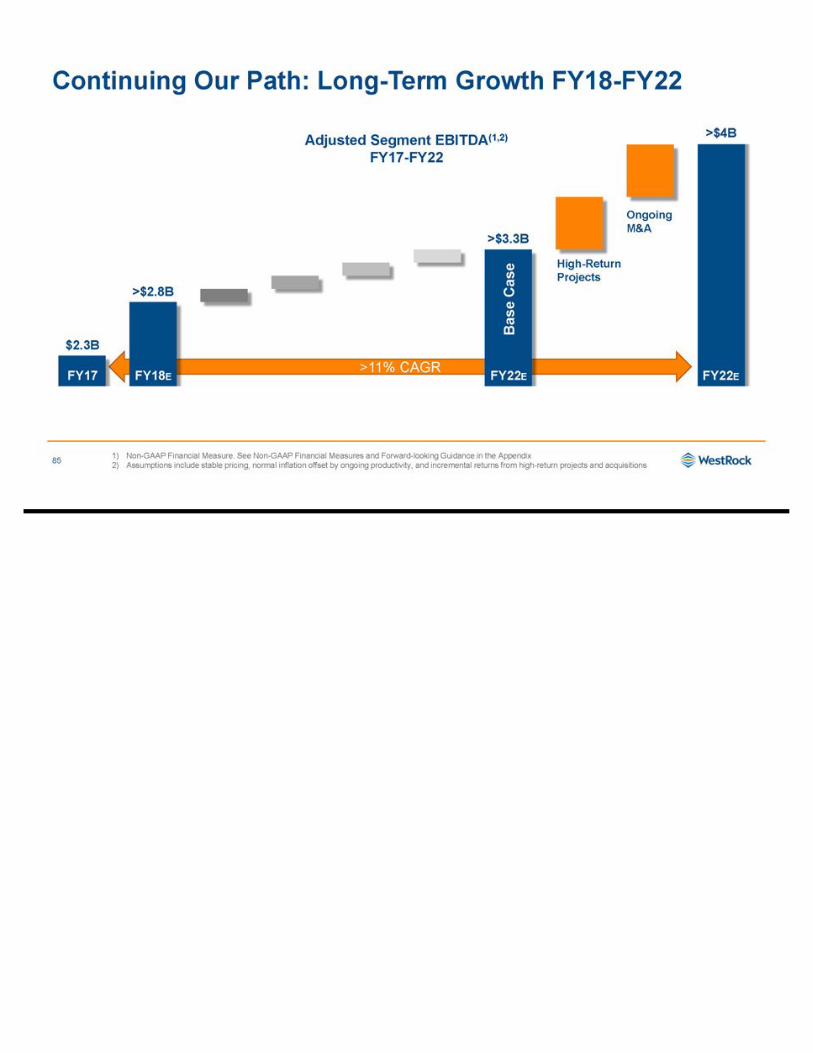
>11% CAGR Continuing Our Path: Long - Term Growth FY18 - FY22 85 The image part with relationship ID rId3 was not found in the file. >$2.8B $2.3B >$4B Ongoing M&A High - Return Projects >$2.8B $2.3B FY18 E FY22 E FY17 Base Case >$3.3B Adjusted Segment EBITDA (1,2) FY17 - FY22 1) Non - GAAP Financial Measure. See Non - GAAP Financial Measures and Forward - looking Guidance in the Appendix 2) Assumptions include stable pricing, normal inflation offset by ongoing productivity, and incremental returns from high - return pr ojects and acquisitions FY22 E
Proven Model with a Clear Path to Value Creation 86 x History of strong cash flow generation and return of capital x Financial flexibility, with access to capital markets x Clear roadmap to margin expansion x Margin expansion and deployment of capital provide the opportunity to grow adjusted EBITDA to more than $4 billion in 2022 x Repeatable model with a strong track record of success Outstanding Execution & Delivery Disciplined Capital Allocation Broad Portfolio of Differentiated Solutions
87 Chapter 8: Q&A
88 Chapter 9: Closing Remarks Steve Voorhees Chief Executive Officer
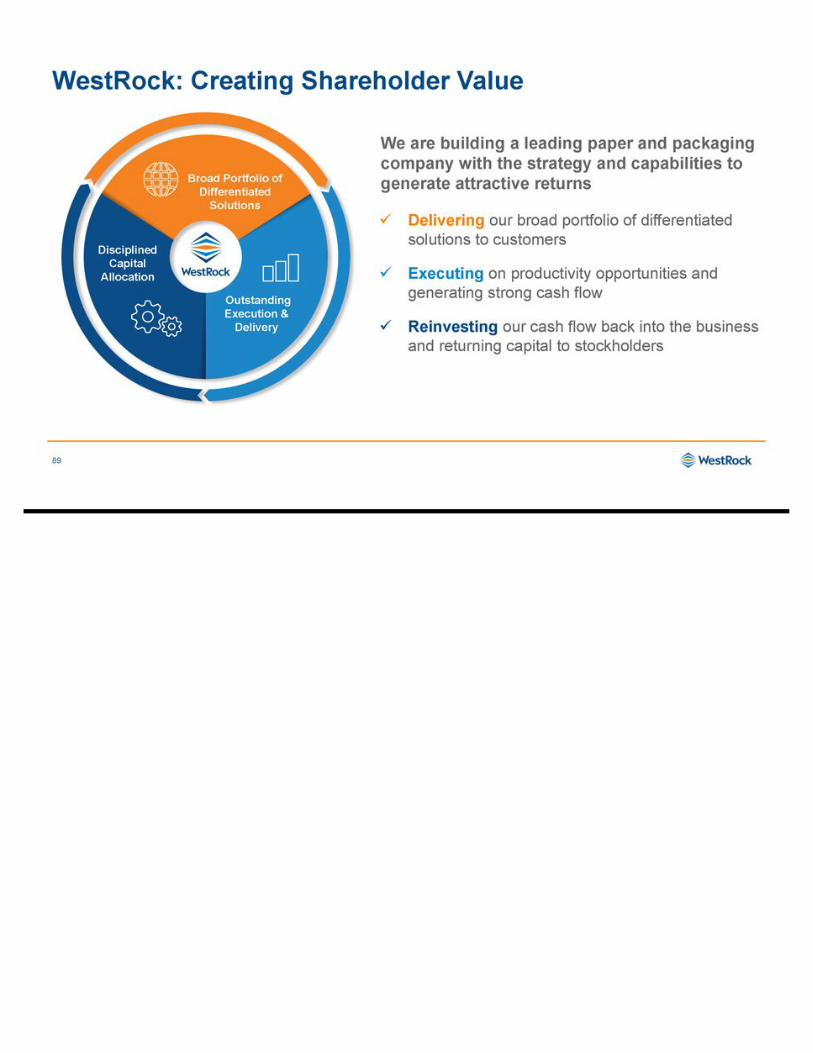
WestRock: Creating Shareholder Value 89 Outstanding Execution & Delivery Disciplined Capital Allocation Broad Portfolio of Differentiated Solutions x Delivering our broad portfolio of differentiated solutions to customers x Executing on productivity opportunities and generating strong cash flow x Reinvesting our cash flow back into the business and returning capital to stockholders We are building a leading paper and packaging company with the strategy and capabilities to generate attractive returns
Key Takeaways 90 Paper and packaging are attractive businesses where scale and differentiation matter WestRock is building a paper and packaging leader with the strategy and capabilities to generate attractive returns over the long term Margin expansion and deployment of capital provide the opportunity to grow adjusted EBITDA 1 to more than $4 billion in 2022 1) Non - GAAP Financial Measure. See Non - GAAP Financial Measures and Forward - looking Guidance in the Appendix.
The Story of WestRock Investor Day 2017 December 8, 2017
Appendix 92
Non - GAAP Financial Measures 93 Adjusted Free Cash Flow We use the non - GAAP financial measure “adjusted free cash flow” because we believe this measure is useful in evaluating our fina ncial performance, in part, because it measures our ability to generate cash without incurring additional external financings. We define adjusted fre e cash flow as cash provided by operating activities, excluding after - tax cash restructuring costs, minus capital expenditures. We believe the most directly comparable GAAP measure is net cash provided by operating activities. Adjusted Operating Cash Flow We use the non - GAAP financial measure “adjusted operating cash flow” because we believe this measure provides our board of direc tors, investors, potential investors, securities analysts and others with useful information to evaluate our performance since it excludes res tru cturing and other costs, net, and other specific items that we believe are not indicative of our ongoing operating results. While this measure is similar to adjusted free cash flow, we believe it provides greater comparability across periods when capital expenditures are changing since it excludes an adjustme nt for capital expenditures. We believe the most directly comparable GAAP measure is net cash provided by operating activities. Adjusted EBITDA, Adjusted Segment EBITDA and Adjusted Segment EBITDA Margins We use the non - GAAP financial measures “adjusted EBITDA”, “adjusted segment EBITDA” and “adjusted segment EBITDA margins”, along with other factors, to evaluate our segment performance against the performance of our peers. We believe that investors also use these mea sures to evaluate our performance relative to our peers. We calculate adjusted segment EBITDA for each segment by adding that segment’s adjusted s egm ent income to its depreciation, depletion and amortization. We calculate adjusted segment EBITDA margin for each segment by dividing that segm ent ’s adjusted segment EBITDA by its adjusted segment sales.
Non - GAAP Financial Measures (cont.) Forward - looking Guidance This presentation includes forward - looking guidance related to non - GAAP financial measures, such as adjusted EBITDA, adjusted EB ITDA margin and adjusted segment EBITDA. We are not providing forward - looking guidance related to U.S. GAAP financial measures or reconciliations of forward - looking non - GAAP financial measures to the most directly comparable U.S. GAAP measures because of the inherent difficulty in predicting the occurrence, the financial impact and the periods in which potential non - GAAP adjustments may be rec ognized (e.g., merger and acquisition - related expenses, restructuring expenses, asset impairments, litigation settlements, changes to contingen t consideration and certain other gains or losses). For the same reason, we are unable to address the probable significance of the unavailab le information. These items are uncertain, depend on various factors, and could have a material impact on our U.S. GAAP reported results for the guidance period. 94
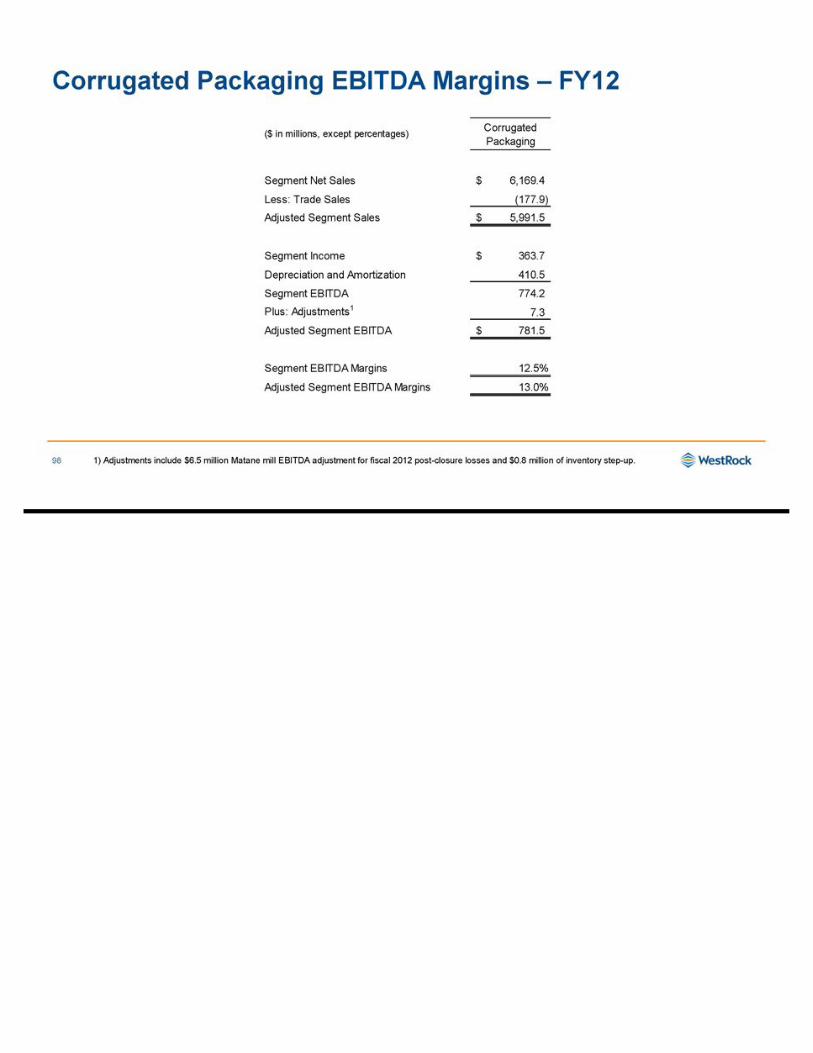
Corrugated Packaging EBITDA Margins – FY12 98 ($ in millions, except percentages) Corrugated Packaging Segment Net Sales 6,169.4$ Less: Trade Sales (177.9) Adjusted Segment Sales 5,991.5$ Segment Income 363.7$ Depreciation and Amortization 410.5 Segment EBITDA 774.2 Plus: Adjustments 1 7.3 Adjusted Segment EBITDA 781.5$ Segment EBITDA Margins 12.5% Adjusted Segment EBITDA Margins 13.0% 1) Adjustments include $6.5 million Matane mill EBITDA adjustment for fiscal 2012 post - closure losses and $0.8 million of invent ory step - up.
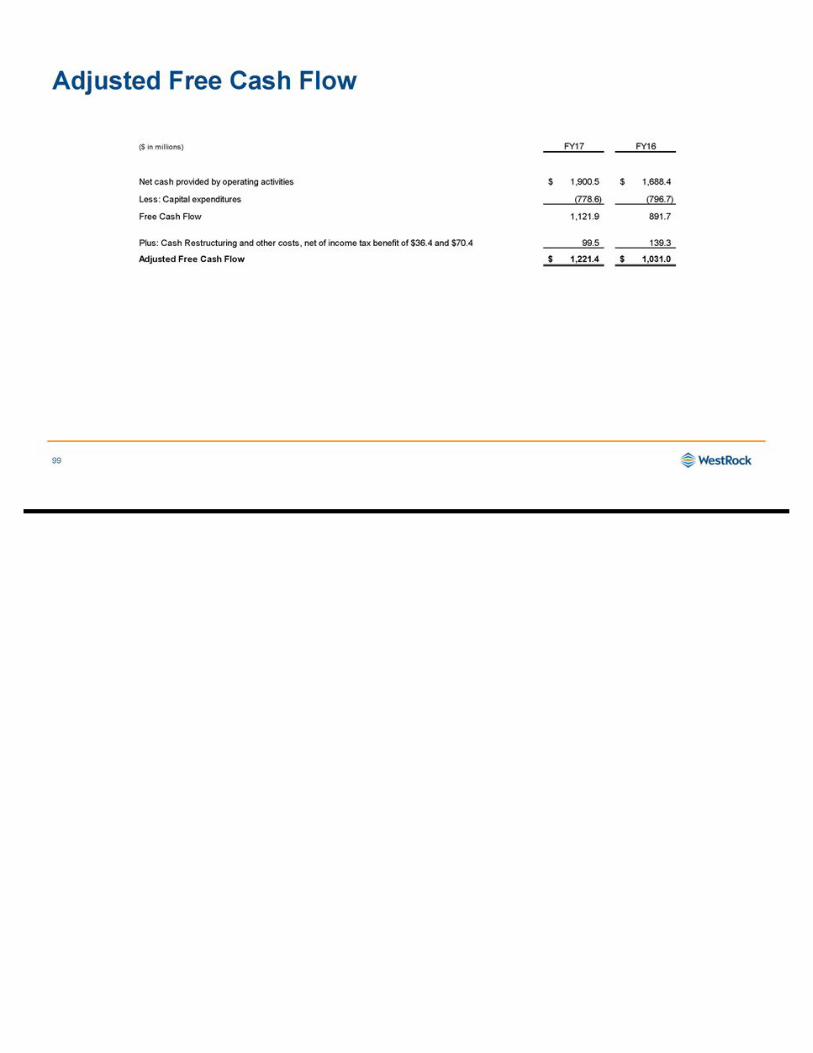
Adjusted Free Cash Flow 99 ($ in millions) FY17 FY16 Net cash provided by operating activities 1,900.5$ 1,688.4$ Less: Capital expenditures (778.6) (796.7) Free Cash Flow 1,121.9 891.7 Plus: Cash Restructuring and other costs, net of income tax benefit of $36.4 and $70.4 99.5 139.3 Adjusted Free Cash Flow 1,221.4$ 1,031.0$
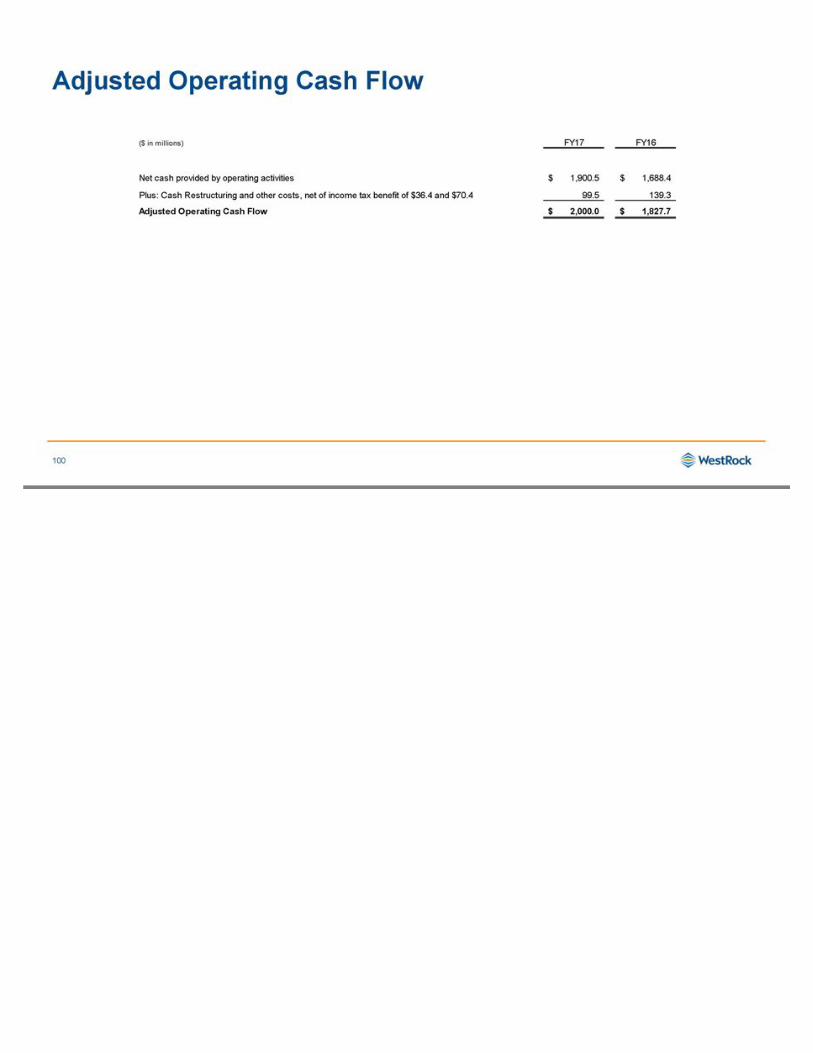
Adjusted Operating Cash Flow 100 ($ in millions) FY17 FY16 Net cash provided by operating activities 1,900.5$ 1,688.4$ Plus: Cash Restructuring and other costs, net of income tax benefit of $36.4 and $70.4 99.5 139.3 Adjusted Operating Cash Flow 2,000.0$ 1,827.7$