COVER SHEET A S O 9 5 0 0 2 2 8 3 SEC Registration Number D M C I H O L D I N G S , I N C . (Company’s Full Name) 3 R D F L R . D A C O N B L D G . 2 2 8 1 P A S O N G T A M O E X T . M A K A T I C I T Y (Business Address: No., Street City / Town / Province) HERBERT M. CONSUNJI 888-3000 Contact Person Company Telephone Number (Last Wednesday of July) 1 2 3 1 SEC Form 17-A 0 7 3 1 Month Day FORM TYPE Month Day Fiscal Year Annual Meeting N.A. Secondary License Type, If Applicable C F D Dept Requiring this Doc Amended Articles Number / Section Total Amount of Borrowings Total No. of Stockholders Domestic Foreign To be accomplished by SEC Personnel concerned File Number LCU Document ID Cashier STAMPS Remarks: Please use BLACK ink for scanning purposes
Transcript
COVER SHEET
A S O 9 5 0 0 2 2 8 3
SEC Registration Number
D M C I H O L D I N G S , I N C .
(Company’s Full Name)
3 R D F L R . D A C O N B L D G . 2 2 8 1
P A S O N G T A M O E X T . M A K A T I C I T Y
(Business Address: No., Street City / Town / Province)
HERBERT M. CONSUNJI 888-3000
Contact Person Company Telephone Number
(Last Wednesday of July)
1 2 3 1 SEC Form 17-A 0 7 3 1
Month Day FORM TYPE Month Day Fiscal Year Annual Meeting
N.A.
Secondary License Type, If Applicable
C F D
Dept Requiring this Doc Amended Articles Number / Section
Total Amount of Borrowings
Total No. of Stockholders Domestic Foreign
To be accomplished by SEC Personnel concerned
File Number LCU
Document ID Cashier
S T A M P S
Remarks: Please use BLACK ink for scanning purposes
2
SECURITIES AND EXCHANGE COMMISSION
SEC FORM 17-A, AS AMENDED
ANNUAL REPORT PURSUANT TO SECTION 17
OF THE SECURITIES REGULATION CODE AND SECTION 141
OF THE CORPORATION CODE OF THE PHILIPPINES
1. For the fiscal year ended December 31, 2013
2. SEC Identification Number AS095-002283 3. BIR Tax Identification No. 004-703-376
4. Exact name of issuer as specified in its charter DMCI Holdings, Inc.
5. Philippines 6. (SEC Use Only)
Province, Country or other jurisdiction of
incorporation or organization
Industry Classification Code:
7. 3
rd Floor, Dacon Building, 2281 Pasong Tamo Ext., Makati City 1231
Address of principal office Postal Code
8. Tel. (632) 888-3000 Fax (632) 816-7362
Issuer's telephone number, including area code
9. Not applicable
Former name, former address, and former fiscal year, if changed since last report.
10. Securities registered pursuant to Sections 8 and 12 of the SRC, or Sec. 4 and 8 of the RSA
Title of Each Class No. of Shares Outstanding Amount
Common Shares 2,655,494,000 Php2,655,494,000.00 Preferred Shares 3,780 3,780.00
TOTAL 2,655,497,780 Php2,655,497,780.00
11. Are any or all of these securities listed on a Stock Exchange.
Yes [ X ] No [ ]
If yes, state the name of such stock exchange and the classes of securities listed therein: Philippine Stock Exchange Class “A” Shares & Preferred Shares
12. Check whether the issuer:
(a) has filed all reports required to be filed by Section 17 of the SRC and SRC Rule 17.1 thereunder
or Section 11 of the RSA and RSA Rule 11(a)-1 thereunder, and Sections 26 and 141 of The Corporation
Code of the Philippines during the preceding twelve (12) months (or for such shorter period that the
registrant was required to file such reports);
Yes [ X ] No [ ]
3
(b) has been subject to such filing requirements for the past ninety (90) days.
Yes [ X ] No [ ]
13. Php 50,462,762,994.00
The aggregate market value of the voting stock held by non-affiliates of the registrant
APPLICABLE ONLY TO ISSUERS INVOLVED IN
INSOLVENCY/SUSPENSION OF PAYMENTS PROCEEDINGS
DURING THE PRECEDING FIVE YEARS:
14. Not applicable
Check whether the issuer has filed all documents and reports required to be filed by Section 17 of the
Code subsequent to the distribution of securities under a plan confirmed by a court or the
Commission.
DOCUMENTS INCORPORATED BY REFERENCE
15. If any of the following documents are incorporated by reference, briefly describe them and identify
the part of SEC Form 17-A into which the document is incorporated:
(b) Audited Financial Statements as of December 31, 2013.
PART I - BUSINESS AND GENERAL INFORMATION
Item 1. Business (Part I, par. (a) of Annex C)
DMCI Holdings, Inc. (the “Company”) was incorporated on March 8, 1995 as a holding company to consolidate all construction business, construction component companies and related interests of the Consunji Family. It was listed on the Philippine Stock Exchange on December 18, 1995.
In only a few years after incorporation, the Company has expanded its business organization to include four major subsidiaries, namely: D.M. Consunji, Inc. (DMCI), DMCI Project Developers, Inc. (PDI), Atlantic Gulf and Pacific Company of Manila, Inc. (AG&P) and Semirara Mining Corporation [(SMC) (formerly Semirara Coal Corporation)].
DMCI, a wholly owned subsidiary, is engaged in general construction services– the Group’s core business. It is also engaged in various construction component businesses such as the production and trading of concrete products and electrical and foundation works. Incorporated and founded in 1954, DMCI is currently one of the leaders in the Philippine construction industry, noted for quality projects delivered on time and its pioneering application of advanced engineering methodology. In addition, DMCI, together with its affiliate PDI, is actively engaged in real estate sales and development, launching its housing component - DMCI Homes, in early 2002.
PDI, another wholly owned subsidiary incorporated in 1995, is engaged in construction business-generating investments primarily through its equity participation in various project and infrastructure development activities. These ventures generate not only investment income but also construction business for DMCI. Currently, PDI, hand in hand with affiliate DMCI, is actively engaged in real estate sales and development.
SCC, a 56%-owned publicly listed company established in 1980 is engaged in the exploration, mining, development and sales of coal resources on Semirara Island in Caluya, Antique. It is currently
4
the Philippines’ largest coal-producing company with a guaranteed long-term market by virtue of its supply contract with state-run National Power Corporation (NPC).
DMCI Power Corporation (DMCI PC), a wholly-owned subsidiary of the Company, is engaged in the business of power generation which designs, constructs, invest in, and operate power plants. On January 15, 2007, the National Power Corporation (NPC) awarded to DPC the Masbate Power Generation, one of the small utilities group (SPUG) of NPC. DPC shall take over of the power supply obligation in Masbate with a 15-year Power Supply Agreement with Masbate Electric Cooperative (MASELCO). Masbate Power Generation has a total contract of 13,000 KW of Guaranteed Dependable Capacity (GDC).
DMCI Mining Corporation (DMCI MC) is another wholly owned subsidiary engaged in ore and mineral mining and exploration. It was incorporated on May 29, 2007. It has entered into joint venture with Rusina Mining Ltd., a listed company in Australia, in which the Corporation agreed to be the independent contractor to directly undertake the mining operations in the municipalities of Sta. Cruz and Candelaria in Zambales. The mining operation is an open pit extraction of nickel, chromite, and iron laterite for direct shipping.
DMCI-MPIC Water Company, Inc. (DMWCI), is a consortium with Metro Pacific Investments Corporation and Marubeni Philippines Corp. which owns 93% equity at Maynilad Water Services, Inc. (MWSI). The Company's economic interest in MWSI decreased to 25% from 41%, after Marubeni acquired 20% of economic interest in Maynilad last February 2013.
(1)(b) Any bankruptcy, receivership or similar proceeding - None
(1)(c) Any material reclassification, merger, consolidation, or purchase or sale of a significant amount of
assets not in the ordinary course of business. – None
(2) Business of Issuer
(a) Description of Registrant
i. Principal products or services and their markets. – The Company is a publicly-
listed firm with subsidiaries or affiliates engaged in the businesses of
construction, real estate, coal mining, nickel mining, power generation, and
water distribution. Its revenues and net income are being generated and
consolidated from its subsidiaries.
ii. Percentage of sales or revenues and net income contributed by foreign sales – Not
Applicable
iii. Distribution methods of the products or services – Not Applicable
iv. Status of any publicly-announced new product or service (e.g. whether in the
planning stage, whether prototypes exist), the degree to which product design has
progressed or whether further engineering is necessary. Indicate if completion of
development of the product would require a material amount of the resources of
the registrant, and the estimated amount - None
v. Competition. – Among the publicly listed companies, DMCI Holdings, Inc. is
the only holding company which has construction for its primary investment,
Its construction business is primarily conducted by wholly-owned
subsidiary, D.M. Consunji, Inc. (DMCI), which has, for its competitors,
numerous construction contracting companies, both local and foreign,
currently operating in the country. It has been an acknowledged trend that
the state of construction industry depends mainly on prevailing economic
conditions. Thus, the currently weak economic growth explains the
continued slump in the construction industry. Given this trend, DMCI has
5
been focusing on selected markets where construction demand has
remained relatively strong, particularly, in housing and civil works. This is
where the company believes it can compete effectively given its strong
construction capabilities, equipment and manpower complement, and track
record. The Company's coal mining is the largest coal producer in the
country. Competition is insignificant as far as domestic coal mine is
concerned. The real estate business, on the other hand, is targeted for the
middle income families. As far as local sales in concerned, DMCI Homes is
well-positioned to capture the end-user market with much lower price for the
same market with that of its competitor. In water distribution, Maynilad
covers the West concession area of Metro Manila and there is no competition
with regard to water distribution in the area that it covers.
vi. Sources and availability of raw materials and the names of principal
suppliers; If the registrant is or is expected to be dependent upon one or a limited
number of suppliers for essential raw materials, energy or other items, describe.
Describe any major existing supply contracts. – Not applicable to DMCI Holdings,
Inc. For DMCI, it has its own pool of equipment and construction materials
supply. For Semirara, it has an existing long term supply contract with
National Power Corporation (NPC) for its power plant in Calaca, and with
Toledo Power Plant.
vii. Disclose how dependent the business is upon a single customer or a few
customers, the loss of any or more of which would have a material adverse effect
on the registrant and its subsidiaries taken as a whole. Identify any customers that
account for, or based upon existing orders will account for, twenty percent (20%) or
more of the registrant’s sales; Describe any major existing sales contracts – Not
applicable to DMCI Holdings, Inc. For SCC, it has an existing long term
supply contract with National Power Corporation (NPC) which accounts for
approximately 98% of its revenues. For Maynilad, it covers the West
concession area of Metro Manila which accounts for nine (9) million
customers. Other subsidiaries have various customers in terms of location,
profile and target market.
(viii) Transactions with and/or dependence on related parties – Aside from inter-company
transactions within the group of companies, and SCC’s long term supply contract with
NPC, the Company has no known transactions with and/or dependence on related parties.
(ix) Summarize the principal terms and expiration dates of all patents, trademarks, copyrights,
licenses, franchises, concessions, and royalty agreements held; Indicate the extent to which the
registrant’s operations depend, or are expected to depend, on the foregoing and what steps are
undertaken to secure these rights – Not applicable to DMCI Holdings, Inc. For DMCI, it is and
remains a triple-A (“AAA”) licensed contractor, given by the Philippine Construction
Accreditation Board (PCAB), in consideration of certain minimum requirements such as:
(1) financial capacity; (2) equipment capacity; (3) experience of firm; and (4) experience of
technical personnel. For SMC, royalty agreements are: (1) Royalty Agreement with the
Department of Energy (DOE) – 3% royalty based on FOB Sales; (2) Royalty Agreement with
land claimants – P0.50/MT for untitled land and P1.00/MT for titled land.
6
(x) Need for any government approval of principal products or services. If government approval is
necessary and the registrant has not yet received that approval, discuss the status of the
approval within the government approval process – None at the moment.
(xi) Effect of existing or probable governmental regulations on the business – Not applicable to
DMCI Holdings, Inc. For DMCI, it is required under Philippine laws to secure construction
permits and environmental clearances from appropriate government agencies prior to
actually undertaking each project. For SMC, it is required under Philippine laws to secure
mining and exploration permits, as well as environmental clearances from appropriate
government agencies for its continuing operations.
(xii) Indicate the amount spent on research and development activities, and its percentage to
revenues during each of the last three fiscal years – None
(xiii) Costs and effects of compliance with environmental laws – Not directly applicable to DMCI
Holdings, Inc., but only to its operating subsidiaries. Costs vary depending on the size
and nature of a construction project for the construction and real estate businesses.
Failure to comply with the terms of the ECC (environmental compliance certificate) can
lead to imposition of fines and temporary cessation of operations.
(xiv) Total Number of Employees
The total number of employees of the Company is twelve (12). The Company does
not anticipate hiring additional employees for the ensuing year except when due to
contingencies resulting in separation, resignation, termination of services of existing
employees.
Executive 3
Senior Officers 1
Officers 4
Rank and File 4
Total 12
No employees are subject to either collective bargaining agreement (CBA), strike or
union in both the Parent and its subsidiaries. There are no supplemental benefits or
incentive arrangements between the employees and the Company.
Discuss the major risk/s involved in each of the businesses of the company and subsidiaries. Include a disclosure of the procedures being undertaken to identify, assess and manage such risks. – Major risks for the Company and its subsidiaries are operational, regulatory and financial risks. The Corporation has commissioned SGV & Co. to assist in handling Enterprise Risk Management among DMCI Group. The Company has conducted an Enterprise Risk Awareness Session initially to the Board of Directors followed by Risk Awareness workshops among executive managers of the subsidiaries. ERM activities of the Company are in line and in accordance with latest IAS adopted as PAS and other compliance requirements from SEC and PSE.
7
Item 2. Properties (Part I, par. (b) of Annex C) (B) Give the location and describe the condition of the principal properties (such as real estate, plant and equipment, mines, patents, etc.) that the registrant and its subsidiaries own. If the registrant does not have complete ownership of the property, for example, others also own the property or there is a mortgage or lien on the property, describe the limitations on ownership. Indicate also what properties it leases, the amount of lease payments, expiration dates and the terms of renewal options. Indicate what properties the registrant intends to acquire in the next twelve (12) months, the cost of such acquisitions, the mode of acquisition (i.e. by purchase, lease or otherwise) and the sources of financing it expects to use. - All properties are owned by the Company and its subsidiaries unless otherwise indicated as follows:
SEMIRARA MININIG CORPORATION (1) Property. - The mine site located in Semirara Island, Caluya, Antique, is part of the coal mining
reservation under Proclamation No. 649 issued by then President Manuel L. Quezon on November 20, 1940. Certain areas in the minesite are leased with rental payments of ₱6,177,830 for 2013. The infrastructures and road network, office administration buildings, and power plants, are some of the improvements made by the Company on the leased area, as well as the following:
a. Building/Offices: Units Units
Administration Building 1 MS1 near Hospital 1
Analab Building 1 MS2 Building 1
Briquetting Building 1 MS4 Building 1
Civil Works Office & Warehouse 1 MS5 Building 1
Coal Power Plant 1 MS7 Building 1
Coal Silo 4 Oxygen/Acetylene Building 2
Core House 1 Panama Complex 1
CRO Office 1 Pitshop 1
Diesel/Bunker Power Plant 1 Product Office 1
Drilling shop 1 RMO Office 1
Genset Shed at CPP 1 Sand Blasting Plant 1
HRD Office & Library 1 Shipping Office 1
Humic Acid Plant 1 Splicing Building 1
Lime Plant 1 Tire Shop 1
Magazine Building 3 Warehouse 1
Main Workshop 1 Warehouse Auxiliary Building 1
Mayflower Motorpool 1 Washing Plant Office 1
Motorpool 1
b. Housing: Units Units
Altar Boys Quarter 1 Lebak Housing 145
Group Staff House 2 Molave Housing (Laborer's Unit) 911
Individual Staff House 3 Pinatubo Housing 51
Kalamansig Housing 78 Staff House at Tabunan 2
Laborer’s Clusters 1-7 58 Waffle Crete Building 2
8
Altar Boys Quarter 1 Lebak Housing 145
c. Others: Units Units
Classrooms for Bunlao Elem School 6 Messhall at Tabunan 1
Classrooms for Mother School 10 Messhall at waffle crete 1
Classrooms for Semirara High School 12 Mix Commercial Building 3
Classrooms for Tinogboc ElemSchool 10 Multi-purpose Gym 3
Classrooms for Villaresis Elem School 4 Multi-purpose Hall at Bunlao 1
Coast Guard Building 1 Multi-purpose Hall at Phase 1 1
Commissary Building 1 Multi-purpose Hall at Phase 4 1
Commuter terminal 1 ONB ATM Machine Building 1
Covered tennis court 1 ONB Semirara Branch 1
Divine Word School of Semirara 4 Oval at Pinagpala Area 1
DWSSI Gym 1 Pall Water Filtration Plant 1
Foodcourt 1 Pottery Building 1
Gantry at Mayflower 1 Pump house & landscaping 1
Gantry at MWS 1 Semirara Airstrip 1
Grotto 1 Semirara Library Hub 1
Guadalupe Church 1 Semirara Plaza 1
Hangar 3 Semirara Training Center (STCI) 3
HTPC Convent 1 Sitio Villaresis pier 1
Ice Plant 1 Slaughter House 1
Material Recovery Facility 1 Slipway 1
Messhall 1 1 SMC Infirmary 1
Messhall at Cluter 5 1 Smart Site Tower 1
Messhall at Cluter 7 1 Tabunan Hatchery & Laboratory 1
All properties with the net book values are active assets. These are all located in Semirara
Island, Caluya, Antique (mine site). All properties are free of any liens and encumbrances except
some mining equipments used as collateral for the Company’s loans. The Company also
invested in mining and other equipment worth ₱1.050 billion, ₱1.683 billion, and ₱2.043 billion for
2013, 2012 and 2011, respectively. On the other hand, its power subsidiary, SCPC owns the following equipment, structures, buildings and improvements located over parcels of land subject of a lease contract for 25 years from the Power Sector Assets Liabilities and Management Corporation (PSALM) at Calaca, Batangas with rental payments of ₱150,568,000 to cover the entire duration of the lease: 1. 2x300 MW units of the Calaca Power Plant with its major components and accessories 2. Staff Housing Units 3. Guest House 4. Pier 5. Conveyor Unloading System 6. Coal Stockyard 7. Administrative Building
9
8. Motorpool On July 4, 2011, SCPC exercised its option to buy several parcels of land with an aggregate area of 29.3 hectares, subject of the lease from PSALM all located within the premises of the Calaca Power Plants. SCPC assigned to its option to buy over an additional 8.2 hectare lot to the Company which option was exercised on July 4, 2011.
D.M. CONSUNJI INC.
CLASSIFICATION PROPERTY LOCATION
CONSTRUCTION EQUIPT & TOOLS
EARTHMOVING EQUIPMENT VARIOUS
COMPACTION EQUIPMENT VARIOUS
LIFTING EQUIPMENT VARIOUS
EXCAVATION EQUIPMENT VARIOUS
PILE DRIVING EQUIPMENT VARIOUS
CONCRETING EQUIPMENT VARIOUS
HAULING EQUIPMENT VARIOUS
AIR EQUIPMENT VARIOUS
PUMPING EQUIPMENT VARIOUS
POWER GENERATING EQUIPMENT VARIOUS
SHOP EQUIPMENT VARIOUS
SPECIAL SUPPORT EQUIPMENT VARIOUS
TOOLS & OTHER INSTRUMENTS VARIOUS
METAL FORMWORKS VARIOUS
TRANSPO. EQUIPT. SERVICE CAR VARIOUS
SERVICE PICK-UP VARIOUS
OTHER VEHICLES VARIOUS
OFFICE FURN., FIXTURES & EQUIPT.
OFFICE FURNITURE & FIXTURES VARIOUS
OFFICE EQUIPMENT VARIOUS
COMPUTER EQUIPMENT VARIOUS
COMMUNICATION EQUIPMENT VARIOUS
OTHERS LAND LAND IMPROVEMENTS
VARIOUS
LEASEHOLD IMPROVEMENTS BUILDING
VARIOUS VARIOUS
BUILDING IMPROVEMENTS VARIOUS
PLANTS VARIOUS
10
There are no construction equipment under mortgage, lien or encumbrance. DMCI plans to sell the excess construction equipment worth P30,000,000.00.
DMCI POWER CORP.
There are no power generation equipment under lease, mortgage, lien or encumbrance.
DMCI PROJECT DEVELOPERS, INC.
Classification Property Description Location
EQUIPMENT Office equipment Communication equipment Furniture and fixtures Transportation equipment Machinery & other construction equipment Software Mock-up assets
Various
11
LAND Residential Bambang,Taguig
Bambang 1, Taguig
Bambang 2, Taguig Carmona , Cavite Bacoor, Cavite
Hagonoy, Taguig
Pamplona, Las Piñas
Mandaluyong
Taft Avenue,Manila Muntinlupa Pasay City
Parañaque
Quezon City
Ususan, Taguig Wawa Baguio City Makati City Manila
There are no equipment or property under lease, mortgage, lien or encumbrance.
DMCI MINING CORPORATION
Machinery & Equipment
Description Qty Location
Shipped/Sold to Berong
Balance 12/31/13
Excavator, Hydraulic ROBEX 210LC-7H 12 Sta Cruz, Zambales 2 10
Excavator, Hyundai Hydraulic 1 Sta Cruz, Zambales 1
Excavator, Hydraulic PC-200-8 5 Sta Cruz, Zambales 5 0
There are no equipment or property under lease, mortgage, lien or encumbrance.
Item 3. Legal Proceedings
Except for the following, none of the directors, executive officers and nominees for
election is subject to any pending material legal proceedings. Consolidated Criminal Complaints of Rodolfo V. Cruz, et al. v. Isidro A. Consunji, Edwina C. Laperal, Cesar A. Buenaventura, et al. IS Nos. 03-57411-I, 03-57412-I, 03-57413-I, 03-57414-I, 03-57415-I, 03-57446-I and 03-57447-I
13
Department of Justice, National Prosecution Service
Semirara Mining Corporation
1. The HGL Case. - Sometime in January 2004, the Company received a complaint filed by HGL
Development Corporation (“HGL”). The facts are as follows: On August 28, 1984, HGL entered into a Forest Land Grazing Lease Agreement (FLGLA No. 184) with the Department of Environment and Natural Resources (“DENR”) covering a 367-hectare land located at the barrios of Bobog and Pontod, Semirara, Antique. In its Order dated December 6, 2000, the DENR cancelled FLGLA No. 184 explaining that the subject area is within the coverage of Proclamation No. 649, which set apart the island of Semirara in the Province of Antique as coal mining reservations. HGL filed a letter requesting a reconsideration of the Order but the request was denied in the DENR’s letter-Order dated December 9, 2002.
The Caloocan Case: On November 17, 2003, HGL filed a complaint against the DENR for specific performance and damages in Branch 121, Regional Trial Court of Caloocan City (RTC-Caloocan). HGL prayed that DENR should perform its obligations under FLGLA No. 184 and pay HGL for moral and exemplary damages and attorneys’ fees.
On March 2, 2004, the Company filed a Motion for Intervention because the Order canceling FLGLA No. 184 sought to be reconsidered by HGL covers property located in the island of Semirara, Antique, which was granted by RTC-Caloocan. Subsequently, the Company filed a Motion to Dismiss on the ground of lack of cause of action/jurisdiction and forum shopping. The Company’s prayer for dismissal and its subsequent Motion for Reconsideration having been both denied, the Company filed its Petition for Review with the Court of Appeals (CA) on November 28, 2005 on the premise that RTC-Caloocan has no jurisdiction over the case. On January 16, 2007, the CA reversed RTC–Caloocan’s decision and finding grave abuse of discretion on the part of the presiding judge for failing to dismiss the case for lack of jurisdiction. The CA ruled that the DENR Order canceling the FLGLA No. 184 of HGL had long been final and executory on account of its failure to appeal said Order to the Office of the President. Eventually, HGL’s Motion for Reconsideration was denied by the CA and accordingly dismissed the case.
Due to CA’s denial of HGL’s Motion for Reconsideration, a Petition for Certiorari (SC G.R. No. 177844, 2
nd Division) was filed by HGL before the Supreme Court (SC) on November 14, 2007,
which was denied by the SC for failure of HGL to sufficiently show any reversible error in the assailed CA decision and further denies HGL’s motion for leave and first and second motions of time to file a reply to the Company’s comments on the petition. HGL’s Motion for Reconsideration was denied with finality by the SC on July 2, 2008. Meanwhile, in a case docketed as SC G.R. No. 180401, 1
st Division (DENR vs. HGL), DENR’s
Petition for Certiorari was denied by the SC on February 4, 2008. DENR then filed its Motion for Reconsideration on March 25, 2009, which later denied by the SC with finality. Citing as basis the dismissal of the Culasi Case (SMC vs. HGL) on the ground of forum shopping, SMC filed a Motion to Dismiss with RTC-Caloocan (Civil Case No. C-20675). However, RTC-Caloocan denied the motion on December 24, 2008 and cited the SC decision on G.R. No. 180401 (DENR vs. HGL) to sustain its decision to retain jurisdiction over the case. With the denial of its MR on June 24, 2009 (CA-G.R. SP No. 110460). On October 3, 2013 the CA dismissed the Corporation’s petition to which a Motion for Reconsideration was filed on November 22, 2013. The case is pending to date.
14
The Culasi Case: HGL also filed a separate case against the Company on November 17, 2003 in Branch 13 of the Regional Trial Court of Culasi, Antique (RTC-Culasi) for the recovery of their alleged possession of a 367-hectare land located at the barrios of Bobog and Pontod, Semirara, Antique. HGL prayed for (i) the issuance of a preliminary mandatory injunction in order to secure immediate possession of the property pending litigation, and (ii) actual, moral and exemplary damages and attorney’s fees in the total amount of P10 million. The Company received the summons on January 15, 2004.
On February 6, 2004, the Company filed its Answer and prayed for the outright dismissal of the case for being baseless and unfounded as the Order canceling FLGLA No. 184 had long been final and executory and can no longer be disturbed. The Company claims exemplary and moral damages and attorneys’ fees.
On September 16, 2004, the RTC-Culasi granted HGL’s prayer for preliminary mandatory injunction, which order was affirmed by the CA-Cebu. The Company elevated the case to the SC by way of Certiorari with prayer for Temporary Restraining Order (TRO) and/or Injunction to be issued against HGL, the CA-Cebu and RTC-Culasi. The SC initially granted the TRO on March 2, 2005, but on December 06, 2006, the SC denied the Company’s Petition for Certiorari and lifted the TRO. On January 18, 2007, the Company filed a Motion for Reconsideration and later on January 25, 2007 due to the ruling by the CA in the Caloocan Case filed a Supplemental Motion for Reconsideration. On February 14, 2007, the SC denied with finality the Company’s Motion for Reconsideration and its supplement to the aforesaid motion for lack of merit.
Meanwhile, on July 16, 2007, the RTC-Culasi dismissed the main case, as the two (2) cases filed by HGL was a deliberate violation of the rule on forum shopping. RTC-Culasi further stated in its decision that in both cases, HGL’s cause of action rests on the validity of its FLGLA No. 184. HGL filed its Motion for Reconsideration, but on November 20, 2007, RTC-Culasi ruled against HGL. No appeal was taken by HGL.
Thereafter, on February 5, 2008, HGL filed before the SC a Petition for Indirect Contempt docketed as “HGL Development Corporation, represented by its President, Henry G. Lim, Petitioner vs. Hon. Rafael L. Penuela, in his capacity as Presiding Judge of RTC-Culasi, Antique, Branch 13, and Semirara Coal Corporation (now Semirara Mining Corporation, Respondents,” SC G.R. No. 181353. HGL alleged, among others, that the dismissal of the Culasi case constitutes indirect contempt as HGL was not able to implement the SC’s decision dated December 6, 2006 (affirming the earlier order of RTC-Culasi granting HGL’s prayer for preliminary mandatory injunction) and resolution dated February 14, 2007, as RTC-Culasi dismissed the main case or the Culasi case on the ground of forum shopping. The Company filed its Comments/Opposition to the Petition. Subsequently, the SC required the parties to submit their respective Memoranda. The case is pending to date.
2. Tax Refund/Credit Case. - The Company filed several cases against the Commissioner of
Internal Revenue (CIR) before the Court of Tax Appeals (CTA) for tax credit/refund due to erroneously withheld and remitted VAT on coal sales by National Power Company (NPC) to the Bureau of Internal Revenue in the total amount of ₱190,500,981.23. 2.1. CTA Case No. 7717. – On October 13, 2009, the CTA rendered a Decision granting the
Company’s petition in the amount of ₱11,847,055.07 for the month of December 2005. The CIR moved for reconsideration. After the Company filed its comment on November 21, 2009, the CTA on August 10, 2010 issued a Writ of Execution on its decision dated October 15, 2009. The Writ of Execution was served to BIR on August 13, 2010. Notwithstanding this, the Company’s tax credit certificate remained pending with the BIR.
15
2.2. Commissioner of Internal Revenue vs. Semirara Mining Corporation, SC G.R. No. 202534 (CTA EB No. 752). – On January 4, 2011, the CTA granted the Company’s petition in the amount of ₱15,292,054.91 for the month of January 2007. CIR’s Motion for Reconsideration was denied on March 18, 2011. CIR appealed the case to CTA En Banc (CTA EB No. 752) but the CTA En Banc dismissed the CIR’s petition for lack of merit. The CIR again moved to reconsider the En Banc decision, but was denied on June 28, 2012. Thereafter, the CIR filed a petition for review on certiorari with the Supreme Court, to which the Company filed a comment. The petition remains pending to date.
2.3. Commissioner of Internal Revenue vs. Semirara Mining Corporation, SC G.R. No. 202922
(CTA EB No. 772). – On February 10, 2011, the CTA granted the Company’s petitions in the amount of ₱86,108,626.10 for the period covering January 1, 2006 to June 30, 2006. On February 22, 2011, as CIR’s Motion for Reconsideration was denied, it elevated the case to the CTA En Banc (CTA EB No. 772), but was by the CTA En Banc on June 22, 2012. The CIR filed a Motion for Reconsideration but was again denied by CTA on September 17, 2012. The CIR elevated the case to the Supreme Court (SC) via a Petition for Review on November 5, 2012, but was denied in a minute resolution dated January 30, 2013. On October 10, 2013 an Entry of Judgment was issued. The Corporation filed its Motion for Issuance of a Writ of Execution with the CTA which was granted on January 21, 2014.
2.4. Commissioner of Internal Revenue vs. Semirara Mining Corporation, SC G.R. No. 202922
(CTA EB No. 793). - On March 28, 2011, the CTA grated SMC’s petition in the amount of P77,253,245.39 for the periods covering July 1, 2006 to December 31, 2006. The CIR’s Motion for Reconsideration was denied on June 3, 2011. The CIR elevated the case to the CTA En Banc (CTA EB 793), but the CTA dismissed the petition on April 23, 2012 for lack of merit. As the CIR’s Motion for Reconsideration was likewise denied on May 29, 2012, it filed a petition with the Supreme Court. The Corporation filed a Comment on December 28, 2012 to the CIR’s Petition. On October 25, 2013, the SC issued a notice grating the CIR’s Motion to Admit Reply and a copy of the Reply. The case remains pending to date.
3. SMC vs. Municipality of Calaca, RTC- Makati City, Branch 137, Civil Case No. 07-180
(Business Tax Case). - On February 26, 2007, the Company filed a complaint () to seek the reversal and cancellation of the tax assessment by the Municipality of Calaca for unpaid business tax for the CY 2003, 2004 and 2005 in the amount of ₱66,685,189.00. The basis of the claim is that since coal is being delivered to the port of Calaca and that the Company is doing business there as shown by the existence of an office; therefore, the situs of taxation is in Calaca. The Company maintains that it is not maintaining an office in the Municipality of Calaca, despite delivery to NPC-Calaca, hence the proper situs of taxation is not in Calaca but in its principal office. The Corporation presented all its witnesses and submitted its formal offer of documentary exhibits. Subsequent hearings will be for presentation of defendant’s evidence.
4. Municipality of Caluya, Antique vs. SMC, RTC-Culasi, Branch 13, Civil Case No. C-051
(Real Property Tax Case). - On February 19, 2008, the Municipality of Caluya Antique filed a case against the Company for enforcement of the compromise agreement submitted to the RTC on November 17, 2003 involving the balance of ₱82,979,702.24 in real property taxes for lots located in Semirara Island. The Company maintains that the Motion for Execution has no legal basis and premature due to a clause in the compromise agreement requiring the parties first determines the correctness of the tax assessments which shall be subject to the verification of the parties. The parties submitted on October 11, 2012 a Compromise Agreement dated July 2, 2012 for approval of the Court. To date the Court has yet to issue an order approving the Compromise Agreement.
5. Power & Synergy, Inc. vs. SMC, et. al, RTC-QC, Branch 97, Civil Case No. Q-10-66936
(Specific Performance Case). – The complaint alleges fraudulent acts against the Company and its directors and officers, and prayed that defendants jointly and severally perform and comply
16
with the terms and conditions under the Consultancy Agreement. PSI is in effect claiming a success fee of ₱1.3 billion (due to increase in coal volume sold to NPC) by the end of 2010. On June 2, 2010, moved for the dismissal for lack of jurisdiction over the case, improper venue in so far as other individual defendants are concerned, and the complaint states no cause of action. The RTC required PSE to pay the correct docket fees, but PSI moved for reconsideration. To date, the Court is yet to rule on both motions of the Corporation and PSI.
6. Gabinete, et. al. vs. SMC, et. al, Civil Case No. 210-C, MCTC-Pandan, Antique (Forcible Entry
Case). – The complaint hinges from the alleged entry of the Company to a portion of plaintiffs’ properties located in Barangay Alegria, Caluya, Antique. Plaintiffs’ prayed to the Court to order defendants to vacate the properties and pay damages and attorney fees. On March 10, 2014 the Corporation submitted its affidavits and position paper..
7. Gabinete, et. al. vs. SMC, et. al., Civil Case No. C-260, RTC-Culasi, Antique, Branch 13
(Annulment of Deeds of Sale Case). – The complaint seeks the annulment of deeds of sale plaintiff executed with the defendant George G. San Pedro covering parcels of land located in Brgy. Alegria, Caluya, Antique due to alleged unsound mind of the plaintiff at the time of execution. After defendants filed their answer, the RTC scheduled the pre-trial conference on February 10, 2014.
8. Bornea, Jr., vs. SMC, et. al., NLRC-Cagayan de Oro City, NLRC Case No. RAB-IX-11-00663-11 (Illegal Dismissal Case). - This is an illegal dismissal case filed by Engr. Bornea docketed as with the Arbitration Branch of Davao seeking for his reinstatement as the Foreman Supervisor of the Company’s mining facility in Caluya, Antique. Bornea alleged that there was no justifiable ground to dismiss and that due process was not observed. On April 24, 2012, the Labor Arbiter resolved to dismiss the complaint for lack of merit. Bornea appealed the case, but the NLRC-Cagayan de Oro City likewise dismissed the appeal for lack of merit in its Decision dated December 28, 2012. On February 19, 2013, Bornea moved to reconsider the NLRC decision, but the NLRC in its Resolution dated March 27, 2013 dismissed the motion for lack of merit. Despite this, Bornea filed with the CA a Petition for Certiorari under Rule 65. The same remains pending to date.
9. Semirara Mining Corporation vs. Bureau of Internal Revenue, et. al., Civil Case No. 13-1171, RTC-Makati, Branch 146 (Declaratory Relief with Injunction against BIR, etc.). – This is a case filed by the Corporation against the BIR, Bureau of Customs & Department of Finance under Civil Case No. 13-1171, RTC Makati Br. 146. On May 21, 2013 SMC was granted a Certificate of Qualification for Tax Exemption under PD 972 by the DOE for its 36,000,000 liters of diesoline. SMC made 1
st partial shipment of 6,176,367 liters. BIR assessed VAT and excise tax
on said shipment in the amount of P25 M which was paid under protest. As a result SMC filed a petition for Declaratory Relief with the RTC on October 3, 2013 seeking to enjoin BIR, BOC from implementing BIR RR No. 2-2012 by imposing advance payment of VAT on SMC importation of diesel fuel for its own use and consumption. BIR rationalizes its issuance of RR No. 2-2012 for the purpose of curtailing smuggling. While under said regulations payment of VAT is subject to right of refund by SMC (effectively 0% rated) being exempted from VAT under its COC and PD 972, SMC contested the application of said regulation as it effectively diminishes its exemption granted by law and impairs the rights under its COC pursuant to the non-impairment clause of the Constitution. On October 30, 2013, SMC secured a 20-day TRO and on November 21, 2013 the court issued a preliminary injunction against the BIR, BOC and DOF in so far as the implementation of said regulation specifically against the Corporation. To date the case remains pending.
10. Fajardo vs. Semirara Mining Corp., et. al., Civil Case No. C-271, RTC-Culasi, Antique, Branch 13 (Environmental Case (Writ of Kalikasan). – Was filed pursuant to Supreme Court A.M. 09-6-8-SC on Rules of Procedures for Environmental Cases (Rules). Complainant prayed for Temporary Environmental Protection Order (TEPO) for 72 hours from receipt of the complaint for
17
the alleged irresponsible coal mining, serious destruction of the island, pollution of marine and coral reefs, damage to marine life, among others. Defendants filed their respective answer, but no TEPO has been issued by the RTC to date.
Except for the foregoing cases, the Company or its subsidiaries is not a party to any pending material legal proceedings. It is not involved in any pending legal proceedings with respect to any of its properties. Apart from the foregoing, therefore, it is not involved in any claims or lawsuits involving damages, which may materially affect it or its subsidiaries.
Item 4. Submission of Matters to a Vote of Security Holders
There were no matters submitted to vote of the security holders during the fourth quarter of the
fiscal year covered by this report.
PART II – SECURITIES OF THE REGISTRANT
Item 5. Market for Issuer's Common Equity and Related Stockholder Matters
(A) Market Price of and Dividends on Registrant's Common Equity and Related Stockholder Matters
(1) Market Information
(a) Identify the principal market or markets where the registrant's common equity is traded. If
there is no public trading market, so state - Both common and preferred shares of DMCI
Holdings, Inc. are traded on the Philippine Stock Exchange.
(i) If the principal market for the registrant's common equity is a Stock Exchange in the Philippines or a foreign Exchange, state the name of that Exchange and give the high and low sales prices for each quarter within the last two fiscal years and any subsequent interim period for which financial statements are required by SRC Rule 68. – See table below
Common Share Prices High Low 2012 First Quarter 54.50 53.10 Second Quarter 57.00 56.85 Third Quarter 58.15 57.95 Fourth Quarter 54.80 53.85 2013 First Quarter 55.80 53.80 Second Quarter 51.60 51.00 Third Quarter 47.20 45.80 Fourth Quarter 56.70 55.20 2014 First Quarter 70.20 70.00 Preferred Share Prices High Low
18
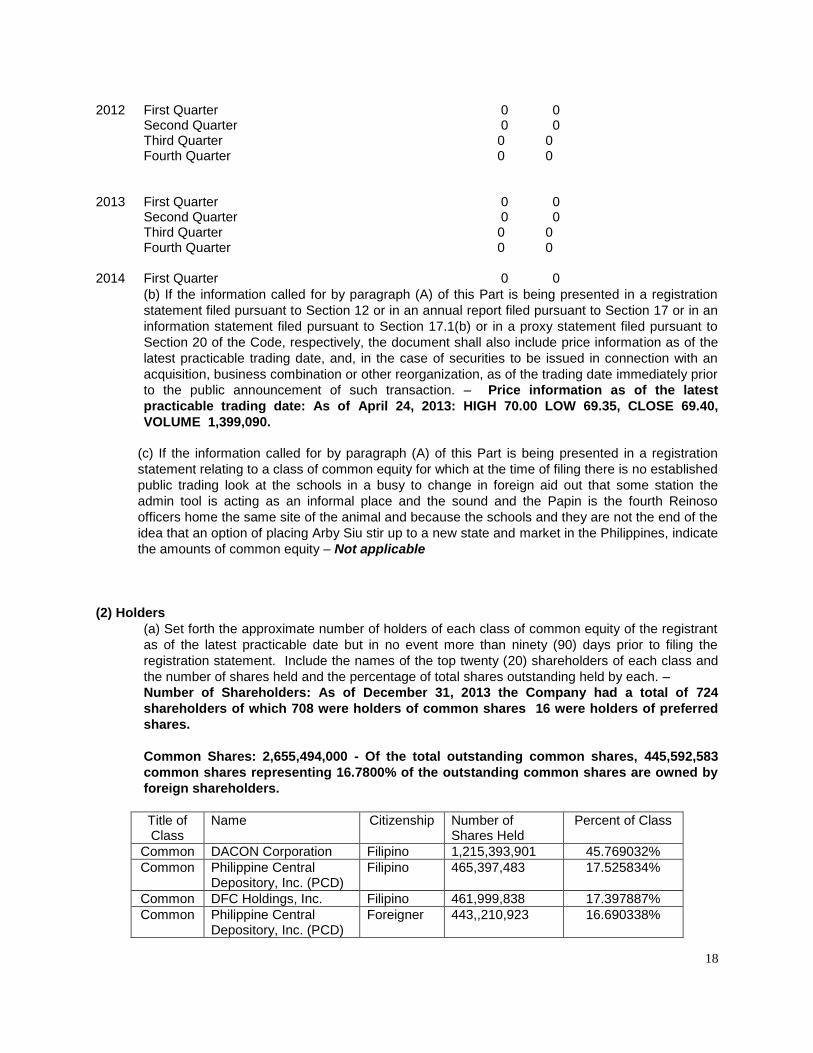
2012 First Quarter 0 0 Second Quarter 0 0 Third Quarter 0 0 Fourth Quarter 0 0 2013 First Quarter 0 0 Second Quarter 0 0 Third Quarter 0 0 Fourth Quarter 0 0 2014 First Quarter 0 0
(b) If the information called for by paragraph (A) of this Part is being presented in a registration
statement filed pursuant to Section 12 or in an annual report filed pursuant to Section 17 or in an
information statement filed pursuant to Section 17.1(b) or in a proxy statement filed pursuant to
Section 20 of the Code, respectively, the document shall also include price information as of the
latest practicable trading date, and, in the case of securities to be issued in connection with an
acquisition, business combination or other reorganization, as of the trading date immediately prior
to the public announcement of such transaction. – Price information as of the latest
practicable trading date: As of April 24, 2013: HIGH 70.00 LOW 69.35, CLOSE 69.40,
VOLUME 1,399,090.
(c) If the information called for by paragraph (A) of this Part is being presented in a registration
statement relating to a class of common equity for which at the time of filing there is no established
public trading look at the schools in a busy to change in foreign aid out that some station the
admin tool is acting as an informal place and the sound and the Papin is the fourth Reinoso
officers home the same site of the animal and because the schools and they are not the end of the
idea that an option of placing Arby Siu stir up to a new state and market in the Philippines, indicate
the amounts of common equity – Not applicable
(2) Holders
(a) Set forth the approximate number of holders of each class of common equity of the registrant
as of the latest practicable date but in no event more than ninety (90) days prior to filing the
registration statement. Include the names of the top twenty (20) shareholders of each class and
the number of shares held and the percentage of total shares outstanding held by each. –
Number of Shareholders: As of December 31, 2013 the Company had a total of 724
shareholders of which 708 were holders of common shares 16 were holders of preferred
shares.
Common Shares: 2,655,494,000 - Of the total outstanding common shares, 445,592,583
common shares representing 16.7800% of the outstanding common shares are owned by
foreign shareholders.
Title of Class
Name Citizenship Number of Shares Held
Percent of Class
Common DACON Corporation Filipino 1,215,393,901 45.769032%
Common Philippine Central Depository, Inc. (PCD)
Filipino 465,397,483 17.525834%
Common DFC Holdings, Inc. Filipino 461,999,838 17.397887%
Common Philippine Central Depository, Inc. (PCD)
Foreigner 443,,210,923 16.690338%
19
Top 20 Common Shareholders: The list of the Top 20 common shareholders as of December 31, 2012 as contained in Exhibit (2) is herein incorporated by reference.
(3) Dividends
(a) Discuss any cash dividends declared on each class of its common equity by the registrant for
the two most recent fiscal years and any subsequent interim period for which financial statements
are required to be presented by SRC Rule 68. – See below: 1. On April 7, 1999, the Company paid the semi-annual dividend of 2.5 % for last semester of the
second year to the holders of the preferred shares. 2. On October 7, 1999, the Company paid the semi-annual dividend of 3.6 % for the first semester of the
third year to the holders of the preferred shares. 3. On April 7, 2000, the Company paid the semi-annual dividend of 3.6% for last semester of the third
year to the holders of the preferred shares. 4. On October 7, 2000, the Company paid the semi-annual dividend of 3.6% for the first semester of the
fourth year to the holders of the preferred shares. 5. On July 20, 2006, the Company paid cash dividends at the amount of PhP 0.10 per outstanding
common share to the shareholders of record of June 30, 2006. 6. On May 28, 2007, the Company paid cash dividends at the amount of Php 0.10 per outstanding
common share to the shareholders of record of April 30, 2007 7. On May 30, 2008, the Company paid cash dividends at the amount of Pho 0.10 per outstanding
common share to the shareholders of record of May 12, 2008. 8. On June 30, 2009, the Company paid cash dividends at the amount of Php 0.20 per outstanding
common share to the shareholders of record of June 5, 2009. 9. On July 15, 2010, the Company paid cash dividends at the amount of Php 0.50 per outstanding
common share to the shareholders of record of June 22, 2010. 10. On July 7, 2011, the Company paid cash dividends at the amount of Php 1.00 per outstanding
common share to the shareholders of record of June 15, 2011. 11. On May 15, 2012, the Company paid cash dividends at the amount of Php 1.20 per outstanding
common share to the shareholders of record of June 15, 2012. 12. On April 11, 2013, the Company declared cash dividends of Php 1.20 per common share and special
cash dividends of Php 1.00 per common share to the shareholders of record of April 26, 2013. 13. On November 14, 2013, the Company declared a special cash dividends of P1.20 per common share
to the shareholders of record of November 29, 2013.
(b) Describe any restrictions that limit the ability to pay dividends on common equity or that are
likely to do so in the future. – There are no contractual or other restrictions on the
Company’s ability to pay dividends. However, the ability of the Company to pay dividends
will depend upon the amount of distributions, if any, received from the Company’s
operating subsidiaries and joint venture investments and the availability of unrestricted
retained earnings. The Company’s operating subsidiaries however are restricted on the
declaration and payment of dividends, as limited by negative covenants entered into by
the operating subsidiaries with outside parties.
(4) Recent Sales of Unregistered Securities - NONE
20
PART III- FINANCIAL INFORMATION
A. MANAGEMENT'S DISCUSSION AND ANALYSIS OF PLAN OF OPERATION.
Full Year 2013 vs. 2012
I. RESULTS OF OPERATIONS
DMCI Holdings, Inc. (the “Company”) reported a consolidated net profit of P18.9 billion (inclusive of P8.4 billion one-time gain on sale) for the year 2013, which is 95% higher than in 2012. Core net income, which was boosted by the strong profit growth of the power segment, grew by 9% to P10.6 billion in 2013 from P9.7 billion in 2012. This growth is a result of the successful synergy between the coal and power business coupled with the increased generation output of the Calaca power units. Also, the real estate segment continues to deliver double-digit growth in net income contributions due to high volume of sales and completion of several projects during the course of the year. Meanwhile, even with a slight decrease in its reported revenues, the construction segment sustained its net income contribution of P1.28 billion due to improvement of margins. On the other hand, despite the growth in water operations by 7.2% this year, the Company is reporting a lower share in net earnings from the water business as a result of the reduced effective interest in Maynilad, from 41% in 2012 to 25% in 2013.
In spite of the weak global commodity prices, which adversely affected the nickel and coal mining
segments, the Company posted a record P56.0 billion in consolidated revenues in 2013, which is an 8% increase from P51.7 billion in 2012. The increase in revenue is mostly due to higher power generation sales and a surge in recognized revenues from the real estate segment.
Below is a table on the net income contributions of the Company’s businesses for 2013 and 2012:
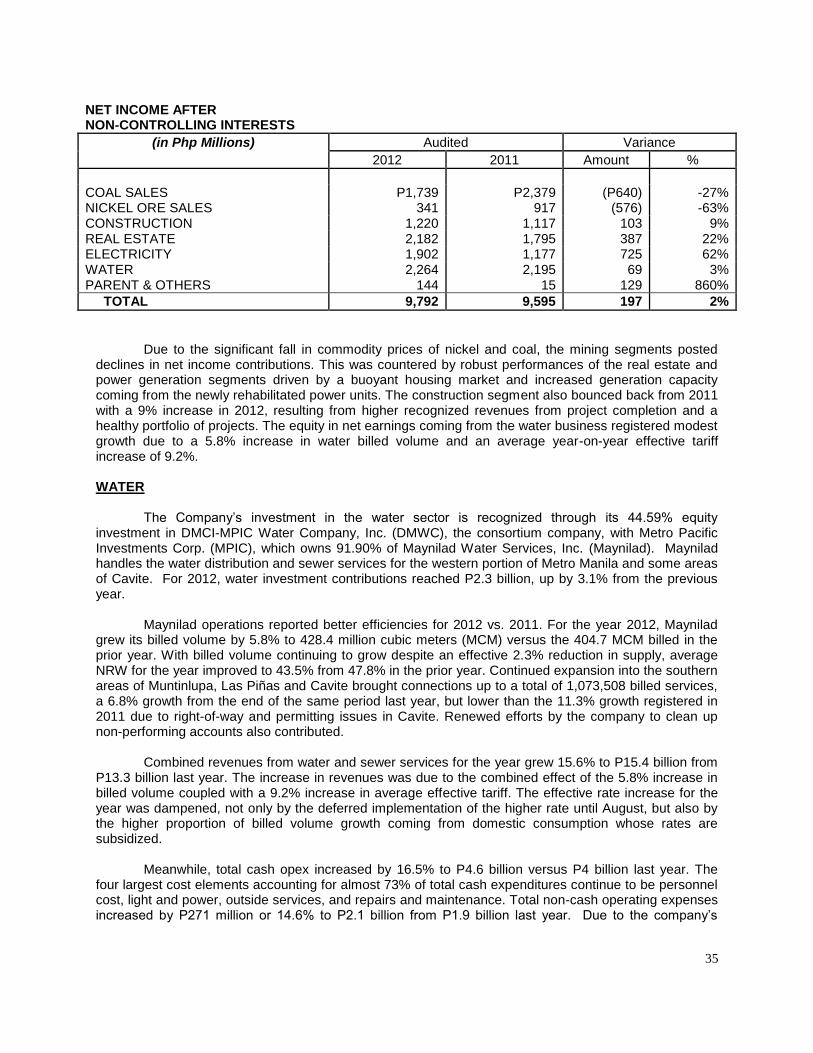
NET INCOME AFTER NON-CONTROLLING INTERESTS
(in Php Millions) Audited Variance
2013 2012
(as restated*) Amount %
COAL MINING P1,022 P1,740 (P718) -41% NICKEL MINING 169 341 (172) -50% CONSTRUCTION 1,275 1,275 - 0% REAL ESTATE 2,655 2,105 550 26% POWER 3,478 1,901 1,577 83% WATER 1,915 2,340 (425) -18% PARENT COMPANY 65 34 31 91%
CORE NET INCOME 10,579 9,736 843 9% ONE-TIME GAIN ON SALE (Parent) 8,358 - 8,358 -
TOTAL P18,937 P9,736 P9,201 95%
*As a result of adopting new accounting standards
WATER
The Company’s investment in the water sector is recognized mainly through its equity investment in the partnership with Metro Pacific Investments Corp. (MPIC) with the actual operations under Maynilad Water Services, Inc. (Maynilad). Maynilad handles the water distribution and sewer services for the western side of Metro Manila. On February 13, 2013, MCNK JV Corporation, a subsidiary of Marubeni Corporation, acquired 20% effective ownership in Maynilad. The transaction reduced the Company’s
21
effective interest in Maynilad from 41% to 25%. The entry of MCNK in the consortium is expected to help provide Maynilad with access to additional sources of funding and innovative technology.
Operating efficiencies continue to improve as Maynilad reported higher income from operations of P9.7 billion in 2013, up 7.2% from P9.1 billion in 2012. Billed volume was up 3.6%, despite an effective 4.4% reduction in water supply. Average non-revenue water for the year continued to stay below the 40% barrier, improving to 38.71% from 43.47% last year.
Continued expansion into the southern areas of Muntinlupa, Las Piñas and Cavite brought
connections up to a total of 1,129,497 billed services, a 5.2% growth from the end of the same period last year. The combined effect of the increase in billed volume and an effective year-on-year tariff increase of 3%, mainly inflation driven, resulted to a growth in water service revenue by 7.8% from P12.5 billion in 2012 to P13.5 billion in 2013. Total revenues from operations, including other fees and services such as installation fees, amounted to P16.8 billion, a 6.0% increase from P15.8 billion last year.
Total non-cash operating expenses decreased by 10.0% to P1.9 billion from P2.1 billion last year
mainly as a result of the shift to the units-of-production method of amortization beginning 2013. This method more closely aligns the consumption of economic benefit of the concession assets with the growth in billed volume. Meanwhile, total cash operating expenses increased by 10.9% to P5.1 billion versus P4.6 billion last year primarily driven by increases in personnel cost and professional fees.
As a result, reported net income grew at a rate of 7.2%, from P6.4 billion in 2012 to P6.9 billion in
2013. After adjustments at the consortium company level, the Company’s equity in net earnings reported a 19% decline from P2.3 billion last year to P1.8 billion this year due to a lower effective interest as mentioned.
In 2013, Maynilad submitted its business plan for the determination of its standard rates for the
period 2013 to 2017 to the Metropolitan Waterworks and Sewage System (“MWSS”), its regulator. On September 12, 2013, MWSS denied Maynilad’s application for an upward adjustment and instead proposed a negative adjustment of 4.82% (or ₱1.46 per cubic meter) in what Maynilad views as a violation of its concession agreement. Maynilad did not accept the tariff proposal of MWSS and on October 4, 2013 filed a notice of dispute with the Secretariat of the International Chamber of Commerce (ICC) International Court of Arbitration for resolution. The arbitration panel will be chaired by Prof Bernard Hanotiau, a respected member of the Brussels and Paris bars. Hearings are expected to commence once the rest of the panel is formed.
On March 15, 2013, Maynilad acquired a 10% shareholding in Subic Water and Sewerage Co., Inc. (“Subic Water”), which serves 40,000 customers in Olongapo City and the Subic Bay Freeport Zone under a build-operate-transfer scheme. CONSTRUCTION
The Group’s construction business reported a sustained net income contribution of P1.28 billion in 2013. The segment was able to maintain its net income despite a slight decrease of 5% in revenues from external projects (outside of DMCI group) from P15.1 billion in 2012 to P14.4 billion in 2013. The sustained bottom-line is attributable to the improvement of margins of building projects.
From P15.7 billion as of end 2012, DMCI’s total order book (balance of work) as of end 2013
amounted to P21.1 billion with the award of the NAIA Expressway project of San Miguel Corporation and the contract for the construction of the second 1 x 135 power plant of South Luzon Thermal Energy Corporation (SLTEC). Some of the notable projects the Company undertook during 2013 were the Entertainment City Project (completed in early 2013), the Entertainment City Phase 1A, the power plants in Batangas and the Tarlac Pangasinan La Union Expressway (TPLEX) Section 1B (Gerona to Pangasinan).
22
Although delayed, the Company is confident that the infrastructure development programs of the
current Philippine government through the Public-Private Partnership (PPP) projects is already gaining headway and will inevitably materialize. It believes it is well positioned to be both a driver and a beneficiary of the country’s infrastructure progress. REAL ESTATE
The Group’s real estate business is focused on residential development. It is led by the Company’s wholly owned subsidiary DMCI Project Developer’s Inc. (PDI) The segment posted a consistent 26% growth in net income reaching P2.7 billion in 2013 compared to P2.1 billion in 2012. Revenues also posted a robust 32% growth in 2013, amounting to P12.2 billion compared to P9.2 billion last year. Increase in revenue was moderated by higher cost and expenses due mainly to the increase in commissions paid and higher taxes and licenses expensed during the period.
It is worth to note that the company recognizes real estate revenues using the full accrual
method, where sales are booked when the unit is fully completed and the downpayment of 15% has already been paid. Recently completed units in La Verti Towers, Flair Towers, Maricielo Villas, Royal Palm-Kamala, Tivoli Garden-Iris & Hibiscus, Siena Park and Rhapsody Residences significantly accounted for the growth in realized revenues.
A better representative of current demand would be sales and reservations for the period which
experienced a 5% increase to P18.4 billion in 2013 from P17.5 billion in 2012, which covers Jan. to Dec. cutoff compared to previously reported P17.1 billion which is from Dec. 2011 to Nov. 2012 period to better align with financial statements reporting. Sustained demand for condominium units coming mainly from new projects::Levina Place, Lumiere Residences and Sheridan Towers, all in Pasig, Outlook Ridge in Baguio City,The Birchwood in Taguig and Vierra Residences in Quezon City pushed sales take-up higher. Moreover, increased take up from existing projects like Flair Towers, Tivoli Gardens, Verawood Residences, Zinnia Towers and Rhapsody Residences added to the growth in sales and reservations.
Taking advantage of a low interest environment, the PDI’s bank loans reported a net increase of
P6.4 billion, which is up 52% in end-2013. Loans are availed to finance land acquisitions and project expenditures as the company maintains it commitment to turnover its projects on time. COAL MINING & POWER Coal Mining & Power (Calaca-Coal)
The Company’s coal mining business which owns a major power asset in Calaca are both lodged under the 56.32%-owned and publicly listed Semirara Mining Corp (SMC). SMC reported a decline in net income from P3.1 billion in 2012 to P1.8 billion in 2013. Mainly due to drop in Coal Revenues (net of eliminations), by 13% YoY at PHP12.57 billion from PHP14.45 billion in 2012 due to lower coal prices this year. This was countered by a surge in the net income coming from the power generation business amounting to P5.7 billion this year compared to P3.3 billion in the previous year due to higher energy generation capacity from the rehabilitated Calaca power plants.
Below is an excerpt from SMC’s management discussion and analysis of results of operations
and financial condition for the year 2013 as lifted from its consolidated financial report with the PSE and SEC:
23
A. MANAGEMENT’S DISCUSSION AND ANALYSIS OF FINANCIAL CONDITION AND RESULTS OF OPERATIONS (YEARS 2012-2013) Full Years 2012-2013
I. PRODUCTION AND OPERATIONS Coal On 13 Feb 2013, at around 11:55 PM, a section of the west wall of Panian pit where the Company was concluding its mine operation gave way, affecting 13 personnel. Three have been rescued, five were confirmed dead, and five are still missing. Management immediately voluntarily stopped all mining activities in the site even before the receipt of notice from the Department of Energy (DOE) for stop operations. On 5 March 2013, DOE issued clearance to the Company to do preparatory activies, excluding coal extraction, for the new area, the North Panian, after it has reviewed and evaluated the work program for the site. Subsequently, on 19 April 2013, the Company received full clearance from DOE to proceed with the coal production activity. Since then, all mining operations have returned to normal. The incident at the mine caused a a temporary slump in coal mining operations. However, mining activities were able to catch up, such that total materials moved increased 7% YoY at 82.15 million bank cubic meters (bcm) from 77.07 million bcm last year. Strip ratio increased by 20% YoY at 9.73:1 from 8.66:1 last year. The increase is mainly due to the spike in strip ratio to 18.79:1 in Q1 after the Company stopped producing coal, but continued waste stripping. Run-of-mine (ROM) coal dropped by 5% YoY at 7.86 million metric tons (MTs) from 8.24 million MTs in 2012. A significant 45% drop YoY in washable coal at 727 thousand MTs from 1.31 million MTs last year was recorded as a result of improved coal quality. Net total product coal was almost the same at 7.62 million MTs and 7.63 million MTs in 2013 and 2012, respectively. Total volume sold increased by 6% YoY at 7.63 million MTs from 7.18 million MTs last year. Coal shipments recorded an improvement in average heating value from 9,510 btu/lbs in 2012 to 9,676 btu/lbs. Coal ending inventory dropped by 8% YoY, closing at 1.28 million MTs from 1.38 million MTs last year as a result of higher sales volume. The table below shows the comparative quarterly production data for 2013 and 2012.
Total energy generation posted a record high in 2013 at 3,638 GWh, the highest in the history of the Calaca Coal Fired Thermal Power plants, posting a 48% YoY from 2,463 GWh in 2012. Lower maintenance outage offset high forced outage of Unit 1 , raising total operating hours at 7,292 , 83% YoY from 2,697 hours in 2012 . Moreover, raised capacity of Unit 1 offset the lower dependable capacity of Unit 2, bringing average capacity to 501 MW from 446 MW last year. Unit One There is a notable improvement in 2013 as compared to previous year’s performance. Average load of 229 MW is 16% above 2012’s average load of 197 MW. This is primarily due to an increase in capacity ranging between 230 to 245 as a result of the use of Nalco Soot Remove 9F. With higher operating hours at 7,292 hours, total generation is 1,667 Gwh, recording a 214% increase YoY compared to 2012’s gross generation of 531 Gwh . Capacity factor of 64% posted a significant 215% increase YoY from only 20% in 2012 as preventive maintenance of the plant drove availability down to 31% or operating hours of only 2,697. Forced outage was high at 21% due to a leak in the condenser in Q2 and Q4 of 2013 caused by clogging in some of the tubes raising the temperature to increase beyond manageable level resulting to pin hole leaks . To ensure that the sea water intake is free from any debris which may potentially cause another tube clogging incident, a preventive multi-layered net at sea and took on an active role in educating the neighboring communities on waste management. Unit Two The planned maintenance shutdown in December 2012 included six critical items, of which only five were executed. Replacement of Heaters 7 and 8 was deferred due to technical issue. As a result, load was limited to 272 MW out of the rated capacity of 300 MW. This is however 9% higher than average capacity of 249 MW in 2012. Despite the above limitation, gross generation posted a 2% increase YoY at 1,971 Gwh from 1,932 GWh in 2012. Availability was however lower at 83% as against 88% in 2012. The table below shows the comparative production data in 2013 and 2012.
II. MARKETING Coal Higher sales to power plants and exports offset drop in sales to cement plants and other industries. Total coal sales volume increased by 6% YoY at 7.63 million MTs from 7.18 million MTs last year. The table below shows the comparative quarterly sales volume data for 2013 and 2012.
GRAND TOTAL 1,778 1,581 1,567 2,705 7,631 100% 1,672 2,056 1,245 2,211 7,184 100% 6%
COMPARATIVE SALES VOLUME DATA
(in '000 MTs)
CUSTOMER
Sales to SCPC increased by 43% YoY at 2.13 million MTs from 1.49 million MTs last year as a result of increased capacity and availability of both power units after rehabilitation. On the contrary, sales to other power plants dropped by 24% YoY at 790 thousand MTs from 1.04 million MTs last year. Drop in global coal prices encouraged some customers to import cheap coal from offshore market. Moreover, a customer has an outstanding shipping contract that it must utilize to transport coal from Indonesia. Sales to cement plants likewise dropped 7% YoY at 980 thousand MTs from 1.05 million MTs due to decrease in offtake by a few customers this year. Despite tapping two new customers this year, sales to other industries also dropped by 24% YoY at 328 thousand MTs from 430 thousand MTs. Some old customers decreased their offtake. Strong export sales in the last quarter drove export share to 45% of the total pie this year. Total export sales of 3.40 million MTs is 7% higher than last year's 3.17 million MTs. Mining operations are concentrated in the area where coal quality is better, commanding higher export prices. The 10% YoY decrease in composite average FOB price per MT at PHP2,185 from PHP2,454 last year reflected the drop in global coal prices. POWER Sales volume increased by 46% YoY at 3,460GWh from 2,365GWh in 2012. This is attributed to the higher energy generation of the newly rehabilitated power plants.
Of the total energy sold, 96% or 3,313 GWh were sold to bilateral contracts, while the remaining 4% were sold in the spot market.
Sales to bilateral contracts increased by 65% YoY at 3,313 GWh from 2,007 GWh in 2012. The improvement is due to increase of contract quantities for MERALCO from the initial 210 MW to 420 MW starting 31 January 2013, and the additional 30 MW non-firm contract capacity for TRANS-ASIA. The
26
non-firm additional contract capacity arrangement with Trans-Asia which is effective starting 16 February 2013, enables SCPC to sell its excess capacity at any given time.
MERALCO maintained to be the biggest customer of SCPC comprising 87% share of the total energy sales for SCPC’s bilateral contracts, followed by Trans-Asia and Batelec I at 7% and 5% shares, respectively.
Spot market sales volume is lower at 148GWh in 2013 against 358 GWh in 2012. However Spot Sales Revenue in pesos is higher by 30% in 2013 vs 2012 due to the increase in the spot market prices in Q4.
Of the total energy sold, 99% was sourced from own generation and only 1% was purchased from the spot market. SCPC procured power from the spot market during hour intervals where power units were down, or were running at a derated capacity, in order to supply committed capacity to some of its customers. Contracts with some of its customer still cover the supply of replacement power under a “pass-thru” cost arrangement.
SCPC bilateral contracts yielded lower prices at an average price of PHP3.79 per KWh in 2013 compared to the PHP3.97 per KWh in 2012. This is due to lower prices of pass-thru coal fuel being indexed to the lower Newcastle prices in 2013.
On the other hand, average spot sales increased by 215% YoY at PHP14.98 per KWh from PHP4.75 per KWh in 2012. High spot prices in November and December pulled up price per KWh.
The table below shows the comparative sales volume data in 2013 and 2012.
III. FINANCE
A. Sales and Profitability
Consolidated Revenues, net of eliminating entries, grew by 13% YoY at PHP27.33 billion as against PHP24.15 billion in 2012. Coal Revenues, before elimination, dropped by 5% YoY at PHP16.68 billion from PHP17.63 billion in 2012 due to lower coal prices this year. On the other hand, energy Revenues increased by 52% YoY at PHP14.76 billion from PHP9.7 billion last year as a result of the 46% increase in energy sales volume and 4% increase in average price per KWh. Consolidated Cost of Sales decreased by 4% YoY at PHP14.11 billion from PHP14.64 billion last year. Coal Cost of Sales before elimination declined by 5% YoY at PHP11.73 billion from PHP12.33 billion last year. Strip ratio normalized as at the end of the period from a historical high in Q1 as a result of the accident at the pit that temporarily halted coal extraction. Moreover, the Company implemented some cost-saving measures to counter the drop in coal prices, mining strategy only required shorter hauling
distance in North Panian while in-pit dumping allows the mine to decrease number of equipment while maintaining the same excavating capacity, thus 29 units of mining were put on stand-by. Net of elimination, Cost of Coal Sold also dropped by 12% YoY at PHP8.66 billion from PHP9.83 billion last year. Cost of Coal Sold per MT decreased by 10% YoY at PHP1,537 versus PHP1,716 last year. Power Cost of Sales before elimination increased by 17% YoY at PHP6.51 billion from PHP5.55 billion; and 18% after elimination at PHP4.42 billion from PHP3.75 billion last year. Increase in volume sold accounted for the increase in total cost. Notably, Cost of Sales per KWh decreased by 25% at PHP1.88 from PHP2.35 last year due to minimal spot purchases for replacement power and lower coal fuel average cost this year. The resulting consolidated Gross Profit in 2013 increased by 39% YoY at PHP13.22 billion with the coal and power segments each contributing PHP3.91 billion and PHP9.31 billion, respectively. Consolidated Gross Profit in 2012 stood at PHP9.51 billion, PHP4.63 billion from coal and PHP4.88 billion from power. Consolidated Gross profit margin improved at 48% from 39% last year. Consolidated Operating Expenses increased by 55% YoY at PHP5.26 billion from P3.40 billion in 2012. Net of eliminating entries, the coal segment’s Operating Expenses decreased by 17% YoY at PHP1.7 billion from last year’s PHP2.0 billion. Lower coal Revenues decreased Government Share by 16% at PHP1.30 billion from PHP1.56 billion last year. Meanwhile, the power segment's Operating Expenses after elimination increased by 155% YoY at PHP3.5 billion from PHP1.4 billion last year due to acceleration of depreciation on certain equipment/components of Unit 2 whose repair are in-progress during the 90-day scheduled maintenance shutdown of Unit 2 which commenced last week of December 2013. These are to be replaced with new ones. Hence, the the carrying value of the affected equipment/components amounting to Php1.2 billion as of December 31, 2013 was fully provided with depreciation to reflect its true value in the books. The pre-operating Southwest Luzon Power Generation Corp. (SLPGC), a wholly-owned subsidiary of the Company incorporated to expand its power capacity with the construction of 2 x 150 MW power plants, incurred PHP39.33 million pre-operating expenses, representing salaries and other administrative expenses incurred during the period. Other subsidiaries, Semirara Energy Utilities, Inc. (SEU), Semirara Claystone, Inc. (SCI) and Sem-Cal Industrial Park Developers, Inc (SCIPDI) also incurred Pre-operating Expenses of PHP100.5 thousand, PHP69.17 thousand PHP30.80 thousand for the period, respectively. Two new companies were incorporated during the period as vehicles for additional power expansion projects, they are San Rafael Power Generation Corp. (SRPGC) and Sem-Balayan Power Generation Corp. (SBPGC). Both companies incurred pre-operating expenses of PHP114.89 thousand and PHP194.62 thousand, respectively. Consolidated Income from Operations increased by 30% YoY at PHP7.96 billion from PHP6.11 billion in 2012. The coal and power segments contributed PHP2.19 billion and PHP5.80, respectively this year, as against PHP3.30 billion and PHP2.27 billion in 2012. The other pre-operating companies, SLPGC, SEU, SCI, SCIPDI, SRPGC, SBPGC incurred losses of PHP39.33 million, PHP100.50 thousand, PHP69.17 thousand, PHP30.80 thousand, PHP114.89 thousand and PHP194.62 thousand, respectively. As the USD strengthened against the PHP this year, the Company registered consolidated Forex Losses of PHP481.18 million as against Gains of PHP391.00 million last year. Since most of its loans are USD-denominated, bulk of the current period's Forex Losses is incurred by the coal segment which recorded PHP463.94 million losses versus last year's gains of PHP387.83 million. Of this amount, PHP305.93 million are unrealized losses. Meanwhile, with minimal Forex exposure, the power segment incurred Forex Losses of PHP15.49 million as against Gains of PHP3.17 million last year. SLPGC also recorded loss of PHP1.75 million on its foreign exchange transactions
Lower placement interest rates and lower free cash resulted to the decrease in consolidated Finance Income by 67% YoY at PHP26.80 million from PHP82.14 million last year. The coal segment’s investible
28
funds reduced after using most of its cash for equity of SLPGC and to pay off debts toward the end of 2012, thus its Finance Income decreased by 67% at PHP26.80 million from PHP82.14 million last year. The power segment’s Finance Income likewise decreased by 41% at PHP24.58 million from PHP41.53 million last year after using its cash to pay dividends of PHP2.5 billion during the the period. SLPGC recorded Finance Income of PHP217.06 thousand from short-term placements. Consolidated Finance Costs decreased by 24% YoY at PHP381.23 million from PHP501.28 million. The coal segment’s interest-bearing loans increased by 31% YoY, closing at PHP6.45 billion from PHP4.91 billion, increasing coal Finance Costs by 24% YoY at PHP152.63 million from PHP122.61 million. Meanwhile, the power segment's long-term loan balance dropped by 23% YoY to PHP5.34 billion from PHP6.91 billion last yearthus bringing down power Finance Cost by 41% YoY at PHP221.61 million from PHP376.37 million last year. SLPGC incurred Finance Cost of PHP6.99 million for its project financing. Consolidated Other Income dropped by 12% YoY at PHP281.21 million from PHP318.45 million. Bulk of last year's Other Income came from gain on sale of retired assets of the coal segment. Notably, the power segment's Other Income increased by 55% YoY at PHP203.18 million from PHP131.26 million last year. Power Unit 2 used more unwashed coal this year, producing more fly ash which is sold to a cement company at a higher price after renegotiating the supply contract on February 2012.
The resulting consolidated Net Income Before Tax (NIBT) increased by 16% YoY at PHP7.40 billion from PHP6.40 billion. SCPC accounted for 78% of the 2013's NIBT, at PHP5.79 billion after elimination. Meanwhile, net of eliminating entries, the coal segment generated NIBTof PHP1.66 billion, while the pre-operating SLPGC, SCI, and SEU, SCIPDI, SBGPC, and SRPGC incurred losses of PHP47.86 million, PHP64.45 thousand, PHP94.73 thousand, PHP32.26 thousand, PHP191.97 thousand, and PHP112.24 thousand, respectively. Before eliminations, power and coal recorded NIBT of PHP4.73 billion and PHP5.19 billion, respectively. Both operating business units enjoy Income Tax Holidays (ITH) as Board of Investments-registered companies. As a result, the Company accounted for consolidated benefit from deferred income taxes of PHP117.84 million, net of final income taxes and income taxes for unregistered activities of PHP5.01 million and PHP11.69 million respectively. Last year's provision totaled to PHP39.60 million. Consolidated Net Income After Tax (NIAT) increased by 18% YoY at PHP7.53 billion from PHP6.34 billion last year. Before eliminations, coal and power recorded NIAT of PHP5.34 billion, including PHP2.5 billion dividend income from power segment, and PHP4.71billion, respectively. Meanwhile, after eliminations, the coal and power segments generated NIAT of PHP 1.80 billion, and PHP5.78 billion, respectively. SCI and SCIPDI also recorded a minimal income of PHP45.90 thousand and PHP19.65 thousand, respectively. On the other hand, SLPGC, ,SEU, SBPGC, and SRPGC incurred start-up costs of PHP47.90 million, PHP63.64 thousand, PHP192.5 thousand, and PHP112.77 thousand, respectively. Earnings per Share (EPS) correspondingly increased by 18% YoY at PHP21.11 from PHP17.85 last year. POWER
An added growth area of the power segment is under DMCI Power Corporation, a wholly-owned subsidiary of the Parent Company. The company and its subsidiaries are focused on getting power supply contracts with the electric cooperatives situated in the off-grid areas.
As of December 31, 2013, the total installed rated capacity of the power generating units for Masbate and Palawan are 24.4MW (12.4 MW bunker-fired and 12 MW diesel) and 33.10 MW (diesel), respectively.
29
Power generation revenue from Masbate increased by 15% from P942 million in 2012 to P1.1 billion in 2013 while revenue from Palawan reached P371 million in 2013. Net income of Masbate went up by 160%, contributing P230 million in 2013 compared to P88.4 million in the same period of 2012 while Palawan contributed P23.6 million in net income for the full year 2013 compared to P0.80 million for only one month in 2012. Nickel
The nickel and metals (non-coal) mining business, reported under DMCI Mining Corporation, posted a net income of P169 million in 2013, compared to last year’s net income of P341 million. This was a combined effect of lower volume, ore grade and price compared to last year. Nickel ore shipments during 2013 substantially decreased to 316 thousand wet metric tons (WMT) from last year’s 1.6 million WMT. Average sales price this year is at USD20 per WMT compared to last year’s USD28 per WMT. Average nickel content of shipment this year is 1.65% compared to 1.71% last year. Amidst continued weak global nickel ore price, DMCI Mining’s margins have significantly declined, prompting the company to temporarily scale back the operations in the second half of 2013. Also, with the end of mining contract for Benguet in 2012 and the Acoje-ENK Mine having some transitory and permitting issues, DMCI Mining is looking at other opportunities for mine acquisition to enhance the segment’s future operations. Acquisitions
On February 15, 2013, DMCI Mining increased its stake to 37.7% in Toledo Mining Corporation PLC with the acquisition of an additional 20.7% for GBP 5.2 million. As a result, DMCI Mining launched a mandatory cash offer to acquire the entire issued and to be issued share capital of Toledo not already owned by DMCI Group. The offer comprised of 50 pence in cash for each Toledo share, valuing the whole of Toledo’s existing issued share capital at approximately GBP 24.9 million. As of December 31, 2013, DMCI Mining has a total of 98.09% interest in TMC.
On March 25, 2014, the Parent Company acquired from D&A Income Ltd. the remaining 40%
interest in ENK Plc for approximately P3.1 billion. Upon completion of the acquisition, ENK became a wholly owned subsidiary of the Parent Company.
As the Philippine Government is also looking to revamp and improve revenue generation and
policy implementation in the mining industry, the Company sees this uncertain environment as an opportunity to possibly acquire more mining assets for the Group.
Cost of sales and Services
In spite of an 8% increase in consolidated revenues, cost of sales and services decreased by 1% due
mainly to some cost-saving measures in the mining segments to counter the drop in coal and nickel ore
prices. Increase in volume or units sold accounted for the increase in power and real estate cost of sales.
The drop in construction costs of services outstripped the decline in construction revenue which is
attributable to the improvement of margins of building projects.
Operating Expenses Consolidated operating expenses increased by 44% primarily due to the corrective, preventive, and predictive maintenance program in Calaca Power, the acceleration of depreciation on certain equipment/components in Calaca Unit 2 and also the increase in commissions paid in the real estate segment. Gain on Sale of Investment This is the one-time gain (gross of tax) coming from the partial sale of the interest in Maynilad.
30
Equity in Net Earnings Equity in net earnings amounted to P1.8 billion in 2013, 22% lower than last year. The drop was mainly due to the partial sale of the Company’s interest in Maynilad. Finance Income Consolidated finance income decreased by 22% or P191 million mainly due to lower interest rates for short-term placements and more real estate customers availing of bank financing due to lower interest rates compared to in-house financing. Finance Costs Consolidated interest expense decreased by 22% or P269 million mainly due to lower borrowing rates and required capitalization of interest costs during construction period. Other Income - Net Consolidated other income decreased by 34% or P268 million mainly due to net foreign exchange loss recognized in 2013 amounting to P356 million compared to a net foreign exchange gain in 2012 amounting to P332 million. Provision for Income Tax Consolidated provision for income tax increased by 43% from P1.47 billion in 2012 to P2.10 billion in 2013 mainly caused by the tax on the partial sale of the interest in Maynilad and the increase in deferred provision for tax.
II. FINANCIAL CONDITION
December 31, 2013 – December 31, 2012 The Company’s financial condition for the period improved as consolidated total assets and total net assets amounted to P123.8 billion and P60.2 billion as of December 31, 2013, posting an increase of 28% and 23%, respectively. Consolidated cash increased by 155% from P9.7 billion in December 31, 2012 vs. P24.8 billion in December 31, 2013 due mainly to proceeds from the partial sale of interest in Maynilad. Moreover, cash generation from operations and loan drawdown also contributed to the increase in the year-end cash position. Total available-for-sale financial assets (current and non-current) went down by 31% due to unrealized losses for quoted equity investments during the year. Costs and estimated earnings in excess of billings on uncompleted contracts increased slightly by 7% mainly caused by construction contracts with cost and realized profits recognized in 2013 but contract billings will take place in future periods. Total receivables (current and non-current) went up by 21% due mainly to normal trade in the businesses mostly coming from recognized receivable from newly completed project from real estate segment. Consolidated inventories grew by 8% coming mainly from the land acquisitions and continuing work in progress in the real estate segment. Other current assets increased by 31% mainly due to payment for advances to suppliers and time deposits with maturity of more than three months.
31
Investments in associates and joint ventures went down by 17% primarily as a result of the Company’s partial sale of interest in Maynilad. Consolidated net Property, plant and equipment grew by 22% as a result of the ongoing power expansion in Calaca. Investment properties decreased by 2% mainly due to depreciation during the year. Deferred tax assets increased by 751% mainly due to recognition of timing difference for unrealized foreign exchange losses. Pension assets increased by 16% mainly as a result of higher reported fair value of plan assets which are primarily in debt and equity securities. Other noncurrent assets grew by 106% mainly due to the increase in deferred input vat and third-party deposits such as rental security deposit. Accounts & other payables increased by 12% mostly as a result of normal trade operations and accruals especially progress billings from subcontractors. Customers’ deposits increased by 47% due to payments received from real estate customers the revenue of which has yet to be realized. Billings in excess of costs and estimated earnings on uncompleted contracts increased by 10%. This was caused by construction contract billings in 2013 which preceded cost and profit recognition. Liabilities for purchased land increased by 20% mainly due to acquisition of certain land properties which are payable over a period of two to four years. Short-term debt increased by 100% due to availment by the coal segment of short-term working capital loans during the period. Income tax payable decreased by 17% from P89 million to P66 million due payments made during the year and application of creditable withholding tax. Payable to related parties decreased by 9% from P61 million to P34 million mainly caused by the settlement of transactions during the year. Long-term debt grew by 40% primarily due to drawdown of project financing facilities in the power segment and the receipt of additional tranches of corporate notes in the real estate segment. Deferred tax liabilities increased by 33% due to additional reconciling items particularly excess of book over tax income pertaining to construction contracts and real estate sales. Pension liabilities increased by 9% from P86 million to P94 million as a result of additional pension expense from actuarial valuation. Other noncurrent liabilities increased by 11% mainly due to the coal segment’s increase in mine rehabilitation contingency. Retained earnings grew by 29% primarily due to the consolidated net income share of DMCI shareholders. Non-controlling interest increased by 20% as a result of the non-controlling interests’ share in the consolidated net income of Semirara, net of its share in the dividends declared during the period.
32
III. KEY PERFORMANCE INDICATORS The Company and its Subsidiaries (the “Group”) has the following as its key performance indicators: a) Segment Revenues b) Segment Net Income (after non-controlling interests) c) Earnings Per Share d) Current Ratio e) Debt to Equity Ratio
SEGMENT REVENUES
(in Php Millions) Audited Variance
2013 2012 Amount %
COAL SALES P12,573 P14,450 (P1,877) -13%
NICKEL ORE SALES 265 1,923 (1,658) -86%
CONSTRUCTION 14,360 15,068 (708) -5%
REAL ESTATE 12,166 9,219 2,947 32%
POWER 16,607 11,080 5,527 50%
PARENT COMPANY - - - -
TOTAL P55,971 P51,740 P4,231 8%
The initial indicator of the Company’s gross business results are seen in the movements in the different business segment revenues. As illustrated above the significant main drivers for revenue growth are the power and real estate segments. Revenues from the mining businesses are down due to weak global prices and temporary scale down of nickel mining operations (see Part I. Results of Operations – different segments for a detailed discussion per business). -
SEGMENT NET INCOME AFTER NON-CONTROLLING INTERESTS
(in Php Millions) Audited Variance
2013 2012 (as restated) Amount %
COAL MINING P1,022 P1,740 (P718) -41% NICKEL MINING 169 341 (172) -50% CONSTRUCTION 1,275 1,275 - 0% REAL ESTATE 2,655 2,105 550 26% POWER 3,478 1,901 1,577 83% WATER 1,915 2,340 (425) -18% PARENT COMPANY 65 34 31 91%
CORE NET INCOME 10,579 9,736 843 9% ONE-TIME GAIN ON SALE (Parent) 8,358 - 8,358 -
TOTAL P18,937 P9,736 P9,201 95%
The net income (after non-controlling interests) or bottom line results from operations of the Company can be seen with the increment in net income for the period compared to the same period of the previous year for domestic-oriented businesses. For 2013, power and real estate posted strong growth in earnings
33
while coal and nickel mining reported steeped declines due to weak global commodity prices (see Part I. Results of Operations – different segments for a detailed discussion per business). EARNINGS PER SHARE The Company’s consolidated earnings per share (EPS) for the year was P7.13/share accounting for a 93% increase from the P3.67/share EPS last year. Same as segment net income, the power and real estate segments mainly contributed to the improvement in net earnings (see Part I. Results of Operations – different segments for a detailed discussion per business). CURRENT RATIO Liquidity is an essential character of any organization, and the Company, including the Group as a whole, should indicate acceptable levels of liquidity. The initial test of liquidity is the current ratio, which will display a company’s ability to satisfy current obligations with current resources. Current ratio is arrived by dividing the current assets over the current liabilities. The Company uses this test and compares it with industry balances to determine its ability to satisfy current obligations with respect to its competitors (see Part II. Financial Condition for a detailed discussion). DEBT TO EQUITY RATIO As a stockholder/investor, financial position and stability would be an important aspect. The Company tests its financial position through the debt to equity ratio. This test indicates the Company’s ownership of creditors vs. owners/investors. In addition, debt to equity ratio maintenance is a requirement set by creditors as a standard for extending credit. Debt to equity ratio is computed by dividing the total liabilities over total equity (see Part II. Financial Condition for a detailed discussion).
OTHER RELEVANT FINANCIAL SOUNDNESS RATIOS
Dec. 31 2013 Dec. 31 2012
Current Ratio 247% 180%
Debt to Equity Ratio 61% 52%
Interest Coverage Ratio 2,621% 1,636%*
1,165%
Return on Assets Ratio 20% 13%*
14%
Return on Equity Ratio 41% 26%*
28%
Asset to Equity Ratio 206% 199%
Gross Margin Ratio 39% 33%
Net Profit Margin Ratio 40% 25%*
24%
*excluding one-time gain from Maynilad partial sale
34
B. OTHER INFORMATION
1. The company’s operation is a continuous process. It is not dependent on any cycle or
season; 2. Economic and infrastructure developments in the country may affect construction
business; Interest rate movements may affect the performance of the real estate industry; Mining activities are generally hinge on the commodities market. Businesses not affected by known cycle, trends or uncertainties are power and water.
3. On April 11, 2013, the Parent Company has declared cash dividends amounting P1.20 regular dividends and P1.00 special cash dividends in favor of the stockholders of record as of April 26, 2013. This was paid on May 10, 2013 with the total amount of P5,842.09 million. On November 14, 2013, the Parent Company declared additional P1.20 special cash dividends to stockholders of record as of November 29, 2013. This was paid on December 13, 2013 with the total amount of P3,186.59. Total cash dividends declared during the year amounted to P3.4 per share or a total amount of P9,028.68.
4. There were no undisclosed material subsequent events and transferring of assets not in the normal course of business that have not been disclosed for the period that the company have knowledge of;
5. There are no material contingencies during the year; any event that may trigger direct or contingent financial obligation that is material to the company, including any default or acceleration of an obligation has been disclosed in the notes to financial statements.
6. There are no material off-balance sheet transactions, arrangements, obligations (including contingent obligations), and other relationships of the company with unconsolidated entities or other persons created during the reporting period
7. Except for interest payments on loans, which the Company can fully service, the only significant commitment that would have a material impact on liquidity are construction guarantees. These are usually required from contractors in case of any damage / destruction to a completed project.
8. Any known trends or any known demands, commitments, events or uncertainties that will result in or that will have a material impact on the registrant’s liquidity. - None
9. The Group does not have any offering of rights, granting of stock options and corresponding plans therefore.
C. MANAGEMENT'S DISCUSSION AND ANALYSIS OF PLAN OF OPERATION.
Full Year 2012 vs. 2011
J. RESULTS OF OPERATIONS
DMCI Holdings, Inc. (the “Company”) reported a net income after non-controlling interests of P9.8 billion for the year 2012, which is 2.0% higher than the P9.6 billion recorded during the previous year. Consolidated revenues reached P51.8 billion, which is 8.4% higher year-on-year, primarily driven by the growth in construction, real estate and power generation revenues. With the significant drop in the global price of nickel ore, the increase in cost of construction materials and labor, and the lower average coal price, net income showed a modest increase compared to revenue.
Below is a table on the net income contributions of the Company’s businesses for 2012 and 2011:
Due to the significant fall in commodity prices of nickel and coal, the mining segments posted declines in net income contributions. This was countered by robust performances of the real estate and power generation segments driven by a buoyant housing market and increased generation capacity coming from the newly rehabilitated power units. The construction segment also bounced back from 2011 with a 9% increase in 2012, resulting from higher recognized revenues from project completion and a healthy portfolio of projects. The equity in net earnings coming from the water business registered modest growth due to a 5.8% increase in water billed volume and an average year-on-year effective tariff increase of 9.2%.
WATER
The Company’s investment in the water sector is recognized through its 44.59% equity investment in DMCI-MPIC Water Company, Inc. (DMWC), the consortium company, with Metro Pacific Investments Corp. (MPIC), which owns 91.90% of Maynilad Water Services, Inc. (Maynilad). Maynilad handles the water distribution and sewer services for the western portion of Metro Manila and some areas of Cavite. For 2012, water investment contributions reached P2.3 billion, up by 3.1% from the previous year.
Maynilad operations reported better efficiencies for 2012 vs. 2011. For the year 2012, Maynilad grew its billed volume by 5.8% to 428.4 million cubic meters (MCM) versus the 404.7 MCM billed in the prior year. With billed volume continuing to grow despite an effective 2.3% reduction in supply, average NRW for the year improved to 43.5% from 47.8% in the prior year. Continued expansion into the southern areas of Muntinlupa, Las Piñas and Cavite brought connections up to a total of 1,073,508 billed services, a 6.8% growth from the end of the same period last year, but lower than the 11.3% growth registered in 2011 due to right-of-way and permitting issues in Cavite. Renewed efforts by the company to clean up non-performing accounts also contributed.
Combined revenues from water and sewer services for the year grew 15.6% to P15.4 billion from
P13.3 billion last year. The increase in revenues was due to the combined effect of the 5.8% increase in billed volume coupled with a 9.2% increase in average effective tariff. The effective rate increase for the year was dampened, not only by the deferred implementation of the higher rate until August, but also by the higher proportion of billed volume growth coming from domestic consumption whose rates are subsidized.
Meanwhile, total cash opex increased by 16.5% to P4.6 billion versus P4 billion last year. The
four largest cost elements accounting for almost 73% of total cash expenditures continue to be personnel cost, light and power, outside services, and repairs and maintenance. Total non-cash operating expenses increased by P271 million or 14.6% to P2.1 billion from P1.9 billion last year. Due to the company’s
36
continuing capital expenditure program, amortization of intangible assets increased 27.3% to P1.8 billion from P1.4 billion in the prior year.
As a result, net income, grew at a rate of 8.9% to P6.4 billion from P5.9 billion in the prior year.
The Company’s net share in the equitized earning from its water investment in Maynilad for the year reported only P2.3 billion due to the adjustments at the consortium company level.
As part of its strategic business expansion, Maynilad and Philippine Hydro Inc. (PhilHydro) signed the Share Purchase Agreement (SPA) on August 3, 2012 for the acquisition of 100% shares of PhilHydro by Maynilad. PhilHydro owns and operates three plants that supply treated bulk water to the Legazpi City Water District in Albay, Norzagaray Water District and Santa Maria Water District in Bulacan, and municipal waterworks of Bambang, Nueva Vizcaya. The company also owns and operates the treated water supply and distribution system of Rizal, Nueva Ecija.
On December 28, 2012, DMWC subscribed for 134,023 common shares of stock of Maynilad at a total subscription price of P134.0 million, subject to the terms and conditions of the subscription agreement. On January 31, 2013, the SEC approved Maynilad’s increase in authorized capital stock.
On December 28, 2012, MCNK JV Corporation (MCNK) subscribed for 169,617,682 common
shares of stock (the “Subscription Shares”) of the consortium company at a total subscription price of P169.6 million, subject to the terms and conditions of the subscription agreement. On January 29, 2013, the SEC approved DMWC’s increased in authorized capital stock.
MCNK is 90.0% owned by Marubeni Corporation, a company incorporated in Japan and 10%
owned by MAPL Holdings B.V., a company incorporated in Netherlands.
At the end of 2012, Maynilad determined that it is no longer appropriate to continue using the straight-line basis for amortizing concession assets given the large initial investments and that the economic benefit of these assets are more closely aligned with billed volume. Maynilad’s BOD approved the change in amortization method to units-of-production resulting in deferred tax asset write-off amounting to P592.0 million in 2012. CONSTRUCTION
The Group’s construction business posted better results as segment net income after non-controlling interests reached P1.2 billion this year compared to P1.1 billion last year, an increase of 9% year-on-year. Revenues significantly grew by 44% year-on-year to P14.8 billion this year compared to P10.3 billion last year. This was mainly due to billable works done for the building projects. Notable accomplishments are Solaire Resorts and Casino and The Raffles Suites and Residences which provided most of the boost in revenues. This however yielded relatively less margins, as building contracts generally have lower margins due to stiffer competition and higher materials and subcontracting costs compared with the specialized and complicated infrastructure projects. With the activity for the year coming mainly from the building contracts, construction gross and net profits showed only modest increases.
With the completion of the big building projects in 2012, DMCI’s orderbook (balance of work) as
of end-2012 amounted to P15.7 billion coming from a P22.2 billion end-2011 balance. The bulk of the balance of work is coming from the power plant construction contracts in Batangas, which comprise P5.5 billion from Semirara’s 2x150MW Calaca expansion and P3.2 billion from South Luzon Thermal Energy Corp’s 1x135MW. The orderbook however, does not include the MRT-7 railway project, which was already awarded to DMCI but still pending financial closing. Power plant-civil works projects in Calaca and Balayan, Batangas are expected to contribute in the continuing growth of construction revenue.
37
Although delayed, we believe the infrastructure development programs of the current Philippine government thru the Public-Private Partnership (PPP) projects will inevitably materialize. As such, the Company, thru DMCI, is very much interested in the construction and engineering of these initiatives. The Company believes it is well positioned to be both a driver and a beneficiary of the country’s infrastructure progress. REAL ESTATE
The Group’s real estate business is focused on residential development. It is led by the Company’s wholly owned subsidiary DMCI Project Developer’s Inc. The segment posted a 22% growth in net income on the back of a 12% increase in recognized revenues year-on-year, reaching P9.2 billion this year compared to P8.3 billion last year. It is worth to note that the company recognizes real estate revenues using the full accrual method, where sales are booked when the unit is fully complete and the downpayment of 15% has already been paid. Recently completed units in the Accolade Place, Maricielo Villas, Royal Palm-Rawai, Sienna Park, and Tivoli Gardens-Iris projects significantly accounted for the growth in realized revenues. Revenue growth outpaced the increase in expenses, resulting in net margin improvements brought about by continued cost containment effects. With corporate costs remaining under control, the ratio of general and administrative expenses, inclusive of brokers’ commissions, to revenues was lowered at 19% compared to 20% last year.
Amidst the presence of aggressive competition within its market, sales and reservations take up
for the year was sustained at P17.1 billion, equivalent to an average monthly take up of P1.4 billion, same in 2011. This is a testament to the strong niche the company has developed within its class as it continued to post brisk sales despite being purely concentrated on a specific market.
With the current increase of VAT-free housing price threshold to around P3.2 million, the Company has leveraged on the tax advantage to become more price competitive in the market. Notably, most of the Company’s housing units have a selling price of around P3 million per unit.
In October 2012, the Company recently signed a facility agreement with a group of primary
institutional lenders for DMCI PDI’s issuance of Php 10.0 billion in 7-year Fixed Rate Corporate Notes (Notes). The proceeds from the Notes issue shall be used to finance project development and construction costs, acquire real estate properties, and fund other general corporate purposes. COAL MINING & POWER Coal Mining & Power (Calaca-Coal)
The Company’s coal mining business which owns a major power asset in Calaca are both lodged under the 56.32%-owned and publicly listed Semirara Mining Corp (SMC). SMC reported a decline in net income of P3.1 billion compared to P4.1 billion last year. Mainly due to lower average coal prices despite a 10% increase in coal sales volume. This was countered by a surge in the net income coming from power generation of P3.3 billion compared to P1.9 billion in the previous year due to higher energy generation capacity from the newly rehabilitated Calaca power plants.
Below is an excerpt from SMC’s management discussion and analysis of results of operations
and financial condition for the year 2012 as lifted from its consolidated financial report with the PSE and SEC:
38
A. MANAGEMENT’S DISCUSSION AND ANALYSIS OF FINANCIAL CONDITION AND RESULTS OF OPERATIONS (YEARS 2011-2012) Full years 2011-2012 I. PRODUCTION AND OPERATIONS COAL Total materials moved in 2012 decreased by 9% at 77,072,255 from 85,060,883 bank cubic meters (bcm) last year due to longer hauling cycle and lower operating days. During the year, mining operations were concentrated at the lowest level of the pit, thus resulting to longer hauling cycle. Meanwhile, total rainfall this year of 2,771 mm is 2% lower than last year. The advance stripping activities in the previous periods benefit the current period’s mining operations as activities in 2012 were more focused on coal production rather than overburden stripping. As a result, strip ratio dropped by 15% at 8.66:1 from 10.13:1 last year. This explains the 5% increase in run-of-mine (ROM) coal production at 8,235,875 metric tons (MTs) from 7,840,467 MTs last year, despite the decrease in material movement. Coal recovery improved with the sale of unwashed coal to subsidiary Sem-Calaca Power Generation Corporation (power segment) for the use of its Unit 2. Hence, net total product coal increased by 8% at 7,656,849 MTs from 7,118,460 MTs last year. Ending inventory increased by 39% at 1,382,607 MTs from beginning inventory of 991,887 MTs also as a result of higher coal recovery. The table below shows the quarterly comparative production data for 2012 and 2011.
POWER UNIT 1 When Calaca Power Plant assets were acquired in December 2009, Unit 1 can only generate 160 MW or 53% of its rated capacity using pure Semirara Coal. The rehabilitation of the unit was centered on improving the loading capacity to at least 220 MW or 73% of its rated capacity. The rehabilitation of the plant started in August 2011 and completed in July 2012. It took more than a year of planning to cover all major repair works. The rehab project suffered delays in the commissioning stage to ensure the safe and reliable operation of the plant. The original equipment manufacturers
39
(OEMs), Foster Wheeler for the boiler and Toshiba for the Turbine/Generator, supervised the repair to commissioning of the Unit. Although delayed, the unit can now load 235 MW or 77% of its rated capacity, an improvement of 24% or 75 MW on pure Semirara Coal. Generation capacity is low at 20% in the five months of running against 27% last year but the average load is significantly higher at 197 MW against 155 MW. In general, the unit is now better in terms of generation capacity and efficiency. Unit availability was only 2,697 hours or 31% compared to 54% last year since Unit 1 was down for about 7 months during the current period due to the rehabilitation works. Total energy generated was 531 Gwh or 27% down compared to last year. UNIT 2 Unit 2 is on its second year of operation after its rehabilitation in the last quarter of 2010. The unit performed better this year in all aspects of operation compared to last year. Gross generation has increased by 71% or 1,932 Gwh. Unit availability improved from 60% to 88% and force outage was limited to only 12% from 36% last year. Running hours in 2012 is remarkably higher at 7,761 hours than 2011 48% increase. Loading capacity is limited to 260 MW due to some leaks on two of its high pressure heaters 7 & 8. The average load capacity during the current period is at 249 MW or 20% more than last year. The table below shows the quarterly comparative plant performance for 2012 and 2011.
II. MARKET COAL Total coal sold in 2012 increased by 10% at 7.18 million MTs compared to 6.52 million MTs in 2011. Q1 2012 sales of 1.67 million MTs was 2% higher than 1.64 million MTs sold in Q1 2011, however, Q2 2012 sales volume of 2.06 million MTs was 18% lower as against 2.52 million MTs in Q2 2011, while Q3 sales continued to drop by 15% at 1.25 million MTs this year from 1.46 million MTs in 2011. Q4 sales recovered with an increase of 145% at 2.21 million MTs from 902 thousand MTs last year. The table below shows the quarterly comparative coal sales volume data for 2012 and 2011.
GRAND TOTAL 1,672 2,056 1,245 2,211 7,184 100% 1,641 2,516 1,460 902 6,519 100% 10%
COMPARATIVE SALES VOLUME DATA
(in '000 MTs)
CUSTOMER
Sale to power plants decreased by 14% this year at 2.53 million MTs from 2.96 million MTs last year. Although Q1 and Q2 off-take of the power segment were lower this year as compared to last year as rehabilitation of Unit 1 was completed only in Q3, coal off-take increased in the second half. As a result, the power segment’s total coal purchases increased by 6% at 1.49 million MTs this year from 1.41 million MTs last year. Meanwhile deliveries to other power plants dropped in the second half, resulting to a 33% drop YoY at 1.04 million MTs this year from 1.55 million MTs in 2011. On the other hand, with three new customers this year, sales to cement plants increased by 59% at 1.05 million MTs from 660 thousand MTs last year. The 9% drop in sales to other local customers was mainly caused by weaker purchases by some small traders in Q1 and Q4 this year. Deliveries to other industrial plants totaled to 430 thousand MTs from 475 thousand MTs in 2011. The increase in sales to cement plants helped offset the decrease in deliveries to power plants and other industrial customers, thus softening the drop in total local sales at 2% to 4.01 million MTs this year from 4.09 million MTs in 2011. On the other hand, export sales rebounded in Q4, bringing total exports to 3.17 million MTs this year or a 31% growth from last year's 2.43 million MTs. All supply contracts with the Corporation are already priced at market. As a result, the drop in global coal prices brought down composite average FOB price per MT this year to PHP2,453, a 20% decrease from last year's PHP3,078. POWER The power segment's 2012 recorded sales for bilateral contracts increased to 2,007 GWH from 1,553GWh in 2011 or 29% improvement. This mainly came from the contract with MERALCO which was effective since 26 December 2011. MERALCO is still the single biggest customer of the power segment in 2012, accounting for 80% share of the total energy sales to bilateral contracts. BATELEC I and Trans-Asia accounted for 12% and 6% market share, respectively, the balance is for other small contracts. Meanwhile, spot market sales dropped by 26% from 472 GWh in 2011 to 348 GWh in 2012. The decrease in spot sales was due to the increase in contracted power which effectively reduced the excess capacity for sale in the spot market. Total energy sold in 2012 posted at 2,355 GWh 85% directly to the customers through bilateral contracts, and 15% to the spot market. Total energy sales increased by 16% from 2,025 GWh recorded in 2011.
41
Of the total energy sold, 99% was sourced from the generation of the power plants, while 1% was purchased from the spot market. Spot market prices in 2012 were more volatile compared to 2011. This is due to the abrupt forced outages and scheduled maintenance of major power plants which decreased the supply in the months of May to July 2012. Also, It was observed that the demand increased by an average of 4% in 2012. These two factors caused the increase of spot prices in the market. In the last quarter of 2012, spot prices escalated due to the planned outages of Ilijan Block A (600 MW) and Sta. Rita Mod 30 (256 MW) amidst the increased demand as business activities stepped up until Christmas Eve. This situation in the market provided Unit 1 an opportunity to generate more Revenues as power generated during the plant's testing were sold to the spot market. The table below shows the quarterly comparative sales volume data and composite average price for 2012 and 2011.
III. FINANCE A. Sales and Profitability Consolidated Revenues, net of eliminating entries, dropped by 6% YoY at PHP24.15 billion from PHP24.81 billion last year. Although coal sales volume increased, lower composite average price/MT pulled down coal Revenues before elimination to PHP17.63 billion this year from PHP20.06 billion last year. Net of eliminations, Coal Revenues dropped by 11% YoY at PHP14.45 billion from PHP16.20 billion last year. On the other hand, higher energy generation offset the decrease in average price per kwhr caused by the decrease in international coal price index. As a result, energy sales slightly improved by 1% at PHP9.70 billion from PHP9.61 billion last year. Consolidated Cost of Sales decreased by 12% at PHP14.64 billion from PHP16.66 billion last year. Before elimination, Cost of Coal Sold dropped by 12% at PHP12.33 billion from PHP14.01 billion last year due to lower cost/MT sold. Net of elimination, Cost of Coal Sold likewise dropped by 12% YoY at PHP9.82 billion from PHP11.10 billion. Cost of Coal Sold per MT dropped by 24% compared to last year due mainly to higher units of production and tightening control on some mine overhead costs. This partially offsets the decline in Revenues due to lower average coal prices. In the same note, power Cost of Energy Sales before elimination reduced by 14% at PHP5.55 billion from PHP6.40 billion last year. Minimal spot purchases for replacement power and lower coal fuel average cost this year accounted for the decrease in cost. The resulting consolidated Gross Profit increased by 4% at PHP9.51 billion, with the coal power segments each contributing PHP4.63 and PHP4.88 billion, respectively. Last year's consolidated Gross Profit stood at PHP9.15 billion last year, PHP5.10 billion from coal and PHP3.05 billion from power. Consolidated Gross profit margin improved to 39% from 35% last year. Consolidated Operating Expenses increased by 19% at PHP3.39 billion from PHP2.86 billion last year. Net of eliminating entries, the coal segment’s Operating Expenses increased by 9% at PHP2.0 billion from last year’s PHP1.84 billion as lower Cost of Sales increased Government Share by 5% at PHP1.56 billion from PHP1.48 billion last year. The power segment's Operating Expenses after elimination also
went up by 35% at PHP1.38 billion from PHP1.02 billion last year due to write-down of net book value of replaced major components and parts relative to the rehabilitation of Unit 1 amounting to PHP341 million. The pre-operating Southwest Luzon Power Generation Corp. (SLPGC), a wholly-owned subsidiary of the Corporation incorporated to expand its power capacity with the construction of 2 x 150 MW power plants, incurred PHP21.55 million pre-operating expenses, representing taxes, licenses and fees incurred during the year. Another subsidiary, Sem-Cal Industrial Park Developers, Inc. (SIPDI) and Semirara Claystone Inc. also incurred Pre-operating Expenses of PHP37 thousand and PHP65 thousand during the period, respectively. Consolidated Forex Gains posted a remarkable PHP391 million as against losses of PHP38.32 million last year. The PHP continued to strengthen against the USD during the year. Since most of its loans are USD-denominated, bulk of this year's Forex Gains is attributed to the coal segment which recognized PHP387.83 million versus last year's Loss of PHP26.01 million. Meanwhile, with minimal Forex exposure, the power segment’s Forex Gains registered at PHP3.17 million as against Losses of PHP12.31 million last year. Lower cash and lower placement interest rates resulted to the decrease in consolidated Finance Income by 39% at PHP82.15 million from PHP134.88 million last year. The coal segment’s investible funds reduced after its additional equity infusion of PHP2.5 billion to SLPGC, thus its Finance Income decreased by 83% at PHP13.12 million from PHP79.45 million last year. On the other hand, the power segment’s Finance Income increased by 24% at PHP68.95 million from PHP55.43 million due to higher short-term placement income from SLPGC in the first half of 2012 with its higher cash level, coming from the proceeds of the initial drawdown from the project loan facility and equity infusion by the parent, parked in short-term placements. Consolidated Finance Costs slightly increased by 4% at PHP501.28 million from PHP483.29 million last year. The coal segment’s interest-bearing loans increased by 6% at PHP4.91 billion from PHP4.62 billion last year. Although interest rates are lower this year, Finance Costs increased by 17% at PHP122.61 million from PHP104.93 million last year as it only started paying off short-term debts toward the end of the year. Meanwhile, the power segment's total ending interest-bearing loans balance dropped to PHP7.35 billion from PHP8.84 billion last year. Of this amount, P550 million reflects the new availment by SLPGC. With the availment of short-term working capital loans during the year, the power segment's Finance Costs slightly increased at PHP378.67 million from PHP378.36 million last year.
Consolidated Other Income increased by 219% at PHP318.45 million from PHP99.91 million generated by the coal segment last year from gain on sale of retired assets. After eliminating the PHP 1.5 billion Dividend Income from the power segment, the coal segment’s Other Income this year, increased by 78% at PHP187.63 million from PHP99.91 million last year, included gain on sale of retired assets, sale of electricity and insurance claims. Meanwhile, the power segment’s Other Income of PHP131.26 million this year is mainly composed of sale of fly ash. The resulting consolidated Income Before Tax stood at PHP6.40 billion, with the coal and power segments contributing PHP3.10 billion and PHP3.30 billion, respectively; meanwhile SLPGC registered a loss of 3.56 million. This year’s consolidated Income Before Tax posted a 6% growth over last year’s PHP6.01 billion. Both operating business units enjoy Income Tax Holidays (ITH) as Board of Investments (BOI)-registered companies. Moreover, on 20 September 2012, the coal segment received the approval of its BOI registration for Bobog Mine, another mine site to be developed next to the current active Panian mine. The ITH benefit will start upon commercial operation of the new mine. SLPGC’s application for BOI registration was also approved during the year. With these tax holidays, consolidated Provision for Income Tax remained minimal at PHP39.45 million this year. In 2011, consolidated Benefit from Income
43
Tax posted at PHP22.17 million. The coal and power segments’ tax provision this year stood at PHP1.3 million and PHP28.0 million, respectively. The resulting consolidated Net Income After Tax posted a 5% growth at PHP6.36 billion from PHP6.031 billion last year. Coal and power segments respectively generated PHP3.10 billion and PHP3.28 billion this year, while SLPGC recorded a net loss of PHP8.0 million. Earnings per Share (EPS) correspondingly increased by 5% at PHP17.85 from PHP16.93 last year.
POWER
Another growth area of the power segment is under DMCI Power Corporation, a wholly-owned subsidiary. The Company and its subsidiaries are focused on getting power supply contracts with the National Power Corporation-Small Power Utilities Group. It has power generating units in the provinces of Masbate (24.4 MW diesel power plant) and Palawan (5 x 1.25MW diesel power plant). Masbate started power generation in late 2010 while Palawan just started in December 2012. With a surge in off take demand within a few years of operations brought about by increase in number of connections and development in these areas, the Company is now expanding its current generation capacity. An addition of 21MW diesel generator sets in Palawan by 2013. Moving forward, this segment is looking to replicate this success in other islands and provinces across the country. These developments, anchored on DMCI’s engineering expertise, prove to be a testament to its pursuit of growth opportunities. In 2012, generated power sales amounted at P947 million, 17% higher compared to P809 million in 2011. Nickel
DMCI Mining, Corp., the Company’s nickel and metals (non-coal) mining company, continued to mine and sell nickel ore (1.5% and up nickel content) from existing stockpile in Benguet and Acoje mines in Zambales.
Against a weak global nickel ore price caused DMCI Mining’s margins to decline. This resulted to net income of P341 million, which was 63% lower than previous year’s net income of P917 million. Nickel ore shipments for the year decreased by 7% to 1.6 million wet metric tons (WMT) from last year’s 1.7 million WMT. The year-on-year ore shipments from Benguet mines were reported at 836 thousand WMT in 2012 compared to 1,519 thousand WMT in 2011. While the Acoje mine year-on-year shipments stands at 745 thousand WMT in 2012 compared to 181 thousand WMT in 2011. Shipments from the Benguet and Acoje mine are from stockpiles previously mined. Nickel grade shipments were more on the low grade ore causing much of the drop in nickel prices which affected revenues, dropping 22% from last year’s P2.45 billion to this year’s P1.92 billion. With the end of mining contract for Benguet in 2012 and the Acoje-ENK Mine having some transitory and permitting issues, DMCI Mining is looking at other opportunities for mine acquisition to enhance the segment’s operations. Acquisitions
Following the Group’s earlier pronouncement to expand its nickel mining operations, in November 2012 the Parent Company has acquired 60% of the outstanding shares of ENK PLC for P2.1 billion. ENK has major beneficial ownership in the Acoje mine previously being operated by DMCI Mining. However, although the Parent Company acquired 60% of ENK Plc shares, this does not translate to control but to an economic interest. Consequently, as the Parent Company is able to exercise significant influence, it should be accounted as an investment in an associate.
On October 22, 2012, the Company signed a memorandum of understanding (MOU) to purchase
from Toledo Mining Corporation PLC (TMC) a 31% stake in Nickeline Resources Holdings, Inc. (NRHI). Under the terms of the MOU, the Company will pay nearly US$6.5 million in cash for the interest in NRHI.
44
Also, in October 2012, DMCI Mining acquired a 17% stake of Daintree Resources Limited in TMC for GBP 3.4 million. On February 15, 2013, DMCI Mining increased its stake to 37.7% with the acquisition of an additional 20.7% for GBP 5.2 million. As a result, DMCI Mining launched a mandatory cash offer to acquire the entire issued and to be issued share capital of Toledo not already owned by DMCI Group. The offer will comprise 50 pence in cash for each Toledo share, valuing the whole of Toledo’s existing issued share capital at approximately GBP 24.9 million.
As the Philippine Government is also looking to revamp and improve revenue generation and policy implementation in the mining industry, the Company sees opportunities to possibly acquire more mining assets for the Group. Cost of sales and Services Mixed pointers for consolidated cost of sales and services, as construction and real estate costs grew while mining and power cost of sales dropped. Overall, consolidated amount increased by 10% mainly due to higher cost of construction materials and labor. Operating Expenses Consolidated operating expenses increased by 13% as lower cost of sales increased government royalties at the coal business and the growth in activity and operations of the power business. Equity in Net Earnings Equity in net earnings reached P2.3 billion in 2012, 6% higher than last year. The rise was mainly due to higher equity income from the unconsolidated water investment which improved its operations from last year. Finance Income and Finance Costs Consolidated net interest expense was higher by P185 million due mainly to new loan availments from the power business to finance expansion, lower interest income from real estate receivables and lower cash balance resulting to a decrease in interest earned from short-term placements. Other Income Consolidated other income reached P786 million, 182% higher than last year. The increase was mainly due to higher rental income and foreign exchange gain. It was tempered by the cost of write-down of property, plant and equipment due to the replacements of generation units amounting to P341 million. Provision for Income Tax 10% increase from P1.3 billion to P1.5 billion mainly caused by higher taxable income of the real estate business.
II. FINANCIAL CONDITION
December 31, 2012 – December 31, 2011
The Company’s financial condition for the period improved as consolidated total assets and total
net assets amounted to P95.25 billion and P47.99 billion as of December 31, 2012, posting an increase of 13.5% and 18.6%, respectively.
Consolidated cash decreased by 35% from P15.1 billion in December 31, 2011 vs. P9.7 billion in
December 31, 2012 due mainly to investment acquisitions and capital expenditures. Moreover, the Parent Company and its subsidiary Semirara paid higher cash dividends in 2012.
Total available-for-sale financial assets (current and non-current) went down by 61% from P224
million to P88 million due to disposal of unquoted equity investments.
45
Costs and estimated earnings in excess of billings on uncompleted contracts decreased by 73% from P452 million to P123 million mainly caused by pertinent construction contracts with more billings in 2012 but cost incurred and realized profits were largely recognized in the past years.
Total receivables (current and non-current) went up by 51% due mainly to normal trade in the
businesses mostly coming from the milestone billings from the construction segment and recognized receivable from newly completed project from real estate segment.
Consolidated inventories grew by 23% coming mainly from the continuing work in progress at the
real estate segment. Other current assets increased by 20% mainly due to payment for advances to suppliers, brokers,
contractors and mine rights owners. Investments were up 32% as a result of the Company’s share in net operations of the water
business and new equity investments of the group particularly ENK Plc.
Property plant & equipment grew 10% as a result of the rehabilitation costs incurred in the Calaca power units.
Investment properties increased by 94% from P142 million to P276 million mainly due to
additional land and improvements held for lease and capital appreciation. Other noncurrent assets grew by 37% mainly due to third-party deposits e.g. rental deposit, and
increased in deferred input vat.
Accounts & other payables increased by 3% mostly as a result of normal trade operations and accruals especially progress billings from subcontractors.
Customers’ deposits increased by 45% with the payments received from real estate customers
the revenue of which has yet to be realized. Billings in excess of costs and estimated earnings on uncompleted contracts decreased by 53% from P751 million to P355 million largely caused by pertinent construction contracts with more billings in the past years but cost incurred and realized profits recognized mainly in 2012. Liabilities for purchased land increased by 23% mainly due to acquisition of certain land properties which are payable over a period of three to four years.
Short-term debt decreased by 58% due to lower acceptances and trust receipts payable which are used by the Group to facilitate payment for importations of materials, fixed assets and other assets. Income tax payable decreased by 35% from P138 million to P89 million due to higher income tax payments during 2012.
Payable to related parties decreased by 80% from P301 million to P61 million mainly caused by the settlement of advances from the water consortium.
Long-term debt grew by 15% due to receivable discounting and receipt of the first tranche of the corporate note issuance at the real estate segment. Offset by regular debt payments being made mostly at the real estate, coal and power sectors.
Deferred tax liabilities decreased by 19% due to realization of reconciling items particularly
excess of book over tax income pertaining to construction contracts and real estate sales.
46
Pension liabilities increased by 13% from P180 million to P204 million as a result of actuarial valuation particularly the movement in unrecognized net actuarial gain.
Other noncurrent liabilities decreased by 12% due to payment of subscription payable to DMWC.
Retained earnings grew by 26% primarily due to the increase in net income. Non-controlling interest increased by 13% as a result of the non-controlling interests’ share in the consolidated net income of Semirara, net of its share in the dividends declared during the period. III. KEY PERFORMANCE INDICATORS The Company and its Subsidiaries (the “Group”) has the following as its key performance indicators: f) Segment Revenues g) Segment Net Income (after non-controlling interests) h) Earnings Per Share i) Current Ratio j) Debt to Equity Ratio
SEGMENT REVENUES
(in Php Millions) Audited Variance
2012 2011 Amount %
COAL SALES P14,450 P16,231 (P1,781) -11%
NICKEL ORE SALES 1,923 2,452 (529) -22%
CONSTRUCTION 14,773 10,277 4,496 44%
REAL ESTATE 9,219 8,251 968 12%
ELECTRICITY 11,080 10,421 659 6%
PARENT & OTHERS 294 171 123 72%
TOTAL 51,739 47,803 3,936 8%
The initial indicator of the Company’s gross business results are seen in the movements in the different business segment revenues. As illustrated above the significant main drivers for revenue growth are the power, real estate and construction businesses (see Part I. Results of Operations – different segments for a detailed discussion per business).
47
SEGMENT NET INCOME NET INCOME AFTER NON-CONTROLLING INTERESTS
(in Php Millions) Audited Variance
2012 2011 Amount %
COAL SALES P1,739 P2,379 (P640) -27%
NICKEL ORE SALES 341 917 (576) -63%
CONSTRUCTION 1,220 1,117 103 9%
REAL ESTATE 2,182 1,795 387 22%
ELECTRICITY 1,902 1,177 725 62%
WATER 2,264 2,195 69 3%
PARENT & OTHERS 144 15 129 860%
TOTAL 9,792 9,595 197 2%
The net income (after minority) or bottom line results from operations of the Company can be seen with the increment in net income for the period compared to the same period of the previous year/s for the different business segments. Except for the mining segments, the current period posted strong growth in earnings from the power, real estate and construction businesses, while the water segment provided modest improvement (see Part I. Results of Operations – different segments for a detailed discussion per business). EARNINGS PER SHARE The Company’s consolidated earnings per share (EPS) for the year was P3.69/share accounting for a 2% increase from the P3.61/share EPS last year. Same as segment net income, all the businesses except the mining segments contributed to the improvement in earnings (see Part I. Results of Operations – different segments for a detailed discussion per business). CURRENT RATIO Liquidity is an essential character of any organization, and the Company, including the Group as a whole, should indicate acceptable levels of liquidity. The initial test of liquidity is the current ratio, which will display a company’s ability to satisfy current obligations with current resources. Current ratio is arrived by dividing the current assets over the current liabilities. The Company uses this test and compares it with industry balances to determine its ability to satisfy current obligations with respect to its competitors (see Part II. Financial Condition for a detailed discussion). DEBT TO EQUITY RATIO As a stockholder/investor, financial position and stability would be an important aspect. The Company tests its financial position through the debt to equity ratio. This test indicates the Company’s ownership of creditors vs. owners/investors. In addition, debt to equity ratio maintenance is a requirement set by creditors as a standard for extending credit. Debt to equity ratio is computed by dividing the total liabilities over total equity (see Part II. Financial Condition for a detailed discussion).
48
OTHER RELEVANT FINANCIAL SOUNDNESS RATIOS
Dec. 31
2012 Dec. 31
2011
Current Ratio 183% 204%
Debt to Equity Ratio 52% 53%
Interest Coverage Ratio 1,303% 1,234%
Return on Assets Ratio 13% 15%
Return on Equity Ratio 26% 30%
Asset to Equity Ratio 198% 208%
Gross Margin Ratio 33% 34%
Net Profit Margin Ratio 24% 26%
Full Year 2011 vs. 2010 I. RESULTS OF OPERATIONS DMCI Holdings, Inc. (the “Company”) reported an improvement of 22% in its net income (after minority) from P7.9 billion in 2010 to P9.6 billion in 2011. Despite a slide in general construction and the non-inclusion of operating results from the steel fabrication business, significant growth in the coal, nickel and power segments along with the sustained improvement in the real estate and water businesses caused the growth in consolidated bottom line.
Below is a table on the net income contributions of the Company’s businesses for 2011 and 2010: NET INCOME AFTER NON-CONTROLLING INTERESTS
For the year, mining was the main driver of the P1.7 billion increase in the Company’s income due to higher coal prices and the improved operations in the nickel business. The real estate and power generation segments also posted significant growth due to healthier housing sales and increased generation capacity coming from the rehabilitated Calaca unit 2. Investments in the water business,
49
accounting for 23% of total net income, registered modest improvements, testament of the sustained and consistent operations evident in the utilities sector.
Braced
This year also marks the non-inclusion of Atlantic Gulf & Pacific Company of Manila, Inc., the Company’s previously owned steel fabrication business which was sold in December 2010 and contributed almost 9% of last year’s net income. WATER
The Company’s investment in the water sector is recognized mainly through its equity investment in the consortium company with Metro Pacific Investments Corp. (MPIC) which owns Maynilad Water Services, Inc. (Maynilad). Maynilad handles the water distribution and sewer services for the western portion of Metro Manila and some areas of Cavite. For 2011, water investment contributions reached P2.2 billion, up by a respective 16% from the previous year.
Maynilad operations reported better efficiencies for 2011 vs. 2010. Billed volume increased by 8.3% or 30.91 million cubic meters (MCM) despite a 3.5%, or 27.8 MCM, reduction in supply causing non-revenue water (NRW) improvement to 47.83% from 53.48%. Average effective tariff also increased by 5.7% coming from inflationary and rebasing adjustments but was lower than the approved 7.6% should be increase in tariff for 2011. As a result Maynilad’s water service revenues grew by 12.6% from P9.9 billion to P11.2 billion. Billed services further grew by 11% to a record 1,005,350 accounts, breaching the 1 million mark. This, however, didn’t contribute proportionally to the increase in revenues as the growth in accounts was mainly from the domestic or residential customers whose rates are subsidized. Meanwhile, cash Opex showed a 10.4% jump due mainly to the following: (a) higher personnel costs from a redundancy program and manpower build up, (b) utilities, and (c) real estate and business taxes. As a result, Maynilad bottom figure reached P5.9 billion in 2011, growing by 22% from the P4.8 billion in 2010.
The Company’s net share in the equitized earning from its water investment in Maynilad for the
year reported only P2.2 billion due to the adjustments at the consortium company level. The consortium’s ownership in Maynilad was also reduced from 94% in 2010 to 92% in 2011 as Maynilad employees exercised their 2% ESOP late in 2010 which were carved out of the consortium’s shareholdings. CONSTRUCTION
The construction business experienced a marginal decrease from its unprecedented growth last year due to the following: (a) completion of big infrastructure projects with no new infra projects awarded, and (b) last year’s income includes recognition of change orders from the Shangrila Boracay project where the costs were conservatively booked in the previous years.
Construction revenues from the Skyway Extension project were reduced in 2011 compared to
2010 as the project reached full completion early in the year. The continuing activity from the 168 Residences, the delayed but now fully resumed Raffles Hotel works provided much of the revenues for the period, and the activity from the recently awarded Entertainment City Complex of Surestre Properties in JV with Bloomberry Resorts and Hotels contributed significantly to 2011 construction revenues. This however was not too good for the construction bottom line as building contracts have relatively less margins than the specialized and complicated big infrastructure projects such as the Skyway Extension project. With the activity for the year coming mainly from the building contracts, construction gross margin and net income slightly declined.
Although delayed, we believe the infrastructure development programs of the current Philippine government thru the Public-Private Partnership (PPP) projects will inevitably materialize. As such, the Company, thru DMCI, is very much interested in the construction and engineering of these initiatives.
50
The Company believes it is well positioned to be both a driver and a beneficiary of the country’s infrastructure progress.
In addition, DMCI was recently awarded the construction of the 135 MW Coal Fired Plant of South Luzon Thermal Energy Corp., a JV between Trans Asia Oil and the Ayala Group and the civil works for the expansion of the Group’s Calaca power units. Hopefully, these additional power-infrastructure contracts along with others being eyed by DMCI will generate the much needed lift in construction revenues with better margins. REAL ESTATE
The Company’s real estate business is focused purely on residential development. It is led by the Company’s wholly owned real estate development subsidiary, DMCI Project Developers, Inc. (PDI). Under the brand name DMCI Homes, PDI currently develops and sells middle income housing units that define best in quality & value for money dwellings in its market segment.
The Company recognizes real estate revenues using the full accrual method where sales are
booked when the unit is fully complete and the down payment of 20% is already collected. This method is already in accordance with International Accounting Standards. There was a plan to adopt this in the country in 2008 but was subsequently suspended by the SEC after majority of the real estate companies lobbied against it due to the retroactive adjustments that will be incurred upon adoption. Despite this, the full accrual method has been and is still used by the Company as we believe the adoption is inevitable if the country wants to be at par with global real estate accounting practices.
The housing segment recognized an impressive 40% increase in net contributions from P1.3
billion last year to P1.8 billion this year. Realized housing sales for the year grew by 25% to P8.2 billion with the completion of existing projects: East Raya, Magnolia Place, Mahogany Place 3, Ohana Residences and Rosewood Pointe, the previous sales of which all contributed to improvement in recognized revenues. Also margins improved as prices inched up due to improvements in quality (eg. better and bigger amenities and facilities) as well as costs were at lower than expected levels. During the year, actual project costs from some completed projects accounted for less than estimated costs booked in the previous years causing cost reversals recognized in 2011.
A better representative of current demand would be sales and reservations for the period which experienced an increase of 17% from P14.7 billion in 2010 to P17.2 billion in 2011. Increasing demand for DMCI housing units coming mainly from the new projects: La Verti Residences in Taft, Pasay City; the Redwoods in Fairview, Novaliches; Siena Park in Bicutan Paranaque and Stellar Place in Quezon City pushed marketing sales to new heights. Moreover, increased take up from added phases in existing projects East Raya and Magnolia Place also added to the growth in sales and reservations.
Operating expenses in the real estate segment were higher by 28% due to:
Increase in selling and marketing activities such as advertising, sales incentives, marketing tools, ads, project launches, etc.
Increase in employee salaries & wages
Increase in utilities and real estate taxes
Note that most of the Company’s housing units have a selling price below P3.2 million per unit and as such has been registered with the Board of Investments (BOI) as part of their affordable housing investments that provide vat and income tax incentives.
51
MINING & POWER Coal Mining & Power (Calaca-Coal)
The Company’s coal mining business which owns the major power asset, Calaca are both lodged under the 56%-owned and publicly listed Semirara Mining Corp (SMC). SMC reported an improvement in operations with a net income of around P4.1 billion for coal mining and P1.9 billion for power generation in 2011 compared to P2.6 billion and P1.3 billion respectively in 2010. This was mainly due to higher coal prices and the improved power generating capacity from the completed phase 1 rehabilitation of Calaca unit 2.
Below is SMC’s management discussion and analysis of results of operations and financial
condition for the year 2011 as lifted from its consolidated financial report with the PSE and SEC:
MANAGEMENT’S DISCUSSION AND ANALYSIS OF FINANCIAL CONDITION AND RESULTS OF OPERATIONS (YEARS 2009-2011)
I. PRODUCTION AND OPERATIONS
COAL The acquisition and operation of the 2 x 300 MW power plants in Calaca Batangas gave market security to the coal business segment and the Company, as a group, to hold position in the power sector. The imbalance in the power demand and supply of energy in our country drove the Company to expand its power plant capacities in the next three years. The thrust of the mine operations in 2011 was anchored on this business decision. There were more drilling programs implemented, particularly focusing on the eastern part of the island, which indicated positive results. These extensive drilling activities are being done to ensure that the expansion of power plant capacities will be accordingly supported by sufficient mineable coal reserves. The data gathered from the exploration and confirmatory drilling are going to be submitted to a local competent person for verification for certification by a competent person according to Philippine Mineral Resource Code (PMRC) standards and will ultimately be subjected to certification process in accordance with Joint Ore Reserve Code (JORC) standards. With almost the same equipment complement, operations achieved a new record high of total material movement of 85.06million bank cubic meters (bcm), registering an 8% growth from 2010 material movement of 78.68 million bcm. At a higher strip ratio this year of 10:13:1 from 9:73:1 in 2010, run-of-mine (ROM) coal posted a more modest growth of 4% at 7.84million metric tons (MTs) from 7.54million MTs last year. Despite a higher percentage of washable coal this year, net total product coal recorded a 2% increase at 7.12 million MTs from 6.95 million MTs in 2010. The fourth (4th) loading facility was made operational towards the end of the year. The strategic location of the new loading facility cuts coal transfer time. This improved logistic support necessary for the expanded activities in the island and make coal loading rate faster. Despite the increased production, marketing efforts were restrained by the impact of the economic woes in Europe and US to the Asia Pacific Region. Exports declined due to high coal inventory in China from Europe which were diverted to Asian market and lower coal demand in Thailand due to flooding. Thus, local orders were given priority and export sales slowed down towards the end of the year. As a result, ending inventory stood at 1.0 million MTs more than double the beginning inventory of only 0.49million MTs. POWER
52
UNIT 1 In 2011 Unit 1 was limited to 157 MW average load due to thinned boiler tubes and only one Circulating Water Pump (CWP) in service starting 14 April 2011. Also, the unit was under rehabilitation starting 29 August 2011, hence gross generation reduced by 20% from 2010 level of 915 GWh at 727 GWh this year. Capacity factor, availability, and forced outage rates during th year stood at 28%, 54%, and 4%, respectively. The unit was running for a total of 4,704 hours during the year, and it consumed 477,272 MTs Semcoal. Unit 1 has been operating for 25 years and issues related to safety, reliability, efficiency, upgrade, obsolescence and environmental consequently arose. The rehabilitation of Unit 1 was undertaken to address these issues that caused the inefficient operations of the plant. It was officially shutdown for rehabilitation last August 29, 2011.
UNIT 2 In 2011 Unit 2 was running at 254MW average load due to extended commissioning and high pressure heater leak. Gross generation for 2011 was 1,132 GWh with 43% capacity factor, 60% availability, and 36% forced outage rates. After the rehabilitation works, generation this year is 57% higher than in 2010 as operating hours improved from 4,230 hours in 2010 to 5,234 hours this year. The unit experienced 2,976 hours forced outage which is 19% higher than 2010 level due to the increase in load which exposed the plant’s weak points leading to de-rating and shutdowns. Fine tuning of boiler was done progressively to correct overheating. Meanwhile, the remaining overheated boiler tubes will be replaced by end 2012, to coincide with the scheduled preventive maintenance shutdown of the plant. The Distributed Control System (DCS) and the dry bottom ash system will also be installed during the aforementioned scheduled preventive maintenance shutdown. Moreover, all other improvements, correction of deficiencies and modifications will be undertaken during this time. The full rehabilitation program of the plant is expected to be completed and by start of 2013. II. MARKET COAL Demand for Semirara coal, both from the local and export markets, remained strong in 2011. However, with its new objective of resource maximization for its investments in the power , the Company strategically cut export sales during the year, such that sales of 6.52million MTs was 9% lower than 2010 sales volume of 7.15million MTs. The cut in sales volume came from export deliveries which dropped by 41% at 2.43million MTs from 4.10million MTs in 2010. Conversely, local sales increased by 34% at 4.,09million MTs from 3.05million MTs in 2010. With increasing local demand, marketing efforts shifted back to prioritizing the domestic market to fully benefit from its competitive advantages over imported coal. Thus, from a 43% : 57% market share in favor of export sales in 2010, the scale has tipped to 63%: 37% in 2011. Bulk of the local sales were delivered to the power plants, totaling to 3.27million MTs, increasing by 92% from power plant sales of 1.70million MTs in 2010. SCPC’s total deliveries increased by 47% at 1.41million MTs this year from 0.96million MTs in 2010 as first phase of Unit 2 rehabilitation was completed this year, thus increasing the plant’s effective capacity and utilization rate. Meanwhile, deliveries to other power plants tripled from 0.74million MTs in 2010 to 1.86million MTs this year. The huge increase mainly came from the increase in off-take of a customer with power plants in the Visayas with a long-term supply agreement with the Company. Sales to the power sector accounted for 50% of total sales in 2011.
53
Sales to local cement plants remained flat at 0.66million MTs in 2011 from 0.66 MTs in 2010. This year, the Company has more direct sales to end-users , unlike in the previous years, wherein most of its sales to cement plants were made via local trader Cement plant’s market share inched up slightly at 10% this year from 9% in 2010. Meanwhile, sales to other industrial plants recorded a significant 77% drop from 0.68 million MTs in 2010 to 0.16million MTs this year. This was caused by lower purchases by a local broker who delivers to small industrial plants. As a result, this industry’s market share dropped to 2% from 10% in 2010. High global coal prices translated to a remarkable 31% increase in composite average price from PHP2,343 in 2010 to PHP3,078 this year. The Company already adopted a coal pricing mechanism which is indexed to global coal prices. POWER SCPC’s recorded sales for bilateral contracts for 2011 increased by 14% to 1,553 GWh from its recorded sales in 2010 of 1,368 GWh. This is attributed to the renewal of contract with one of its previous customers, the Batangas I Electric Cooperative, Inc. (BATELEC I); a new power supply contract with Trans-Asia Oil and Energy Development Corporation, which took effect in April and March 2011, respectively; and an arrangement with the National Power Corporation (NPC) for a non-firm power supply to MERALCO on top of the existing firm power supply to MERALCO under the existing Contract for the Supply of Electric Energy inherited by SCPC from NPC. MERALCO remained to be the biggest customer of SCPC accounting for 33% share of the total energy sales for SCPC’s bilateral contracts. SCPC’s sales from the spot market, however, dropped by 1%, from 476 GWh in 2010 to 472 GWh in 2011. The decrease in sales to spot market was mainly due to the approval of non-firm nominations of Meralco. Overall, a total energy of 2,025GWh was sold in 2011, 77% directly to the customers through bilateral contracts, and 23% to the spot market. The total energy sales increased by 10% from 1,845 GWh recorded in 2010. Of the total energy sold, 85% was sourced from the generation of the power plants, while 15% was purchased from the spot market. SCPC secured replacement power from the spot market to meet its supply obligation to MERALCO. In December 2011, SCPC inked a new power supply contract with Meralco effective December 26, 2011 for a term of seven (7) years with an option to extend for another three (3) years upon mutual agreement. The initial contracted capacity is 210 MW and will be increased to 420MW upon commercial operation of the other unit after rehabilitation or 210MW for each unit. III. FINANCE A. Sales and Profitability High coal prices and increase in energy sales resulted to a 13% growth in consolidated Revenues in 2011 at PHP25.81 billion from PHP22.90 billion in the previous year. Net of eliminating entries, coal and energy Revenues stood at PHP16.20 billion and PHP9.61 billion, respectively. Consolidated Cost of Sales increased by 5% at PHP9.15 billion from PHP6.99 billion in 2010. After eliminating entries, the coal and power segments accounted for Cost of Sales of PHP10.26 billion and PHP6.40 billion, respectively. Cost of Coal Sold/MT increased by 21% from PHP1,770 in 2010 to PHP2,148 this year due to significant increases in rate of fuel consumption per cycle time and fuel, materials and spare parts prices, along with the increase in stripping ratio. On the other hand, the power
54
segment’s Cost of Sales/KWhr registered a slight 1% growth from PHP3.13 in 2010 to PHP3.16 in the current period. The increase in per unit Cost of Sales was sufficiently covered by the increase in selling prices for both the coal and power segments. Thus, Gross Profit Margin increased from 31% in 2010 to 35% in the current period. As a result, consolidated Gross Profit registered a healthier growth of 31% from PHP6.99 billion in 2010 to PHP9.15 billion this year. Meanwhile, consolidated Operating Expenses increased by 6% from PHP2.72 billion in 2010 to PHP2.88 billion this year. The coal segment’s Operating Expenses of PHP1.86 billion is mainly composed of Government Share of PHP1.48 billion. On the other hand, the power segment incurred PHP999.00 million in Operating Expenses, which comprised mainly of the O&M fee of the plant. In addition, the Company invested in two new companies during the year. One is the Southwest Luzon Power Generating Corp. (SLPGC) which will undertake the expansion of the power capacities with the construction of 2 x 150 MW plants adjacent to the existing power plants of SCPC. Pre-operating expenses of PHP20.23 million were incurred during the year. Another Company was incorporated, the Sem-Cal Industrial Park Developers, Inc. (SIPDI) which aims to develop the Calaca property into an economic zone. In 2011, it incurred Pre-operating Expenses of PHP50 thousand. Consolidated Financing Cost dropped by 28% from PHP668.44 million in 2010 to PHP483.29 million this year. The decrease was due to the decline in the balance of the SCPC loan, which partly financed the acquisition of the asset, from PHP9.6 billion in 2010 to PHP8.6 as at the end of 2011. Augmented by the drop in interest rates, Financing Cost of the power sector decreased by 19% from PHP490.63 in 2010 to PHP396.78 million this year. Meanwhile, although total loans of the coal segment increased in 2011, due to the decrease in interest rates, its Financing Costs in 2011 of PHP86.51 million decreased by 56% from 2010 level of PHP177.81 million, mainly from dollar denominated loans. On the contrary, consolidated Finance Income rose by 134% from PHP57.67 million to PHP134.88 million. Short-term placement rates improved in 2011 compared to 2010. Moreover, all business units had healthier cash positions during the year. The coal segment’s Finance Income increased by 165% at PHP79.45 million from PHP30.02 in 2010; while the power segment generated PHP55.43 million this year, posting a 100% increase from last year’s level of PHP27.65 million. Meanwhile, SLPGC recognized Finance Income of PHP10.54 from its partially paid-up capital placed in short-term time deposit accounts. Meanwhile, foreign exchange fluctuations resulted to consolidated Forex Losses of PHP38.32 million, the coal and power segments incurred Forex Losses of PHP26.01 million and PHP12.31 million, respectively. In 2010, the fluctuations moved in favor of the Company, thus enabling it to recognize consolidated Forex Gains of PHP 199.49 million. Consolidated Other Income of PHP99.91 was generated by the coal segment mainly from sale of retired mining equipment and proceeds from insurance claims of PHP53.55 million and 35.12 million respectively. This posted a 53% growth from 2010 level of PHP65.43 million. Consolidated Net Income Before Tax showed an impressive growth of 53% at PHP6.01 billion from PHP3.95 billion last year. Minimal losses from the two pre-operating companies were sufficiently covered by the healthy income generation of the coal and power segments, which stood at PHP4.14 billion and PHP1.87 billion, respectively, net of eliminating entries. Meanwhile, both business segments have Income Tax Holidays as Board of Investments registered companies (as expanding coal producer and as power generator). As a result, consolidated Tax Provision amounted to negative provision of PHP22.17 million consisting of final income taxes amounting to PHP22.76, net of deferred income taxes of PHP44.93 million. The resulting consolidated Net Income After Tax closed at PHP6.03 billion, the coal and power segments respectively contributed PHP4.17 billion and PHP1.87 billion. Net earnings this year posted a remarkable 51% growth from consolidated Net Income After Tax in 2010 of PHP3.95 billion. Earnings per Share
55
increased by 40% from PHP12.10 last year to PHP16.93 this year, after the number of outstanding shares increased mid-2010 due to a stock rights offering exercise. Nickel DMCI Mining, Corp., the Company’s nickel and metals (non-coal) mining company, continued to mine and sell high concentration nickel ore (1.8%-2% nickel content) from the Benguet mine in Zambales. DMCI Mining has also started operating at the old Acoje mine via a contract with Zambales Diversified Mining Corp., an affiliate of European Nickel (a London and Australia listed mining company that merged and acquired Rusina Mining). First shipment from this mine has been subsequently made in the 2
nd half
of 2011. The reinstated operations in Acoje was envisioned to supplement and maybe replace production from Benguet since the current contract with Benguet is expected to be finished by 2012.
DMCI Mining reported continuous growth in 2011 as net contributions after eliminations reached P917 million compared to P564 million in 2010. Nickel ore shipments for the year, came mainly from the Benguet mine (minimal from Acoje), which achieved a record 1.7 million wet metric tons (WMT) this year compared to 1.2 million WMT last year. Despite a drop in average selling price, revenues still grew by 25% due to the growth in sales volume. Moreover, improved mining operations resulted to better gross margins, testament to the DMCI engineering pedigree. With the current direction of Benguet to operate on its own and the Acoje mining operations with European Nickel looking to follow suit, the Company is now exploring acquiring its own nickel and other metal resource assets. As the Philippine Government is also looking to revamp and improve revenue generation and policy implementation in the mining industry, the Company sees a few opportunities to possibly acquire mining assets for the group. If these initiatives are successful the Company hopes that the nickel mining business will grow significantly to be a major contributor to consolidated operations. Cost of sales and Services Except for Construction business which account for 27% of 2011 cost of sales, all the other businesses reported an increase in cost of sales due to growth in the operations of their respective areas. Operating Expenses The 9% increase is primarily from the jump in government royalties at the coal business, the heightened marketing and selling activities in the real estate sector, the growth in activity and operations of the power business. Equity in Net Earnings Equity in net earnings reached P2.2 billion in 2011, 15% higher than last year. The rise was mainly due to higher equity income from the unconsolidated water investment which improved its operations from last year. Finance Income and Finance Costs Consolidated net interest expense was lower at P164 million in 2011 compared to P519 million in 2010 due mainly to the reduced debt from the acquisition of the Calaca Power Plant and increased in interest income from short-term placements as a result of higher placement value. Other Income Consolidated other income was slightly lower by 11% mainly due to foreign exchange loss and lower rental income. Provision for Income Tax 31% increase from P1.0 billion to P1.3 billion mainly caused by higher taxable income and deferred tax effect on installment sales of the real estate segment.
56
II. FINANCIAL CONDITION
December 31, 2011 – December 31, 2010
The Company’s financial condition for the period improved as total assets and net assets increased by 18% and 25% respectively.
Cash increased by a significant 51% to P15 billion due mainly from operations of the different
business and the syndicated loan raised by the real estate business. Major generator of cash is from operations while the major use of cash is for PPE.
Total receivables (current and non-current) went up due mainly to new sales in all sectors and the
reinstatement of owner/supplier receivables covered with owner/supplier advances at the construction business.
Consolidated inventories grew by 28% increase as ending inventories grew in the real estate,
power and coal mining businesses. Real estate inventories grew due to the growth in completed and in progress units including new land acquired for development. Inventories for power equipment and ending coal inventories prompted the increase in Semirara’s consolidated inventory.
Investments were slightly up as a result of the Company’s share in net operations of the water
business and other equity investments of the group.
Property plant & equipment inched up coming mainly from the rehabilitation of Calaca unit 2.
Accounts & other payables increased mostly as a result of using operating credits, deferred revenues and accruals.
Long term debt increased due to the P5 billion corporate notes issued at the real estate segment. Current ratio improved from 1.78 to 2.04 due mainly from cash generation of the different businesses.
Debt to equity ratio remained at the same levels despite additional debt issued at the real estate business as operations generated the much needed net asset growth. III. KEY PERFORMANCE INDICATORS The Company and its Subsidiaries (the “Group”) has the following as its key performance indicators: k) Segment Revenues l) Segment Net Income (after Non-controlling Interest) m) Earnings Per Share n) Current Ratio o) Debt to Equity Ratio SEGMENT REVENUES
REVENUES
(in Php Millions) Audited Variance
57
2011 2010 Amount %
COAL SALES 16,231 14,071 2,160 12%
NICKEL ORE SALES 2,452 1,959 493 25%
CONSTRUCTION 10,277 10,729 -452 -4%
REAL ESTATE 8,251 7,705 546 7%
ELECTRICITY 10,421 8,948 1,473 16%
PARENT & OTHERS 171 72 99 137%
TOTAL 47,803 43,484 4,319 10%
The initial indicator of the Company’s gross business results are seen in the movements in the different business segment revenues. As illustrated above the significant main drivers for revenue growth are the mining and real estate sectors (see Part I. Results of Operations – different segments for a detailed discussion per business). SEGMENT NET INCOME
NET INCOME AFTER NON-CONTROLLING INTERESTS
(in Php Millions) Audited Variance
2011 2010 Amount %
COAL SALES 2,379 1,462 917 63%
NICKEL ORE SALES 917 564 353 63%
CONSTRUCTION 1,117 1,242 (125) -10%
REAL ESTATE 1,795 1,286 509 40%
ELECTRICITY 1,177 847 330 39%
WATER 2,195 1,887 308 16%
PARENT & OTHERS 15 (98) 113 -115%
STEEL 677 (677) -100%
TOTAL 9,595 7,867 1,728 22%
The net income (after minority) or bottom line results from operations of the Company can be seen with the increment in net income for the period compared to the same period of the previous year/s for the different business segments. Except for construction, the current period posted strong growth in earnings from the coal and nickel mining businesses, while other segments provided modest improvement (see Part I. Results of Operations – different segments for a detailed discussion per business). EARNINGS PER SHARE The Company’s consolidated earnings per share (EPS) for the year was P3.61/share accounting for a 22% increase from the P2.96/share EPS last year. Same as segment net income, all the businesses except construction all contributed to the improvement in earnings (see Part I. Results of Operations – different segments for a detailed discussion per business).
58
CURRENT RATIO Liquidity is an essential character of any organization, and the Company, including the Group as a whole, should indicate acceptable levels of liquidity. The initial test of liquidity is the current ratio, which will display a company’s ability to satisfy current obligations with current resources. Current ratio is arrived by dividing the current assets over the current liabilities. The Company uses this test and compares it with industry balances to determine its ability to satisfy current obligations with respect to its competitors (see Part II. Financial Condition for a detailed discussion). DEBT TO EQUITY RATIO As a stockholder/investor, financial position and stability would be an important aspect. The Company tests its financial position through the debt to equity ratio. This test indicates the Company’s ownership of creditors vs. owners/investors. In addition, debt to equity ratio maintenance is a requirement set by creditors as a standard for extending credit. Debt to equity ratio is computed by dividing the total liabilities over total equity (see Part II. Financial Condition for a detailed discussion).
OTHER RELEVANT FINANCIAL SOUNDNESS RATIOS
Dec. 31
2011 Dec. 31
2010
Current Ratio 204% 179%
Debt to Equity Ratio 53% 59%
Interest Coverage Ratio 1,234% 694%
Return on Assets Ratio 15% 14%
Return on Equity Ratio 30% 30%
Asset to Equity Ratio 208% 220%
Gross Margin Ratio 34% 30%
Net Profit Margin Ratio 26% 22%
II. OTHER INFORMATION
10. The company’s operation is a continuous process. It is not dependent on any cycle or
season; 11. Economic and infrastructure developments in the country may affect construction
business; Interest rate movements may affect the performance of the real estate industry; Mining activities are generally hinge on the commodities market. Businesses not affected by known cycle, trends or uncertainties are power and water.
12. A cash dividend was declared at the amount of Php 1.20 per common share paid on July 5, 2012 to the holders of record of June 15, 2012. On April 11, 2013, the BOD of the Parent Company has declared cash dividends amounting Php 1.20 regular dividends and Php1.00 special cash dividends in favor of the stockholders of record as of April 26, 2013. This is due to be paid on May 10, 2013 with the total amount of P5,842.09 million.
13. There were no undisclosed material subsequent events that have not been disclosed for the period that the company have knowledge of;
14. There are no material contingencies during the year; any event that may trigger direct or contingent financial obligation that is material to the company, including any default or acceleration of an obligation has been disclosed in the notes to financial statements.
59
15. There are no material off-balance sheet transactions, arrangements, obligations (including contingent obligations), and other relationships of the company with unconsolidated entities or other persons created during the reporting period
16. Except for interest payments on loans, which the Company can fully service, the only commitment that would have a material impact on liquidity are construction guarantees. These are usually required from contractors in case of any damage / destruction to a completed project.
17. Any known trends or any known demands, commitments, events or uncertainties that will result in or that will have a material impact on the registrant’s liquidity. - None
18. The Group does not have any offering of rights, granting of stock options and corresponding plans therefore
19. No transferring of assets except in the normal course of business was done during the relevant interim period
20. No transferring of assets except in the normal course of business was done during the relevant interim period
III. FINANCIAL STATEMENTS
The Financial Statements incorporated herein by reference to the attached audited financial
statements.
D. INFORMATION ON INDEPENDENT ACCOUNTANT AND OTHER RELATED MATTERS
The principal accountants and external auditors of the Company and its subsidiaries is the accounting
firm Sycip, Gorres, Velayo and Co. (SGV & Co.). Pursuant to the General Requirements of SRC Rule 68,
paragraph 3 (Qualifications and Reports of Independent Auditors), the Company and its subsidiaries has
engaged the services of SGV & Co. as external auditor and Mr. Michael C. Sabado is the Partner-in-
Charge starting 2012 audit period or less than five years following the regulatory policy of audit partner
rotation every five years.
I. External Audit Fees and Services
a. Audit and Audit Related Fees – The Company and its Subsidiaries paid its external
auditors the following fees in the past two (2) years:
DMCI Masbate Power Corporation 351,120.00 338,800.00
60
DMCI Mining Corporation 338,800.00 308,000.00
DMCI Power Corporation 239,008.00 338,800.00
DMCI Homes Property Management Corporation - 73,920.00
Beta Electric Corporation 420,420.00 400,037.95
Wirerope Corporation of the Philippines 468,160.00 431,200.00
Semirara Claystone Inc. 49,280.00 -
Sem Calaca RES Corporation 36,960.00 -
Semirara Energy Utilities , Inc. 30,800.00 -
Sem Balaya Power Generation Corp. 30,800.00 -
St. Raphael Power Power Generation Corp. 30,800.00 -
DMCI Palawan Power Corporation 24,640.00 -
Grand Total 14,286,285.44 13,028,789.95
b. Tax Fees - NONE
c. All other fees – NONE
d. Changes In And Disagreements With Accountants On Accounting And Financial
Disclosure - There has been no change or disagreements with certifying
accountants.
e. The Company's Audit Committee reviews and discusses with management and the
external auditor the annual audited financial statements, including discussion of material
transactions with related parties, accounting policies, as well as the external auditor's
written communications to the Committee and to management. It also reviews the
external auditor's audit plans that increase the credibility and objectivity of the Company's
financial reports and public disclosure.
PART IV - MANAGEMENT AND CERTAIN SECURITY HOLDERS
A. Directors and Executive Officers of the Issuer
(1) Identify Directors, Including Independent Directors, and Executive Officer.
Name Position Age DAVID M. CONSUNJI Chairman of the Board of Directors 92 CESAR A. BUENAVENTURA Vice-Chairman of the Board 84 ISIDRO A. CONSUNJI President 65 CRISTINA C. GOTIANUN Asst. Treasurer 59 HERBERT M. CONSUNJI Director/Vice President & CFO 61 JORGE A. CONSUNJI Director 62 VICTOR A. CONSUNJI Director 63 MA. EDWINA C. LAPERAL Director 52 HONORIO O. REYES-LAO Director (Independent) 69 ANTONIO JOSE U. PERIQUET Director (Independent) 53 NOEL A. LAMAN Corporate Secretary 74 VICTOR S. LIMLINGAN Managing Director 69
61
David M. Consunji is the Founder and Chairman of the Board of Directors of D.M. Consunji,
Inc. Mr. Consunji is also Chairman of Dacon Corporation, and Semirara Mining Corporation. Mr.
Consunji served as the Secretary of the Department of Public Works, Transportation and
Communications from August 1971 to 1975. Awards and recognition received by Mr. Consunji include
(i) named Meralco Awardee in Engineering and Applied Sciences, 1994; (ii) recipient of the Civil
Engineer Diamond Jubilee Award presented by the University of the Philippines Alumni Engineers in
1985; (iii) One of the Ten Outstanding Civil Engineers in 1982 by the Philippine Institute of Civil
Engineers; (iv) recipient of Doctor of Laws, honoris causa, University of the Philippines in 1993;
(v) named Outstanding Citizen of the City of Manila for Engineering in 1979; and (vi) named
Management Association of the Philippines Awardee in 1996, Outstanding Alumni Engineer of the
University of Phils. Alumni Engineers in 2010, and Icon of the Philippine Construction Industry 2010 by
the Phil. Constructors Association. Mr. David Consunji has served the Corporation as Chairman of the
Board for nineteen (19) years since March 1995.
Cesar A. Buenaventura, is Chairman of Buenaventura Echauz and Partners, Inc. He is currently a
Director of the following: DMCI Holdings, Inc., Semirara Mining Corporation, iPeople Inc., D.M. Consunji,
Inc., Petroenergy Resources Corp., AG&P Company of Manila, Inc., Montecito Properties, Inc. (Vice
Chairman), Pilipinas Shell Petroleum Corp., Philippine American Life Insurance Company and Manila
International Airport Authority. He was chosen Management Man of the Year in 1985 by MAP and in
January 1991, he was personally granted the award of Honorary Officer of the Order of the British Empire
by her Majesty Queen Elizabeth II. Mr. Buenaventura has served the Company as Vice Chairman for
nineteen (19 years since March 1995. Isidro A. Consunji is a regular Director of the following: DMCI Project Developers, Inc., Semirara Mining Corporation, Dacon Corporation, DMCI-MPIC Water Company, Inc. Crown Equities, Inc. and Beta Electric Corporation. His other positions include: Chairman of the Board of Directors of DMCI Homes, Beta Electric Corporation; President of Dacon Corporation, DMCI Project Developers, Inc. and Sem-Calaca Power Corp. Mr. Isidro Consunji has served the Corporation as a regular director for nineteen (19) years since March 1995. Herbert M. Consunji is a Partner in H.F. Consunji & Associates. He is also the Chairman of Subic Water and Sewerage Company, Inc., a regular Director of DMCI Project Developers, Inc., Semirara Mining Corporation, DMCI-MPIC Water Company, Inc., Maynilad Water Services, Inc., DMCI Mining Corp., DMCI Power Corporation and the Chief Operating Officer of Maynilad Water Services, Inc. Mr. Herbert Consunji has served the Corporation as a regular director for nineteen (19) years since March 1995. Jorge A. Consunji is the President and Chief Operating Officer of D.M. Consunji, Inc. His other positions include: Director of Semirara Miing Corporation, Beta Electric Corp., Atlantic, Gulf & Pacific Company of Manila, Inc., Chairman of Wire Rope Corporation, and Treasurer of Dacon Corporation. Mr. Jorge Consunji has served the Corporation as a regular director for nineteen (19) years since March 1995. Victor A. Consunji is a Director of the following: DMCI Holdings, Inc., Dacon Corporation (Vice-President), Semirara Mining Corporation (President), One Network Bank (Chairman), M&S Company, Inc., Sodaco Agricultural Corporation, Sirawai Plywood & Lumber Corp. (Chairman), DMC Urban Property Developers, Inc., DM Consunji, Inc., and Ecoland Properties Development Corporation. Mr. Victor Consunji has served as a regular director of the Corporation for nineteen (19) years since March 1995. Ma. Edwina C. Laperal is the Treasurer of DMCI Holdings, Inc., Dacon Corporation, DMCI Project Developers, Inc., and DMCI Urban Property Developers, Inc.; Regular Director of DMCI Holdings, Inc., DMCI Project Developers, Inc., Semirara Mining Corporation and D.M. Consunji, Inc. Ms. Laperal has served the Corporation as Treasurer for nineteen (19) years since March 1995.
62
Honorio O. Reyes-Lao is the Director of Philippine Business Bank from 2010 up to present. He was the President and Director of Gold Venture Lease and Management Services, Inc, 2008-2009; Senior Business Consultant of the Antel Group of Companies, 2007-2009; Senior Management Consultant of East West Banking Corporation, 2005-2006. Prior to 2005, Mr. Reyes-Lao was the Senior Vice-President of China Banking Corporation in charge of the lending operation under the Account Management Group. He was a Director of the First Sovereign Asset Management Corporation, 2004-‘06; Director and Treasurer of CBC Insurance Brokers, Inc, 1998- 2003 : Director of CBC Forex Corporation, 1997-2002; and CBC Properties and Computer Center, Inc, 1993-2006. His civic affiliations are the Makati Chamber of Commerce and Industries - past President; Rotary Club of Makati West – Treasurer; and a Fellow in the Institute of Corporate Directors, a professional organization which espouses good corporate governance in both private and public organizations. Mr. Reyes-Lao has served the Company as Independent Director for five (5) years (since July 2009). Antonio Jose U. Periquet is currently the Chairman of Pacific Main Holdings; Director of the Lyceum of the Philippines University, The Straits Wine Company, Inc., Ayala Corporation, BPI Capital Corporation, Bank of the Philippine Islands, BPI Family Bank, Campden Hill Group, Regis Financial Advisers, Inc., ABS-CBN Corporation, Philippine Seven Corporation and Pancake House, Inc. He was previously chairman of Deutsche Regis Partners, Inc. and executive director of various financial institutions in London and Hong Kong. Mr. Periquet holds an MBA from the University of Virginia, a MSc in Development Economics from Oxford University and a Bachelor of Arts degree in Economics from the Ateneo de Manila University. He is a member of the Dean's Global Advisory Council, Darden School of Business, University of Virginia. Mr. Periquet has served the company as an Independent Director for four (4) years since July 2010. Victor S. Limlingan is Managing Director of DMCI Holdings, Incorporated as well as a Director of D. M. Consunji, Incorporated and DMCI Project Developers Inc. (DMCI Homes). He is presently an independent director of Sika Philippines, a subsidiary of Sika International of Switzerland and Monarch Insurance, a joint venture company owned by Malaysian and Sri Lankan groups. An educator, he holds a Doctorate in Business Administration from the Harvard Business School. He was a Full Professor at the Asian Institute of Management as well as a member of the Presidential Task Force on Education. Presently, he is the Chairman of the Guagua National Colleges. He and his wife Marita own and manage Regina Capital Development Corporation, a member of the Philippine Stock Exchange as well as Cristina Travel Corporation. Dr. Limlingan has served the Company as Independent Director for three years (from July 2006-January 2009). On February 1, 2009, he was appointed as the Managing Director of the Corporation. Cristina C. Gotianun is a Director of Dacon Corporation, D.M. Consunji, Inc, Asia Industries, Inc., DMCI Power Corporation, DMC Construction Equipment Resources, Inc., DMC Urban Property Developers, Inc., M&S Company, Inc., Prime Ortigas Development Corporation and South Davao Development Co., Inc.. Her other positions include: Vice-President for Administration of Semirara Mining Corp., Treasurer of DMCI Power Corp., Vice President for Finance Administrative/Chief Finance Officer of D.M. Consunji, Inc., and Corporate Secretary of Dacon Corporation and DMC Urban Property Developers, Inc.. Ms. Gotianun has served the Corporation as Asst. Treasurer for nineteen (19) years since March 1995. Noel A. Laman is a founder and Senior Partner of Castillo Laman Tan Pantaleon & San Jose. His other positions include: Treasurer of the DCL Group of Companies (Manpower Resources of Asia/Sealanes Marine Services/Center for Multicultural Studies/CRAFT Technologies, Inc.); Director and Corporate Secretary of Boehringer Ingelheim (Phils.), Inc., and Merck, Inc. He is an active member of the Intellectual Property Association of the Philippines, the Philippine Bar Association, and have been a speaker in local and foreign legal seminars and a resource person of various foreign chambers of commerce in the Philippines. Mr. Laman’s practice of law includes corporate law, intellectual property and mergers and acquisition. He is the firm’s representative to the State Capital Group, a US based
63
group of international law firms. Atty. Laman has served the Corporation as Corporate Secretary for nineteen (19) years since March 1995.
Currently, there are no director or executive officer share options relating to the capital of the
Company.
(2) Identify Significant Employees –
(a) The following are the significant employees of the Registrant who are not
executive officers but who are expected by Registrant to make a significant
contribution to the business:
Significant Employees Position held in Registrant Age
Ma. Luisa C. Austria Administrative / Accounting Officer 62
Aldric G. Borlaza Senior Finance Officer 36
Brian T. Lim Finance Officer 28
Ms. Ma. Luisa C. Austria, Mr. Aldric G. Borlaza, and Mr. Brian T. Lim will continue to hold
their respective positions with the Registrant for the year 2013-2014. (b) Brief descriptions of the business experience of the above significant employees
of the Registrant: Ma. Luisa C. Austria is a former Accounting Supervisor of D. M. Consunji, Inc. (1989 to 1996). She is now the Administrative/Accounting Officer of the Registrant and has been holding said position for seventeen (17) years since 1996. Aldric G. Borlaza worked for three (3) months in SGV, Assurance or External Audit group, involving basic audit of accounting controls, documents and paper trail as well as basic preparation of Audited Financial Statements (January 2002 to March 2002). He is the Finance Officer of the Company from April 2002-2012. He now holds a position of Senior Finance Officer since 2012 to present. Brian T. Lim is the Finance Officer of the Company since August 15, 2012. He used to work with Sycip, Gorres, Velayo & Co. (SGV) for five years as assurance director/audit manager. Term of office. The term of office of Ms. Austria is approximately eighteen (18) years. Mr. Borlaza has been serving the company for twelve (12) years since April of 2002. Mr. Lim has been with the Company for one year and eight months.
(3) Family Relationships - Describe any family relationships up to the fourth civil degree either by
consanguinity or affinity among directors, executive officers, or persons nominated or chosen by the
registrant to become directors or executive officers. – See below:
Name Relationship David M. Consunji Father of Isidro A. Consunji,
Jorge A. Consunji, Victor A. Consunji, Cristina C. Gotianun and Ma. Edwina C. Laperal
64
Isidro A. Consunji, Jorge A. Children of David M. Consunji Consunji, Victor A. Consunji, Cristina Gotianun, and Ma. Edwina C. Laperal Herbert M. Consunji Nephew of David M. Consunji and cousin of Isidro A. Consunji, Jorge A. Consunji, Victor A. Consunji, Cristina C. Gotinanun,
and Ma. Edwina C. Laperal
(4) Involvement in Certain Legal Proceedings - None of the directors, executive officers and nominees
for election is subject to any pending material legal proceedings
(a) Any bankruptcy petition filed by or against any business of which such person was a general
partner or executive officer either at the time of the bankruptcy or within two years prior to that time -
NONE
viii. Any conviction by final judgment, including the nature of the offense, in a criminal
proceeding, domestic or foreign, or being subject to a pending criminal proceeding,
domestic or foreign, excluding traffic violations and other minor offenses - NONE
ix. Being subject to any order, judgment, or decree, not subsequently reversed,
suspended or vacated, of any court of competent jurisdiction, domestic or foreign,
permanently or temporarily enjoining, barring, suspending or otherwise limiting his
involvement in any type of business, securities, commodities or banking activities -
NONE
x. Being found by a domestic or foreign court of competent jurisdiction (in a civil
action), the Commission or comparable foreign body, or a domestic or foreign
Exchange or other organized trading market or self regulatory organization, to have
violated a securities or commodities law or regulation, and the judgment has not
been reversed, suspended, or vacated – NONE
B. Executive Compensation
ANNUAL COMPENSATION
Name Principal Position
Salary Bonus Per Diem Allowance**
Other annual compensation
David M. Consunji Chairman of the Board of Directors
Cesar A. Buenaventura Vice – Chairman of the Board of Directors
Isidro A. Consunji President/Chief Executive Officer
Herbert M. Consunji Vice President & Chief Financial Officer
Ma. Edwina C. Laperal Treasurer
65
YEARS
2011 P 93,701,111.00 P 240,000.00 P 8,532,185.00
2012 P 68,466,633.46 P 220,000.00 P 9,515,941.20
2013 P 46,386,287.94 P 200,000.00 P 5,876,764.72
2014* P 46,386,287.94 P 200,000.00 P 5,876,764.72
TOTAL: P 254,940,320.34 P 860,000.00 P 10,659,075.64
YEARS
All other directors and executive officers as a group unnamed
2011 2012 2013 2014*
P 60,278,449.08 P 29,749,137.42 P 30,770,953.59 P 30,770,953.59
P 120,000.00 P 170,000.00 P 360,000.00 P 360,000.00
P 2,618,299.00 P 3,646,176.48 P 2,135,588.24 P 2,135,588.24
TOTAL: P 151,569,493.68 P1,010,000.00 P 10,535,651.96
*Approximate figures
** Each director receives Php 10,000.00 for every regular meeting of the Board.
There is no contract covering their employment with the Corporation and they hold office by virtue of their election to office. The Company has no agreements with its named executive officers regarding any bonus, profit sharing, pension or retirement plan. There are no outstanding warrants, options, or right to repurchase any securities held by the directors or executive officers of the Company.
C. Security Ownership of Certain Beneficial Owners and Management
a. Beneficial Ownership of Directors of the Corporation as of December 31, 2013.
Name of Beneficial Amount and Nature Percent Title of Class Owner of Beneficial Ownership of Class Common David M. Consunji 1,000.00 0.0000% Common Cesar A. Buenaventura 180,000.00 0.0068% Common Isidro A. Consunji 13,000.00 0.0005% Common Victor A. Consunji 1,000.00 0.0000% Common Jorge A. Consunji 1,000.00 0.0000% Common Herbert M. Consunji 4,600.00 0.0006% Common Ma. Edwina C. Laperal 107,000.00 0.00402% Common Honorio O. Reyes-Lao 35,000.00 0.00132% Common Antonio Jose U. Periquet 25,000.00 0.00094%
AGGREGATE OWNERSHIP OF ALL DIRECTORS AS A GROUP 367,600.00 0.0138%
b. Owners owning 5% or more of the voting stocks of the Corporation as of December 31, 2013.
Name and Address of Amount/Nature of Percent
66
Title of Class Beneficial Owner Beneficial Ownership of Class
Common Dacon Corporation (Fil) 1,215,393,901.00 45.7690% c/o Isidro A. Consunji
2281 Pasong Tamo Ext.
Makati City Common PCD Nominee Corp. (Fil) 465,397,483.00 17.5258% G/F Makati Stock Exchange Bldg., 6767 Ayala Ave., Makati City Common DFC Holdings, Inc. (Fil) 461,999,838.00 17.3979% c/o Cristina C. Gotianun
2281 Pasong Tamo Ext. Makati City
Common PCD Nominee Corp. (For) 443,210,923.00 16.6903% G/F Makati Stock Exchange Bldg., 6767 Ayala Avenue, Makati City
Below is the list of the individual beneficial owners under PCD account who holds more than 5% of the voting securities of Registrant.-
Common BDO Securities Corp. (Fil) 198,669,366.00 7.4814% 2th Floor Tower One & Exchange Plaza, Ayala Avenue Makati City Common Deutsche Bank 152,644,612.00 5.7482% 26/F Ayala Tower One Ayala Avenue, Makati City Common The Hongkong & Shanghai 171,230,021.00 9.2970%
Banking Corp. 12
th Floor The Enterprise Center
Tower I 6766 Ayala Ave. Makati City
c. Changes in Control – NONE
d. Certain Relationships and Related Transactions
2013 Third Quarter Financial Statements In the regular course of business, the Group’s significant transactions with related parties consisted primarily of the following:
67
(a) Comprehensive surety, corporate and letters of guarantee issued by the Company and DMCI for various credit facilities granted to and for full performance of certain obligations by certain related parties. (b) Certain assets of the Group, associates and other related parties were placed under accommodation mortgages to secure the indebtedness of the Group, its associates and other related parties. (c) Interest and non interest-bearing cash and operating advances made by the Group to and from various associates and other related parties. (d) Engineering and construction works of the water business is contracted to the construction segment of the Company. These projects are bid out to various contractors and are awarded on arms length transactions. The interrelated contracts amounted to Php 1,405,339,635.33 and Php 1,480,481,872.21 as of September 30, 2013 and September 30, 2012 respectively, where Php 345,671,606.16 and Php 580,869,719.69 were booked for the period ended September 30, 2013 and September 30, 2012 respectively.
Audited Financial Statements 2013 Related parties are considered to be related if one party has the ability, directly or indirectly, to control the other party or exercise significant influence over the other party in making the financial and operating decisions. Parties are also considered to be related if they are subject to common control or common significant influence. Related parties may be individuals or corporate entities. Transactions entered into by the Group with related parties are at arm’s length and have terms similar to the transactions entered into with third parties. In the regular course of business, the Group’s significant transactions with related parties include the following:
(a) In December 2013, DMC sold various property, plant and equipment on account to BNC,
an associate of TMC, which will be used for its mining operations in Palawan.
(b) In 2013 and 2012, DMCI is engaged in the construction of Tarlac - Pangasinan - La Union Toll Expressway (TPLEX) through PIDC an associate of the Group. Related contract revenue recorded by DMCI on PIDC amounted to P=1,223.15 million and P=653.30 million in 2013 and 2012, respectively. DMCI has outstanding receivables from PIDC amounting to P=287.01 million and P=170.02 million as of December 31, 2013 and 2012, respectively. Retention receivable and advances to contract owners amounted to P=98.53 million and P=1.98 million as of December 31, 2013 and P=104.90 million and P=12.87 million as at December 31, 2012, respectively. Unliquidated advances from contract owners amounted to P=29.29 million and P=57.60 million as at December 31, 2013 and 2012, respectively.
(c) Receivable from DMC Urban Property Developers, Inc. (UPDI), an affiliate under
common stockholder amounted to P=19.21 million and P=187.30 million as at December 31, 2013
and 2012, respectively.
In 2013, UPDI had transactions with SMC representing long-term lease on office space and other
transactions rendered to SMC necessary for the coal operations.
(d) DMC-Construction Equipment Resources, Inc. (DMC-CERI), an affiliate, under common
68
stockholder, has transactions with SMC for services rendered relating to the SMC’s coal operations. These services are for the confirmatory drilling for coal reserve evaluation of identified potential areas, exploratory drilling of other minerals within Semirara Island, dewatering well drilling along cut-off wall of Panian mine and fresh water well drilling for industrial and domestic supply under an agreement. DMC-CERI also provides to SMC marine vessels for use in the delivery of coal to its various customers. The coal freight billing is on a per metric ton basis plus demurrage charges when delay will be incurred in the loading and unloading of coal cargoes. The outstanding receivable of DMC from DMC-CERI pertains to repairs and maintenance, fuel and materials and meal allowances of barge and tugboat crews incurred, which are initially paid by DMC in behalf of DMC-CERI. The outstanding receivable is included in “Receivable from related parties” under “Receivables” account in the consolidated statements of financial position. (e) Asia Industries Inc., an affiliate, under common stockholder, had transactions with the Group for the rental of office and parking spaces to which related expenses are included in “Operating expenses” in the consolidated statements of income. The outstanding balance to Asia Industries, Inc. is lodged under “Payable to related parties” in the consolidated statements of financial position. (f) M&S Company, Inc. (M&S), an affiliate under common control, provides various supplies and materials to DMC in cash on delivery basis. M&S also rents out various equipment used in DMC’s operations. This is included in “Cost of sales and services” in the consolidated statements of income. (g) Dacon, a shareholder of the Parent Company, provided maintenance of the Group’s accounting system, Navision, to which related expenses are included under “Others” of “Operating expenses” in the consolidated statements of income.
(h) Royal Star Aviation Inc. transports SMC’s visitors and employees from Manila to
Semirara Island and vice versa and bills the related party for the utilization costs of the aircrafts.
The related expenses are included in “Cost of sales and services” in the consolidated statements
of income. The outstanding balance to Royal Star Aviation, Inc. is included in “Payable to related
parties” in the consolidated statements of financial position.
(i) Prominent Fruits, Inc. supplies various office supplies and refreshments to SMC. The outstanding balance to Prominent Fruits, Inc. is included under “Payable to related parties” in the consolidated statements of financial position.
(j) Payable to Sirawai pertains to labor charges incurred by DMC, which are initially paid by
Sirawai in behalf of DMC. The outstanding payable to Sirawai is recorded in “Payable to related
parties” in the consolidated statements of financial position.
Terms and conditions of transactions with related parties Outstanding balances as of December 31, 2013 and 2012, which are unsecured and interest free, are all due within one year. As of December 31, 2013 and 2012, the Parent Company has not made any provision for impairment loss relating to amounts owed by related parties. This assessment is undertaken each financial year through examining the financial position of the related party and the market in which the related party operates.
69
PART IV - EXHIBITS AND SCHEDULES
Item 13. Exhibits and Reports on SEC Form 17-C
(a) Exhibits - See accompanying index to exhibits (b) Reports on SEC Form 17-C - The list of the reports from the preceding period December 31, 2013 is herein incorporated by reference.
(9) Material Contracts – NONE
71
INDEX TO EXHIBITS FORM 17-A
Number Particulars
1 List of the Top 20 shareholders of the Company
2 List of reports filed under SEC Form 17-C
72
LIST OF TOP 20 STOCKHOLDERS AS OF DECEMBER 31, 2013
This special form is applicable to Investment Companies and Publicly-held Companies (enumerated in Section 17.2 of the Securities Regulation Code(SRC), except banks and insurance companies). As a supplemental form to PHFS, it shall be used for reporting Consolidated Financial Statements of Parentcorporations and their subsidiaries.
Domestic corporations are those which are incorporated under Philippine laws or branches/subsidiaries of foreign corporations that are licensed to dobusiness in the Philippines where the center of economic interest or activity is within the Philippines. On the other hand, foreign corporations are those thatare incorporated abroad, including branches of Philippine corporations operating abroad.
Financial Institutions are corporations principally engaged in financial intermediation, facilitating financial intermediation, or auxiliary financial services.Non-Financial institutions refer to corporations that are primarily engaged in the production of market goods and non-financial services
National GovernmentPublic Financial Institutions
NOTE:
Held to Maturity Investments - issued by domestic entities:National Government
Private Non-Financial Institutions
Public Non-Financial InstitutionsPrivate Financial Institutions
A.1.4.1 Financial Assets at Fair Value through Profit or Loss - issued by domestic entities:
Other receivables
Allowance for doubtful accounts (negative entry)
Financial Assets other than Cash/Receivables/Equity investments (A.1.4.1 + A.1.4.2 + A.1.4.3 + A.1.4.4 + A.1.4.5 + A.1.4.6)
A.1.2.1 Due from domestic entities (A.1.2.1.1 + A.1.2.1.2 + A.1.2.1.3 + A.1.2.1.4 + A.1.2.1.5)
Allowance for doubtful accounts (negative entry)
Control No.: Form Type:
SPECIAL FORM FOR FINANCIAL STATEMENTS OF PUBLICLY-HELD AND INVESTMENT COMPANIESNAME OF CORPORATION: DMCI HOLDINGS, INC. AND SUBSIDIARIES (Consolidated)
A.1.1.1
TEL. NO.:COMPANY TYPE : Holding Company
CURRENT ADDRESS:818-3000
3rd Floor, Dacon Building, 2281 Don Chino Roces Avenue, Makati City
A.1.2 Trade and Other Receivables (A.1.2.1 + A.1.2.2)
A.1.1 Cash and cash equivalents (A.1.1.1 + A.1.1.2 + A.1.1.3)
A.1.1.2 In domestic banks/entities
If these are based on consolidated financial statements, please so indicate in the caption.Table 1. Consolidated Balance Sheet
A.1.5 Other Current Assets (state separately material items) (A.1.5.1 + A.1.5.2 + A.1.5.3)
Assets Classified as Held for SaleAssets included in Disposal Groups Classified as Held for Sale
A.6A.5
Software costs
A.6.2
A.6.1 Major item/s, specify (A.6.1.1 + A.6.1.2)
A.4
Control No.: Form Type:
SPECIAL FORM FOR FINANCIAL STATEMENTS OF PUBLICLY-HELD AND INVESTMENT COMPANIESNAME OF CORPORATION: DMCI HOLDINGS, INC. AND SUBSIDIARIES (Consolidated)
Allowance for doubtful accounts, net of current portion (negative entry) - - Other Assets (A.10.1 + A.10.2 + A.10.3 + A.10.4 + A.10.5) 3,919,877 2,095,811
6,424,633 8,265,827 B.1.4.1 Short-term Debt 2,119,296 632,971 B.1.4.2 Current Portion of Liabilities for Purchased Land 885,088 929,379 B.1.4.3 Current Portion of Long-term Debt 3,386,257 6,642,262 B.1.4.4 Payable to Related Parties 33,992 61,215 B.1.4.5 - -
B.1.5 66,182 89,442 B.1.6 - -
8,610,466 6,688,460 B.1.7.1 Billings in excess of costs and estimated earnings on uncompleted contracts 3,680,765 3,332,565 B.1.7.2 Customers’ advances and deposits 4,929,701 3,355,895 B.1.7.3 - - B.1.7.4 - - B.1.7.5 - - B.1.7.6
- - B.1.7.6.1 - -
B.1.7.6.2 - - B.1.7.6.3 - -
Any other current liability in excess of 5% of Total Current Liabiilities, specify:(B.1.7.6.1 + B.1.7.6.2 + B.1.7.6.3)
Others, specify (If material, state separately; indicate if the item is payable to public/private or financial/non-financial institutions) (B.1.7.1 + B.1.7.2 + B.1.7.3 + B.1.7.4 + B.1.7.5 + B.1.7.6)
Deferred Tax LiabilitiesLiabilities for Current Tax
Control No.: Form Type:
SPECIAL FORM FOR FINANCIAL STATEMENTS OF PUBLICLY-HELD AND INVESTMENT COMPANIESNAME OF CORPORATION: DMCI HOLDINGS, INC. AND SUBSIDIARIES (Consolidated)
- - Subscribed Capital Stock (no. of shares, par value and total value) (C.2.1 + C.2.2 + C.2.3) - -
- - - - - -
Paid-up Capital Stock (C.3.1 + C.3.2) 2,655,498 2,655,498 Common shares 2,655,494,000 issued shares in 2013 and 2012 2,655,494 2,655,494 Preferred Shares 4 4
Additional Paid-in Capital / Capital in excess of par value / Paid-in Surplus 4,765,317 4,765,317 Non-controlling Interests 8,910,307 7,451,109 Others, specify (C.6.1 + C.6.2 + C.6.3 + C.6.4) 330,096 251,009
SPECIAL FORM FOR FINANCIAL STATEMENTS OF PUBLICLY-HELD AND INVESTMENT COMPANIESNAME OF CORPORATION: DMCI HOLDINGS, INC. AND SUBSIDIARIES (Consolidated)
5,900,000,000 shares, P1.00 par value
Other Noncurrent Liabilities
COMPANY TYPE : Holding Company
Table 1. Consolidated Balance Sheet
F I N A N C I A L D A T A
Domestic Private Non-Financial Institutions B.2.4
Deferred Tax Liabilities
If these are based on consolidated financial statements, please so indicate in the caption.
B.2
B.2.2 Domestic Public Non-Financial Institutions
Foreign Financial Institutions B.2.5
Liabilities Included in the Disposal Groups Classified as Held for Sale
B.5.2 Others, specify (B.5.2.1 + B.5.2.2 + B.5.2.3 + B.5.2.4 + B.5.2.5)B.5.1 Liabilities for Purchased Land - net of current portion
SPECIAL FORM FOR FINANCIAL STATEMENTS OF PUBLICLY-HELD AND INVESTMENT COMPANIESNAME OF CORPORATION: DMCI HOLDINGS, INC. AND SUBSIDIARIES (Consolidated)
COMPANY TYPE : Holding Company
COST OF SALES (C.1 + C.2 + C.3 + C.4 + C.5 + C.6 + C.7 + C.8 + C.9)C.1 Cost of real estate inventory
B.3 Finished Goods, End (negative entry)B.2
Management feeForfeitures and cancellation of contracts
A.3.3 Rental incomeA.3.2
A.3.4
If these are based on consolidated financial statements, please so indicate in the caption.
Table 2. Consolidated Income Statement
F I N A N C I A L D A T A
REVENUE / INCOME (A.1 + A.2 + A.3 + A.4)A.1 Net Sales or Revenue / Receipts from Operations (manufacturing,
NOTE: Pursuant to SRC Rule 68.1 (as amended in Nov. 2005), for fiscal years ending December 31, 2005 up to November 30, 2006, acomparative format of only two (2) years may be filed to give temporary relief for covered companies as the more complex PFRSs will beapplied for the first time in these year end periods. After these first time applications, the requirement of three (3) year comparatives shallresume for year end reports beginning December 31, 2006 and onwards.
Share in the Profit or Loss of Associates and Joint Ventures accounted for using the Equity Method
A.4.3A.4.2 Recoveries from insurance claims
A.3.1A.3
A.4 Other Income (non-operating) (A.4.1 + A.4.2 + A.4.3 + A.4.4)A.4.1 Interest Income
A.3.5
Gain / (Loss) from selling of Assets, specify(A.4.3.1 + A.4.3.2)
2011 2010 2009( in P'000 ) ( in P'000 ) ( in P'000 )
F. 9,390,802 6,288,451 5,286,176 F.1 Government share 1,304,961 1,557,950 1,497,356 F.2 Depreciation and amortization 1,556,057 327,097 198,656 F.3 Salaries, wages and employee benefits 1,112,195 1,063,108 1,007,532 F.4
5,417,589 3,340,296 2,582,632 F.4.1 Outside services 837,816 792,487 211,478 F.4.2 Repairs and maintenance 739,224 238,995 94,728 F.4.3 Commission 737,447 386,810 503,946 F.4.4 Taxes and licenses 638,735 530,723 677,460 F.4.5 Provision for doubtful accounts 443,650 78,296 15,178 F.4.6 Advertising and marketing 309,730 366,357 337,092 F.4.7 Rent 115,773 28,619 104,834 F.4.8 Communication, light and water 114,410 80,440 75,686 F.4.9 Entertainment, amusement and recreation 73,560 69,697 62,395
F.4.10 Insurance 66,347 61,687 68,172 F.4.11 Transportation and travel 62,285 54,507 47,292 F.4.12 Supplies 55,748 108,757 46,954 F.4.13 Association dues 39,834 40,081 50,276 F.4.14 Probable losses on other noncurrent assets - 47,151 - F.4.15 Loss on writedown of property, plant and equipment 443,349 341,146 - F.4.16 Foreign exchange loss - net 356,121 - 46,567 F.4.17 Miscellaneous 383,560 114,543 240,574
G. 929,328 1,198,528 1,261,885 H. 24,361,409 13,966,809 13,588,240 I. INCOME TAX EXPENSE (negative entry) (2,104,650) (1,474,554) (1,343,551) J. 22,256,759 12,492,255 12,244,689 K.
- - - K.1 - - -
K.2 - - - L. 3,319,379 2,756,421 2,681,735 M.
18,937,380 9,735,834 9,562,954 N.
N.1 7.13 3.67 3.60 N.2 - - -
EARNINGS (LOSS) PER SHAREBasicDiluted
INCOME(LOSS) AFTER TAXAmount of (i) Post-Tax Profit or Loss of Discontinued Operations; and (ii) Post-Tax Gain or Loss Recognized on theMeasurement of Fair Value less Cost to Sell or on the Disposal of the Assets or Disposal Group(s) constituting the Discontinued Operation (if any)
PROFIT OR LOSS ATTRIBUTABLE TO NONCONTROLLING INTERESTSPROFIT OR LOSS ATTRIBUTABLE TO EQUITY HOLDERS OF THE PARENT
NET INCOME (LOSS) BEFORE TAX (E - F - G)FINANCE COSTS
If these are based on consolidated financial statements, please so indicate in the caption.
CURRENT ADDRESS: 3rd Floor, Dacon Building, 2281 Don Chino Roces Avenue, Makati City
Control No.: Form Type:
SPECIAL FORM FOR FINANCIAL STATEMENTS OF PUBLICLY-HELD AND INVESTMENT COMPANIESNAME OF CORPORATION: DMCI HOLDINGS, INC. AND SUBSIDIARIES (Consolidated)
Page 6
PHFS (rev 2006)
FAX NO.:PSIC:
2011 2010 2009( in P'000 ) ( in P'000 ) ( in P'000 )
Provisions for doubtful accounts 443,650 78,296 15,178 Loss on PPE writedown 443,349 341,146 - Reversal of impairment on other noncurrent assets (61,549) - - Movement in net retirement asset 39,438 (156,320) - Writedown on investments in jointly controlled entities 409 - - Impairment of noncurrent assets - 47,150 - Gain on sale of investments (9,157,413) - - Equity in net earnings of associates and jointly controlled entity (1,802,251) (2,317,551) (2,185,199) Finance income (658,777) (849,864) (1,097,703) Net unrealized foreign exchange loss (gain) (203,482) (182,518) 18,974 Gain on sale property, plant and equipment (144,855) (127,497) (57,565) Gain on bargain purchase (31,041) - - Dividend income (4,291) (25,379) (4,547) Unrealized market loss (gain) on financial assets at FVPL (1,890) 140 (1,400) Gain on reversal of impairment on PPE - - (6,670) Loss on sale of available-for-sale financial assets - 986 -
Decrease (Increase) in:Receivables (1,794,532) (5,652,933) 1,116,236 Inventories (535,209) (3,179,438) (5,642,985) Other current assets (1,678,720) (931,039) (698,297) Others, specify:
Liabilities for purchased land 217,979 217,979 (498,574)
348,200 (395,497) 163,864 Others, specify:
Interest received 325,147 852,289 1,080,363 Income taxes paid (1,328,752) (1,709,150) (849,894) Interest paid and capitalized as cost of inventory (672,582) (313,340) (213,920)
17,526,897 5,923,538 9,796,122
Additions to:Investment in financial asset at FVPL - - (70,000) Property, plant and equipment (10,247,891) (6,165,489) (3,539,342) Investments in associates, jointly controlled entity and others (1,029,334) - (1,300) Investment properties (25,939) (139,197) (32,138) Available-for-sale financial assets - - (7,105)
Proceeds from disposals of:Investments in associates, jointly controlled entity and others 8,227,483 - - Property and equipment 381,556 136,040 76,077 Available-for-sale financial assets (Note 6) - 164,878 150
Others, specify: Dividends received 5,225,306 881,507 703,198 Increase in other noncurrent assets (1,480,444) - (233,279) Acquisition of a business - net of cash acquired (Note 11) (1,622,171) (2,576,811) - Interest paid and capitalized as cost of property, plant and equipment (101,380) (11,010) - Net decrease in investment in associates - - 26,138
NOTE: Pursuant to SRC Rule 68.1 (as amended in Nov. 2005), for fiscal years ending December 31, 2005 up to November 30, 2006, a comparativeformat of only two (2) years may be filed to give temporary relief for covered companies as the more complex PFRSs will be applied for the firsttime in these year end periods. After these first time applications, the requirement of three (3) year comparatives shall resume for year end reportsbeginning December 31, 2006 and onwards.
Billings in excess of costs and estimated earnings on uncompleted contracts
C. Net Cash Used in Financing Activities (sum of above rows)D. Effects of Exchange Rate Changes on Cash and Cash Equivalents
NET INCREASE IN CASH AND CASH EQUIVALENTS (A + B + C + D)Cash and Cash Equivalents
B. Net Cash Provided by Investing Activities (sum of above rows)CASH FLOWS FROM FINANCING ACTIVITIES
Proceeds from:
A. Net Cash Provided by Operating Activities (sum of above rows)CASH FLOWS FROM INVESTING ACTIVITIES
Customers’ advances and deposits
Changes in Assets and Liabilities:
Costs and estimated earnings in excess of billings on uncompleted contracts
DepreciationAdjustments to Reconcile Net Income to Net Cash Provided by Operating Activities
TEL. NO.: 818-3000COMPANY TYPE : Holding Company If these are based on consolidated financial statements, please so indicate in the caption.
Table 3. Consolidated Cash Flow Statements
F I N A N C I A L D A T A
CASH FLOWS FROM OPERATING ACTIVITIESNet Income (Loss) Before Tax and Extraordinary Items
CURRENT ADDRESS: 3rd Floor, Dacon Building, 2281 Don Chino Roces Avenue, Makati City
Control No.: Form Type:
SPECIAL FORM FOR FINANCIAL STATEMENTS OF PUBLICLY-HELD AND INVESTMENT COMPANIESNAME OF CORPORATION: DMCI HOLDINGS, INC. AND SUBSIDIARIES (Consolidated)
Page 7
GFFS (rev 2006)
FAX NO.:PSIC: PSIC: PSIC:
Capital StockAdditional Paid-
in Capital
Unappropriated Retained Earnings
Appropriated Retained Earnings
Premium on Acquisition of
Non-controlling Interest
Remeasurements on Retirement
Plans
Net AccumulatedGains (Loss) on Available-for- Sale Financial Assets
K.2 Surplus (Deficit) on Revaluation of Investments
K.3 Currency Translation Differences
K.4 Other Surplus (specify)
J.1 Balances, as previously reported
Surplus
K.1 Surplus (Deficit) on Revaluation of Properties
Effect of adoption of the Revised PAS 19
Others
H.1 Effect of adoption of the Revised PAS 19
Balance, 2011
G.3 Others
Net Income (Loss) for the Period
Dividends (negative entry)
Appropriation for (specify)
F.1 Capacity expansion and additional investment
Issuance of Capital Stock
G.1 Common Stock
G.2 Preferred Stock
D.1 Net income, as previously reported
D.2 Effect of adoption of the Revised PAS 19
C.3 Currency Translation Differences
C.4 Other Surplus (specify)
Surplus
C.1 Surplus (Deficit) on Revaluation of Properties
C.2 Surplus (Deficit) on Revaluation of Investments
A.1 Effect of adoption of the Revised PAS 19
TEL. NO.: 888-3000
COMPANY TYPE : HOLDING COMPANYIf these are based on consolidated financial statements, please so indicate in the caption.
Table 4. Statement of Changes in Equity
(Amount in P'000)
F I N A N C I A L D A T A
Balance, 2010
CURRENT ADDRESS: 2281 Don Chino Roces Avenue, Makati City
Control No.: Form Type:
SPECIAL FORM FOR FINANCIAL STATEMENTS OF PUBLICLY-HELD AND INVESTMENT COMPANIESNAME OF CORPORATION: DMCI HOLDINGS, INC. AND SUBSIDIARIES (Consolidated)
Page 8
*SGVFS007333*
A S 0 9 5 - 0 0 2 2 8 3SEC Registration Number
D M C I H O L D I N G S , I N C . A N D S U B S I D I A R
I E S
(Company’s Full Name)
3 r d F l o o r , D a c o n B u i l d i n g , 2 2 8 1 D
Oo n C h i n o R o c e s A v e n u e , M a k a t i C i t
y
(Business Address: No. Street City/Town/Province)
Herbert M. Consunji 888-3000(Contact Person) (Company Telephone Number)
1 2 3 1 A A F SMonth Day (Form Type) Month Day
(Fiscal Year) (Annual Meeting)
(Secondary License Type, If Applicable)
Dept. Requiring this Doc. Amended Articles Number/Section
Total Amount of Borrowings
Total No. of Stockholders Domestic Foreign
To be accomplished by SEC Personnel concerned
File Number LCU
Document ID Cashier
S T A M P S
Remarks: Please use BLACK ink for scanning purposes.
COVER SHEET
*SGVFS007333*
INDEPENDENT AUDITORS’ REPORT
The Stockholders and the Board of DirectorsDMCI Holdings, Inc.3rdFloor, Dacon Building2281 Don Chino Roces AvenueMakati City
We have audited the accompanying consolidated financial statements of DMCI Holdings, Inc. andSubsidiaries, which comprise the consolidated statements of financial position as at December 31,2013 and 2012, and the consolidated statements of income, statements of comprehensive income,statements of changes in equity and statements of cash flows for each of the three years in the periodended December 31, 2013, and a summary of significant accounting policies and other explanatoryinformation.
Management’s Responsibility for the Consolidated Financial Statements
Management is responsible for the preparation and fair presentation of these consolidated financialstatements in accordance with Philippine Financial Reporting Standards, and for such internal controlas management determines is necessary to enable the preparation of consolidated financial statementsthat are free from material misstatement, whether due to fraud or error.
Auditors’ Responsibility
Our responsibility is to express an opinion on these consolidated financial statements based on ouraudits. We conducted our audits in accordance with Philippine Standards on Auditing. Thosestandards require that we comply with ethical requirements and plan and perform the audit to obtainreasonable assurance about whether the consolidated financial statements are free from materialmisstatement.
An audit involves performing procedures to obtain audit evidence about the amounts and disclosuresin the consolidated financial statements. The procedures selected depend on the auditor’s judgment,including the assessment of the risks of material misstatement of the consolidated financial statements,whether due to fraud or error. In making those risk assessments, the auditor considers internal controlrelevant to the entity’s preparation and fair presentation of the consolidated financial statements inorder to design audit procedures that are appropriate in the circumstances, but not for the purpose ofexpressing an opinion on the effectiveness of the entity’s internal control. An audit also includesevaluating the appropriateness of accounting policies used and the reasonableness of accountingestimates made by management, as well as evaluating the overall presentation of the consolidatedfinancial statements.
We believe that the audit evidence we have obtained is sufficient and appropriate to provide a basis forour audit opinion.
BOA/PRC Reg. No. 0001, December 28, 2012, valid until December 31, 2015SEC Accreditation No. 0012-FR-3 (Group A), November 15, 2012, valid until November 16, 2015
A member firm of Ernst & Young Global Limited
*SGVFS007333*
- 2 -
Opinion
In our opinion, the consolidated financial statements present fairly, in all material respects, thefinancial position of DMCI Holdings, Inc. and Subsidiaries as at December 31, 2013 and 2012, andtheir financial performance and their cash flows for each of the three years in the period endedDecember 31, 2013 in accordance with Philippine Financial Reporting Standards.
SYCIP GORRES VELAYO & CO.
Cyril Jasmin B. ValenciaPartnerCPA Certificate No. 90787SEC Accreditation No. 1229-A (Group A), May 31, 2012, valid until May 30, 2015Tax Identification No. 162-410-623BIR Accreditation No. 08-001998-74-2012, April 11, 2012, valid until April 10, 2015PTR No. 4225226, January 2, 2014, Makati City
April 3, 2014
A member firm of Ernst & Young Global Limited
*SGVFS007333*
DMCI HOLDINGS, INC. AND SUBSIDIARIESCONSOLIDATED STATEMENTS OF FINANCIAL POSITION(Amounts in Thousands)
December 31,2013
December 31,2012
(As restated -Note 2)
January 1,2012
(As restated -Note 2)
ASSETS
Current AssetsCash and cash equivalents (Notes 4 and 36) P=24,774,495 P=9,717,042 P=15,049,848Financial assets at fair value through profit or loss
(Notes 5 and 36) 73,150 71,260 71,400Available-for-sale financial assets
(Notes 6 and 36) 59,979 88,553 59,910Receivables - net (Notes 7, 21 and 36) 14,961,082 11,435,341 8,384,769Costs and estimated earnings in excess of billings
on uncompleted contracts (Note 8) 986,359 919,932 411,075Inventories (Note 9) 23,171,833 21,515,161 17,484,675Other current assets (Note 10) 7,158,892 5,478,365 4,550,946
Total Current Assets 71,185,790 49,225,654 46,012,623
Current LiabilitiesShort-term debt (Notes 15 and 36) P=2,119,296 P=632,971 P=1,490,648Current portion of liabilities for purchased land
(Notes 16 and 36) 885,088 929,379 471,886Accounts and other payables (Notes 17 and 36) 13,764,063 12,300,693 11,908,718Billings in excess of costs and estimated earnings
on uncompleted contracts (Note 8) 3,680,765 3,332,565 750,744Customers’ advances and deposits (Note 18) 4,929,701 3,355,895 3,610,586Current portion of long-term debt
(Notes 19 and 36) 3,386,257 6,642,262 3,813,948Income tax payable 66,182 89,442 138,199Payable to related parties (Notes 21 and 36) 33,992 61,215 301,372
Total Current Liabilities 28,865,344 27,344,422 22,486,101
(Forward)
*SGVFS007333*
- 2 -
December 31 January 1
2013
2012(As restated -
Note 2)
2012(As restated -
Note 2)
Noncurrent LiabilitiesLong-term debt - net of current portion
(Notes 19 and 36) P=31,258,586 P=18,190,853 P=17,775,617Liabilities for purchased land - net of current
OTHER INCOME (EXPENSES)Gain on sale of investment (Note 11) 9,157,413 − −Equity in net earnings of associates (Note 11) 1,802,251 2,317,551 2,185,553Finance income (Note 26) 658,777 849,465 1,097,703Finance costs (Note 27) (929,328) (1,198,528) (1,261,885)Other income - net (Note 28) 517,966 786,383 432,873
INCOME BEFORE INCOME TAX 24,361,409 13,966,809 13,588,240
PROVISION FOR INCOME TAX (Note 29) 2,104,650 1,474,554 1,343,551
NET INCOME (Note 35) P=22,256,759 P=12,492,255 P=12,244,689
NET INCOME ATTRIBUTABLE TOEquity holders of the Parent Company P=18,937,380 P=9,735,834 P=9,562,954Non-controlling interests 3,319,379 2,756,421 2,681,735
P=22,256,759 P=12,492,255 P=12,244,689
EARNINGS PER SHARE ATTRIBUTABLETO EQUITY HOLDERS OF THEPARENT COMPANY-BASIC ANDDILUTED (Note 30) P=7.13 P=3.67 P=3.60
See accompanying Notes to Consolidated Financial Statements.
*SGVFS007333*
DMCI HOLDINGS, INC. AND SUBSIDIARIESCONSOLIDATED STATEMENTS OF COMPREHENSIVE INCOME(Amounts in Thousands)
Years Ended December 31
2013
2012(As restated -
Note 2)
2011(As restated -
Note 2)
NET INCOME P=22,256,759 P=12,492,255 P=12,244,689
OTHER COMPREHESIVE INCOME(LOSS)
Items to be reclassified subsequently toprofit or loss
Cumulative translation adjustment (Note 34) (32,376) − −Changes in fair values of AFS financial assets (Note 6) (22,016) 30,000 1,691
(54,392) 30,000 1,691Items not to be reclassified to profit or loss
in subsequent periodsRemeasurement gains on retirement plans
TOTAL COMPREHENSIVE INCOME P=22,346,319 P=12,744,198 P=12,399,276
TOTAL COMPREHENSIVE INCOMEATTRIBUTABLE TO:
Equity holders of the Parent Company P=19,016,467 P=9,995,165 P=9,718,446Non-controlling interests 3,329,852 2,749,033 2,680,830
P=22,346,319 P=12,744,198 P=12,399,276
See accompanying Notes to Consolidated Financial Statements.
*SGVFS007333*
DMCI HOLDINGS, INC. AND SUBSIDIARIESCONSOLIDATED STATEMENTS OF CHANGES IN EQUITY(Amounts in Thousands)
Attributable to Equity Holders of the Parent Company
Capital Stock(Note 22)
AdditionalPaid-inCapital
(Note 22)
TotalPaid-inCapital
(Note 22)
UnppropriatedRetainedEarnings(Note 22)
AppropriatedRetainedEarnings(Note 22)
Premiumon Acquisition
of Non-controlling
Interest
Remeasurementson Retirement
Plans(Note 2)
NetAccumulated
Gain (Loss) onAvailable-for-Sale FinancialAssets (Note 6)
CumulativeTranslationAdjustment
(Note 34) Total
Non-controllingInterests(Note 22)
TotalEquity
For the Year Ended December 31, 2013
Balances as of January 1, 2013, as previously reported P=2,655,498 P=4,765,317 P=7,420,815 P=28,638,094 P=4,600,000 (P=161,033) P=– P=28,910 P=– P=40,526,786 P=7,464,172 P=47,990,958Effect of adoption of the Revised PAS 19 (Note 2) – – – 395,065 – – 383,132 – – 778,197 (13,063) 765,134Balances as of January 1, 2013, as restated 2,655,498 4,765,317 7,420,815 29,033,159 4,600,000 (161,033) 383,132 28,910 – 41,304,983 7,451,109 48,756,092Comprehensive income
Net income – – – 18,937,380 – – – – – 18,937,380 3,319,379 22,256,759Other comprehensive income – – – – – – 133,543 (22,080) (32,376) 79,087 10,473 89,560
Balances as of January 1, 2012, as previously reported P=2,655,498 P=4,765,317 P=7,420,815 P=23,633,072 P=3,000,000 (P=161,033) P=– (P=1,090) P=– P=33,891,764 P=6,578,239 P=40,470,003Effect of adoption of the Revised PAS 19 (Note 2) – – – 450,846 – – 153,801 – – 604,647 (5,985) 598,662Balances as of January 1, 2012, as restated 2,655,498 4,765,317 7,420,815 24,083,918 3,000,000 (161,033) 153,801 (1,090) – 34,496,411 6,572,254 41,068,665Comprehensive income
Net income, as previously reported – – – 9,791,615 – – – – – 9,791,615 2,756,111 12,547,726Effect of adoption of the Revised PAS 19 (Note 2) – – – (55,781) – – – – – (55,781) 310 (55,471)Net income, as restated – – – 9,735,834 – – – – – 9,735,834 2,756,421 12,492,255Other comprehensive income, as previously reported – – – – – – – 30,000 – 30,000 – 30,000Effect of adoption of the Revised PAS 19 (Note 2) – – – – – – 229,331 – – 229,331 (7,388) 221,943Other comprehensive income, as restated – – – – – – 229,331 30,000 – 259,331 (7,388) 251,943
Balances as of January 1, 2011, as previously reported P=2,655,498 P=4,765,917 P=7,421,415 P=19,693,115 P=– (P=161,033) P=– (P=2,781) P=– P=26,950,716 P=5,472,486 P=32,423,202Effect of adoption of the Revised PAS 19 (Note 2) – – – 483,343 – – – – – 483,343 (5,360) 477,983Balances as of January 1, 2011, as restated 2,655,498 4,765,917 7,421,415 20,176,458 – (161,033) – (2,781) – 27,434,059 5,467,126 32,901,185Comprehensive income
Net income, as previously reported – – – 9,595,451 – – – – – 9,595,451 2,681,455 12,276,906Effect of adoption of the Revised PAS 19 (Note 2) – – – (32,497) – – – – – (32,497) 280 (32,217)Net income, as restated – – – 9,562,954 – – – – – 9,562,954 2,681,735 12,244,689Other comprehensive income, as previously reported – – – – – – – 1,691 – 1,691 – 1,691Effect of adoption of the Revised PAS 19 (Note 2) – – – – – – 153,801 – – 153,801 (905) 152,896Other comprehensive income, as restated – – – – – – 153,801 1,691 – 155,492 (905) 154,587
See accompanying Notes to Consolidated Financial Statements.
*SGVFS007333*
DMCI HOLDINGS, INC. AND SUBSIDIARIESCONSOLIDATED STATEMENTS OF CASH FLOWS(Amounts in Thousands)
Years Ended December 31
2013
2012(As restated -
Note 2)
2011(As restated -
Note 2)
CASH FLOWS FROM OPERATINGACTIVITIES
Income before income tax P=24,361,409 P=13,966,809 P=13,588,240Adjustments for:
Depreciation, depletion and amortization(Notes 12, 13, 14, 24 and 25) 4,186,062 3,329,842 3,093,843
Finance costs (Note 27) 929,328 1,198,528 1,261,885Provisions for doubtful accounts (Note 25) 443,650 78,296 15,178Loss on PPE writedown (Note 28) 443,349 341,146 –Movement in net retirement asset 39,438 (156,320)Writedown on investments in jointly controlled entities (Note 11) 409 –Gain on sale of investments (Note 11) (9,157,413) – –Equity in net earnings of associates and
jointly controlled entity (Note 11) (1,802,251) (2,317,551) (2,185,199)Finance income (Note 26) (658,777) (849,864) (1,097,703)Net unrealized foreign exchange loss (gain) (203,482) (182,518) 18,974Gain on sale property, plant and equipment (Note 28) (144,855) (127,497) (57,565)Reversal of impairment on other noncurrent assets (Note 14) (61,549) – –Gain on bargain purchase (Note 33) (31,041) – –Dividend income (Notes 11 and 28) (4,291) (25,379) (4,547)Unrealized market loss (gain) on financial
assets at FVPL (Note 5) (1,890) 140 (1,400)Impairment of noncurrent assets (Note 14) – 47,150 –Loss on sale of available-for-sale financial
assets (Note 6) – 986 –Gain on reversal of impairment on PPE (Note 28) – – (6,670)
Operating income before changes in workingcapital 18,338,096 15,303,768 14,625,036Decrease (increase) in:
Costs and estimated earnings in excess ofbillings on uncompleted contracts (66,427) 329,347 (2,888)
Customers’ advances and deposits P=1,573,806 P=1,619,541 (P=799,490)Accounts and other payables 2,799,891 (217,989) 1,516,671Liabilities for purchased land 217,979 217,979 (498,574)Billings in excess of costs and estimated
earnings on uncompleted contracts 348,200 (395,497) 163,864Cash generated from operations 19,203,084 7,093,739 9,779,573Interest received 325,147 852,289 1,080,363Income taxes paid (1,328,752) (1,709,150) (849,894)Interest paid and capitalized as cost of
Proceeds from disposals of:Investments in associates, jointly controlled
entity and others (Note 11) 8,227,483 – –Property and equipment 381,556 136,040 76,077Available-for-sale financial assets (Note 6) – 164,878 150
Dividends received 5,225,306 881,507 703,198Increase in other noncurrent assets (1,480,444) – (233,279)Acquisition of a business - net of cash
acquired (Note 11) (1,622,171) (2,576,811) –Interest paid and capitalized as cost of
property, plant and equipment (101,380) (11,010) –Net decrease in investment in associates – – 26,138Net cash used in investing activities (672,814) (7,710,082) (3,077,601)
Increase (decrease) in:Payable to related parties (Note 21) (27,223) (89,249) (190,387)Other noncurrent liabilities 164,692 174,985 562,351
Redemption of preferred shares – – (600)Net cash used in financing activities (1,794,849) (3,442,988) (1,620,096)
EFFECT OF EXCHANGE RATECHANGES ON CASH AND CASHEQUIVALENTS (1,781) (103,274) 4,757
NET INCREASE (DECREASE) IN CASHAND CASH EQUIVALENTS 15,057,453 (5,332,806) 5,103,182
CASH AND CASH EQUIVALENTS ATBEGINNING OF YEAR 9,717,042 15,049,848 9,946,666
CASH AND CASH EQUIVALENTS ATEND OF YEAR (Note 4) P=24,774,495 P=9,717,042 P=15,049,848
See accompanying Notes to Consolidated Financial Statements.
*SGVFS007333*
DMCI HOLDINGS, INC. AND SUBSIDIARIESNOTES TO CONSOLIDATED FINANCIAL STATEMENTS
1. Corporate Information
DMCI Holdings, Inc. (the Parent Company) was incorporated on March 8, 1995 and is domiciledin the Philippines. The Parent Company’s registered office address and principal place of businessis at 3rd Floor, Dacon Building, 2281 Don Chino Roces Avenue, Makati City.
The Parent Company is the holding company of the DMCI Group (collectively referred to hereinas the Group), which is primarily engaged in general construction, mining, power generation,infrastructure, real estate development, water concessionaire and manufacturing.
The Parent Company’s shares of stock are listed and are currently traded at the Philippine StockExchange (PSE).
The accompanying consolidated financial statements were approved and authorized for issue bythe Board of Directors (BOD) on April 3, 2014.
2. Summary of Significant Accounting Policies
Basis of PreparationThe consolidated financial statements of the Group have been prepared using the historical costbasis, except for available-for-sale (AFS) financial assets and financial assets at fair value throughprofit or loss (FVPL) that have been measured at fair value. The Group’s functional andpresentation currency is the Philippine Peso (P=). All amounts are rounded to the nearest thousand(P=000), unless otherwise indicated.
The consolidated financial statements provide comparative information in respect of the previousperiod. In addition, the Group presents an additional statement of financial position at thebeginning of the earliest period presented when there is a retrospective application of anaccounting policy, a retrospective restatement, or a reclassification of items in financialstatements. An additional statement of financial position as at January 1, 2012 is presented inthese consolidated financial statements due to retrospective application of certain accountingpolicies.
Statement of ComplianceThe consolidated financial statements of the Group have been prepared in compliance withPhilippine Financial Reporting Standards (PFRS).
Basis of ConsolidationThe consolidated financial statements comprise the financial statements of the Group as ofDecember 31, 2013 and 2012, and for each of the three years in the period endedDecember 31, 2013.
The consolidated financial statements are prepared using uniform accounting policies for liketransactions and other events in similar circumstances. All significant intercompany balances andtransactions, including income, expenses and dividends, are eliminated in full. Profits and lossesresulting from intercompany transactions that are recognized in assets are eliminated in full.
- 2 -
*SGVFS007333*
Control is achieved when the Group is exposed, or has rights, to variable returns from itsinvolvement with the investee and has the ability to affect those returns through its power over theinvestee. Specifically, the Group controls an investee if and only if the Group has:· Power over the investee (i.e. existing rights that give it the current ability to direct the relevant
activities of the investee)· Exposure, or rights, to variable returns from its involvement with the investee, and· The ability to use its power over the investee to affect its returns
When the Group has less than a majority of the voting or similar rights of an investee, the Groupconsiders all relevant facts and circumstances in assessing whether it has power over an investee,including:· The contractual arrangement with the other vote holders of the investee· Rights arising from other contractual arrangements· The Group’s voting rights and potential voting rights
The Group re-assesses whether or not it controls an investee if facts and circumstances indicatethat there are changes to one or more of the three elements of control. Consolidation of asubsidiary begins when the Group obtains control over the subsidiary and ceases when the Grouploses control of the subsidiary. Assets, liabilities, income and expenses of a subsidiary acquired ordisposed of during the year are included in the statement of comprehensive income from the datethe Group gains control until the date the Group ceases to control the subsidiary.
Non-controlling interests (NCI) pertain to the equity in a subsidiary not attributable, directly orindirectly to the Parent Company. NCI represent the portion of profit or loss and net assets insubsidiaries not wholly owned by the Group and are presented separately in consolidatedstatement of income, consolidated statement of comprehensive income and consolidated statementof changes in equity and within equity in the consolidated statement of financial position,separately from equity holders’ of the Parent Company.
Any equity instruments issued by a subsidiary that are not owned by the Parent Company are non-controlling interests including preferred shares.
Profit or loss and each component of other comprehensive income (OCI) are attributed to theequity holders of the parent of the Group and to the NCI, even if this results in the NCI having adeficit balance. When necessary, adjustments are made to the financial statements of subsidiariesto bring their accounting policies into line with the Group’s accounting policies. All intra-groupassets and liabilities, equity, income, expenses and cash flows relating to transactions betweenmembers of the Group are eliminated in full on consolidation.
A change in the ownership interest of a subsidiary, without a loss of control, is accounted for as anequity transaction. If the Group loses control over a subsidiary, it:· Derecognizes the assets (including goodwill) and liabilities of the subsidiary· Derecognizes the carrying amount of any NCI· Derecognizes the cumulative translation differences recorded in equity· Recognizes the fair value of the consideration received· Recognizes the fair value of any investment retained· Recognizes any surplus or deficit in profit or loss· Reclassifies the Parent Company’s share of components previously recognised in OCI to
profit or loss or retained earnings, as appropriate, as would be required if the Group haddirectly disposed of the related assets or liabilities
- 3 -
*SGVFS007333*
The consolidated financial statements include the financial statements of the Parent Company andthe following subsidiaries (which are all incorporated in the Philippines, except for Toledo MiningCorporation which is incorporated in England and Wales under the Companies Act 1985):
* Have not yet started commercial operations as of December 31, 20131 Also engaged in real estate development2 DMCI’s subsidiaries3 PDI’s subsidiaries4 Semirara’s subsidiaries5 DPC’s subsidiaries6 DMC’s subsidiary
General ConstructionDMCISubscription to PDI's increase in authorized capital stockOn October 30, 2009, the PDI BOD and stockholders approved the increase in the PDI’sauthorized capital stock from P=3.00 billion, divided into 3,000,000,000 common shares with a parvalue of P=1.00 per share, to P=5.00 billion, divided into 5,000,000,000 common shares with a parvalue of P=1.00 per share.
- 5 -
*SGVFS007333*
On December 30, 2010, the Securities and Exchange Commission (SEC) approved PDI'sapplication for increase in authorized capital stock. Of the said increase in the authorized capitalstock of 2 billion common shares at P=1.00 par value per share, 538,132,578 common shares havebeen subscribed by the DMCI and the Parent Company, each subscribing 504,862,578 shares and33,270,000 shares, respectively in exchange of real estate properties.
On September 24, 2012, PDI filed a petition for the substitution of subscription payment to theincrease of capital stock from real estate properties to cash. DMCI paid the subscription inOctober 2012. As at December 31, 2013, PDI is still awaiting for the SEC’s approval of the abovepetition. Subsequently on January 9, 2014, the SEC granted the petition.
Declaration of Investment in PDI as Property Dividends to the Parent CompanyIn October 2011, DMCI declared majority of its investment in PDI as property dividends to theParent Company with equivalent value of P=949.59 million representing 30.57% share in PDI.
On December 5, 2011, the SEC approved DMCI’s application to declare its investment in PDI asproperty dividend to the Parent Company. The property dividend amounted to P=949.59 millionpayable in 949,594,750 shares of stocks in PDI with same par value. As a result, PDI became88.87% owned by the Parent Company.
Revocation of Investees’ SEC LicensesIn 2013, the Company has retired its various investments in subsidiaries and associates. TheCompany received the notice from the SEC approving the revocation of the investees’ SEClicenses. Entities whose SEC licenses are revoked include:· DMCI-Laing Construction, Inc.· OHKI-DMCI Corporation· DMCI International, Inc· Eco Process & Equipment Philippines, Inc.
Due to the revocation, the Company derecognized the investees’ respective net assets in the bookswith remaining total carrying value of P=16.75 million.
MiningDMCDMC was incorporated and domiciled in the Republic of the Philippines on May 29, 2007primarily to carry on the business of mining, developing, exploiting, extracting, milling,concentrating, preparing for market, manufacturing, buying, shipping and transporting, all kinds ofores, metals and minerals. It involves surface mining and direct shipping of nickel laterite ore andis conducted through simple benching operation using excavators and trucks in Sta. Cruz andCandelaria, Zambales.
On March 31, 2013, the BOD of DMC approved the acceptance of P=1.80 billion advances fromthe Parent Company as deposit for future additional issuances of DMC’s capital stock.
On September 24, 2013, the BOD approved the increase in the authorized capital stock of DMCfrom P=0.50 billion divided into 0.50 billion shares with a par value of P=1.00 per share toP=5.00 billion divided into 5.00 billion shares with a par value of P=1.00 per share.
- 6 -
*SGVFS007333*
On November 19, 2013, the Parent Company and DMC executed a Deed of Assignment ofAdvances wherein the BOD of DMC approved and agreed for the conversion of the advancesmade by the Parent Company into equity for the additional subscription to 1.80 billion shares ofDMC.
On December 19, 2013, the SEC approved DMC’s application for increase in its authorized capitalstock. Accordingly, the advances were converted to equity and 1.80 billion shares were issued asof December 31, 2013.
TMCIn October 2012, DMC acquired 17% stake of Daintree Resources Limited in TMC forGBP 3.4 million. Such investment was accounted for as an associate as of December 31, 2012.
In 2013, DMC increased its interest in TMC by acquiring additional shares through a mandatorycash offer to TMC’s shareholders representing additional 81.09% interest. As of December 31,2013, DMC holds 49,148,335 shares and voting rights representing 98.09% of voting rights.
On December 20, 2013 after establishing the 98.09% voting rights and gaining majority seats inthe BOD of TMC, DMC obtained control over TMC. TMC has subsequently delisted on LondonStock Exchange – Alternative Investment Market (AIM) after the resolution for the matter hasbeen approved on the General Meeting of Shareholders. The business combination transactionwas initially accounted provisionally as allowed under PFRS 3 (see Note 33).
PowerDPCDPC was incorporated and domiciled in the Republic of the Philippines. It was registered with theSEC on October 16, 2006 to engage in acquiring, designing, constructing, investing in andoperating electric power plants, and engaging in the business of a Generation Company inaccordance with Republic Act (RA) No. 9136 otherwise known as the Electric Power IndustryReform Act (EPIRA) of 2001.
On December 17, 2013, the Parent Company and DPC entered into a Subscription Agreement forthe subscription of the latter’s new shares. As of the date of signing the Agreement, the authorizedcapital stock of DPC amounts to P=1,000.00 million, divided into 1,000.00 million shares, with apar value of P=1.00 per share, out of which P=300.00 million consisting of 300.00 million shareshave been previously issued to the subscriber. Subject to the terms and conditions provided in theAgreement, the Parent Company subscribed to 700.00 million new shares from the unissuedportion of DPC’s existing authorized capital stock, at the subscription price of P=1.00 per share, ora total of subscription price for all the new shares of P=700.00 million.
Upon signing of the Agreement, P=150.00 million has been paid in the subscription price. Thebalance of P=550.00 million will be paid in two or more tranches upon the call of DPC’s Board ofDirectors, provided the Subscriber is notified of such call at least three business days prior to thedue date of payment.
DMCI MasbateDMCI Masbate was incorporated and domiciled in the Republic of the Philippines. It wasregistered with the SEC on November 13, 2007 primarily to acquire, design, develop, construct,invest in and operate power generating plants in the province of Masbate and engage in thebusiness of a generation company in accordance with RA No. 9136 otherwise known as theEPIRA and its implementing rules and regulations, and to design, develop, assemble and operateother power related facilities, appliances and devices.
- 7 -
*SGVFS007333*
On February 3, 2011, the Parent Company and DPC executed a Deed of Assignment, whereby theParent Company conveyed all its rights and interest over its subscribed 5,099,995 shares of DMCIMasbate with P=1.00 par value each, of which P=1.28 million has been paid. As at December 31,2011, DMCI Masbate is wholly owned by DPC.
DMCI PalawanDMCI Palawan Power Corporation, a wholly-owned subsidiary of DPC, was incorporated anddomiciled in the Republic of the Philippines. It was registered with the Securities and ExchangeCommission (SEC) on September 12, 2012 primarily to acquire, design, develop, construct, investin and operate power generating plants in the province of Palawan and engage in the business of ageneration company in accordance with RA No. 9136, otherwise known as EPIRA and itsimplementing rules and regulations, and to design, develop, assemble and operate other powerrelated facilities, appliances and devices.
In 2012, DPC provided equity funding to DMCI Palawan amounting P=2.50 million.
SLPGCOn August 31, 2011, SLPGC, a wholly-owned subsidiary of Semirara, was incorporated to operateelectric power plants and to engage in business of a Generation Company. In 2011, Semiraraprovided equity funding to SLPGC amounting P=770.20 million.
SCRCSCRC is a stock corporation registered with SEC on September 14, 2009, primarily to sellelectricity to any person or entity through electricity markets, by trading, or by contract, toadminister, conserve and manage the electricity generated by power-generating plants, owned byits affiliates or by a third party, to invest in or acquire corporations or entities engaged in any ofthe foregoing activities.
Prior to 2013, the Parent Company owns 100% of common shares of SCRC. However, onMarch 15, 2013, the Parent Company assigned all of its 1.25 million shares in SCRC to SCPC atP=1.00 par value or in the total amount of P=1.25 million, making it as a wholly owned subsidiary ofSCPC.
On September 25, 2013, SCPC subscribed to additional 6.75 million SCRC shares bringing thetotal investment in SCRC to P=8.00 million as of December 31, 2013. The related shares wereissued as of December 31, 2013. The Parent Company has 56.32% indirect ownership interest inSCPC and thus, an effective ownership interest of the same in SCRC.
SIPDIOn April 24, 2011, SIPDI was incorporated to acquire, develop, construct, invest in, operate andmaintain an economic zone capable of providing infrastructures and other support facilities forexport manufacturing enterprises, information technology enterprises, tourism economic zoneenterprises, medical tourism economic zone enterprises, retirement economic zone enterprisesand/or agro-industrial enterprises, inclusive of the required facilities and utilities, such as light andpower system, water supply and distribution system, sewerage and drainage system, pollutioncontrol devices, communication facilities, paved road network, and administration building as wellas amenities required by professionals and workers involved in such enterprises, in accordancewith R.A. No. 7916, as amended by R.A. No. 8748, otherwise known as the Special EconomicZone Act of 1995.
- 8 -
*SGVFS007333*
SEUIOn February 18, 2013, SEUI was incorporated to perform Qualified Third Party (QTP) functionspursuant to Section 59 of Republic Act 9136, otherwise known as the EPIRA and itsImplementing Rules & Regulations”. DOE-Circular No. 2004-06-006 of the Department ofEnergy defines QTP as an alternative service provider authorized to serve remote and unviableareas pursuant to Section 59 of the EPIRA Law. The new company intends to act as the QTP overBarangays of Semirara, Tinogboc and Alegria, all located at Semirara Island, Caluya, Antique.
SRPGCOn September 10, 2013, SRPGC was incorporated to acquire, construct, erect, assemble,rehabilitate, expand, commission, operate and maintain power-generating plants and relatedfacilities for the generation of electricity, including facilities to purchase, manufacture, develop orprocess fuel for the generation of such electricity; to sell electricity to any person or entity throughelectricity markets, by trading, or by contract; to administer, conserve and manage the electricitygenerated by power-generating plants, owned by SRPGC or by a third party, to invest in or acquirecorporations or entities engaged in any of the foregoing activities.
SBPGCOn September 9, 2013, SBPGC was incorporated to acquire, construct, erect, assemble,rehabilitate, expand, commission, operate and maintain power-generating plants and relatedfacilities for the generation of electricity, including facilities to purchase, manufacture, develop orprocess fuel for the generation of such electricity, to sell electricity to any person or entity throughelectricity markets, by trading, or by contract, to administer, conserve and manage the electricitygenerated by power-generating plants, owned by SBPGC or by a third party, to invest in oracquire corporations or entities engaged in any of the foregoing activities.
ManufacturingSCIOn November 29, 2012, SCI was incorporated to engage in, conduct, and carry on the business ofmanufacturing, buying, selling, distributing, marketing at wholesale and retail insofar as may bepermitted by law, all kinds of goods, commodities, wares and merchandise of every kind anddescription including pottery earthenware, stoneware, bricks, tiles, roofs and other merchandiseproduce from clay; to enter into all contracts for export, import, purchase requisition, sale atwholesale or retail and other disposition for its own account as principal or in representativecapacity as manufacturer’s representative, merchandise broker, indentor, commission merchant,factors or agents, upon consignment of all goods, wares, merchandise or products natural orartificial. In 2012, Semirara provided equity funding to SCI amounting P=2.50 million.
DMCI TrainingDMCI Training was registered with SEC on August 15, 2006. The primary purpose of thecompany is to establish, promote, and operate training centers and or institutions in the field ofscience, technology, vocational and other apprenticeable trades and occupations in which qualifiedand deserving persons regardless of gender may be thought, developed and trained in a well-rounded theoretical and practical method.
Changes in Accounting Policies and DisclosuresThe Group applied, for the first time, certain standards and amendments that require restatement ofprevious financial statements. These include PFRS 10, Consolidated Financial Statements,PFRS 11, Joint Arrangements, Philippine Accounting Standards (PAS) 19, Employee Benefits
- 9 -
*SGVFS007333*
(Revised 2011), PFRS 13, Fair Value Measurement and amendments to PAS 1, Presentation ofFinancial Statements. In addition, the application of PFRS 12, Disclosure of Interests in OtherEntities, resulted in additional disclosures in the consolidated financial statements.
Several other amendments apply for the first time in 2013. However, they do not impact theannual consolidated financial statements of the Group.
The nature and the impact of each new standard and amendment are described below:
· PFRS 7, Financial instruments: Disclosures - Offsetting Financial Assets and FinancialLiabilities (Amendments)These amendments require an entity to disclose information about rights of set-off and relatedarrangements (such as collateral agreements). The new disclosures are required for allrecognized financial instruments that are set off in accordance with PAS 32, FinancialInstruments: Presentation - Offsetting Financial Assets and Financial Liabilities(Amendments). These disclosures also apply to recognized financial instruments that aresubject to an enforceable master netting arrangement or ‘similar agreement’, irrespective ofwhether they are set-off in accordance with PAS 32. The amendments require entities todisclose, in a tabular format, unless another format is more appropriate, the followingminimum quantitative information. This is presented separately for financial assets andfinancial liabilities recognized at the end of the reporting period:a) The gross amounts of those recognized financial assets and recognized financial liabilities;b) The amounts that are set off in accordance with the criteria in PAS 32 when determining
the net amounts presented in the statement of financial position;c) The net amounts presented in the statement of financial position;d) The amounts subject to an enforceable master netting arrangement or similar agreement
that are not otherwise included in (b) above, including:i. Amounts related to recognized financial instruments that do not meet some or all of
the offsetting criteria in PAS 32; andii. Amounts related to financial collateral (including cash collateral); and
e) The net amount after deducting the amounts in (d) from the amounts in (c) above.
The amendment did not have an impact on the Group’s financial statements since the Group isnot setting off financial instruments and does not have offsetting arrangement.
· PFRS 10, Consolidated Financial StatementsThe Group adopted PFRS 10 in the current year. PFRS 10 replaced the portion of PAS 27,Consolidated and Separate Financial Statements, that addressed the accounting forconsolidated financial statements. It also included the issues raised in SIC 12, Consolidation -Special Purpose Entities. PFRS 10 established a single control model that applied to allentities including special purpose entities. The changes introduced by PFRS 10 requiremanagement to exercise significant judgment to determine which entities are controlled, andtherefore, are required to be consolidated by a parent, compared with the requirements thatwere in PAS 27.
The application of PFRS 10 affected the accounting for the Group’s interest in Toledo MiningCorporation (TMC). For the year ended December 31, 2012, TMC was considered to be anassociate under the previously existing PAS 28, Investments in Associates, and was accountedfor using the equity method. On December 20, 2013, the Group assessed that it controls TMCbased on the factors explained in Note 3. The assets, liabilities and equity of TMC have been
- 10 -
*SGVFS007333*
consolidated under provisional accounting in the financial statements of the Group on the datecontrol over TMC was obtained. The Group also reviewed its existing arrangement withentities which are more than 50% owned and has determined that it does not have control overthese investees (see Notes 3 and 11).
· PFRS 11, Joint ArrangementsPFRS 11 replaced PAS 31, Interests in Joint Ventures, and SIC 13, Jointly Controlled Entities- Non-Monetary Contributions by Venturers. PFRS 11 removed the option to account forjointly controlled entities using proportionate consolidation. Instead, jointly controlled entitiesthat meet the definition of a joint venture must be accounted for using the equity method.
The application of PFRS 11 impacted the Group’s accounting of its interest in a joint venture,DMCI - First Balfour (DMFB) Joint Venture (see Note 11). The Group has a 51% interest inDMFB Joint Venture. Prior to the transition to PFRS 11, DMFB Joint Venture was classifiedas a jointly controlled entity and the Group’s share of the assets, liabilities, revenue, incomeand expenses was proportionately consolidated in the consolidated financial statements. Uponadoption of PFRS 11, the Group has determined that its interest in DMFB Joint Ventureshould be classified as a joint venture under PFRS 11 and it is required to be accounted forusing the equity method (see Note 11). The transition was applied retrospectively as requiredby PFRS 11 and the opening balances at January 1, 2012 and the comparative information forthe years ended December 31. 2012 and 2011 have been restated. The effect of applyingPFRS 11 on the Group’s financial statements is as follows (amounts in thousands):
December 31,2012
January 1,2012
Total Assets P=55,010 P=75,971Total Liabilities (55,010) (75,971)
There was no impact to the comprehensive income and total equity as of December 31, 2012and 2011.
Impact on statements of cash flows is on operating activities, decreasing cash flows byP=6.08 million and increasing cash flows by P=27.70 million for the years ended December 31,2012 and 2011, respectively.
The application of PFRS 11 also impacted the Group’s accounting for its interest in ENK Plc.Prior to the transition to PFRS 11, ENK Plc. is classified as an associate of the Group andaccounted for using the equity method of accounting. Upon adoption of PFRS 11, the Grouphas determined that its interest in ENK Plc. should be classified as a joint venture underthe standard and continue to account for it using the equity method. The application affectsthe disclosures only and has no effect on the Group’s financial statements (see Notes 3and 11).
· PFRS 12, Disclosure of Interests in Other EntitiesPFRS 12 sets out the requirements for disclosures relating to an entity’s interests insubsidiaries, joint arrangements, associates and structured entities. The requirements inPFRS 12 are more comprehensive than the previously existing disclosure requirements forsubsidiaries (for example, where a subsidiary is controlled with less than a majority of votingrights). While the Group has subsidiaries with material non-controlling interests, there are nounconsolidated structured entities. PFRS 12 disclosures are provided in Notes 11 and 32.
- 11 -
*SGVFS007333*
· PFRS 13, Fair Value MeasurementPFRS 13 establishes a single source of guidance under PFRSs for all fair value measurements.PFRS 13 does not change when an entity is required to use fair value, but rather providesguidance on how to measure fair value under PFRS. PFRS 13 defines fair value as an exitprice. PFRS 13 also requires additional disclosures.
As a result of the guidance in PFRS 13, the Group re-assessed its policies for measuring fairvalues, in particular, its valuation inputs such as non-performance risk for fair valuemeasurement of liabilities. The Group has assessed that the application of PFRS 13 has notmaterially impacted the fair value measurements of the Group. Additional disclosures, whererequired, are provided in the individual notes relating to the assets and liabilities whose fairvalues were determined. Fair value hierarchy is provided in Note 36.
· PAS 1, Presentation of Financial Statements - Presentation of Items of Other ComprehensiveIncome or OCI (Amendments)The amendments to PAS 1 introduced a grouping of items presented in OCI. Items that willbe reclassified (or “recycled”) to profit or loss at a future point in time (for example, uponderecognition or settlement) will be presented separately from items that will never berecycled. The statements of comprehensive income accordingly followed the newrequirement of presentation. The amendments affect presentation only and have no impact onthe Group’s financial position or performance.
· PAS 19, Employee Benefits (Revised)On January 1, 2013, the Group adopted the Revised PAS 19 Employee Benefits.
For defined benefit plans, the Revised PAS 19 requires all actuarial gains and losses to berecognized in other comprehensive income and unvested past service costs previouslyrecognized over the average vesting period to be recognized immediately in profit or losswhen incurred.
Prior to adoption of the Revised PAS 19, the Group recognized actuarial gains and losses asincome or expense when the net cumulative unrecognized gains and losses for each individualplan at the end of the previous period exceeded 10% of the higher of the defined benefitobligation and the fair value of the plan assets and recognized unvested past service costs asan expense on a straight-line basis over the average vesting period until the benefits becomevested. Upon adoption of the Revised PAS 19, the Group changed its accounting policy torecognize all actuarial gains and losses in other comprehensive income and all past servicecosts in profit or loss in the period they occur.
The Revised PAS 19 replaced the interest cost and expected return on plan assets with theconcept of net interest on defined benefit liability or asset which is calculated by multiplyingthe net balance sheet defined benefit liability or asset by the discount rate used to measure theemployee benefit obligation, each as at the beginning of the annual period.
The Revised PAS 19 also amended the definition of short-term employee benefits and requiresemployee benefits to be classified as short-term based on expected timing of settlement ratherthan the employee’s entitlement to the benefits. In addition, the Revised PAS 19 modifies thetiming of recognition for termination benefits. The modification requires the terminationbenefits to be recognized at the earlier of when the offer cannot be withdrawn or when therelated restructuring costs are recognized.
- 12 -
*SGVFS007333*
Changes to definition of short-term employee benefits and timing of recognition fortermination benefits do not have any impact to the Group’s financial position and financialperformance.
The Group reviewed its existing employee benefit and determined that the amended standardhas significant impact on its accounting for retirement benefits. The Group obtained theservices of an external actuary to compute the impact to the consolidated financial statementsupon adoption of the standard. The effects are detailed below (amounts in thousands):
2013 2012 2011Consolidated Statement of IncomeOperating expenses P=85,400 P=56,611 P=33,703Profit before income tax (85,400) (56,611) (33,703)Income tax benefit 16,425 1,140 1,486Profit for the year (P=68,975) (P=55,471) (P=32,217)Attributable to:
Equity holders of the parent (P=65,333) (P=55,781) (P=32,497)Non-controlling interests (3,642) 310 280
Earnings per share (P=0.02) (P=0.01)
2013 2012 2011Consolidated Statement ofComprehensive IncomeRemeasurement gains P=164,272 P=237,384 P=166,533Income tax effects (20,320) (15,441) (13,637)Other comprehensive income for the year, net of tax 143,952 221,943 152,896Total comprehensive income for the year P=74,977 P=166,472 P=120,679Other comprehensive income, net of tax, attributable to:
Equity holders of the parent P=133,543 P=229,331 P=153,801Non-controlling interests 10,409 (7,388) (905)
- 13 -
*SGVFS007333*
The adoption did not have impact on consolidated statement of cash flows.
· PAS 27, Separate Financial Statements (as revised in 2011)As a consequence of the issuance of the new PFRS 10 and PFRS 12 what remains of PAS 27is limited to accounting for subsidiaries, jointly controlled entities, and associates in theseparate financial statements. The adoption of the amended PAS 27 did not have a significantimpact on the separate financial statements of the entities in the Group.
· PAS 28, Investments in Associates and Joint Ventures (as revised in 2011)As a consequence of the issuance of the new PFRS 11 and PFRS 12, PAS 28 has beenrenamed PAS 28, Investments in Associates and Joint Ventures, and describes the applicationof the equity method to investments in joint ventures in addition to associates.
· Philippine Interpretation International Financial Reporting Interpretations Committee(IFRIC) 20, Stripping Costs in the Production Phase of a Surface MineThis interpretation applies to waste removal (stripping) costs incurred in surface miningactivity, during the production phase of the mine. The interpretation addresses the accountingfor the benefit from the stripping activity. Management has assessed the impact of theinterpretation on its coal mining activities both for the open pit mining and the one underexploration and evaluation. Management has concluded that its existing accounting policy isconsistent with the requirements of the new interpretation and therefore the adoption did notimpact both the financial position and performance of the Group.
· PFRS 1, First-time Adoption of Philippine Financial Reporting Standards - GovernmentLoans (Amendments)The amendments to PFRS 1 require first-time adopters to apply the requirements of PAS 20,Accounting for Government Grants and Disclosure of Government Assistance, prospectivelyto government loans existing at the date of transition to PFRS. However, entities may chooseto apply the requirements of PAS 39, Financial Instruments: Recognition and Measurement,and PAS 20 to government loans retrospectively if the information needed to do so had beenobtained at the time of initially accounting for those loans. These amendments are notrelevant to the Group.
Annual Improvements to PFRSs (2009-2011 cycle)The Annual Improvements to PFRSs (2009-2011 cycle) contain non-urgent but necessaryamendments to PFRSs. The Group adopted these amendments for the current year.
· PFRS 1, First-time Adoption of PFRS - Borrowing CostsThe amendment clarifies that, upon adoption of PFRS, an entity that capitalized borrowingcosts in accordance with its previous generally accepted accounting principles, may carryforward, without any adjustment, the amount previously capitalized in its opening statement offinancial position at the date of transition. Subsequent to the adoption of PFRS, borrowingcosts are recognized in accordance with PAS 23, Borrowing Costs. The amendment does notapply to the Group as it is not a first-time adopter of PFRS.
- 14 -
*SGVFS007333*
· PAS 1, Presentation of Financial Statements - Clarification of the Requirements forComparative InformationThese amendments clarify the requirements for comparative information that are disclosedvoluntarily and those that are mandatory due to retrospective application of an accountingpolicy, or retrospective restatement or reclassification of items in the financial statements. Anentity must include comparative information in the related notes to the financial statementswhen it voluntarily provides comparative information beyond the minimum requiredcomparative period. The additional comparative period does not need to contain a completeset of financial statements. On the other hand, supporting notes for the third balance sheet(mandatory when there is a retrospective application of an accounting policy, or retrospectiverestatement or reclassification of items in the financial statements) are not required. As aresult, the Group has not included comparative information in respect of the opening statementof financial position as at January 1, 2012. The Group presented comparative information inthe notes for the impact of adoption of the Revised PAS 19 (see Note 23).
· PAS 16, Property, Plant and Equipment - Classification of Servicing EquipmentThe amendment clarifies that spare parts, stand-by equipment and servicing equipment shouldbe recognized as property, plant and equipment when they meet the definition of property,plant and equipment and should be recognized as inventory if otherwise. The amendmentdoes not have any significant impact on the Group’s financial position or performance. TheGroup does not expect the adoption of the standards and interpretations to have a significantimpact on its financial statements unless otherwise indicated.
· PAS 32, Financial Instruments: Presentation - Tax Effect of Distribution to Holders of EquityInstrumentsThe amendment clarifies that income taxes relating to distributions to equity holders and totransaction costs of an equity transaction are accounted for in accordance with PAS 12,Income Taxes. The amendment does not have any significant impact on the Group’s financialposition or performance.
· PAS 34, Interim Financial Reporting - Interim Financial Reporting and Segment Informationfor Total Assets and LiabilitiesThe amendment clarifies that the total assets and liabilities for a particular reportable segmentneed to be disclosed only when the amounts are regularly provided to the chief operatingdecision maker and there has been a material change from the amount disclosed in the entity’sprevious annual financial statements for that reportable segment. The amendment affectsdisclosures only and has no impact on the Group’s financial position or performance.
Standards and Interpretation Issued but not yet EffectiveThe Group has not adopted the following PFRS and Philippine Interpretations which are not yeteffective as of December 31, 2013. The Group will adopt these standards when they becomeeffective. The Group does not expect the adoption of these standards to have a significant impactin the consolidated financial statements, unless otherwise stated.
· PAS 36, Impairment of Assets - Recoverable Amount Disclosures for Non-Financial Assets(Amendments)These amendments remove the unintended consequences of PFRS 13 on the disclosuresrequired under PAS 36. In addition, these amendments require disclosure of the recoverableamounts for the assets or cash-generating units for which impairment loss has been recognized
- 15 -
*SGVFS007333*
or reversed during the period. These amendments are effective retrospectively for annualperiods beginning on or after January 1, 2014 with earlier application permitted, providedPFRS 13 is also applied. The amendments affect disclosures only and have no impact on theGroup’s financial position or performance.
· Investment Entities (Amendments to PFRS 10, PFRS 12 and PAS 27)These amendments are effective for annual periods beginning on or after January 1, 2014.They provide an exception to the consolidation requirement for entities that meet thedefinition of an investment entity under PFRS 10. The exception to consolidation requiresinvestment entities to account for subsidiaries at fair value through profit or loss. It is notexpected that this amendment would be relevant to the Group since none of the entities in theGroup would qualify to be an investment entity under PFRS 10.
· Philippine Interpretation IFRIC 21, LeviesIFRIC 21 clarifies that an entity recognizes a liability for a levy when the activity that triggerspayment, as identified by the relevant legislation, occurs. For a levy that is triggered uponreaching a minimum threshold, the interpretation clarifies that no liability should beanticipated before the specified minimum threshold is reached. IFRIC 21 is effective forannual periods beginning on or after January 1, 2014. The Group does not expect thatIFRIC 21 will have material financial impact in future financial statements.
· PAS 39, Financial Instruments: Recognition and Measurement - Novation of Derivatives andContinuation of Hedge Accounting (Amendments)These amendments provide relief from discontinuing hedge accounting when novation of aderivative designated as a hedging instrument meets certain criteria. These amendments areeffective for annual periods beginning on or after January 1, 2014. The Company has noderivatives designated as hedging instrument and derivatives novated as of the financialreporting period.
· PAS 32, Financial Instruments: Presentation - Offsetting Financial Assets and FinancialLiabilities (Amendments)The amendments clarify the meaning of “currently has a legally enforceable right to set-off”and also clarify the application of the PAS 32 offsetting criteria to settlement systems (such ascentral clearing house systems) which apply gross settlement mechanisms that are notsimultaneous. The amendments affect presentation only and have no impact on the Group’sfinancial position or performance. The amendments to PAS 32 are to be retrospectivelyapplied for annual periods beginning on or after January 1, 2014.
· PAS 19, Employee Benefits - Defined Benefit Plans: Employee Contributions (Amendments)The amendments apply to contributions from employees or third parties to defined benefitplans. Contributions that are set out in the formal terms of the plan shall be accounted for asreductions to current service costs if they are linked to service or as part of theremeasurements of the net defined benefit asset or liability if they are not linked to service.Contributions that are discretionary shall be accounted for as reductions of current service costupon payment of these contributions to the plans. The amendments to PAS 19 are to beretrospectively applied for annual periods beginning on or after July 1, 2014. The amendmenthas no significant impact on the Company’s financial position and performance since theemployees are not required to make contribution to the Company’s retirement fund.
- 16 -
*SGVFS007333*
Annual Improvements to PFRSs (2010-2012 cycle)The Annual Improvements to PFRSs (2010-2012 cycle) contain non-urgent but necessaryamendments to the following standards:
· PFRS 2, Share-based Payment - Definition of Vesting ConditionThe amendment revised the definitions of vesting condition and market condition and addedthe definitions of performance condition and service condition to clarify various issues. Thisamendment shall be prospectively applied to share-based payment transactions for which thegrant date is on or after July 1, 2014. This amendment does not apply to the Group as it hasno share-based payments.
· PFRS 3, Business Combinations - Accounting for Contingent Consideration in a BusinessCombinationThe amendment clarifies that a contingent consideration that meets the definition of a financialinstrument should be classified as a financial liability or as equity in accordance with PAS 32.Contingent consideration that is not classified as equity is subsequently measured at fair valuethrough profit or loss whether or not it falls within the scope of PAS 39. The amendment shallbe prospectively applied to business combinations for which the acquisition date is on or afterJuly 1, 2014. The Group shall consider this amendment for future business combinations.
· PFRS 8, Operating Segments - Aggregation of Operating Segments and Reconciliation of theTotal of the Reportable Segments’ Assets to the Entity’s AssetsThe amendments require entities to disclose the judgment made by management inaggregating two or more operating segments. This disclosure should include a briefdescription of the operating segments that have been aggregated in this way and the economicindicators that have been assessed in determining that the aggregated operating segments sharesimilar economic characteristics. The amendments also clarify that an entity shall providereconciliations of the total of the reportable segments’ assets to the entity’s assets if suchamounts are regularly provided to the chief operating decision maker. These amendments areeffective for annual periods beginning on or after July 1, 2014 and are applied retrospectively.The amendments have no impact on the Group’s financial position or performance.
· PFRS 13, Fair Value Measurement - Short-term Receivables and PayablesThe amendment clarifies that short-term receivables and payables with no stated interest ratescan be held at invoice amounts when the effect of discounting is immaterial.
· PAS 16, Property, Plant and Equipment - Revaluation Method - Proportionate Restatement ofAccumulated DepreciationThe amendment clarifies that, upon revaluation of an item of property, plant and equipment,the carrying amount of the asset shall be adjusted to the revalued amount, and the asset shallbe treated in one of the following ways:a) The gross carrying amount is adjusted in a manner that is consistent with the revaluation
of the carrying amount of the asset. The accumulated depreciation at the date ofrevaluation is adjusted to equal the difference between the gross carrying amount and thecarrying amount of the asset after taking into account any accumulated impairment losses.
b) The accumulated depreciation is eliminated against the gross carrying amount of the asset.
- 17 -
*SGVFS007333*
The amendment is effective for annual periods beginning on or after July 1, 2014. Theamendment shall apply to all revaluations recognized in annual periods beginning on or afterthe date of initial application of this amendment and in the immediately preceding annualperiod. The amendment has no impact on the Group’s financial position or performance.
· PAS 24, Related Party Disclosures - Key Management PersonnelThe amendments clarify that an entity is a related party of the reporting entity if the saidentity, or any member of a group for which it is a part of, provides key management personnelservices to the reporting entity or to the parent company of the reporting entity. Theamendments also clarify that a reporting entity that obtains management personnel servicesfrom another entity (also referred to as management entity) is not required to disclose thecompensation paid or payable by the management entity to its employees or directors. Thereporting entity is required to disclose the amounts incurred for the key management personnelservices provided by a separate management entity. The amendments are effective for annualperiods beginning on or after July 1, 2014 and are applied retrospectively. The amendmentsaffect disclosures only and have no impact on the Group’s financial position or performance.
· PAS 38, Intangible Assets - Revaluation Method - Proportionate Restatement of AccumulatedAmortizationThe amendments clarify that, upon revaluation of an intangible asset, the carrying amount ofthe asset shall be adjusted to the revalued amount, and the asset shall be treated in one of thefollowing ways:a) The gross carrying amount is adjusted in a manner that is consistent with the revaluation
of the carrying amount of the asset. The accumulated amortization at the date ofrevaluation is adjusted to equal the difference between the gross carrying amount and thecarrying amount of the asset after taking into account any accumulated impairment losses.
b) The accumulated amortization is eliminated against the gross carrying amount of the asset.
The amendments also clarify that the amount of the adjustment of the accumulatedamortization should form part of the increase or decrease in the carrying amount accounted forin accordance with the standard.
The amendments are effective for annual periods beginning on or after July 1, 2014. Theamendments shall apply to all revaluations recognized in annual periods beginning on or afterthe date of initial application of this amendment and in the immediately preceding annualperiod. The amendments have no impact on the Group’s financial position or performance.
Annual Improvements to PFRSs (2011-2013 cycle)The Annual Improvements to PFRSs (2011-2013 cycle) contain non-urgent but necessaryamendments to the following standards:
· PFRS 1, First-time Adoption of Philippine Financial Reporting Standards - Meaning of‘Effective PFRSs’The amendment clarifies that an entity may choose to apply either a current standard or a newstandard that is not yet mandatory, but that permits early application, provided either standardis applied consistently throughout the periods presented in the entity’s first PFRS financialstatements. This amendment is not applicable to the Group as it is not a first-time adopter ofPFRS.
- 18 -
*SGVFS007333*
· PFRS 3, Business Combinations - Scope Exceptions for Joint ArrangementsThe amendment clarifies that PFRS 3 does not apply to the accounting for the formation of ajoint arrangement in the financial statements of the joint arrangement itself. The amendmentis effective for annual periods beginning on or after July 1, 2014 and is applied prospectively.
· PFRS 13, Fair Value Measurement - Portfolio ExceptionThe amendment clarifies that the portfolio exception in PFRS 13 can be applied to financialassets, financial liabilities and other contracts. The amendment is effective for annual periodsbeginning on or after July 1, 2014 and is applied prospectively. The amendment has nosignificant impact on the Group’s financial position or performance.
· PAS 40, Investment PropertyThe amendment clarifies the interrelationship between PFRS 3 and PAS 40 when classifyingproperty as investment property or owner-occupied property. The amendment stated thatjudgment is needed when determining whether the acquisition of investment property is theacquisition of an asset or a group of assets or a business combination within the scope ofPFRS 3. This judgment is based on the guidance of PFRS 3. This amendment is effective forannual periods beginning on or after July 1, 2014 and is applied prospectively. Theamendment has no significant impact on the Group’s financial position or performance.
· PFRS 9, Financial InstrumentsPFRS 9, as issued, reflects the first and third phases of the project to replace PAS 39 andapplies to the classification and measurement of financial assets and liabilities and hedgeaccounting, respectively. Work on the second phase, which relate to impairment of financialinstruments, and the limited amendments to the classification and measurement model is stillongoing, with a view to replace PAS 39 in its entirety. PFRS 9 requires all financial assets tobe measured at fair value at initial recognition. A debt financial asset may, if the fair valueoption (FVO) is not invoked, be subsequently measured at amortized cost if it is held within abusiness model that has the objective to hold the assets to collect the contractual cash flowsand its contractual terms give rise, on specified dates, to cash flows that are solely payments ofprincipal and interest on the principal outstanding. All other debt instruments aresubsequently measured at fair value through profit or loss. All equity financial assets aremeasured at fair value either through OCI or profit or loss. Equity financial assets held fortrading must be measured at fair value through profit or loss. For liabilities designated as atFVPL using the fair value option, the amount of change in the fair value of a liability that isattributable to changes in credit risk must be presented in OCI. The remainder of the changein fair value is presented in profit or loss, unless presentation of the fair value change relatingto the entity’s own credit risk in OCI would create or enlarge an accounting mismatch in profitor loss. All other PAS 39 classification and measurement requirements for financial liabilitieshave been carried forward to PFRS 9, including the embedded derivative bifurcation rules andthe criteria for using the FVO. The adoption of the first phase of PFRS 9 will have an effecton the classification and measurement of the Group’s financial assets, but will potentially haveno impact on the classification and measurement of financial liabilities.
On hedge accounting, PFRS 9 replaces the rules-based hedge accounting model of PAS 39with a more principles-based approach. Changes include replacing the rules-based hedgeeffectiveness test with an objectives-based test that focuses on the economic relationshipbetween the hedged item and the hedging instrument, and the effect of credit risk on thateconomic relationship; allowing risk components to be designated as the hedged item, not only
- 19 -
*SGVFS007333*
for financial items, but also for non-financial items, provided that the risk component isseparately identifiable and reliably measurable; and allowing the time value of an option, theforward element of a forward contract and any foreign currency basis spread to be excludedfrom the designation of a financial instrument as the hedging instrument and accounted for ascosts of hedging. PFRS 9 also requires more extensive disclosures for hedge accounting.
PFRS 9 currently has no mandatory effective date. PFRS 9 may be applied before thecompletion of the limited amendments to the classification and measurement model andimpairment methodology. The Group will not adopt the standard before the completion of thelimited amendments and the second phase of the project.
In compliance with SEC Memorandum Circular No. 3, Series of 2012, the Group hasconducted a study on the impact of an early adoption of PFRS 9. After careful considerationof the results on the impact evaluation, the Group has decided not to early adopt PFRS 9 for its2013 annual financial reporting. Therefore, these consolidated financial statements do notreflect the impact of the said standard.
· Philippine Interpretation IFRIC 15, Agreements for the Construction of Real EstateThis interpretation covers accounting for revenue and associated expenses by entities thatundertake the construction of real estate directly or through subcontractors. The interpretationrequires that revenue on construction of real estate be recognized only upon completion,except when such contract qualifies as construction contract to be accounted for underPAS 11, Construction Contracts, or involves rendering of services in which case revenue isrecognized based on stage of completion. Contracts involving provision of services with theconstruction materials and where the risks and reward of ownership are transferred to thebuyer on a continuous basis will also be accounted for based on stage of completion. TheSEC and the Financial Reporting Standards Council have deferred the effectivity of thisinterpretation until the final Revenue standard is issued by the International AccountingStandards Board and an evaluation of the requirements of the final Revenue standard againstthe practices of the Philippine real estate industry is completed.
Significant Accounting Policies
Cash and Cash EquivalentsCash includes cash on hand and in banks. Cash equivalents are short-term, highly liquidinvestments that are readily convertible to known amounts of cash with original maturities of threemonths or less from the date of placement and that are subject to an insignificant risk of changes invalue.
Financial InstrumentsDate of RecognitionThe Group recognizes a financial asset or a financial liability in the consolidated statement offinancial position when it becomes a party to the contractual provisions of the instrument.Purchases or sales of financial assets that require delivery of assets within the time frameestablished by regulation or convention in the marketplace are recognized on the settlement date.
Initial Recognition of Financial InstrumentsAll financial assets and financial liabilities are initially recognized at fair value. Except forfinancial assets at FVPL, the initial measurement of financial assets includes transaction costs.The Group classifies its financial assets in the following categories: financial assets at FVPL, held-to-maturity (HTM) investments, AFS financial assets, and loans and receivables. The Group
- 20 -
*SGVFS007333*
classifies its financial liabilities as financial liabilities at FVPL and other financial liabilities. Theclassification depends on the purpose for which the investments were acquired and whether theseare quoted in an active market. Management determines the classification of its investments atinitial recognition and, where allowed and appropriate, re-evaluates such designation at everyreporting date.
Financial instruments are classified as liabilities or equity in accordance with the substance of thecontractual arrangement. Interest, dividends, gains and losses relating to a financial instrument ora component that is a financial liability, are reported as expense or income. Distributions toholders of financial instruments classified as equity are charged directly to equity net of anyrelated income tax benefits.
The Group’s financial instruments are classified as AFS financial assets, financial assets at FVPL,loans and receivables and other financial liabilities.
Fair Value MeasurementThe Group measures financial instruments at fair value at each reporting date. Also, fair values offinancial instruments measured at amortized cost and non-financial assets measured at cost such asinvestment properties are disclosed in Notes 12 and 36.
Fair value is the price that would be received to sell an asset or paid to transfer a liability in anorderly transaction between market participants at the measurement date. The fair valuemeasurement is based on the presumption that the transaction to sell the asset or transfer theliability takes place either:· In the principal market for the asset or liability, or· In the absence of a principal market, in the most advantageous market for the asset or liability.
The principal or the most advantageous market must be accessible to by the Group.
The fair value of an asset or a liability is measured using the assumptions that market participantswould use when pricing the asset or liability, assuming that market participants act in theireconomic best interest.
A fair value measurement of a non-financial asset takes into account a market participant's abilityto generate economic benefits by using the asset in its highest and best use or by selling it toanother market participant that would use the asset in its highest and best use.
The Group uses valuation techniques that are appropriate in the circumstances and for whichsufficient data are available to measure fair value, maximizing the use of relevant observableinputs and minimizing the use of unobservable inputs.
All assets and liabilities for which fair value is measured or disclosed in the financial statementsare categorized within the fair value hierarchy based on the lowest level input that is significant tothe fair value measurement as a whole:· Level 1 - Quoted (unadjusted) market prices in active markets for identical assets or liabilities· Level 2 - Valuation techniques for which the lowest level input that is significant to the fair
value measurement is directly or indirectly observable· Level 3 - Valuation techniques for which the lowest level input that is significant to the fair
value measurement is unobservable
- 21 -
*SGVFS007333*
For assets and liabilities that are recognized in the financial statements on a recurring basis, theGroup determines whether transfers have occurred between Levels in the hierarchy by re-assessingcategorization (based on the lowest level input that is significant to the fair value measurement asa whole) at the end of each reporting period.
For the purpose of fair value disclosures, the Group has determined classes of assets and liabilitieson the basis of the nature, characteristics and risks of the asset or liability and the level of the fairvalue hierarchy as explained above.
Day 1 DifferenceWhere the transaction price in a non-active market is different to the fair value from otherobservable current market transactions in the same instrument or based on a valuation techniquewhose variables include only data from observable market, the Group recognizes the differencebetween the transaction price and fair value (a “Day 1” difference) in the consolidated statementof income under “Finance income” and “Finance costs” unless it qualifies for recognition as someother type of asset or liability. In cases where the valuation technique used is made of data whichis not observable, the difference between the transaction price and model value is only recognizedin the consolidated statement of income when the inputs become observable or when theinstrument is derecognized. For each transaction, the Group determines the appropriate method ofrecognizing the ‘Day 1’ difference amount.
Financial Assets and Financial Liabilities at FVPLFinancial assets and financial liabilities at FVPL include financial assets and financial liabilitiesheld for trading and financial assets and financial liabilities designated upon initial recognition asat FVPL.
Financial assets are classified as held for trading if they are acquired for the purpose of selling orrepurchasing in the near term. Financial assets or financial liabilities held for trading are recordedin the consolidated statement of financial position at fair value. Changes in fair value relating tothe held for trading positions are recognized in “Other income - net” account in the consolidatedstatement of income. Interest earned or incurred is recorded in interest income or expense,respectively, while dividend income is recorded when the right to receive payment has beenestablished.
Financial assets may be designated at initial recognition as at FVPL if any of the following criteria are met:
· The designation eliminates or significantly reduces the inconsistent treatment that wouldotherwise arise from measuring the assets or liabilities or recognizing gains or losses on themon a different basis; or
· The assets are part of a group of financial assets which are managed and their performanceevaluated on a fair value basis, in accordance with a documented risk management orinvestment strategy; or
· The financial instrument contains an embedded derivative that would need to be separatelyrecorded.
The Group’s financial asset at FVPL pertains to investment in quoted equity securities(see Note 5). The Group does not have any financial liability at FVPL.
- 22 -
*SGVFS007333*
Loans and ReceivablesLoans and receivables are nonderivative financial assets with fixed or determinable payments andfixed maturities that are not quoted in an active market. These are not entered into with theintention of immediate or short-term resale and are not designated as financial assets at FVPL orAFS financial assets. These are included in current assets if maturity is within 12 months from thereporting date; otherwise, these are classified as noncurrent assets. This accounting policy relatesto the consolidated statement of financial position captions “Cash and cash equivalents”,“Receivables”, “Noncurrent receivables” and refundable and security deposits included under“Other noncurrent assets”.
After initial measurement, loans and receivables are subsequently measured at amortized costusing the effective interest method, less allowance for impairment. Amortized cost is calculatedby taking into account any discount or premium on acquisition and fees that are an integral part ofthe effective interest rate (EIR) and transaction costs. The amortization is included in “Financeincome” in the consolidated statement of income. The losses arising from impairment of suchloans and receivables are recognized under “Other expenses” in the consolidated statement ofincome.
AFS Financial AssetsAFS financial assets are those which are designated as such or do not qualify to be classified ordesignated as at FVPL, HTM or loans and receivables. After initial measurement, AFS financialassets are measured at fair value with unrealized gains or losses being recognized in theconsolidated statement of comprehensive income and are reported as “Net accumulated unrealizedgains (losses) on AFS financial assets” in equity. When the investment is disposed of, thecumulative gain or loss previously recorded in equity is recognized in the consolidated statementof income. Interest earned or paid on the investments is reported as interest income or expenseusing the EIR. Dividends earned on investments are recognized in the consolidated statement ofincome when the right to receive payment has been established. The losses arising fromimpairment of such investments are recognized under “Other expenses” in the consolidatedstatement of income.
AFS financial assets are classified as current asset if verified to be realized within 12 months fromreporting date.
When the fair value of AFS financial assets cannot be measured reliably because of lack ofreliable estimates of future cash flows and discount rates necessary to calculate the fair values ofunquoted equity instruments, then instruments are carried at cost less any allowance forimpairment losses.
The Group’s AFS financial assets pertain to quoted and unquoted equity securities (Note 6).
Other Financial LiabilitiesIssued financial instruments or their components, which are not designated as at FVPL areclassified as other financial liabilities where the substance of the contractual arrangement results inthe Group having an obligation either to deliver cash or another financial asset to the holder, or tosatisfy the obligation other than by the exchange of a fixed amount of cash or another financialasset for a fixed number of own equity shares. The components of issued financial instrumentsthat contain both liability and equity elements are accounted for separately, with the equitycomponent being assigned the residual amount after deducting from the instrument as a whole theamount separately determined as the fair value of the liability component on the date of issue.
- 23 -
*SGVFS007333*
After initial measurement, other financial liabilities are subsequently measured at amortized costusing the effective interest method. Amortized cost is calculated by taking into account anydiscount or premium on the issue and fees that are integral parts of the EIR. Any effects ofrestatement of foreign currency-denominated liabilities are recognized in the consolidatedstatement of income.
Other financial liabilities relate to the consolidated statement of financial position captions,“Accounts and other payables”, “Liabilities for purchased land”, “Payable to related parties”,“Short-term and Long-term debt” and “Other noncurrent liabilities”.
Gains and losses are recognized under the “Other income” and “Other expense” accounts in theconsolidated statement of income when the liabilities are derecognized or impaired, as well asthrough the amortization process.
Deferred Financing CostsDeferred financing costs represent debt issue costs arising from the fees incurred to obtain projectfinancing. This is included in the initial measurement of the related debt. The deferred financingcosts are treated as a discount on the related debt and are amortized using the effective interestmethod over the term of the related debt.
Customers’ Advances and DepositsCustomers’ advances and deposits represent payment from buyers which have not yet reached theminimum required percentage for recording real estate transactions. When the level of requiredpayment is reached and the revenue recognition criteria is met, sales are recognized and thesedeposits and downpayments will be applied against the related receivables.
Impairment of Financial AssetsThe Group assesses at each reporting date whether there is objective evidence that a financial assetor group of financial assets is impaired. A financial asset or a group of financial assets is deemedto be impaired if, and only if, there is objective evidence of impairment as a result of one or moreevents that has occurred after the initial recognition of the asset (an incurred ‘loss event’) and thatloss event (or events) has an impact on the estimated future cash flows of the financial asset or thegroup of financial assets that can be reliably estimated. Evidence of impairment may includeindications that the borrower or a group of borrowers is experiencing significant financialdifficulty, default or delinquency in interest or principal payments, the probability that they willenter bankruptcy or other financial reorganization and where observable data indicate that there ismeasurable decrease in the estimated future cash flows, such as changes in arrears or economicconditions that correlate with defaults.
Loans and ReceivablesFor loans and receivables carried at amortized cost, the Group first assesses whether objectiveevidence of impairment exists individually for financial assets that are individually significant, orcollectively for financial assets that are not individually significant. If the Group determines thatno objective evidence of impairment exists for individually assessed financial asset, whethersignificant or not, it includes the asset in a group of financial assets with similar credit riskcharacteristics and collectively assesses for impairment. Those characteristics are relevant to theestimation of future cash flows for groups of such assets by being indicative of the debtors’ abilityto pay all amounts due according to the contractual terms of the assets being evaluated. Assetsthat are individually assessed for impairment and for which an impairment loss is, or continues tobe, recognized are not included in a collective assessment for impairment.
- 24 -
*SGVFS007333*
If there is objective evidence that an impairment loss has been incurred, the amount of the loss ismeasured as the difference between the asset’s carrying amount and the present value of theestimated future cash flows (excluding future credit losses that have not been incurred) discountedat the financial assets’ original EIR (i.e., the EIR computed at initial recognition). The carryingamount of the asset is reduced through the use of an allowance account and the amount of loss ischarged to the consolidated statement of income during the period in which it arises. Interestincome continues to be recognized based on the original EIR of the asset. Receivables, togetherwith the associated allowance accounts, are written off when there is no realistic prospect of futurerecovery and all collateral has been realized.
If, in a subsequent year, the amount of the estimated impairment loss decreases because of anevent occurring after the impairment was recognized, the previously recognized impairment loss isreversed. Any subsequent reversal of an impairment loss is recognized in the consolidatedstatement of income, to the extent that the carrying value of the asset does not exceed its amortizedcost at the reversal date.
For the purpose of a collective evaluation of impairment, financial assets are grouped on the basisof such credit risk characteristics as industry, customer type, customer location, past-due statusand term. Future cash flows in a group of financial assets that are collectively evaluated forimpairment are estimated on the basis of historical loss experience for assets with credit riskcharacteristics similar to those in the group. Historical loss experience is adjusted on the basis ofcurrent observable data to reflect the effects of current conditions that did not affect the period onwhich the historical loss experience is based and to remove the effects of conditions in thehistorical period that do not exist currently. The methodology and assumptions used forestimating future cash flows are reviewed annually by the Group to reduce any differencesbetween loss estimates and actual loss experience.
Financial Assets Carried at CostIf there is an objective evidence that an impairment loss has been incurred on an unquoted equityinstrument that is not carried at fair value because its fair value cannot be reliably measured, theamount of the loss is measured as the difference between the carrying amount and the presentvalue of estimated future cash flows discounted at the current market rate of return for a similarfinancial asset.
AFS Financial AssetsFor AFS financial assets, the Group assesses at each reporting date whether there is objectiveevidence that a financial asset or group of financial assets is impaired.
In case of equity investments classified as AFS financial assets, impairment would include asignificant or prolonged decline in the fair value of the investments below its cost. Where there isevidence of impairment, the cumulative loss - measured as the difference between the acquisitioncost and the current fair value, less any impairment loss on that financial asset previouslyrecognized in the consolidated statement of income - is removed from equity and recognized in theconsolidated statement of income under “Other expenses” account. Impairment losses on equityinvestments are not reversed through the consolidated statement of income. Increases in fair valueafter impairment are recognized directly in the consolidated statement of comprehensive income.
Offsetting Financial InstrumentsFinancial assets and financial liabilities are only offset and the net amount reported in theconsolidated statement of financial position when there is a legally enforceable right to set off therecognized amounts and the Group intends to either settle on a net basis, or to realize the asset andsettle the liability simultaneously.
- 25 -
*SGVFS007333*
Derecognition of Financial Assets and LiabilitiesFinancial AssetA financial asset (or, where applicable a part of a financial asset or part of a group of similarfinancial assets) is derecognized when:· the rights to receive cash flows from the asset have expired;· the Group has transferred its rights to receive cash flows from the asset and either has assumed
an obligation to pay them in full without material delay to a third party under a ‘pass through’arrangement; or: (a) has transferred substantially all the risks and rewards of the asset, or (b)has neither transferred nor retained substantially all the risks and rewards of the asset, but hastransferred control of the asset.
Where the Group has transferred its rights to receive cash flows from an asset and has neithertransferred nor retained substantially all the risk and rewards of the asset nor transferred control ofthe asset, the asset is recognized to the extent of the Group’s continuing involvement in the asset.Continuing involvement that takes the form of a guarantee over the transferred asset is measuredat the lower of the carrying amount of the asset and the maximum amount of consideration that theGroup could be required to repay.
Financial LiabilityA financial liability is derecognized when the obligation under the liability is discharged orcanceled or has expired.
Where an existing financial liability is replaced by another from the same lender on substantiallydifferent terms, or the terms of an existing liability are substantially modified, such an exchange ormodification is treated as a derecognition of the original liability and the recognition of a newliability, and the difference in the respective carrying amounts is recognized in the consolidatedstatement of income.
Embedded DerivativeThe Group assesses the existence of an embedded derivative on the date it first becomes a party tothe contract, and performs re-assessment where there is a change to the contract that significantlymodifies the cash flows.
Embedded derivatives are bifurcated from their host contracts and carried at fair value with fairvalue changes being reported through consolidated statement of income, when the entire hybridcontracts (composed of both the host contract and the embedded derivative) are not accounted foras financial instruments designated at FVPL; when their economic risks and characteristics are notclearly and closely related to those of their respective host contracts; and when a separateinstrument with the same terms as the embedded derivative would meet the definition of aderivative.
As of December 31, 2013 and 2012, the Group’s identified embedded derivatives consists ofprepayment options that are not required to be bifurcated from the host instruments as these wereassessed to be clearly and closely related to the host contracts.
- 26 -
*SGVFS007333*
InventoriesReal Estate Held for Sale and DevelopmentProperty acquired or being constructed for sale in the ordinary course of business, rather than to beheld for rental or capital appreciation, is held as inventory and is measured at the lower of cost andnet realizable value (NRV).
Cost includes:· Land cost· Amounts paid to contractors for construction· Borrowing costs, planning and design costs, costs of site preparation, professional fees,
property transfer taxes, construction overheads and other related costs
NRV is the estimated selling price in the ordinary course of the business, based on market pricesat the reporting date, less estimated costs of completion and the estimated costs of sale.
Real estate inventories consist of housing units for sale and development and condominium unitsfor sale.
Housing units for sale and development are carried at the lower of cost or NRV. Cost includes theacquisition costs of the land plus the costs incurred for the construction, development andimprovement of the real estate projects. NRV is the estimated selling price in the ordinary courseof business less estimated costs of completion and the estimated costs necessary to make the sale.
Condominium units for sale are also carried at the lower of cost or NRV. Costs include costsincurred for development, improvement and construction of condominium units.
Valuation allowance is provided for housing units for sale and development, condominium unitsfor sale and development and undeveloped land when the NRV of the properties are less than theircarrying amounts.
Coal InventoryThe cost of coal inventory is determined using the weighted average production cost method. Thecost of extracted coal includes all stripping costs and other mine related costs incurred during theperiod and allocated on per metric ton basis by dividing the total production cost with the totalvolume of coal produced. Except for shiploading cost, which is a component of total minesitecost, all other costs are charged to production cost.
Materials-in-TransitCost is determined using the specific identification basis.
Equipment Parts and SuppliesThe cost of equipment parts, materials and supplies is determined principally by the average costmethod (either by moving average or weighted average production cost).
Equipment parts and supplies are transferred from inventories to property, plant and equipmentwhen the use of such supplies is expected to extend the useful life of the asset and increase itseconomic benefit. Transfers between inventories to property, plant and equipment do not changethe carrying amount of the inventories transferred and they do not change the cost of thatinventory for measurement or disclosure purposes.
- 27 -
*SGVFS007333*
Equipment parts and supplies used for repairs and maintenance of the equipment are recognized inthe consolidated statements of income when consumed.
Nickel Ore and Chromites InventoryThe cost of extracted nickel ore and chromites includes all direct materials, labor, fuel, outsideservices and other mine-related costs incurred during the period and allocated on per metric tonbasis by dividing the total production cost with total volume of nickel ore produced. Except forshiploading cost, which is a component of total cost of sales, all other production related costs arecharged to production cost.
Investments in Associates, Joint Controlled Entity and OthersAn associate is an entity in which the Group has significant influence and which is neither asubsidiary nor a joint venture. Significant influence is the power to participate in the financial andoperating policy decisions of the investee, but is not control or joint control over those policies.
A joint venture is a type of joint arrangement whereby the parties that have joint control of thearrangement have rights to the net assets of the joint venture. Joint control is the contractuallyagreed sharing of control of an arrangement, which exists only when decisions about the relevantactivities require unanimous consent of the parties sharing control.
The considerations made in determining significant influence or joint control are similar to thosenecessary to determine control over subsidiaries. The Group’s investments in its associate andjoint venture are accounted for using the equity method.
Under the equity method, the investments in an associate or a joint venture is initially recognizedat cost. The carrying amount of the investment is adjusted to recognize changes in the Group’sshare of net assets of the associate or joint venture since the acquisition date. Goodwill relating tothe associate or joint venture is included in the carrying amount of the investment and is neitheramortized nor individually tested for impairment.
The consolidated statement of income reflects the Group’s share of the results of operations of theassociate or joint venture. Any change in OCI of those investees is presented as part of theGroup’s OCI. In addition, when there has been a change recognized directly in the equity of theassociate or joint venture, the Group recognizes its share of any changes, when applicable, in thestatement of changes in equity. Unrealized gains and losses resulting from transactions betweenthe Group and the associate or joint venture are eliminated to the extent of the interest in theassociate or joint venture.
The aggregate of the Group’s share of profit or loss of an associate and a joint venture is shown onthe face of the consolidated statement of income outside operating profit and represents profit orloss after tax and non-controlling interests in the subsidiaries of the associate or joint venture.
The financial statements of the associate or joint venture are prepared for the same reportingperiod as the Group. When necessary, adjustments are made to bring the accounting policies inline with those of the Group.
After application of the equity method, the Group determines whether it is necessary to recognizean impairment loss on its investment in its associate or joint venture. At each reporting date, theGroup determines whether there is objective evidence that the investment in the associate or jointventure is impaired. If there is such evidence, the Group calculates the amount of impairment as
- 28 -
*SGVFS007333*
the difference between the recoverable amount of the associate or joint venture and its carryingvalue, then recognizes the loss as ‘Share of profit of an associate and a joint venture’ in theconsolidated statement of income.
Upon loss of significant influence over the associate or joint control over the joint venture, theGroup measures and recognizes any retained investment at its fair value. Any difference betweenthe carrying amount of the associate or joint venture upon loss of significant influence or jointcontrol and the fair value of the retained investment and proceeds from disposal is recognized inconsolidated statement of income.
Investment PropertiesInvestment properties comprise completed property and property under construction orredevelopment that are held to earn rentals or capital appreciation or both and that are notoccupied by the companies in the Group. Investment properties are measured initially at cost,including transaction costs. Subsequent to initial recognition, investment properties, except land,are stated at cost less accumulated depreciation and amortization and any impairment in value.Land is stated at cost less any impairment in value. The carrying amount includes the cost ofreplacing part of an existing investment property at the time that cost is incurred if the recognitioncriteria are met and excludes the costs of day-to-day servicing of an investment property.
Investment properties are derecognized when either they have been disposed of or when theinvestment property is permanently withdrawn from use and no future economic benefit isexpected from its disposal. The difference between the net disposal proceeds and the carryingamount of the asset is recognized in the consolidated statement of income in the period ofderecognition.
Depreciation and amortization is calculated on a straight-line basis using the following estimateduseful lives (EUL) from the time of acquisition of the investment properties:
YearsBuildings and building improvements 5-25Condominium units 25
The assets’ residual value, useful life and depreciation and amortization methods are reviewedperiodically to ensure that the period and method of depreciation and amortizations are consistentwith the expected pattern of economic benefits from items of investment properties.
A transfer is made to investment property when there is a change in use, evidenced by ending ofowner-occupation, commencement of an operating lease to another party or ending of constructionor development. A transfer is made from investment property when and only when there is achange in use, evidenced by commencement of owner-occupation or commencement ofdevelopment with a view to sale. A transfer between investment property, owner-occupiedproperty and inventory does not change the carrying amount of the property transferred nor does itchange the cost of that property for measurement or disclosure purposes.
Exploration and Evaluation AssetExploration and evaluation activity involves the search for mineral resources, the determination oftechnical feasibility and the assessment of commercial viability of an identified resource.
- 29 -
*SGVFS007333*
Exploration and evaluation activity includes:· Researching and analyzing historical exploration data· Gathering exploration data through geophysical studies· Exploratory drilling and sampling· Determining and examining the volume and grade of the resource· Surveying transportation and infrastructure requirements· Conducting market and finance studies
License costs paid in connection with a right to explore in an existing exploration area arecapitalized and amortized over the term of the permit.
Once the legal right to explore has been acquired, exploration and evaluation expenditure ischarged to consolidated statement of comprehensive income as incurred, unless the Group’smanagement concludes that a future economic benefit is more likely than not to be realized.These costs include materials and fuel used, surveying costs, drilling costs and payments made tocontractors.
In evaluating whether the expenditures meet the criteria to be capitalized, several different sourcesof information are used. The information that is used to determine the probability of futurebenefits depends on the extent of exploration and evaluation that has been performed.
Expenditure is transferred from ‘Exploration and evaluation asset’ to ‘Mine properties’ which is asubcategory of ‘Property, plant and equipment’ once the work completed to date supports thefuture development of the property and such development receives appropriate approvals.
After transfer of the exploration and evaluation asset, all subsequent expenditure on theconstruction, installation or completion of infrastructure facilities is capitalized in ‘Mineproperties’. Development expenditure is net of proceeds from the sale of ore extracted during thedevelopment phase.
Stripping CostsAs part of its mining operations, the Group incurs stripping (waste removal) costs both during thedevelopment phase and production phase of its operations. Stripping costs incurred in thedevelopment phase of a mine, before the production phase commences (development stripping),are capitalized as part of the cost of mine properties and subsequently amortized over its useful lifeusing units of production method. The capitalization of development stripping costs ceases whenthe mine/component is commissioned and ready for use as intended by management.
Stripping activities undertaken during the production phase of a surface mine (productionstripping) are accounted for as set out below. After the commencement of production furtherdevelopment of the mine may require a phase of unusually high stripping that is similar in natureto development phase stripping. The costs of such stripping are accounted for in the same way asdevelopment stripping (as outlined above).
Stripping costs incurred during the production phase are generally considered to create twobenefits, being either the production of inventory or improved access to the coal body to be minedin the future. Where the benefits are realized in the form of inventory produced in the period, theproduction stripping costs are accounted for as part of the cost of producing those inventories.
- 30 -
*SGVFS007333*
Where the benefits are realized in the form of improved access to ore to be mined in the future, thecosts are recognized as a noncurrent asset, referred to as a stripping activity asset, if the followingcriteria are met:· Future economic benefits (being improved access to the coal body) are probable;· The component of the coal body for which access will be improved can be accurately
identified; and· The costs associated with the improved access can be reliably measured.
If all of the criteria are not met, the production stripping costs are charged to the consolidatedstatement of comprehensive income as operating costs as they are incurred.
In identifying components of the coal body, the Group works closely with the mining operationsdepartment for each mining operation to analyze each of the mine plans. Generally, a componentwill be a subset of the total coal body, and a mine may have several components. The mine plans,and therefore the identification of components, can vary between mines for a number of reasons.These include, but are not limited to: the type of commodity, the geological characteristics of thecoal body, the geographical location, and/or financial considerations.
The stripping activity asset is initially measured at cost, which is the accumulation of costsdirectly incurred to perform the stripping activity that improves access to the identified componentof coal body, plus an allocation of directly attributable overhead costs. If incidental operations areoccurring at the same time as the production stripping activity, but are not necessary for theproduction stripping activity to continue as planned, these costs are not included in the cost of thestripping activity asset. If the costs of the inventory produced and the stripping activity asset arenot separately identifiable, a relevant production measure is used to allocate the productionstripping costs between the inventory produced and the stripping activity asset. This productionmeasure is calculated for the identified component of the coal body and is used as a benchmark toidentify the extent to which the additional activity of creating a future benefit has taken place.
The stripping activity asset is accounted for as an addition to, or an enhancement of, an existingasset, being the mine asset, and is included as part of ’Mine properties’ under ‘Property, plant andequipment’ in the consolidated statement of financial position. This forms part of the totalinvestment in the relevant cash generating unit, which is reviewed for impairment if events orchanges of circumstances indicate that the carrying value may not be recoverable.
The stripping activity asset is subsequently depreciated using the units of production method overthe life of the identified component of the coal body that became more accessible as a result of thestripping activity. Economically recoverable reserves, which comprise proven and probablereserves, are used to determine the expected useful life of the identified component of the coalbody. The stripping activity asset is then carried at cost less depreciation and any impairmentlosses.
Mining ReservesMining reserves are estimates of the amount of coal that can be economically and legally extractedfrom SMC’s mining properties. SMC estimates its mining reserves based on informationcompiled by appropriately qualified persons relating to the geological data on the size, depth andshape of the coal body, and requires complex geological judgments to interpret the data. Theestimation of recoverable reserves is based upon factors such as estimates of foreign exchangerates, commodity prices, future capital requirements, and production costs along with geological
- 31 -
*SGVFS007333*
assumptions and judgments made in estimating the size and grade of the coal body. Changes inthe reserve estimates may impact upon the carrying value of property, plant and equipment,provision for decommissioning and site rehabilitation, recognition of deferred tax assets, anddepreciation charges.
Property, Plant and EquipmentProperty, plant and equipment, except land, are stated at cost less accumulated depreciation,depletion and amortization, and any impairment in value. Land is stated at cost, less anyimpairment in value.
The initial cost of property, plant and equipment comprises its purchase price, including importduties, taxes and any directly attributable costs of bringing the asset to its working condition andlocation for its intended use. Costs also include decommissioning and site rehabilitation cost.Expenditures incurred after the property, plant and equipment have been put into operation, suchas repairs and maintenance and overhaul costs, are normally charged to operations in the period inwhich the costs are incurred. In situations where it can be clearly demonstrated that theexpenditures have resulted in an increase in the future economic benefits expected to be obtainedfrom the use of an item of property, plant and equipment beyond its originally assessed standard ofperformance, the expenditures are capitalized as additional cost of property, plant and equipment.
Construction in progress included in property, plant and equipment is stated at cost. This includesthe cost of the construction of property, plant and equipment and other direct costs. Constructionin-progress is not depreciated until such time that the relevant assets are completed and put intooperational use.
Major repairs are capitalized as part of property, plant and equipment only when it is probable thatfuture economic benefits associated with the item will flow to the Group and the cost of the itemscan be measured reliably. All other repairs and maintenance are charged against currentoperations as incurred.
Depreciation, depletion and amortization of assets commences once the assets are put intooperational use.
Depreciation, depletion and amortization of property, plant and equipment are calculated on astraight-line basis over the following EUL of the respective assets or the remaining contractperiod, whichever is shorter:
YearsLand improvements 5-17Power plant, buildings and building improvements 5-25Construction equipment, machinery and tools 5-10Office furniture, fixtures and equipment 3-5Transportation equipment 4-5Conventional and continuous mining properties and equipment 2-13Leasehold improvements 5-7
The EUL and depreciation, depletion and amortization methods are reviewed periodically toensure that the period and methods of depreciation, depletion and amortization are consistent withthe expected pattern of economic benefits from items of property, plant and equipment.
- 32 -
*SGVFS007333*
An item of property, plant and equipment is derecognized upon disposal or when no futureeconomic benefits are expected to arise from the continued use of the asset. Any gain or lossarising on derecognition of the asset (calculated as the difference between the net disposalproceeds and the carrying amount of the item) is included in the consolidated statement of incomein the year the item is derecognized.
Intangible AssetsIntangible assets, software costs, acquired separately are capitalized at cost and these are shown aspart of the “Other noncurrent assets” account in the consolidated statement of financial position.Following initial recognition, intangible assets are measured at cost less accumulated amortizationand provisions for impairment losses, if any. The useful lives of intangible assets with finite lifeare assessed at the individual asset level. Intangible assets with finite life are amortized over theirEUL. The periods and method of amortization for intangible assets with finite useful lives arereviewed annually or earlier where an indicator of impairment exists.
Costs incurred to acquire and bring the computer software (not an integral part of its relatedhardware) to its intended use are capitalized as part of intangible assets. These costs are amortizedover their EUL ranging from 3 to 5 years. Costs directly associated with the development ofidentifiable computer software that generate expected future benefits to the Group are recognizedas intangible assets. All other costs of developing and maintaining computer software programsare recognized as expense when incurred.
Gains or losses arising from the derecognition of an intangible asset are measured as the differencebetween the net disposal proceeds and the carrying amount of the asset and are recognized in theconsolidated statement of income when the asset is derecognized.
Impairment of Nonfinancial AssetsThis accounting policy applies primarily to the Group’s property, plant and equipment, investmentproperties, investments in associates and jointly controlled entities and intangible assets.
Property, Plant and Equipment, Investment Properties and Intangible AssetsThe Group assesses at each reporting date whether there is an indication that an asset may beimpaired. If any such indication exists, or when an annual impairment testing for an asset isrequired, the group makes an estimate of the asset’s recoverable amount. An asset’s recoverableamount is the higher of an asset’s or cash generating unit’s fair value less cost to sell and its valuein use and is determined for an individual asset, unless the asset does not generate cash inflowsthat largely independent of those from other assets or group of assets. Where the carrying amountof an asset exceeds its recoverable amount, the asset is considered impaired and is written down toits recoverable amount. In assessing value in use, the estimated future cash flows are discountedto their present value using a pre-tax discount rate that reflects current market assessments of thetime value of money and the risks specific to the asset.
A previously recognized impairment loss is reversed only if there has been a change in theestimates used to determine the asset’s recoverable amount since the last impairment loss wasrecognized. If that is the case, the carrying amount of the asset is increased to its recoverableamount. That increased amount cannot exceed the carrying amount that would have beendetermined, net of depreciation, depletion and amortization, had no impairment loss beenrecognized for the asset in prior years. Such reversal is recognized in the consolidated statementof income unless the asset is carried at revalued amount, in which case the reversal is treated as arevaluation increase.
- 33 -
*SGVFS007333*
For investments in associates and jointly controlled entities, after application of the equity method,the Group determines whether it is necessary to recognize any additional impairment loss withrespect to the Group’s net investment in the investee companies. The Group determines at eachreporting date whether there is any objective evidence that the investment in associates or jointlycontrolled entities is impaired. If this is the case, the Group calculates the amount of impairmentas being the difference between the fair value and the carrying value of the investee company andrecognizes the difference in the consolidated statement of income.
EquityCapital stock is measured at par value for all shares issued. When the Group issues more than oneclass of stock, a separate account is maintained for each class of stock and the number of sharesissued.
When the shares are sold at a premium, the difference between the proceeds and the par value iscredited to “Additional paid-in capital” account. When shares are issued for a consideration otherthan cash, the proceeds are measured by the fair value of the consideration received.
Direct cost incurred related to the equity issuance, such as underwriting, accounting and legal fees,printing costs and taxes are charged to “Additional paid-in capital” account.
Retained earnings represent accumulated earnings of the Group, and any other adjustments to it asrequired by other standards, less dividends declared. The individual accumulated earnings of thesubsidiaries and associates are available for dividend declaration when these are declared asdividends by the subsidiaries as approved by their respective Board of Directors.
Retained earnings are further restricted for the payment of dividends to the extent of the cost ofcommon shares held in treasury.
Dividends on common shares are deducted from retained earnings when declared and approved bythe BOD or shareholders of the Parent Company. Dividends payable are recorded as liability untilpaid. Dividends for the year that are declared and approved after the reporting date, if any, aredealt with as an event after the reporting date and disclosed accordingly.
Redeemed shares represent own equity instruments which are reacquired and are subsequentlyretired by the Group. No gain or loss is recognized in the consolidated statement of income uponretirement of the own equity instruments. When the assets are retired, the capital stock account isreduced by its par value and the excess of cost over par value is debited to additional paid-incapital recognized when the shares were issued and to retained earnings for the remaining balance.
The Parent Company's retained earnings available for dividend declaration as of December 31,2013 and 2012 amounted to P=18,603.69 million and P=8,481.08 million, respectively.
Business Combinations and GoodwillPFRS 3 provides that if the initial accounting for a business combination can be determined onlyprovisionally by the end of the period in which the combination is effected because either the fairvalues to be assigned to the acquiree’s identifiable assets, liabilities or contingent liabilities or thecost of the combination can be determined only provisionally, the acquirer shall account for thecombination using those provisional values. The acquirer shall recognize any adjustments to thoseprovisional values as a result of completing the initial accounting within twelve months of theacquisition date as follows: (i) the carrying amount of the identifiable asset, liability or contingentliability that is recognized or adjusted as a result of completing the initial accounting shall becalculated as if its fair value at the acquisition date had been recognized from that date;
- 34 -
*SGVFS007333*
(ii) goodwill or any gain recognized shall be adjusted by an amount equal to the adjustment to thefair value at the acquisition date of the identifiable asset, liability or contingent liability beingrecognized or adjusted; and (iii) comparative information presented for the periods before theinitial accounting for the combination is complete shall be presented as if the initial accounting hasbeen completed from the acquisition date.
Business combinations are accounted for using the acquisition method. The cost of an acquisitionis measured as the aggregate of the consideration transferred, measured at acquisition date fairvalue and the amount of any NCI in the acquiree. For each business combination, the acquirermeasures the NCI in the acquiree either at fair value or at the proportionate share of the acquiree’sidentifiable net assets. Acquisition costs incurred are expensed and included in operatingexpenses. When the Group acquires a business, it assesses the financial assets and liabilitiesassumed for appropriate classification and designation in accordance with the contractual terms,economic circumstances and pertinent conditions as at the acquisition date. This includes theseparation of embedded derivatives in host contracts by the acquiree.
If the business combination is achieved in stages, the acquisition date fair value of the acquirer’spreviously held equity interest in the acquiree is remeasured to fair value at the acquisition datethrough consolidated statement of income. Any contingent consideration to be transferred by theacquirer will be recognized at fair value at the acquisition date. Subsequent changes to the fairvalue of the contingent consideration, which is deemed to be an asset or liability, will berecognized in accordance with PAS 39 either in consolidated statement of income or as a changeto OCI. If the contingent consideration is classified as equity, it should not be remeasured until itis finally settled within equity.
Goodwill is initially measured at cost being the excess of the aggregate of the considerationtransferred and the amount recognized for non-controlling interest over the net identifiable assetsacquired and liabilities assumed. If this consideration is lower than the fair value of the net assetsof the subsidiary acquired, the difference is recognized in consolidated statement of income.
After initial recognition, goodwill is measured at cost less any accumulated impairment losses. Forthe purpose of impairment testing, goodwill acquired in a business combination is, from theacquisition date, allocated to each of the Group’s cash-generating units that are expected to benefitfrom the combination, irrespective of whether other assets or liabilities of the acquiree areassigned to those units.
Where goodwill forms part of a cash-generating unit and part of the operation within that unit isdisposed of, the goodwill associated with the operation disposed of is included in the carryingamount of the operation when determining the gain or loss on disposal of the operation. Goodwilldisposed of in this circumstance is measured based on the relative values of the operation disposedof and the portion of the cash-generating unit retained.
Revenue and Cost RecognitionRevenue is recognized to the extent that it is probable that the economic benefits will flow to theGroup and the revenue can be reliably measured. The following specific recognition criteria mustalso be met before revenue is recognized:
MiningRevenue from mining is recognized upon acceptance of the goods delivered upon which thesignificant risks and rewards of ownership of the goods have passed to the buyer and the amountof revenue can be measured reliably. Revenue from local and export coal sales are denominatedin Philippine Peso and US Dollar, respectively.
- 35 -
*SGVFS007333*
Cost of coal includes expenses, which include directly related to the production and sale of coalsuch as cost of fuel and lubricants, materials and supplies, depreciation and depletion and otherrelated costs, are recognized when incurred.
Construction ContractsRevenue from construction contracts is recognized using the percentage-of-completion method ofaccounting and is measured principally on the basis of the estimated completion of a physicalproportion of the contract work. Contracts to manage, supervise, or coordinate the constructionactivity of others and those contracts wherein the materials and services are supplied by contractowners are recognized only to the extent of the contracted fee revenue. Revenue from cost pluscontracts is recognized by reference to the recoverable costs incurred during the period plus thefee earned, measured by the proportion that costs incurred to date bear to the estimated total costsof the contract.
Contract costs include all direct materials and labor costs and those indirect costs related tocontract performance. Expected losses on contracts are recognized immediately when it isprobable that the total contract costs will exceed total contract revenue. The amount of such lossis determined irrespective of whether or not work has commenced on the contract; the stage ofcompletion of contract activity; or the amount of profits expected to arise on other contracts,which are not treated as a single construction contract. Changes in contract performance, contractconditions and estimated profitability, including those arising from contract penalty provisions andfinal contract settlements that may result in revisions to estimated costs and gross margins arerecognized in the year in which the changes are determined. Profit incentives are recognized asrevenue when their realization is reasonably assured.
The asset “Costs and estimated earnings in excess of billings on uncompleted contracts” representstotal costs incurred and estimated earnings recognized in excess of amounts billed. The liability“Billings in excess of costs and estimated earnings on uncompleted contracts” represents billingsin excess of total costs incurred and estimated earnings recognized. Contract retentions arepresented as part of “Trade receivables” under the “Receivables” account in the consolidatedstatement of financial position.
Electricity SalesRevenue from sale of electricity is derived from its primary function of providing and sellingelectricity to customers of its generated and purchased electricity. Revenue derived from thegeneration and/or supply of electricity is recognized based on the actual delivery of electricity asagreed upon between parties.
Cost of energy includes expenses directly related to the production and sale of electricity such ascost of coal, fuel, depreciation and other related costs. Cost of coal and fuel are recognized at thetime the related coal and fuel inventories are consumed for the production of electricity. Cost ofenergy also includes electricity purchased from the spot market and the related market fees. It isrecognized as expense when the Group receives the electricity and simultaneously sells to itscustomers.
Real Estate SalesReal estate sales are generally accounted for under the full accrual method. Under this method,the gain on sale is recognized when: (a) the collectibility of the sales price is reasonably assured;(b) the earnings process is virtually complete; and (c) the seller does not have a substantialcontinuing involvement with the subject properties. The collectibility of the sales price isconsidered reasonably assured when: (a) the buyers have actually confirmed their acceptance of
- 36 -
*SGVFS007333*
the related loan applications after the same have been delivered to and approved by either thebanks or other financing institutions for externally-financed accounts; or (b) the full downpayment comprising a substantial portion of the contract price is received and the capacity to payand credit worthiness of buyers have been reasonably established for sales under the deferred cashpayment arrangement.
If the above criteria is not met, the deposit method is applied until all the conditions for recordinga sale are met. Pending recognition of sale, cash received from buyers are presented under the“Customers’ advances and deposits” account in the liabilities section of the consolidated statementof financial position.
Cost of real estate sales is recognized consistent with the revenue recognition method applied.Cost of subdivision land and condominium units sold before the completion of the development isdetermined on the basis of the acquisition cost of the land plus its full development costs, whichinclude estimated costs for future development works, as determined by the Company’s in-housetechnical staff.
Merchandise SalesRevenue from merchandise sales is recognized upon delivery of the goods to and acceptance bythe buyer and when the risks and rewards are passed on to the buyers.
Dividend IncomeRevenue is recognized when the Group’s right to receive payment is established, which isgenerally when shareholders approve the dividend.
Rental IncomeRental income arising from operating leases on investment properties and construction equipmentis accounted for on a straight-line basis over the lease terms.
Interest IncomeRevenue is recognized as interest accrues using the effective interest method.
Operating ExpensesOperating expenses are expenses that arise in the course of the ordinary operations of the Group.These usually take the form of an outflow or depletion of assets such as cash and cash equivalents,supplies, investment properties and property, plant and equipment. Expenses are recognized in theconsolidated statement of income.
Borrowing CostsBorrowing costs directly attributable to the acquisition, construction or production of an asset thatnecessarily takes a substantial period of time to get ready for its intended use or sale arecapitalized as part of the cost of the respective assets. All other borrowing costs are expensed inthe period they occur. Borrowing costs consist of interest that an entity incurs in connection withthe borrowing of funds.
The interest capitalized is calculated using the Group’s weighted average cost of borrowings afteradjusting for borrowings associated with specific developments. Where borrowings are associatedwith specific developments, the amounts capitalized is the gross interest incurred on thoseborrowings less any investment income arising on their temporary investment. Interest iscapitalized from the commencement of the development work until the date of practicalcompletion. The capitalization of finance costs is suspended if there are prolonged periods when
- 37 -
*SGVFS007333*
development activity is interrupted. Interest is also capitalized on the purchased cost of a siteproperty acquired specially for development but only where activities necessary to prepare theasset for development are in progress.
Foreign Currency Translations and TransactionsThe consolidated financial statements are presented in Philippine Peso. Each entity in the Groupdetermines its own functional currency and items included in the consolidated financial statementsof each entity are measured using that functional currency.
Transactions in foreign currencies are initially recorded in the functional currency rate at the dateof the transaction. Monetary assets and liabilities denominated in foreign currencies areretranslated at the functional currency closing rate at the reporting date. All differences are takento consolidated statement of income. Non-monetary items that are measured in terms of historicalcost in foreign currency are translated using the exchange rates as at the dates of initialtransactions. Non-monetary items measured at fair value in a foreign currency are translated usingthe exchange rates at the date when the fair value was determined.
The functional currency of the Group’s subsidiary and associate, Toledo Mining Corporation andENK Plc., are London Pounds and United States Dollar, respectively. As at reporting date, theassets and liabilities of foreign subsidiaries are translated into the presentation currency of theParent Company (the Philippine Peso) at the closing rate as at the reporting date, and theconsolidated statement of income accounts are translated at monthly weighted average exchangerate. The exchange differences arising on the translation are taken directly to a separatecomponent of equity under “Cumulative translation adjustment” account.
Upon disposal of a foreign subsidiary, the deferred cumulative amount recognized in OCI relatingto that particular foreign operation is recognized in the consolidated statement of income.
Commission ExpenseThe Group recognizes commission expense when services are rendered by the broker. Thecommission expense is recognized upon receipt of down payment from the buyer comprising asubstantial portion of the contract price and the capacity to pay and credit worthiness of buyershave been reasonably established for sales under the deferred cash payment arrangement.
Pension CostThe Group has a noncontributory defined benefit retirement plan.
The net defined benefit liability or asset is the aggregate of the present value of the defined benefitobligation at the end of the reporting period reduced by the fair value of plan assets (if any),adjusted for any effect of limiting a net defined benefit asset to the asset ceiling. The asset ceilingis the present value of any economic benefits available in the form of refunds from the plan orreductions in future contributions to the plan.
The cost of providing benefits under the defined benefit plans is actuarially determined using theprojected unit credit method.
Defined benefit costs comprise the following:· Service cost· Net interest on the net defined benefit liability or asset· Remeasurements of net defined benefit liability or asset
- 38 -
*SGVFS007333*
Service costs which include current service costs, past service costs and gains or losses on non-routine settlements are recognized as expense in profit or loss. Past service costs are recognizedwhen plan amendment or curtailment occurs. These amounts are calculated periodically byindependent qualified actuaries.
Net interest on the net defined benefit liability or asset is the change during the period in the netdefined benefit liability or asset that arises from the passage of time which is determined byapplying the discount rate based on government bonds to the net defined benefit liability or asset.Net interest on the net defined benefit liability or asset is recognized as expense or income inprofit or loss.
Remeasurements comprising actuarial gains and losses, return on plan assets and any change inthe effect of the asset ceiling (excluding net interest on defined benefit liability) are recognizedimmediately in other comprehensive income in the period in which they arise. Remeasurementsare not reclassified to profit or loss in subsequent periods.
Plan assets are assets that are held by a long-term employee benefit fund or qualifying insurancepolicies. Plan assets are not available to the creditors of the Group, nor can they be paid directlyto the Group. Fair value of plan assets is based on market price information. When no marketprice is available, the fair value of plan assets is estimated by discounting expected future cashflows using a discount rate that reflects both the risk associated with the plan assets and thematurity or expected disposal date of those assets (or, if they have no maturity, the expected perioduntil the settlement of the related obligations). If the fair value of the plan assets is higher than thepresent value of the defined benefit obligation, the measurement of the resulting defined benefitasset is limited to the present value of economic benefits available in the form of refunds from theplan or reductions in future contributions to the plan.
The Group’s right to be reimbursed of some or all of the expenditure required to settle a definedbenefit obligation is recognized as a separate asset at fair value when and only whenreimbursement is virtually certain.
Termination BenefitTermination benefits are employee benefits provided in exchange for the termination of anemployee’s employment as a result of either an entity’s decision to terminate an employee’semployment before the normal retirement date or an employee’s decision to accept an offer ofbenefits in exchange for the termination of employment.
A liability and expense for a termination benefit is recognized at the earlier of when the entity canno longer withdraw the offer of those benefits and when the entity recognizes related restructuringcosts. Initial recognition and subsequent changes to termination benefits are measured inaccordance with the nature of the employee benefit, as either post-employment benefits, short-term employee benefits, or other long-term employee benefits.
Employee Leave EntitlementEmployee entitlements to annual leave are recognized as a liability when they are accrued to theemployees. The undiscounted liability for leave expected to be settled wholly before twelvemonths after the end of the annual reporting period is recognized for services rendered byemployees up to the end of the reporting period.
- 39 -
*SGVFS007333*
LeasesThe determination of whether an arrangement is, or contains, a lease is based on the substance ofthe arrangement at inception date whether the fulfillment of the arrangement is dependent on theuse of a specific asset or assets or the arrangement conveys a right to use the asset. Areassessment is made after inception of the lease only if one of the following applies:
(a) There is a change in contractual terms, other than a renewal or extension of the arrangement;(b) A renewal option is exercised or extension granted, unless the term of the renewal or
extension was initially included in the lease term;(c) There is a change in the determination of whether fulfillment is dependent on a specified asset;
or(d) There is substantial change to the asset.
Where a reassessment is made, lease accounting shall commence or cease from the date when thechange in circumstances gave rise to the reassessment for scenarios (a), (c), or (d) and at the dateof renewal or extension period for scenario (b).
Group as a LesseeFinance leases that transfer substantially all the benefits incidental to ownership of the leased itemto the Group are capitalized at the commencement of the lease at fair value of the leased propertyor if lower, the present value of the minimum lease payments. Lease payments are apportionedbetween finance charges and reduction of the leased liability so as to achieve a constant rate ofinterest in the remaining balance of the liability. Finance charge are recognized in finance costs inthe consolidated statements of income.
A leased asset is depreciated over the useful life of the asset. However, if there is no reasonablecertainty that the earnings will obtain ownership by the end of the lease term, the asset isdepreciated over the shorter of the EUL of the asset and the lease term.
Operating lease payments are recognized as an expense in the consolidated statement of income ona straight basis over the lease term.
Group as a LessorLeases where the Group retains substantially all the risks and benefits of ownership of the asset areclassified as operating leases. Initial direct costs incurred in negotiating an operating lease areadded to the carrying amount of the leased asset and recognized over the lease term on the samebases as rental income.
Income TaxesCurrent Income TaxCurrent income tax assets and liabilities for the current and prior periods are measured at theamount expected to be recovered from or paid to the taxation authorities. The tax rates and taxlaws used to compute the amount are those that are enacted or substantively enacted at thereporting date.
Deferred TaxDeferred tax is provided, using the liability method, on all temporary differences, with certainexceptions, at the reporting date between the tax bases of assets and liabilities and their carryingamounts for financial reporting purposes.
- 40 -
*SGVFS007333*
Deferred tax liabilities are recognized for all taxable temporary differences with certain exception.Deferred tax assets are recognized for all deductible temporary differences, carryforward benefitof unused tax credits from excess minimum corporate income tax (MCIT) over the regularcorporate income tax (RCIT) and net operating loss carryover (NOLCO), to the extent that it isprobable that taxable income will be available against which the deductible temporary differencesand carryforward benefits of unused tax credits from MCIT and NOLCO can be utilized.
Deferred tax liabilities are not provided on nontaxable temporary differences associated withinvestments in domestic associates and investments in joint ventures.
The carrying amount of deferred tax assets is reviewed at each reporting date and reduced to theextent that it is no longer probable that sufficient taxable income will be available to allow all orpart of the deferred tax assets to be utilized. Unrecognized deferred tax assets are reassessed ateach reporting date and are recognized to the extent that it has become probable that future taxableincome will allow all or part of the deferred tax assets to be recovered.
Deferred tax assets and liabilities are measured at the tax rate that is expected to apply to theperiod when the asset is realized or the liability is settled, based on tax rate and tax laws that havebeen enacted or substantially enacted at the financial reporting date. Movements in the deferredincome tax assets and liabilities arising from changes in tax rates are charged against or credited toincome for the period.
Deferred tax assets and deferred tax liabilities are offset if a legally enforceable right exists to setoff current tax assets against current tax liabilities and the deferred tax assets relate to the sametaxable entity and the same taxation authority.
For periods where the income tax holiday (ITH) is in effect, no deferred taxes are recognized inthe consolidated financial statements as the ITH status of the subsidiary neither results in adeductible temporary difference or temporary taxable difference. However, for temporarydifferences that are expected to reverse beyond the ITH, deferred taxes are recognized.
Earnings Per ShareBasic earnings per share (EPS) is computed by dividing the net income for the year attributable tocommon shareholders (net income for the period less dividends on convertible redeemablepreferred shares) by the weighted average number of common shares issued and outstandingduring the year and adjusted to give retroactive effect to any stock dividends declared during theperiod.
Diluted EPS is computed by dividing the net income for the year attributable to commonshareholders by the weighted average number of common shares outstanding during the yearadjusted for the effects of dilutive convertible redeemable preferred shares. Diluted EPS assumesthe conversion of the outstanding preferred shares. When the effect of the conversion of suchpreferred shares is anti-dilutive, no diluted EPS is presented.
Operating SegmentThe Group’s operating businesses are organized and managed separately according to the natureof the products and services provided, with each segment representing a strategic business unitthat offers different products and serves different markets. The Group generally accounts forintersegment revenues and expenses at agreed transfer prices. Income and expenses fromdiscontinued operations are reported separate from normal income and expenses down to the levelof income after taxes. Financial information on operating segments is presented in Note 35 to theconsolidated financial statements.
- 41 -
*SGVFS007333*
ProvisionsGeneralProvisions are recognized only when the Group has: (a) a present obligation (legal or constructive)as a result of a past event; (b) it is probable that an outflow of resources embodying economicbenefits will be required to settle the obligation; and (c) a reliable estimate can be made of theamount of the obligation. If the effect of the time value of money is material, provisions aredetermined by discounting the expected future cash flows at a pre-tax rate that reflects currentmarket assessments of the time value of money and, where appropriate, the risks specific to theliability. Where discounting is used, the increase in the provision due to the passage of time isrecognized as an interest expense. Provisions are reviewed at each reporting date and adjusted toreflect the current best estimate.
Provision for Decommissioning and Site Rehabilitation CostsThe Group records the present value of estimated costs of legal and constructive obligationsrequired to restore operating locations in the period in which the obligation is incurred. The natureof these restoration activities includes dismantling and removing structures, rehabilitating minesand tailings dams, dismantling operating facilities, closure of plant and waste sites, andrestoration, reclamation and re-vegetation of affected areas.
The obligation generally arises when the asset is installed or the ground environment is disturbedat the production location. When the liability is initially recognized, the present value of theestimated cost is capitalized by increasing the carrying amount of the related mining assets. Overtime, the discounted liability is increased for the change in present value based on the discountrates that reflect current market assessments and the risks specific to the liability. The periodicunwinding of the discount is recognized in the consolidated statements of comprehensive incomeas a finance cost. Additional disturbances or changes in rehabilitation costs will be recognized asadditions or charges to the corresponding assets and rehabilitation liability when they occur. Forclosed sites, changes to estimated costs are recognized immediately in the consolidated statementof income.
ContingenciesContingent liabilities are not recognized in the consolidated financial statements. These aredisclosed unless the possibility of an outflow of resources embodying economic benefits isremote. Contingent assets are not recognized but are disclosed in the consolidated financialstatements when an inflow of economic benefits is probable.
Events After the Reporting PeriodPost year-end events up to the date of the auditors’ report that provide additional informationabout the Group’s position at reporting date (adjusting events) are reflected in the consolidatedfinancial statements. Any post year-end events that are not adjusting events are disclosed in theconsolidated financial statements when material.
3. Significant Accounting Judgments and Estimates
The preparation of the consolidated financial statements in conformity with PFRS requires theGroup to make estimates and assumptions that affect the reported amounts of assets, liabilities,income and expenses and disclosure of contingent assets and contingent liabilities. Future eventsmay occur which will cause the assumptions used in arriving at the estimates to change. Theeffects of any change in estimates are reflected in the consolidated financial statements, as theybecome reasonably determinable.
- 42 -
*SGVFS007333*
Judgments and estimates are continually evaluated and are based on historical experience andother factors, including expectations of future events that are believed to be reasonable under thecircumstances. Actual results could differ for such estimates.
JudgmentsIn the process of applying the Group’s accounting policies, management has made the followingjudgments, apart from those involving estimations which have the most significant effect on theamounts recognized in the consolidated financial statements:
Real Estate Revenue RecognitionSelecting an appropriate revenue recognition method for a real estate sale transaction requirescertain judgments based on buyer’s commitment on sale which may be ascertained through thesignificance of the buyer’s initial payments and completion of development. The buyers’commitment is evaluated based on collections, credit standing on buyers and location of property.Completion of project development is determined on engineer’s judgment and estimates on thephysical portion of contract work done and that development is beyond the preliminary stage.
Collectibility of the Sales PriceIn determining whether the sales prices are collectible, the Group considers that initial andcontinuing investments by the buyer of about 15% would demonstrate the buyer’s commitment topay.
Impairment of AFS Financial AssetsThe Group follows the guidance of PAS 39 in determining when an asset is impaired. Thisdetermination requires significant judgment. In making this judgment, the Group evaluates,among other factors, the duration and extent to which the fair value of an investment is less thanits cost; the financial health of and near-term business outlook of the investee, including factorssuch as normal volatility in share price for quoted equity securities and industry and sectorperformance, changes in technology and operational and financing cash flow for unquoted equitysecurities.
Financial Assets not Quoted in an Active MarketThe Group classifies financial assets by evaluating, among others, whether the asset is quoted ornot in an active market. Included in the evaluation on whether a financial asset is quoted in anactive market is the determination on whether quoted prices are readily and regularly available,and whether those prices represent actual and regularly occurring market transactions on an arm’slength basis.
Exploration and Evaluation ExpenditureThe application of the Group’s accounting policy for exploration and evaluation expenditurerequires judgment to determine whether future economic benefits are likely, from either futureexploitation or sale, or whether activities have not reached a stage that permits a reasonableassessment of the existence of reserves.
Stripping CostsThe Group incurs waste removal costs (stripping costs) during the development and productionphases of its surface mining operations. During the production phase, stripping costs (productionstripping costs) can be incurred both in relation to the production of inventory in that period andthe creation of improved access and mining flexibility in relation to ore to be mined in the future.The former are included as part of the costs of inventory, while the latter are capitalized as a
- 43 -
*SGVFS007333*
stripping activity asset, where certain criteria are met. Significant judgment is required todistinguish between development stripping and production stripping and to distinguish betweenthe production stripping that relates to the extraction of inventory and what relates to the creationof a stripping activity asset.
Once the Group has identified its production stripping for each surface mining operation, itidentifies the separate components of the coal bodies for each of its mining operations. Anidentifiable component is a specific volume of the coal body that is made more accessible by thestripping activity. Significant judgment is required to identify and define these components, andalso to determine the expected volumes of waste to be stripped and coal body to be mined in eachof these components. These assessments are undertaken for each individual mining operationbased on the information available in the mine plan. The mine plans and, therefore, theidentification of components, will vary between mines for a number of reasons. These include,but are not limited to, the type of commodity, the geological characteristics of the coal body, thegeographical location and/or financial considerations.
Judgment is also required to identify a suitable production measure to be used to allocateproduction stripping costs between inventory and any stripping activity asset(s) for eachcomponent. The Group considers that the ratio of the expected volume of waste to be stripped foran expected volume of ore to be mined for a specific component of the coal body, is the mostsuitable production measure.
Furthermore, judgments and estimates are also used to apply the units of production method indetermining the depreciable lives of the stripping activity asset.
Classification of Property as Investment Property or Real Estate InventoriesThe Group determines whether a property is classified as investment property or inventoryproperty as follows:· Investment property comprises land and buildings (principally offices, commercial and retail
property) which are not occupied substantially for use by, or in the operations of, the Group,nor for sale in the ordinary course of business, but are held primarily to earn rental income andcapital appreciation.
· Inventory comprises property that is held for sale in the ordinary course of business.Principally, this is residential, commercial and industrial property that the Group develops andintends to sell before or on completion of construction.
Distinction between Investment Properties and Owner-Occupied PropertiesThe Group determines whether a property qualifies as an investment property. In making itsjudgment, the Group considers whether the property generates cash flows largely independent ofthe other assets held by an entity. Owner-occupied properties generate cash flows that areattributable not only to property but also to the other assets used in the production or supplyprocess.
Some properties comprise a portion that is held to earn rentals or for capital appreciation andanother portion that is held for use in the production or supply of goods or services or foradministrative purposes. If these portions cannot be sold separately, the property is accounted foras an investment property only if an insignificant portion is held for use in the production orsupply of goods or services or for administrative purposes. Judgment is applied in determiningwhether ancillary services are so significant that a property does not qualify as investmentproperty. The Group considers each property separately in making its judgment.
- 44 -
*SGVFS007333*
Property Acquisitions or Business CombinationsThe Group acquires subsidiaries that own real estate. At the time of acquisition, the Groupconsiders whether the acquisition represents the acquisition of a business. The Group accounts foran acquisition as a business combination where an integrated set of activities is acquired inaddition to the property. More specifically, consideration is made of the extent to whichsignificant processes are acquired and, in particular, the extent of ancillary services provided bythe subsidiary (e.g., maintenance, cleaning, security, bookkeeping, hotel services, etc.). Thesignificance of any process is judged with reference to the guidance in PAS 40 on ancillaryservices.
When the acquisition of subsidiaries does not represent a business, it is accounted for as anacquisition of a group of assets and liabilities. The cost of the acquisition is allocated to the assetsand liabilities acquired based upon their relative fair values, and no goodwill or deferred tax isrecognized.
The following transactions represent acquisitions of business with reference to the guidance inPFRS 3. The Group considered the elements acquired in the context of a mining business whichinclude the mineral interest and rights (inputs), the subcontracting activities (processes) by whichthe Group access assets to enjoy the benefits and nickel laterite ore and the capacity to providereturns to the owners (outputs).
Parent CompanyIn 2012, the Parent Company acquired existing shares of ENK Plc, a mining company withsignificant mining assets in the Philippines. ENK is a laterite development and productioncompany focused on developing its Acoje project in the Philippines. The total acquisition costamounted to P=2.1 billion. In aggregate, the Parent Company owns 157.26 million shares whichrepresent 60.00% ownership in ENK Plc. The remaining 40% is owned by D&A Income Ltd, anentity from United Kingdom. The investment in ENK is accounted for as an acquisition of abusiness.
DMCI MiningOn October 23, 2012, DMC acquired 17% stake of Daintree Resources Limited in TMC forGBP 3.4 million. In 2013, DMC increased its interest in TMC by acquiring additional sharesthrough a mandatory cash offer to TMC’s shareholders. As of December 31, 2013, DMC holds49,148,335 shares and voting rights representing 98.09% of voting rights. DMC is a 100% ownedsubsidiary of the Parent Company. The investment in TMC is accounted for as an acquisition of abusiness.
On December 31, 2012, DMCI Mining purchased from TMC 775,000 issued common shares or31% ownerhip in Nickeline Resources Holdings Inc. (NRHI). Total acquisition cost amounted toP=268.93 million. The investment in NRHI is accounted for as an acquisition of a business.
Evaluation and Reassessment of ControlThe Group has investees that are majority owned but are not controlled (see Note 11). The Grouprefers to the guidance in PFRS 10 when determining whether the Group controls an investee.Particularly, the Group controls an investee when it is exposed, or has rights, to variable returnsfrom its involvement with the investee and has the ability to affect those returns through its powerover the investee. The Group considers the purpose and design of the investee, its relevantactivities and how decisions about those activities are made and whether the rights give it thecurrent ability to direct the relevant activities.
- 45 -
*SGVFS007333*
The Group controls an investee if and only if it has all the following:a. power over the investee;b. exposure, or rights, to variable returns from its involvement with the investee; andc. the ability to use its power over the investee to affect the amount of the investor's returns.
The Group reviewed its existing arrangements with other investors over these majority ownedentities and has determined that it does not control the entities because: (a) it only allows theinvestor to exercise significant influence or (b) parties to the arrangement exercise joint control assignificant strategic and operating decisions relating to the relevant activities of the investeesrequire the unanimous consent of both parties.
Operating Lease Commitments - Group as LesseeThe Group has entered into various leases for its occupied offices and mining and transportationequipment. The Group has determined that all significant risks and rewards of ownership areretained by the respective lessors on the offices and equipment it leases under operating leases.
Operating Lease Commitments - Group as LessorThe Group has entered into property lease agreements on its investment property portfolio. TheGroup has determined that it retains all the significant risks and rewards of ownership of theseproperties as the Group considered, among others, the length of the lease term compared with theestimated life of the assets.
In determining whether a lease contract is cancellable or not, the Group considered, among others,the significance of the penalty including the economic consequence to the lessee.
Finance Lease Commitments - Group as LesseeThe Group has entered into finance leases on some of its construction equipment and servicevehicle. The Group has determined, based on an evaluation of the terms and conditions of thearrangements, that the lessor transfers substantially all the risks and benefits incidental toownership of the leased equipment to the Group thus, it recognized these leases as finance leases.
Management’s Use of EstimatesThe key assumptions concerning the future and other sources of estimation uncertainty at thereporting date that have a significant risk of causing a material adjustment to the carrying amountsof assets and liabilities within the next financial year are discussed below.
Revenue RecognitionThe Group’s revenue recognition policies require use of estimates and assumptions that may affectthe reported amounts of revenue and receivables.
a.) Mining
The Group’s sales arrangement with its customers includes reductions of invoice price to takeinto consideration charges for penalties and bonuses. These price adjustments depend on theestimated quality of the delivered coal. These estimates are based on final coal qualityanalysis on delivered coal using American Standards for Testing Materials (ASTM).
There is no assurance that the use of estimates may not result in material adjustments in futureperiods. Revenue from mining amounted to P=12,838.47 million, P=16,373.20 million andP=18,682.23 million in 2013, 2012 and 2011, respectively.
- 46 -
*SGVFS007333*
b.) Construction contracts
The Group’s revenue from construction contracts are recognized based on the percentage-of-completion, measured principally on the basis of the estimated completion of a physicalproportion of the contract work and by reference to the actual cost incurred to date over theestimated total cost of the project.
There is no assurance that the use of estimates may not result in material adjustments in futureperiods. Revenue from construction contracts amounted to P=14,112.68 million,P=14,773.25 million and P=10,277.24 million in 2013, 2012 and 2011, respectively.
c.) Real estate sales
Selecting an appropriate revenue recognition method for a particular real estate saletransaction requires certain judgments based on, among others:· Buyer’s commitment on the sale which may be ascertained through the significance of the
buyer’s initial investment; and· Stage of completion of the project.
Collectibility of the Sales Price on Real Estate SalesIn determining whether the sales prices are collectible, the Group considers that initial andcontinuing investments by the buyer that would demonstrate the buyer’s commitment to pay. TheGroup has set a certain percentage of collection over the total selling price in determining buyer’scommitment on the sale. It is when the buyer’s investment is considered adequate to meet theprobability criteria that economic benefits will flow to the Group.
Evaluation of Net Realizable Value of Inventories and Land and ImprovementsInventories and land and improvements are valued at the lower of cost and NRV. This requiresthe Group to make an estimate of the inventories’ and land and improvements’ estimated sellingprice in the ordinary course of business, cost of completion and costs necessary to make a sale todetermine the NRV. For real estate inventories and land and improvements, the Group adjusts thecost of its real estate inventories and land and improvements to net realizable value based on itsassessment of the recoverability of the real estate inventories and land and improvements. Indetermining the recoverability of the inventories and land and improvements, managementconsiders whether those inventories and land and improvements are damaged or if their sellingprices have declined.
Likewise, management also considers whether the estimated costs of completion or the estimatedcosts to be incurred to make the sale have increased. In the event that NRV is lower than the cost,the decline is recognized as an expense. The amount and timing of recorded expenses for anyperiod would differ if different judgments were made or different estimates were utilized.
Inventories carried at cost amounted to P=21,405.48 million and P=19,225.05 million as ofDecember 31, 2013 and 2012, respectively. Inventories carried at NRV amounted toP=1,766.35 million and P=2,290.11 million as of December 31, 2013 and 2012, respectively(Note 9).
- 47 -
*SGVFS007333*
Allowance for Doubtful AccountsThe Group maintains an allowance for doubtful accounts at a level considered adequate to providefor potential uncollectible receivables. The level of this allowance is evaluated by themanagement on the basis of factors that affect the collectibility of the accounts. These factorsinclude, but are not limited to, the debtors’ ability to pay all amounts due according to thecontractual terms of the receivables being evaluated, the length of relationship with the customer,the customer’s payment behavior and known market factors. The Group reviews the age andstatus of receivables, and identifies accounts that are to be provided with allowances on acontinuous basis. The Group provides full allowance for receivables that it deems uncollectible.
The amount and timing of recorded expenses for any period would differ if the Group madedifferent judgments or utilized different estimates. An increase in the allowance for doubtfulaccounts on receivables would increase recorded operating expenses and decrease total assets.
Provision for doubtful accounts of the Group amounted to P=443.65 million, P=78.30 million andP=15.18 million in 2013, 2012 and 2011, respectively (Notes 7 and 25). Receivables of the Groupthat were impaired and fully provided with allowance amounted to P=545.82 million andP=240.48 million as of December 31, 2013 and 2012, respectively (Note 7).
Stock Pile Inventory QuantitiesThe Group estimates the stock pile inventory of coal by conducting a topographic survey which isperformed by in-house and third party surveyors. The survey is conducted on a monthly basiswith a reconfirmatory survey at year end. The process of estimation involves a predefined formulawhich considers an acceptable margin of error of plus or minus 3%. Thus, an increase or decreasein the estimation threshold for any period would differ if the Group utilized different estimates andthis would either increase or decrease the profit for the year. The coal inventory as ofDecember 31, 2013 and 2012 amounted to P=1,938.05 million and P=2,346.40 million, respectively(Note 9).
NRV of InventoriesThe Group reviews its inventory to assess NRV at least on a semi-annual basis. This requires theGroup to make an estimate of the inventories’ estimated selling price in the ordinary course ofbusiness and costs necessary to make a sale to determine the NRV. The amount and timing ofrecorded expenses for any period would differ if different judgments were made or differentestimates were utilized. An increase in reserves for inventory write-down would increase recordedoperating expenses and decrease current assets.
Inventories of the Group at NRV, net of allowance for inventory obsolescence amountingP=57.41 million and P=53.27 million as of December 31, 2013 and 2012, respectively, amounted toP=23,171.83 million and P=21,515.16 million as of December 31, 2013 and 2012, respectively(Note 9).
Estimating Decommissioning and Site Rehabilitation CostsThe Group is legally required to fulfill certain obligations under its ECC issued by DENR when itabandons depleted mine pits. These costs are accrued based on in-house estimate, whichincorporates estimates of the amount of obligations and interest rates, if appropriate. The Grouprecognizes the present value of the liability for these obligations and capitalizes the present valueof these costs as part of the balance of the related property, plant and equipment accounts, whichare being depreciated, depleted and amortized on a straight line basis over the EUL of the relatedasset or the lease term. Assumptions used to compute the decommissioning and site rehabilitationcosts are reviewed and updated annually.
- 48 -
*SGVFS007333*
The amount and timing of the recorded obligations for any period would differ if differentjudgments were made or different estimates were utilized. An increase in decommissioning andsite rehabilitation costs would increase the recorded operating expenses and increase noncurrentliabilities.
As of December 31, 2013 and 2012, the provision for decommissioning and site rehabilitationamounted to P=196.50 million and P=62.45 million, respectively (Note 20).
Estimating Useful Lives of Investment Properties, Property, Plant and Equipment and IntangibleAssetsThe Group estimated the useful lives of its property, plant and equipment, investment propertiesand intangible asset based on the period over which the assets are expected to be available for use.The estimated useful lives of property, plant and equipment, investment properties and intangibleassets are reviewed at least annually and are updated if expectations differ from previous estimatesdue to physical wear and tear and technical or commercial obsolescence on the use of these assets.
It is possible that future results of operations could be materially affected by changes in theseestimates brought about by changes in factors mentioned above. A reduction in the estimateduseful lives of property, plant and equipment, investment properties and intangible asset wouldincrease depreciation, depletion and amortization expense and decrease noncurrent assets.
In 2013, management has determined that components of its Unit II of its power plant will have tobe dismantled and repaired in the first quarter of 2014. These components have original remaininglives of 2-15 years in the books. Because of the planned activity, management has accelerated thedepreciation of these components and recognized an additional depreciation of P=1.11 billion in2013.
The Group incurred a loss from property, plant and equipment writedown due to the replacementof generation units and retirement of mining equipment amounting to P=443.35 million andP=341.15 million in 2013 and 2012, respectively (see Note 13).
The carrying value of property, plant and equipment of the Group amounted to P=31,271.25 millionand P=25,724.23 million as of December 31, 2013 and 2012, respectively (Note 13). The carryingvalue of investment properties of the Group amounted to P=270.18 million and P=276.45 million asof December 31, 2013 and 2012, respectively (Note 12). The carrying value of software cost ofthe Group amounted to P=33.60 million and P=49.95 million, respectively (Note 14).
Impairment of Nonfinancial AssetsThe Group assesses the impairment of assets whenever events or changes in circumstancesindicate that the carrying amount of an asset may not be recoverable. The factors that the Groupconsiders important which could trigger an impairment review include the following:
· significant underperformance relative to expected historical or projected future operatingresults;
· significant changes in the manner of use of the acquired assets or the strategy for overallbusiness; and
· significant negative industry or economic trends.
- 49 -
*SGVFS007333*
An impairment loss is recognized whenever the carrying amount of an asset exceeds itsrecoverable amount. The recoverable amount is the higher of an asset’s net selling price and valuein use. The net selling price is the amount obtainable from the sale of an asset in an arm’s lengthtransaction while value in use is the present value of estimated future cash flows expected to arisefrom the continuing use of an asset and from its disposal at the end of its useful life. Recoverableamounts are estimated for individual assets or, if it is not possible, for the cash-generating unit towhich the asset belongs.
In determining the present value of estimated future cash flows expected to be generated from thecontinued use of the assets, the Group is required to make estimates and assumptions that canmaterially affect the consolidated financial statements.
As of December 31, 2013 and 2012, the balances of the Group’s nonfinancial assets, net ofaccumulated depreciation, depletion and amortization and accumulated provisions for impairmentlosses follow:
2013 2012Property, plant and equipment (Note 13) P=31,271,246 P=25,724,232Investments in associates, jointly controlled
entities and others (Note 11) 11,883,288 14,369,254Investment properties (Note 12) 270,175 276,447Software cost - net (Note 14) 33,598 49,945
Deferred Tax AssetsThe Group reviews the carrying amounts of deferred taxes at each reporting date and reducesdeferred tax assets to the extent that it is no longer probable that sufficient taxable income will beavailable to allow all or part of the deferred tax assets to be utilized. However, there is noassurance that the Group will generate sufficient taxable income to allow all or part of deferred taxassets to be utilized.
The net deferred tax assets amounted to P=197.60 million and P=23.22 million as of December 31,2013 and 2012, respectively. The unrecognized deferred tax assets of the Group amounted toP=171.06 million and P=142.78 million as of December 31, 2013 and 2012, respectively (Note 29).
Estimating Pension Obligation and Other Retirement BenefitsThe cost of defined benefit pension plans and other employee benefits as well as the present valueof the pension obligation are determined using actuarial valuations. The actuarial valuationinvolves making various assumptions. These include the determination of the discount rates,future salary increases, mortality rates and future pension increases. Due to the complexity of thevaluation, the underlying assumptions and its long-term nature, defined benefit obligations arehighly sensitive to changes in these assumptions. All assumptions are reviewed at each reportingdate. The pension liabilities as at December 31, 2013 and 2012 and January 1, 2012 amounted toP=93.77 million, P=86.35 million and P=75.90 million, respectively (Note 23). Pension assetsamounted to P=796.72 million, P=684.79 million and P=518.02 million as of December 31, 2013 and2012 and January 1, 2012, respectively.
In determining the appropriate discount rate, management considers the interest rates ofgovernment bonds that are denominated in the currency in which the benefits will be paid, withextrapolated maturities corresponding to the expected duration of the defined benefit liability.Future salary increases are based on expected future inflation rates and other relevant factors.
- 50 -
*SGVFS007333*
The mortality rate is based on publicly available mortality tables for the specific country and ismodified accordingly with estimates of mortality improvements. Future salary increases andpension increases are based on expected future inflation rates.
ContingenciesThe Group is currently involved in various legal proceedings. The estimate of the probable costsfor the resolution of these claims has been developed in consultation with outside counselhandling the defense in these matters and is based upon an analysis of potential results. TheGroup currently does not believe these proceedings will have a material effect on the Group’sfinancial position. It is possible, however, that future results of operations could be materiallyaffected by changes in the estimates or in the effectiveness of the strategies relating to theseproceedings (Note 37).
Fair Value of Financial InstrumentsThe Group carries certain financial assets and liabilities at fair value, which requires extensive useof accounting estimates and judgment. While significant components of fair value measurementwere determined using verifiable objective evidence (i.e., foreign exchange rates, interest rates),the amount of changes in fair value would differ if the Group utilized different valuationmethodology. Any changes in fair value of these financial assets and liabilities would affectdirectly the consolidated statements of income and changes in equity.
Financial assets carried at fair value as of December 31, 2013 and 2012 amounted toP=73.15 million and P=71.26 million, respectively (Note 36).
4. Cash and Cash Equivalents
This account consists of:
2013 2012Cash on hand and in banks P=8,079,962 P=2,875,761Cash equivalents 16,694,533 6,841,281
P=24,774,495 P=9,717,042
Cash in banks earns interest at the respective bank deposit rates. Cash equivalents are short-termplacements made for varying periods of up to three (3) months depending on the immediate cashrequirements of the Group, and earn annual interest ranging from 0.02% to 4.63% and 0.50% to4.63% in 2013 and 2012, respectively.
Total finance income earned on cash in banks and cash equivalents amounted to P=311.42 million,P=355.02 million and P=416.91 million in 2013, 2012 and 2011, respectively (Note 26).
5. Financial Asset at FVPL
This account consist of peso-denominated investments in quoted equity securities of San MiguelPure Foods Company, Inc. acquired in 2011 with yields ranging from 1.90% to 1.96% as ofDecember 31, 2013 and 2012, respectively. The investment is acquired for the purpose of sellingit in the near term.
- 51 -
*SGVFS007333*
Unrealized market gain recognized in 2013 and 2011 amounted to P=1.89 million andP=1.40 million, respectively. Unrealized market loss recognized in 2012 amounted toP=0.14 million. Dividends earned amounting to P=4.29 million, P=5.68 million and P=4.55 million in2013, 2012 and 2011, respectively, are included in “Other income - net" account in theconsolidated statements of income (Note 28).
6. Available-for-Sale Financial Assets
This account consists of:
2013 2012Quoted securities
At beginning of year P=57,914 P=59,271Adjustments (5,608) –Disposals – (1,357)At end of year 52,306 57,914Unrealized gain recognized in equity 6,894 28,910
59,200 86,824Unquoted securities - at cost
Acquisition costs 27,980 27,980Less allowance for probable loss 26,251 26,251
1,729 1,72960,929 88,553
Less noncurrent AFS - net 950 –P=59,979 P=88,553
Quoted securitiesThe quoted equity investments include investments in golf and sports club shares. Movements inthe unrealized gain follow:
2013 2012Balance at beginning of year P=28,910 (P=1,090)Unrecognized gains (losses) recognized in other
comprehensive income (22,016) 30,000Balance at end of year P=6,894 P=28,910
Unquoted securitiesThis account consists of investments in stock accounted for at cost. As of December 31, 2013 and2012, details of this account follow:
2013 2012Montecito Properties, Inc. P=– P=220,214Less: Disposals – 220,214Montecito Properties, Inc. – –Others 27,980 27,980
27,980 27,980Less allowance for impairment losses 26,251 26,251
P=1,729 P=1,729
- 52 -
*SGVFS007333*
The unquoted shares include investment in Montecito Properties, Inc. (Montecito), a 30% ownedcompany carried at cost less provision for impairment losses. The Group does not have significantinfluence in this investment.
As of December 31, 2011, the Group has changed its intention and planned to hold the investmentin Montecito for more than a year, thus, reclassified as noncurrent. Current portion of AFSfinancial assets are expected to be sold within twelve months after the date of the consolidatedstatement of financial position.
As of December 31, 2012, the Group disposed all investments in Montecito with carrying amountof P=173.26 million resulting to a loss of P=0.99 million.
As of December 31, 2012, the remaining unquoted securities include investment in Project QuestCorporation, Universal Rightfield Property Holdings, Inc., Celebrity Sports Plaza, Inc. andUnicorn First Properties Inc. with an aggregate cost of P=26.25 million. These investments hadbeen fully provided for with allowance for doubtful accounts as management assessed thatcommitments in these shares of stock are not recoverable.
In 2011, P=6.67 million of the Group’s investment was returned. Allowance for probable lossamounting P=6.67 million has been reversed resulting to an income of the same amount recognizedunder “Other income - net” (Note 28).
7. Receivables
This account consists of:
2013 2012Trade:
Real estate P=10,746,650 P=7,831,097Electricity sales 3,754,529 2,756,622General construction (including retention
receivables on uncompleted contractsof P=2,507.21 million in 2013 andP=852.42 million in 2012) 3,514,152 4,079,450
Mining 2,248,668 1,453,964Merchandising and others 73,054 67,157
20,337,053 16,188,290Receivables from related parties (Note 21) 131,596 187,296Advances to officers and employees 40,695 60,048Other receivables 184,340 482,927
20,693,684 16,918,561Less allowance for doubtful accounts 545,817 240,477
20,147,867 16,678,084Less noncurrent receivables - net 5,186,785 5,242,743
P=14,961,082 P=11,435,341
- 53 -
*SGVFS007333*
Receivables amounting P=545.82 million and P=240.48 million as of December 31, 2013 and 2012,respectively, were impaired and fully provided with allowance (Note 25). Reversals of allowancefor doubtful accounts amounting P=138.31 million and P=9.55 million pertain to other receivablesand receivables from electricity sales which were assessed to be collectible or were alreadycollected in 2013 and 2012, respectively.
Movements in the allowance for impairment losses are as follows (amounts in thousands):
2013Trade Receivables
Real EstateGeneral
Construction MiningElectricity
Sales Others TotalAt January 1 P=– P=6,788 P=– P=130,423 P=103,266 P=240,477Provision during the year (Note 25) – – 29,743 384,289 29,618 443,650Reversal (Note 25) – – – (8,174) (130,136) (138,310)At December 31 P=– P=6,788 P=29,743 P=506,538 P=2,748 P=545,817
2012Trade Receivables
Real EstateGeneral
Construction MiningElectricity
Sales Others TotalAt January 1 P=– P=6,788 P=– P=53,524 P=111,420 P=171,732Provision during the year (Note 25) – – – 76,899 1,398 78,297Reversal (Note 25) – – – – (9,552) (9,552)At December 31 P=– P=6,788 P=– P=130,423 P=103,266 P=240,477
Trade ReceivablesReal estateReal estate receivables principally consist of amounts arising from sale of residential units andsubdivision land for sale and development which are collectible within ten (10) years with interestrates ranging from 9.00% to 19.00%. The corresponding titles to the subdivision units sold underthis arrangement are transferred to the buyers only upon full payment of the contract price.
The Group is liable to local commercial banks relative to the discounting of real estate receivables.The purchase agreements provide that the Group should substitute defaulted contracts to sell withother contracts to sell of equivalent value. The carrying value of real estate receivables discountedamounted to P=1.06 billion and P=5.57 billion as of December 31, 2013 and 2012, respectively (Note19). The range of interest for this type of loan ranges from 5.25% to 5.75%. The installmentcontracts receivable on a without recourse basis are used as collateral for the bank loans obtained.
The Group retains the assigned receivables in the “real estate receivables” account and records theproceeds from sales as bank loans (Note 19).
The Group entered into an agreement with Banco de Oro (BDO) for the sale of receivables on awithout recourse basis. Total carrying value of installment contracts receivable sold on a withoutrecourse basis amounted to P=1,520.00 million as of December 31, 2012 while there is no suchtransaction in 2013. Under a without recourse basis, the related installment contracts receivablewere derecognized from the books.
- 54 -
*SGVFS007333*
General constructionGeneral construction receivables principally consist of receivables from third-party constructionprojects. These are normally collected on a 30 to 60 day term. Retention receivable pertains tothe part of the contract which the contract owner retains as security and shall be released after theperiod allotted as indicated in the contract for the discovery of defects and other non-compliancefrom the specifications indicated.
MiningReceivable from mining pertains to receivables from the sale of coal and nickel ore both todomestic and international markets. These receivables are noninterest-bearing and generally have30-45 days credit terms.
Electricity salesReceivables from electricity sales are claims from power distribution companies for supply anddistribution of contracted energy and are generally carried at original invoice amounts lessdiscounts and rebates. These generally have 30-day credit terms.
Merchandising and othersReceivable from merchandise sales and others pertains to receivables from the sale of wires,services rendered and others to various local companies. These receivables are noninterest-bearing and generally have 30-60 days credit terms.
Advances to Officers and EmployeesReceivables from employees pertain to salary and other loans granted to the Group’s employeesthat are collectible through salary deduction. These are non-interest bearing and are due within oneyear.
Other ReceivablesOther receivables include the Group’s receivables from JV partners and condominiumcorporations. These receivables are noninterest-bearing and are generally collectible within oneyear from the reporting date.
Noncurrent ReceivablesNoncurrent receivables relate to real estate receivables arising from the sale of residential unitsand subdivision land for sale and development which are collectible beyond one year and withinten (10) years.
8. Costs and Estimated Earnings in Excess of Billings on Uncompleted Contracts
The details of the costs, estimated earnings and billings on uncompleted contracts follow:
Equipment parts, materials in transit andsupplies - net 1,766,350 2,290,107
P=23,171,833 P=21,515,161
Costs of equipment parts, materials in transit and supplies carried at NRV amounted to P=1,823.76million and P=2,343.40 million as of December 31, 2013 and 2012, respectively.
Borrowing costs capitalized in 2013 and 2012 amounted P=672.58 million and P=314.34 million,respectively. The capitalization rate used to determine the amount of borrowing costs eligible forcapitalization in 2013 and 2012 is 6.44% and 6.82%, respectively.
There are no real estate inventories used as collateral or pledged as security to secure liabilities.
A summary of the movement in real estate held for sale and development is set out below:
2013 2012Opening balance at January 1 P=15,510,158 P=12,508,114Construction/development cost incurred 5,789,287 5,126,788Land acquired during the year 2,484,872 1,864,014Borrowing costs capitalized 672,582 314,337Inventory assignment from acquisition 99,020 –
(Forward)
- 56 -
*SGVFS007333*
2013 2012Transfers from investment property P=25,385 P=−Transfers to property and equipment − (223,519)Recognized as cost of sales (Note 24) (6,567,151) (4,434,929)Other adjustment/reclassifications (136,741) 355,353
P=17,877,412 P=15,510,158
10. Other Current Assets
This account consists of:
2013 2012Advances to suppliers, brokers, contractors
and mine rights owners P=3,233,559 P=3,099,566Other short-term investments 1,200,000 −Input Value Added Tax (VAT) 1,169,193 804,061Creditable taxes withheld 726,573 720,142Prepaid expenses 352,541 408,300Refundable deposits (Note 36) 252,353 325,859Others 224,673 120,437
P=7,158,892 P=5,478,365
Advances to Suppliers, Brokers, Contractors and Mine Rights OwnersAdvances to suppliers, brokers and contractors are recouped upon every progress billing paymentdepending on the percentage of accomplishment. Advances to mine rights owners are noninterest-bearing and are due and demandable.
Other Short-Term InvestmentsOther short-term investments are time deposits with maturity of more than three (3) months fromthe date of acquisition and earn annual interest ranging from 1.75% to 3.75% in 2013. Interestincome earned in 2013 amounted to P=13.73 million presented under “Finance income” account inthe consolidated statements of income (Note 26).
Input VATInput VAT is fully recoverable and can be applied against output VAT.
Creditable Taxes WithheldCreditable taxes withheld are attributable to taxes withheld by third parties arising from sales andservices that will be applied to future taxes payable.
Prepaid ExpensesPrepaid expenses consist mainly of prepayments for taxes, commissions, rent and insurance.
Refundable DepositsRefundable deposits pertain to bill deposits and guaranty deposits for utilities that will berecovered within one year.
OthersOthers mainly include deposits for escrow funds, bill deposits and guaranty deposits which will berecovered within one year.
- 57 -
*SGVFS007333*
11. Investments in Associates, Jointly Controlled Entities and Others
The details of the Group’s investments in associates, jointly controlled entity and others follow:
2013 2012Acquisition cost
Balances at beginning of year P=6,836,841 P=4,792,652Additions 1,029,334 2,574,805Disposals (3,040,555) (530,616)Acquisition of control on former associate (226,899) −Write-off (125) −Balances at end of year 4,598,596 6,836,841
Accumulated impairment lossBalances at beginning and end of year (7,828) (7,828)
Accumulated equity in net earningsBalances at beginning of year 7,540,241 6,083,818Equity in net earnings 1,802,251 2,317,551Gain on deemed disposal of investment 3,171,327 −Dividends earned (5,221,015) (861,128)Write-off (284) −Balances at end of year 7,292,520 7,540,241
P=11,883,288 P=14,369,254
The details of the Group’s equity in the net assets of its associates and jointly controlled entity andthe corresponding percentages of ownership follow:
Percentages ofOwnership Equity in Net Assets
2013 2012 2013 2012Associates:
DMCI-MPIC Water Co. Inc. (DMWC) 27.19% 44.59% P=7,600,444 P=10,828,351Private Infra Dev Corporation (PIDC) 33.00 33.00 927,044 677,445Nickeline Resources Holdings, Inc. (NRHI) 58.00 31.00 245,387 268,933Subic Water and Sewerage Company, Inc.
There have been no outstanding capital commitments in 2013 and 2012. All associates and jointlycontrolled entities are incorporated in the Philippines except for ENK which is incorporated inLondon, United Kingdom.
The following table summarizes the significant financial information of the associates and jointlycontrolled entity that are material to the Group:
Statement of incomeRevenue 15,882,765 600,232 103,364 290,619Costs and expenses 9,988,123 408,676 73,394 1,085,112Net income (loss) 5,894,642 191,556 29,970 (794,493)
The Group’s dividend income from DMWC and Subic Water amounted to P=5,191.21 million andP=29.71 million, respectively, in 2013. Equity in net earnings during the year from DMWC andSubic Water amounted to P=1,832.53 million and P=82.07 million, respectively. Equity in net lossesduring the year from PIDC and ENK amounted to P=1.50 million and P=87.30 million, respectively.
- 59 -
*SGVFS007333*
The aggregate carrying amount of the Group’s individually immaterial investments in associatesand jointly controlled entities in 2013 amounted to P=1,057.58 million and nil, respectively. Equityin net losses during the year from individually immaterial associates in 2013 amounted toP=23.55 million.
DMWCOn November 27, 2008, through a Subscription Agreement by and among the Parent Company,MPIC and DWMC, the Parent Company and MPIC subscribed to 961,600,000 common sharesand 1,923,200,000 common shares, respectively, of DMWC.
Simultaneous with the execution of the Subscription Agreement, the Parent Company, DMWC,MPIC and Maynilad entered into a Shareholders’ Agreement outlining the relationship of theParent Company and MPIC as shareholders of DMWC. In the same Shareholders’ Agreement,which was immediately executory, the parties confirmed that each of the Parent Company andMPIC holds, on the date of said Shareholders’ Agreement, equity interests in the form of sharesand share entitlements in DMWC equal to 44.59% and 55.41%, respectively.
DMWC’s decrease in authorized capital stockAs approved by DMWC’s BOD on August 31, 2012, DMWC decreased its authorized capitalstock from P=5,854.80 million divided into 5,854.80 million common shares with par value ofP=1.00 to 4,664.80 million common shares with par value of P=1.00. The decrease in DMWC’sauthorized capital stock was approved by the SEC on October 10, 2012. The main purpose of thedecrease in authorized capital stock was to settle the outstanding subscriptions payable of existingshareholders which includes the Parent Company. The share of the Parent Company, as a result ofthe decrease in the authorized capital stock, amounted to P=530.62 million which is accounted foras cancellation of the Parent Company’s subscription payable of P=379.71 million and a return of aportion of its investment amounting P=150.91 million. The P=150.91 million was applied against theliability to DMWC (Notes 38).
Marubeni Corporation – Nippon Koei Co. Ltd (MCNK JV Corporation) and DMWC SubcriptionAgreementOn December 28, 2012, MCNK subscribed 169,617,682 common shares of stock of DMWC forP=169.6 million out of which it initially paid P=42.4 million. On the same date, the BOD of DMWCapproved a resolution to increase its authorized capital stock sufficient enough to cover theissuance of the subscription shares. On January 29, 2013, the SEC approved DMWC’s increase inauthorized capital stock and MCNK fully paid the remaining subscription price amountingP=127.2 million on February 13, 2013.
MCNK is 90.0% owned by Marubeni Corporation, a company incorporated in Japan and 10%owned by MAPL Holdings B.V., a company incorporated in Netherlands.
On February 13, 2013, MCNK subscribed to an additional 508,853,045 common shares ofDMWC with a par value for P=1.00 per share for a total subscription price of P=10,200.00 million.On the same date, DMWC issued these shares and MCNK fully paid these shares.
The above transactions resulted to the dilution of the Parent Company’s interest in DMWC. Thedilution of interest due to subscription and issuance of DMWC shares to MCNK resulted to adilution gain amounting to P=3,171.33 million which was recorded as “Gain on sale of investment”in the consolidated statements of income. The gain arises from the difference between the ParentCompany’s share in the cash received from MCNK’s subscription and the effective reduction inthe share in net asset of DMWC.
- 60 -
*SGVFS007333*
Partial sale of investment in DMWC to MPIC and MCNKOn February 13, 2013 the Parent Company sold 154,992,852 shares and 472,555,019 shares heldto MPIC and MCNK amounting to P=2,376.04 million and P=6,650.60 million, respectively. Theexcess of the proceeds received over the carrying value of the investment disposed amounting toP=5,986.08 million was recorded as “Gain on sale of investment” in the consolidated statements ofincome.
Rollforward of the cost of investment in DMWC follows:
2013 2012Acquisition cost
Balances at beginning of year P=3,430,983 P=3,961,600Partial sale of investments (3,040,555) −Cancellation of subscription payable − (379,708)Return of capital − (150,909)Balances at end of year 390,428 3,430,983
Accumulated equity in net earningsBalance at beginning of year 7,397,368 5,989,698Equity in net earnings 1,832,530 2,263,798Gain on deemed disposal of investment 3,171,327 −Dividends received (5,191,209) (856,128)Balances at end of year 7,210,016 7,397,368
P=7,600,444 P=10,828,351
The above transactions resulted to the change in effective interest in DMWC from 44.59% as ofDecember 31, 2012 to 27.19% as of December 31, 2013.
PIDCPIDC is primarily engaged in the business of construction, development of various infrastructureprojects such as roads, highways, toll roads, freeways, skyways, flyovers, viaducts andinterchanges. On February 19, 2008, PIDC was awarded the contract for the financing, design,construction, operation and maintenance of the Tarlac-Pangasinan-La Union Expressway(TPLEX).
On June 2, 2011, PIDC entered into Omnibus Loan Security Agreement (the “OmnibusAgreement”) with Banco de Oro Unibank, Inc., Development Bank of the Philippines and LandBank of the Philippines as Lenders, the Shareholders as the Third Party Mortgagors and Sponsors,BDO Capital and Investment Corporation and Development Bank of the Philippines as LeadArrangers, BDO Unibank, Inc., Trust and Investments Group as Facility Agent, DSRA & PayingAgend and Collateral Agent.
Breakdown of the syndicated loan is as follows:
AmountBanco de Oro Unibank, Inc. P=7,125,000,000Development Bank of the Philippines 2,375,000,000Land Bank of the Philippines 2,000,000,000
P=11,500,000,000
- 61 -
*SGVFS007333*
The Omnibus Agreement was entered into to finance the Project which is to design, construct,operate, and maintain Phase 1 of the Tarlac-Pangasinan-La Union Toll Expressway under the TollConcession Agreement dated August 28, 2008, between PIDC as Grantee and, the Republic of thePhilippines, acting and by through the Department of Public Works and Highways and the TollRegulatory Board, as Grantor.
Details of the loan follow:
a. Interest: At a floating rate per annum equivalent to the five (5) - year Philippine DealingSystem Treasury-Fixing (PDST-F) benchmark yield for treasury securities as published on thePDEx page of Bloomberg (or such successor electronic service provider) at approximately11:30a.m. (Manila Time) on the banking day prior to each day of Borrowing and with respectto the fifth (5th) year from the date of initial Borrowing and each succeeding interest periodthereafter, plus 3% per annum.
b. Repayment: The principal amount shall be payable in twenty-eight (28) quarterly installmentscommencing on the thirty ninth (39th) month from the initial borrowing date, inclusive of anot more than a three (3) years grace period. Final repayment date is ten (10) years afterinitial borrowing. The loan may be prepaid voluntarily provided the conditions in theOmnibus Agreement are satisfied.
On September 3, 2009, the BOD approved the Parent Company’s additional subscription of1,449,684 common shares out of PIDC’s increase in authorized capital stock of P=3.50 billion.In 2010 and 2013, the Parent Company paid in full the subscriptions of shares amountingP=244.67 million and P=251.10 million, respectively increasing the investment from P=677.44 millionto P=927.04 million.
Subic WaterOn January 22, 1997, PDI subscribed to 3,262,320 shares at the par value of P=10 per share for anaggregate value of P=32.62 million in Subic Water, a joint venture company among Subic BayMetropolitan Authority (SBMA), a government-owned corporation, Olongapo City Water District,and Cascal Services Limited (a company organized under the laws of England). The agreementexecuted by the parties on November 24, 1996 stipulated, among others, that PDI shall have anequity participation equivalent to 40% in Subic Water amounting P=74.80 million (based on theinitial subscribed and paid-in capital of P=187.00 million). The balance of PDI’s committedsubscription to Subic Water of P=38.18 million (net of additional subscriptions payment ofP=4.00 million in 1998) is expected to be paid on or before the second anniversary of the effectivitydate. As of December 31, 2013 and 2012, such committed subscription remains unpaid.
The investment in Subic Water is accounted for as an investment in an associate.
ENK PlcIn 2012, the Parent Company acquired existing shares of ENK Plc, a mining company withsignificant mining assets in the Philippines. ENK is a nickel laterite development and productioncompany focused on developing its Acoje and Zambales chromite projects in the Philippines. Thetotal acquisition cost amounted to P=2.1 billion. In aggregate, the Parent Company owns157.26 million shares which represents 60% ownership in ENK Plc. The remaining 40% is ownedby D&A Income Ltd (D&A), an entity from United Kingdom. The investment in ENK isaccounted for as an acquisition of a business.
- 62 -
*SGVFS007333*
In 2012, the Parent Company and D&A executed a Shareholders’ Agreement which clearlydefines the roles of the shareholders as having economic interests over ENK. The ParentCompany’s 60% ownership interest in ENK only allows it to exercise significant influencebecause of limited participation in the governance of ENK. ENK is classified as an associate ofthe Group and accounted for using the equity method of accounting.
On January 22, 2013, the Parent Company has acquired majority seats in the Board of ENK.Upon adoption of PFRS 10 and PFRS 11 in 2013, the Parent Company reassessed its arrangementwith D&A over ENK and has determined that it has joint control over ENK because even at 60%ownership and majority seats in the Board, the strategic and financial operating decisions relatingto the economic activities of ENK require the unanimous consent of both parties.
TMCOn October 23, 2012, DMCI Mining Corporation (DMC) purchased from Daintree ResourcesLimited 8,480,250 common shares representing 17.01% ownership in TMC for GBP 3.4 millionor P=226.90 million. TMC is an investment holding company incorporated in England and Waleson May 29, 2007 and is engaged in ore and mineral mining and exploration. TMC has strategicinterests in two privately owned nickel companies in the Philippines, Berong Nickel Corporationand Ipilan Nickel Corporation.
In 2013, DMC increased its interest in TMC by acquiring additional shares through a mandatorycash offer to TMC’s shareholders. As of December 31, 2013, DMC holds 49,148,335 shares andvoting rights representing 98.06% of voting rights.
Delisting of TMC’s shares in the London Stock Exchange (AIM)On December 12, 2013, TMC’s shareholders passed the resolution to cancel the admission oftrading of TMC’s ordinary shares on the AIM (delisting). The last day of dealings in ordinaryshares on AIM is on December 19, 2013 while the date of cancellation of admission to trading onAIM is on December 20, 2013.
Changes in the Board composition in TMCOn December 20, 2013, DMC has acquired majority seats in the Board of TMC.
For the year ended December 31, 2012, at 17.01% ownership, TMC was considered to be anassociate under the previously existing PAS 28, and was accounted for using the equity method.With the additional subscription of 81.05% and upon adoption of PFRS 10, the Group assessedthat it has control over TMC. The assets, liabilities and equity of TMC have been consolidated inthe financial statements of the Group on December 20, 2013, the date control has been obtained(see Note 33).
Acquisition of TMC’s associatesUpon consolidation of the net assets of TMC, the Group has obtained the following investments inassociates:
a. TMM Management, Inc. (TMI)b. Ulugan Resources Holdings, Inc. (URHI)c. Ulugan Nickel Corporation (UNC)d. Berong Nickel Corporation (BNC)e. Nickel Laterite Resources, Inc. (NLRI)f. Ipilan Nickel Corporation (INC)
- 63 -
*SGVFS007333*
The Group assessed that its interest over these entities only allows it to exercise significantinfluence.
NRHIOn December 31, 2012, DMC purchased from TMC 775,000 issued common shares in NRHI fora total acquisition cost of P=268.93 million. After purchase of shares from TMC, ownershipstructure in NRHI consists of 60% interest of Ulugan Resources Holdings, Inc. (URHI), 31% byDMC and 9% by TMC.
In 2013, DMC acquired additional shares in TMC. As of December 20, 2013, DMC holds 98.06%of voting rights and majority seats in the Board of TMC. After reassessment of control inaccordance with PFRS 10, the Group assessed that it has control over TMC. Net assets of TMChas been consolidated in the financial statements of the Group, including it’s investment in NRHI.The Group’s effective interest in NRHI as at December 31. 2013 represent 58% ownership.
As at December 31, 2013 and 2012, NRHI is classified as an associate of the Group and accountedfor using the equity method. The Group’s 58% interest over NRHI only allows it to exercisesignificant influence.
DMFBOn January 18, 2008, DMCI has entered into a Joint Venture Agreement with First Balfour, Inc.with 51% interest. DMFB Joint Venture, an incorporated joint venture, was formed for theconstruction of the Light Rail Transit (LRT) Line 1 North Extension Project (the Project). TheProject was started on June 7, 2008 and was completed on October 23, 2010.
DMCI’s interest in DMFB Joint Venture is a joint arrangement accounted for as joint ventureusing the equity method where the carrying amount of the investment is adjusted to reflect thechanges in the net assets of the joint venture since the acquisition date (see Note 2).
The joint venture had no contingent liabilities or capital commitments as at December 31, 2013and 2012.
Joint OperationsOn September 13, 2012, DMCI has entered into a Joint Venture Agreement with C.M. PanchoConstruction, Inc. (C.M. Pancho) to form an unincorporated JV to jointly construct, execute anddevelop the Philippines Secondary National Road Development Project (SNRDP) ContractPackage 1. The joint arrangement is accounted for as joint operations.
In 2013, DMCI entered into joint venture agreement with C.M Pancho and J.E. Manalo & Co.,Inc. (JEMCO) to form an unincorporated JV to jointly construct, execute and develop the project,Philippines Secondary National Road Development Project (SNRDP) Contract Package 1: RoadRehabilitation, Buray Junction to Barangay Tinani, Paranas, Samar KM 827+144.400 - 843 +500awarded by Millennium Challenge Account - Philippines (MCAP). The joint arrangement isaccounted for as joint operations.
- 64 -
*SGVFS007333*
12. Investment Properties
The movements in this account follow (amounts in thousands):
2013
Land
Buildingsand Building
ImprovementsCondominium
Units TotalCostAt January 1 P=73,181 P=201,373 P=44,347 P=318,901Additions – 25,939 – 25,939Transfer to inventory (25,385) – – (25,385)At December 31 47,796 227,312 44,347 319,455Accumulated Depreciation and
AmortizationAt January 1 – 39,941 2,513 42,454Depreciation and amortization
(Note 24) – 3,416 3,410 6,826At December 31 – 43,357 5,923 49,280Net Book Value P=47,796 P=183,955 P=38,424 P=270,175
2012
Land
Buildingsand Building
ImprovementsCondominium
Units TotalCostAt January 1 P=73,181 P=62,176 P=44,347 P=179,704Additions – 139,197 – 139,197At December 31 73,181 201,373 44,347 318,901Accumulated Depreciation and
AmortizationAt January 1 – 36,525 1,021 37,546Depreciation and amortization
(Note 24) – 3,416 1,492 4,908At December 31 – 39,941 2,513 42,454Net Book Value P=73,181 P=161,432 P=41,834 P=276,447
The aggregate fair value as of December 31, 2013 and 2012 amounted to P=292.87 million andP=284.29 million, respectively. The fair value of the investment properties has been determinedbased on valuations performed by an accredited independent appraiser.
The value of the investment properties was arrived at using the Market Data Approach. In thisapproach, the value of the investment properties is based on Level 3 inputs such as sales andlistings of comparable property registered in the vicinity. The technique of this approach requiresthe establishment of comparable property by reducing reasonable comparative sales and listings toa common denominator. This is done by adjusting the differences between the subject propertyand those actual sales and listings regarded as comparable. The properties used as basis ofcomparison are situated within the immediate vicinity of the subject property.
There have been no outstanding capital commitments in 2013 and 2012.
- 65 -
*SGVFS007333*
Rental income from investment properties (included under ‘Other income’) amounted toP=84.45 million, P=274.17 million and P=53.81 million in 2013, 2012 and 2011, respectively(Note 28). Direct operating expenses (included under ‘Cost of sales and services’ in theconsolidated statements of income) arising from investment properties amounted to P=6.83 million,P=4.91 million and P=6.31 million in 2013, 2012 and 2011, respectively (Note 24).
There are no investment properties as of December 31, 2013 and 2012 that are pledged as securityagainst liabilities.
- 66 -
*SGVFS007333*
13. Property, Plant and Equipment
The movements in this account follow (amounts in thousands):
2013
Land and LandImprovements
Power Plant,Buildings
and BuildingImprovements
ConstructionEquipment,Machineryand Tools
OfficeFurniture,
Fixtures andEquipment
TransportationEquipment
Conventionaland Continuous
MiningProperties
and EquipmentLeasehold
Improvements Mine PropertiesConstruction
in Progress TotalCostAt January 1 P=1,558,027 P=18,973,630 P=5,301,420 P=374,259 P=350,272 P=15,228,638 P=142,198 P=− P=5,602,712 P=47,531,156Additions 32,949 408,508 1,245,152 46,481 43,627 657,798 23,493 133,189 7,819,623 10,410,820Transfers from construction in
The construction in progress accounts mostly contains purchased mining equipment items that arein transit and various buildings and structures that are under construction as of December 31, 2013and 2012. In 2013 and 2012, construction in progress includes capitalized rehabilitation costs forUnits 1 and 2 of SCPC’s power plant and construction of SLPGC’s 2 x 150 megawatt (MW) coal-fired thermal power plant. The rehabilitation of Unit 1 of SCPC power plant was completed inJanuary 2013 and the rehabilitation of Unit 2 of SCPC power plant is expected to be completed inthe first quarter of 2014.
The capitalized borrowing cost included in the construction in progress account amounted toP=101.38 million and P=11.01 million on December 31, 2013 and 2012, respectively. The averagecapitalization rate is 3.36% and 3.50% in 2013 and 2012 (see Note 19).
Mine properties pertain to the expected decommissioning and site rehabilitation costs of Panianminesite and dismantling of mining machineries and conveyor belts at the end of its life(see Note 20).
In 2013, 2012 and 2011, the Group sold various equipment items at a net gain included under theconsolidated statements of income caption “Other income - net” amounting P=144.86 million,P=127.50 million and P=57.57 million, respectively (Note 28).
As security for timely payment, discharge, observance and performance of the loan provisions, theCompany creates, establishes, and constitutes in favor of the Security Trustee, for the benefit of allsecured parties, a first ranking real estate and chattel mortgage on present and future real assetsand chattels owned by the Company as of December 31, 2013 and 2012 (Note 19).
SCPC incurred a loss from property, plant and equipment writedown due to the replacement ofgeneration units amounting to P=443.35 million and P=341.15 million in 2013 and 2012,respectively (Note 28).
The construction of the coal-fired power plant commenced on the early part of the 2012. SLPGCexpects to spend P=17.70 billion to complete the power plant in the early part of 2015.
Depreciation, depletion and amortization expense on property, plant and equipment amounted toP=4,566.01 million, P=3,743.70 million and P=3,496.75 million in 2013, 2012 and 2011, respectively(Notes 24 and 25).
The cost of fully depreciated assets that are still in use as of December 31, 2013 and 2012amounted to P=11,422.25 million and P=7,674.24 million, respectively.
There are no temporarily idle property, plant and equipment in 2013 and 2012.
14. Other Noncurrent Assets
The details of other noncurrent assets follow:
2013 2012Deferred input VAT P=1,091,094 P=293,536Investment in sinking fund (Note 19) 517,603 508,041
(Forward)
- 69 -
*SGVFS007333*
2013 2012Security deposits (Note 36) P=407,519 P=191,390Exploration and evaluation asset 348,153 –Deposit for future investment 149,108 145,3305% input VAT withheld - net 164,526 124,438Prepaid rent (Note 37) 89,906 100,115Software cost - net 33,598 49,945Prepaid tax 28,993 22,807Others 132,248 7,248
2,962,748 1,442,850Less current portion of prepaid rent (Note 10) 4,545 5,103
P=2,958,203 P=1,437,747
Deferred Input VATThis pertains to VAT incurred from acquisition of capital assets mostly coming from the ongoingconstruction of coal-fired power plant of SLPGC.
Investment in Sinking FundIn a special meeting of the BOD of SCPC held on March 9, 2010, the BOD of SCPC authorizedSCPC to establish, maintain, and operate trust and investment management accounts with Bancode Oro Unibank, Inc., - Trust and Investment Group (BDO) as the Security Trustee. The OmnibusAgreement provided that the Security Trustee shall invest and reinvest the monies on deposit inCollateral Accounts (Note 19). All investments made shall be in the name of the Security Trusteeand for the benefit of the Collateral Accounts. In May 2010, BDO made an initial investment inthe Sinking Fund amounting P=304.81 million. As of December 31, 2013 and 2012, the investmentin sinking fund amounted to P=517.60 million and P=508.04 million, respectively.
Interest earned from the sinking fund amounted to P=12.17 million, P=17.21 million andP=7.21 million in 2013, 2012 and 2011, respectively (Note 26).
Security DepositsSecurity deposits represent payments to and held by the lessor as security for the faithful andtimely performance by the Group of all its obligations and compliance with all provisions of theequipment rental agreement (Note 37). These deposits shall be returned by the lessor to the Groupafter deducting any unpaid rental, and/or any other amounts due to the lessor for any damage andexpense incurred to put the vehicle in good working condition.
Exploration and Evaluation AssetIn 2013, Semirara incurred costs related to exploratory drilling and activities in Bobog minesiteamounting to P=348.15 million.
Deposits related to Definitive Agreement with a Third PartyOn October 30, 2012, DMC entered into a definitive agreement with a third party for theassignment of shares and call options in the three holding companies. The assigned shares areheld by an escrow agent and the ownership is subject to a condition that all pending cases faced bythe third party, the holding companies and the development companies are resolved in their favor.
The purchase price due to the third party for the total shares is $13.20 million. In accordance withthe agreement, DMC deposited a portion of the purchase price which was devoted primarily topaying the certain agreed upon expenses, including those relating to ongoing litigation of
- 70 -
*SGVFS007333*
permitting issues faced by the third party, holding companies and development companies. Thedeposited amount is collectible from third party in case the outcomes of litigations areunfavorable.
The definitive agreement also sets a deadline, should the pending cases remain unresolved, allowsthe third party to recover the shares and the Company to recover whatever was advanced.
5% Input VAT withheld - netAs a result of the enactment of RA No. 9337 effective November 1, 2005, National PowerCorporation (NPC) started withholding the required 5% input VAT on the VAT exempt coal sales.On March 7, 2007, SMC obtained a ruling from the Bureau of Internal Revenue (BIR) whichstated that the sale of coal remains exempt from VAT. In 2007, SMC filed a total claim for refundof P=190.50 million from the BIR representing VAT erroneously withheld by NPC fromDecember 2005 to March 2007, which eventually was elevated to the Court of Tax Appeals(CTA). On October 13, 2009, CTA granted SMC’s petition for a refund on erroneously withheldVAT initially on December 2005 sales amounting to P=11.85 million. The Commissioner of BIRmoved for reconsideration of the CTA’s Decision. On November 21, 2009, SMC filed itscomment thereon. On August 10, 2010, the CTA issued a Writ of Execution on its decision datedOctober 13, 2009 and was served to BIR on August 13, 2010.
In 2011, the CTA rendered a decision granting the SMC’s petition for refund or issuance of taxcredit certificate (TCC) in the total amount of P=178.65 million. The Commissioner of BIR filed amotion for reconsideration which was denied in a Resolution executed by the CTA. TheCommissioner of BIR filed for a Petition for Review with the CTA En Banc.
In 2012, CTA En Banc rendered a decision dismissing the petition for review for the lack of meriton P=163.36 million refund.
In 2012, management has estimated that the refund will be recovered after ten (10) to fifteen (15)years. Consequently, the claim for tax refund was provided with provision for impairment lossesamounting to P=47.15 million (Note 25).
On January 30, 2013, the Supreme Court denied the BIR Commissioner's Petition for Review.Subsequently, the latter filed a Motion for Reconsideration with the Supreme Court.On June 19, 2013, the Supreme Court denied such petition of Motion for Consideration withfinality. On September 18, 2013, Entry of Judgment was issued by the Supreme Court in GR No.203621. On January 21, 2014, a “Notice of Resolution” was received from the Court of TaxAppeals citing that "It is appearing that the Resolution of the Supreme Court dated January 30,2013 has already become final and executory and Entry of Judgment was already issued by theSupreme Court on September 19, 2013, herein SMC is entitled as a matter of right to a writ ofexecution. It, therefore, becomes the ministerial duty of CTA to issue a writ of execution”.
Because of the above developments, management reassessed the timeline of collection to be in5 years (instead of 15 years). A re-estimation of the realizable value was made by themanagement using discounted cash flows with the assumption of collection in 5 years anddiscount rate of 2.91%. This resulted to a reversal of P=61.55 million provision for impairment lossreflected as "Other income” in the consolidated statements of income (see Note 28).
- 71 -
*SGVFS007333*
Movements in allowance for impairment losses of the 5% input VAT withheld follows:
2013 2012At January 1 P=87,525 P=40,374Provision (Note 25) – 47,151Reversal (Note 28) (61,549) –At December 31 P=25,976 P=87,525
Prepaid RentThe Group entered into a Land Lease Agreement (LLA) with PSALM for the lease of land inwhich the plant is situated for a period of twenty-five (25) years. The Group paid US$3.19 millionor its peso equivalent of P=150.57 million as payment for the 25 years of rental (Note 37).
Long term portion of the prepaid rent amounted to P=85.36 million and P=95.01 million as ofDecember 31, 2013 and 2012, respectively.
Capitalized development costsIn 2013, SCI has capitalized development expenditures amounting to P=37.96 million which isincluded in “Others”. Development costs for goods, commodities, wares and merchandiseincluding potter earthenware, stoneware, bricks, tiles, roofs and other merchandise produce fromclay are recognized as an intangible asset.
Software CostMovements in software cost account follow:
2013 2012At CostAt January 1 P=131,188 P=114,172Additions 20,379 17,016At December 31 151,567 131,188Accumulated AmortizationAt January 1 81,243 53,120Amortization (Notes 24 and 25) 36,726 28,123At December 31 117,969 81,243Net Book Value P=33,598 P=49,945
Prepaid taxPrepaid tax pertains to the current portion of the advance payment of documentary stamp tax inrelation to the availments of long term borrowings during the year.
Acceptances and trust receipts payableAcceptances and trust receipts are used by the Group to facilitate payment for importations ofmaterials, fixed assets and other assets. These are noninterest-bearing and with maturity of lessthan one (1) year.
Bank loansThe Group’s bank loans consist of unsecured peso-denominated short-term borrowings from localbanks which bear annual interest ranging from 1.17% to 4.00% in 2013 and 1.04% to 2.00% in2012, and are payable on monthly, quarterly and lump sum bases on various maturity dates withinthe next twelve (12) months after the reporting date.
The Group’s agreements with local banks contain some or all of the following restrictions relatingto, among others: purchase of issued and outstanding capital stock; disposal of encumberedproperties; change in the ownership or management and nature of its business; dividenddeclaration and distribution; guarantees; incurrence of additional liabilities; and merger andconsolidation.
As of December 31, 2013 and 2012, the Group is in compliance with the loan covenants requiredby the banks. Finance costs incurred on bank loans and short term borrowings amounted toP=126.96 million and P=50.80 million and P=87.09 million in 2013, 2012 and 2011, respectively(Note 27).
16. Liabilities for Purchased Land
Liabilities for purchased land represent the balance of the Group’s obligations to various realestate property sellers for the acquisition of certain parcels of land. The terms of the deeds ofabsolute sale covering the land acquisitions provided that such obligations are payable only afterthe following conditions, among others, have been complied with: (a) presentation by the propertysellers of the original transfer certificates of title covering the purchased parcels of land; (b)submission of certificates of non-delinquency on real estate taxes; and (c) physical turnover of theacquired parcels of land to the Group.
The outstanding balance of liabilities for purchased land as of December 31, 2013 and 2012follow:
2013 2012Current P=885,088 P=929,379Noncurrent 487,389 215,945Balance at end of the year P=1,372,477 P=1,145,324
In 2013, liabilities for purchased land with a nominal amount of P=749.35 million were recorded atfair value at inception date amounting P=737.59 million. These liabilities for purchased land arepayable over a period of two (2) to four (4) years. The fair value is derived using discounted cashflow model using the discount rate ranging from 1.02% to 3.32% in 2013 based on applicablerates for similar types of liabilities.
2013 2012Balance at beginning of year P=– P=23,397Accretion for the year (Note 27) (9,174) (23,397)
(P=9,174) P=–
- 73 -
*SGVFS007333*
Accretion amounting P=9.17 million and P=23.40 million are recorded as finance costs in 2013 and2012, respectively (Note 27).
17. Accounts and Other Payables
This account consists of the following:
2013 2012Trade and other payables
Suppliers and subcontractors (Note 20) P=6,624,948 P=8,495,512Others 574,878 511,776
Accrued costs and expenses 6,650,148 4,210,227Output VAT payable 1,410,799 543,445
15,260,773 13,760,960Less noncurrent portion of trade and other payables
SuppliersPayable to suppliers include liabilities to various foreign and local suppliers for open accountpurchases of equipment and equipment parts and supplies. These are noninterest bearing and arenormally settled on a 30-to 60-day credit terms.
SubcontractorsSubcontractors payable arise when the Group receives progress billing from its subcontractors forthe construction cost of a certain project and is recouped against monthly billings. Thesesubcontractors were selected by the contract owners to provide materials, labor and other servicesnecessary for the completion of a project. These are non-interest bearing and are normally settledon 15-to-60 day terms.
Other PayablesOther payables include payable to nickel mine rights owner and marketing agents. These arenoninterest-bearing and are normally settled within one (1) year.
Accrued Costs and ExpensesAccrued costs and expenses consist mainly of accrual of salaries, taxes and others. Furtheranalysis is provided below:
2013 2012Accrued construction cost P=4,775,876 P=2,578,564Payable to Department of Energy (DOE) (Note 31) 877,948 1,007,849Accruals:
Accrued construction costAccrued construction costs pertain to direct materials, labor, overhead and subcontractor costs forwork accomplished by the suppliers and subcontractors but were not yet billed to DMCI. As ofDecember 31, 2013 and 2012, accrued construction cost amounted to P=4,775.88 million andP=2,578.56 million, respectively.
Payable to DOELiability to the DOE and local government units represents the share of DOE and localgovernment units in the gross revenue from SMC’s coal production (including accrued interest onthe outstanding balance) computed in accordance with the coal operating contract between SMC,DOE and the local government units dated July 11, 1977, as amended on January 16, 1981. Thecontract is for a maximum period of 35 years (inclusive of the developmental stage and renewals)up to July 2012.
Financial benefits payableAs mandated by the R.A. 9136 or the Electric Power Industry Reform Act (EPIRA) of 2001 andthe Energy Regulations No. 1-94, issued by Department of Energy (DOE), the BOD authorizedthe Group on June 10, 2010 to enter and execute a Memorandum of Agreement with the DOErelative to or in connection with the establishment of Trust Accounts for the financial benefits tothe host communities equal to P=0.01 per kilowatt hour generated.
OthersOthers include accruals for contracted services, utilities, supplies, advertising, commission andother administrative expenses.
18. Customers’ Advances and Deposits
The customers’ advances and deposits are due to the following:
Real Estate CustomersCustomers’ advances and deposits from real estate customers represent reservation fees and initialcollections received from customers before the two parties enter into a sale transaction. Thesewere payments from buyers which have not reached the minimum required percentage. When thelevel of required percentage for revenue recognition is reached by the buyer, sale is recognizedand these deposits will be recognized as revenue and will be applied against the receivablebalance.
- 75 -
*SGVFS007333*
Coal and Nickel Ore Supply ContractsThese deposits represent advances from customers of SMC and DMC. Coal deposits are appliedagainst future coal deliveries which occur within one year from the dates the deposits were madewhile nickel ore will be applied to related receivables upon consummation of the sale transaction.
19. Long-term Debt
Long-term debt pertains to the following obligations:
2013 2012Bank loans P=34,644,843 P=24,833,115Less current portion of bank loans 3,386,257 6,642,262Noncurrent portion P=31,258,586 P=18,190,853
- 76 -
*SGVFS007333*
Details of the bank loans follow (amounts in millions):
Date of Outstanding BalancesLoan Type Availment 2013 2012 Maturity Interest Rate Payment Terms Covenants/CollateralsLocal bank loansSMCLoan 1 Various availments
in 2010, 2011 and2013
P=342 P=948 Various maturitiesin 2012, 2013 and
2015
Floating ratepayablequarterly and inarrears, to berepriced every90 days
Interest payable quarterly and in arrears,subject to quarterly setting and principalrepayable in bullet at the end of three (3)years from drawdown date.
Proceeds of the loans wererestricted for the purchase ofmining equipment; Unsecuredloan
Loan 2 July 2011 – 230 July 2013 Floating rate,to be repriced every30 to 180 days
Interest shall be payable on the last day ofthe current interest period or the 90th dayof said period whichever occurs earlier andfull payment of principal at maturity.
Unsecured loans
Loan 3 Various availmentsin 2010, 2011 and
2013
2,743 2,557 Various maturities in2012, 2013, 2014 and
2016
Floating rateto be repricedevery 90 days
Interest payable in 90 days; not deductedfrom proceeds of loans and principalrepayable in maturity.
Proceeds of the loan will be usedto finance capital expenditures andgeneral corporate purposesFinancial Covenants:Current Ratio not less than 1:1 andDebt-Equity Ratio not to exceed2:1; compliant
Loan 4 Various availmentsin 2011 and 2013
1,554 1,040 Various maturities in2013, 2014, 2015 and
2016
Floating rate,aggregate of themargin (1.20%) andLIBOR, to berepriced every 90 to180 days
Interest payable in arrears for the relevantinterest period and principal repayable insemi-annual installments commencing onthe 12th month after the date of theAgreement until date of final maturity.
Proceeds of the loan wererestricted for capital expenditurerequirements and refinancing ofexisting debtsFinancial Covenants: CurrentRatio not less than 1:1, Debt-Equity Ratio not exceeding 2:1,Debt-EBITDA Ratio notexceeding 3:1, compliant
Loan 5 October 2013 152 – September 24, 2015 Floating rate Interest and principal are payable on thedate of maturity
Unsecured loansCurrent Ratio at least 1.0x; Debt-Equity Ratio at least 2.0x;compliant
Loan 6 January 2011 − 131 January 2013 Interest rate subjectto review andresetting based onthe prevailingmarket rate
Balloon payment of the principal atmaturity
Unsecured loans
(Forward)
- 77 -
*SGVFS007333*
Date of Outstanding BalancesLoan Type Availment 2013 2012 Maturity Interest Rate Payment Terms Covenants/CollateralsSLPGCMortgage payable February 4, 2012 P=5,675 P=547 February 4, 2022 PDST-F + Spread or
BSP OvernightRate, whichever ishigher
The principal amount shall be paid intwenty-seven equal consecutive quarterlyinstallments commencing on the fourteenthquarter from the initial borrowing date.Final repayment date is ten (10) years afterinitial borrowing.
67% of issued and outstandingshares of SLPGC owned by theParent Company
SCPCMortgage payable May 20, 2010 5,342 6,857 May 20, 2017 PDST-F benchmark
yield for 3-monthtreasury securities +1.75%
Payable in twenty-five (25) equalconsecutive quarterly installmentscommencing on May 20, 2011
Monies in the CollateralAccounts, supply receivables,proceeds of asset and businesscontinuity insurance obtained bySCPC, project agreements, first-ranking mortgage on present andfuture real assets and first-rankingchattel mortgage
Wire RopeLoans payable Various 2 − October 22, 2015 and
July 7, 201615.16% to 17.00% Payable upon maturity of the loans. None
Beta ElectricLoans payable Various 13 − July 2015 8.68% to 10.89% Payable in equal monthly installments
starting May 2007 up to July 2015,The loans are secured by a chattelmortgage for the whole amount ofthe Beta Electric’s transportationequipment purchased using theproceeds of these loans.
PDIFixed rate corporate notes October 2012 14,791 5,865 Various maturities
from 2016 to 2020PDST-F Issue Dateand ending three (3)months after suchIssue Date, andevery three (3)months thereafter
Payments shall be made in each tranche isequal to 1% every year from the issue dateand the balance payable at maturity
Financial Covenants: Debt-EquityRatio not exceeding 3.2 times,Current ratio is at least 1.75 times.The Group is in compliance withthe above covenants as ofDecember 31, 2013 and 2012.
PDIAgreement to purchasereceivables (with recourse)
Various 4,031 6,658 Various 5%-8% p.a. Payable in equal and continuous monthlypayments not exceeding 120 dayscommencing one (1) month from date ofexecution.
Real estate receivables withcarrying value of P=1.06 billion andP=1.70 billion in 2013 and 2012 ,respectively (Note 7).
34,645 24,833Less: current portion 3,386 6,642Long-term debt net of current portion P=31,259 P=18,191
- 78 -
*SGVFS007333*
Local bank loansSMCAs of December 31, 2013, there is no more available borrowing facility that can be drawn.
The maturities of long-term debt at nominal values as of December 31, 2013 and 2012 follow:
Mortgage payableSLPGCOn February 4, 2012, SLPGC entered into an P=11.50 billion Omnibus Agreement with Banco deOro Unibank (BDO), Bank of the Philippine Island (BPI) and China Banking Corporation (CBC)as Lenders. As security for the timely payment of the loan and prompt observance of all theprovision of the Omnibus Agreement, the 67% of issued and outstanding shares of SLPGCowned by Semirara were pledged on this loan. The proceeds of the loan will be used for theengineering, procurement and construction of 2x150 MW coal-fired thermal power plant.
a. Interest: At applicable interest rate (PDST-F + Spread or BSP Overnight Rate, whichever ishigher). Such interest shall accrue from and including the first day of each interest period upto the last day of such interest period. The Facility Agent shall notify all the Lenders of anyadjustment in an interest payment date at least three banking days prior to the adjustedinterest payment date.
b. Repayment: The principal amount shall be paid in twenty-seven equal consecutive quarterlyinstallments commencing on the fourteenth quarter from the initial borrowing date. Finalrepayment date is ten (10) years after initial borrowing.
- 79 -
*SGVFS007333*
The first drawdown was made on May 24, 2012 amounting to P=550.00 million. While in Apriland November of 2013, second and third drawdowns were made which amounted to P=2.89 billionand P=2.26 billion, respectively. As of December 31, 2013 and 2012, amortization of debt issuancecost recognized as part of “Property, plant and equipment” account in the consolidated statementsof financial position amounted to P=2.33 million and P=0.24 million, respectively.
Rollforward of debt issuance cost follows:
2013 2012At January 1 P=2,506 P=−Additions 25,757 2,750Amortization (2,327) (244)At December 31 P=25,936 P=2,506
Mortgage payable by SLPGC provide certain restrictions and requirements with respect to, amongothers, maintain and preserve its corporate existence, comply with all of its material obligationsunder the project agreements, maintain at each testing date a Debt-to-Equity ratio not exceedingtwo times, grant loans or make advances and disposal of major property. These restrictions andrequirements were complied with by SLPGC as of December 31, 2013 and 2012.
Provision in the loan indicates that the borrower shall pay to the lenders, a commitment feeequivalent to one-half (1/2%) per annum of any portion of a scheduled drawdown amount thatremains undrawn after the lapse of the relevant scheduled drawdown month. As ofDecember 31, 2013 and 2012, SLPGC has paid commitment fee amounting to P=6.99 million andP=2.30 million, respectively and these were recognized under the “Finance costs” account in theconsolidated statements of comprehensive income.
The amount of undrawn borrowing facilities that maybe available in the future amounts toP=5.80 billion.
SCPCOn May 20, 2010, SCPC entered into a P=9.60 billion Omnibus Loan Security Agreement(“Agreement”) with BDO, BPI and Philippine National Bank (PNB) as Lenders, SMC asGuarantor, BDO Capital and Investment Corporation as Lead Arranger and Sole
Bookrunner, BPI Capital Corporation and PNB Capital and Investment Corp. as Arrangers, andBDO Unibank, Inc., Trust and Investments Group as Security Trustee, Facility Agent and PayingAgent. The loan was fully drawn by SCPC on the same date.
Mortgage payable by SCPC was collateralized by all monies in the Collateral accounts, supplyreceivables, proceeds of any asset and business continuity insurance, project agreements andfirst-ranking mortgage on present and future real assets. Further, 67% of issued and outstandingshares in SCPC owned by SMC were also pledged on this loan.
Breakdown is as follows:
BDO Unibank P=6,000,000BPI 2,000,000PNB 1,600,000
P=9,600,000
- 80 -
*SGVFS007333*
The Agreement was entered into to finance the payments made to PSALM pursuant to the APAand LLA, and ongoing plant rehabilitation and capital expenditures.
Details of the loan follow:a. Interest: At a floating rate per annum equivalent to the three (3) months Philippine Dealing
System Treasury-Fixing (PDST-F) benchmark yield for treasury securities as published on thePDEx page of Bloomberg (or such successor electronic service provider at approximately11:30 a.m. (Manila Time) on the banking day immediately preceding the date of initialborrowing or start of each interest period, as applicable, plus a spread of 175 basis points.
b. Repayment: The principal amount shall be payable in twenty-five equal consecutive quarterlyinstallments commencing on the twelfth month from the initial borrowing date. Finalrepayment date is seven (7) years after initial borrowing.
Rollforward of the deferred issuance cost follows:
2013 2012At January 1 P=55,304 P=82,428Amortization (Note 27) (21,752) (27,124)At December 31 P=33,552 P=55,304
Amortization of debt issuance cost recognized under “Finance cost” account in the consolidatedstatements of comprehensive income amounted to P=21.75 million, P=27.12 million andP=22.42 million for the years 2013, 2012 and 2011, respectively (see Note 27).
As of December 31, 2013, there is no more available borrowing facility that can be drawn.
Loans payableWire RopeLoans payable represents unsecured loans from local banks bearing annual interest rates rangingfrom 17.00% to 18.14% and 15.16% to 17.00% in 2013 and 2012, respectively. Wire Ropeavailed additional loans amounting to P=1.33 million and P=0.90 million and made payments to theloans amounting to P=0.85 million and P=0.32 million, respectively.
Beta ElectricLong-term debt represents peso-denominated long-term borrowings from local banks which bearinterest ranging from 8.68% to 10.89% and 8.68% to 10.78% per annum in 2013 and 2012,respectively, and are payable in equal monthly installments starting May 2007 up to July 2015.The loans are secured by a chattel mortgage for the whole amount of Beta Electric’s transportationequipment purchased using the proceeds of these loans.
In 2013, Beta Electric obtained short-term loans from its local bank with an aggregate amount ofP=55.00 million which bear interest ranging from 5.50% to 5.75%. As of December 31, 2013, theoutstanding balance from loans amounted to P=13.00 million which is payable on January 2014.
Fixed rate corporate notesPDIIn October 2012, PDI signed corporate notes facility agreement on the issuance of 7-year pesodenominated notes in the aggregate amount of P=10,000.00 million with local banks. Proceeds ofthe notes facility were used to fund land acquisition, general operations and project developmentand construction.
- 81 -
*SGVFS007333*
The notes were issued in three (3) tranches and payments were made in each tranche are as follows:
Quarter fromIssue Date
Based on aggregate % of issue amount of each Series(Equally divided over the applicable quarters)
7th to 10th Quarter 2%11th to 14th Quarter 4%15th to 18th Quarter 5%19th to 27th Quarter 12%Final Maturity 77%Total 100%
Tranche 1 of the P=10,000.00 million Series C was issued on October 31, 2012 in the aggregateamount principal amount of P=1,000.00 million. Tranche 2 (Series D) and 3 (Series E) were issuedon April 10, 2013 and July 30, 2013 in the aggregate principal amount of P=4,000.00 million andP=5,000.00 million, respectively.
The note is issued in registered form in the minimum denominations of P=100.00 million andmultiples of P=10.00 million each. Corporate notes shall bear interest three (3) months after date ofissue and every three (3) months thereafter.
Tranche 1 (Series A) of P=5,000.00 million corporate notes was issued on January 28, 2011, in theaggregate principal amount of P=2,000.00 million while Tranche 2 (Series B) were issued onMarch 17, 2011, in the aggregate principal amount of P=3,000.00 million. They were issued inregistered form in the minimum denominations of P=100.00 million and multiples ofP=10.00 million each.
Corporate notes shall bear interest from Tranche 1 and 2 PDST-F Issue Date and ending three (3)months after such Issue Date, and every three (3) months thereafter. The interest rate shallinitially be the PDST-F benchmark yield for five-year treasury securities (Base Rate) on bankingday immediately preceding an Issue Date plus the Margin (125 basis points) for each of theTranche, gross of any applicable withholding taxes. Interest is payable quarterly.
Unamortized debt issuance costs included in fixed rate corporate notes as of 2013 and 2012amounted to P=109.50 million and P=85.17 million, respectively.
The rollforward analysis of unamortized debt issuance cost follows:
2013 2012Balance at beginning of year P=85,171 P=47,891Availments 45,000 48,660Amortization of debt issue cost (20,676) (11,380)Balance at end of year P=109,495 P=85,171
In 2013, interest expense incurred and capitalized interest related to long-term debt amounted toP=1,172.71 million and P=672.58 million, respectively. The average capitalization rates used are6.44% and 6.88% of the average expenditures in 2013 and 2012, respectively.
The P=10,000.00 million and P=5,000.00 million corporate notes facility agreement requires PDI toensure that debt-to-equity ratio will not exceed 3.2 times and 2.0 times, respectively, and currentratio is at least 1.75 times. As of December 31, 2013 and 2012, PDI is fully compliant with theserequirements.
- 82 -
*SGVFS007333*
As of December 31, 2013 and 2012, corporate notes recognized are unsecured.
Agreement to purchase receivablesPDI entered into various purchase agreements with financial institutions whereby the subsidiariesassigned its receivables. The purchase agreements provide that the subsidiaries should substitutedefaulted contracts to sell with other contracts to sell of equivalent value. The subsidiaries stillretain the assigned receivables in the receivables account and record the proceeds from these salesas loans payable which amounted to P=4,031.25 million and P=6,658.00 million as of December 31,2013 and 2012, respectively (Note 7). The agreements also provide the submission ofcondominium certificates of title and their related postdated checks issued by the buyers. Theseloans bear interest at prevailing market rates and are payable in various maturity dates. Theaverage effective interest rate ranges from 5.25% to 5.75% and 5.00% to 6.50% in 2013 and 2012,respectively.
Working capital loanThe Group availed of various working capital loans including car financing and leasing.
Unused credit linesThe Group has unused credit lines with local banks amounting P=5.80 billion and P=3.67 billion asof December 31, 2013 and 2012, respectively.
20. Other Noncurrent Liabilities
The details of this account consist of:
2013 2012Noncurrent trade payables (Note 17) P=1,496,710 P=1,460,267Provision for decommissioning and site
rehabilitation 196,504 62,448Others − 4,940
P=1,693,214 P=1,527,655
The rollforward analysis of the provision for decommissioning and site rehabilitation accountfollows:
2013 2012At January 1 P=62,448 P=47,582Addition 133,189 5,266Accretion of interest (Note 27) 867 9,600At December 31 P=196,504 P=62,448
Accounts payable tradeNoncurrent payables includes noninterest-bearing payable to suppliers and subcontractors andaccrued expenses which are expected to be settled within 2 to 3 years from the reporting date andretention contract payment that is being withheld from the contractors as guaranty for any claimswhich are expected to be settled a year after the turn-over of projects.
- 83 -
*SGVFS007333*
Provision for decommissioning and site rehabilitationDiscount rates used by the Group to compute for the present value of liability fordecommissioning and site rehabilitation cost are from 5.79% to 8.77% in 2012 and 3.63% to4.63% in 2013.
Additions pertain to the effects of changes in estimates as to the extent and costs of rehabilitationactivities, cost increases and changes in discount rates based on relative prevailing market rates.
21. Related Party Transactions
Related parties are considered to be related if one party has the ability, directly or indirectly, tocontrol the other party or exercise significant influence over the other party in making the financialand operating decisions. Parties are also considered to be related if they are subject to commoncontrol or common significant influence. Related parties may be individuals or corporate entities.
Transactions entered into by the Group with related parties are at arm’s length and have termssimilar to the transactions entered into with third parties. In the regular course of business, theGroup’s significant transactions with related parties include the following:
2013Due from
(Due to) Amount / Volume* Term ConditionsAssociates
Receivable from related partiesa. Sale of property, plant and
equipment P=107,016 P=107,016 1-30 daysUnsecured, no
impairmentOthersb. Advances to subcontractors,
suppliers and contract owners 1,979 − Noninterest - bearingUnsecured, no
impairment
b. Retention receivable 98,527 − Noninterest - bearingUnsecured, no
impairment
b. Construction contracts 287,008 1,223,146 Noninterest - bearingUnsecured, no
impairmentb. Billings in excess of costs and
estimated earnings on uncompleted contracts (29,286) −
Payable on demand,noninterest-bearing Unsecured
AffiliatesReceivable from related parties
c. Rental income 19,208 7,380 1-30 daysUnsecured, no
impairmentd. Mine exploration and hauling
services 5,372 6,588 1-30 daysUnsecured, no
impairmentPayable to related parties
f. Supply of materials (444) 5,659Payable on demand,noninterest-bearing Unsecured
d. Mine exploration and hauling services (20,139) 554,092
Payable on demand,noninterest-bearing Unsecured
c. Lease of office spaces (6,303) 6,386Payable on demand,noninterest-bearing Unsecured
g. Other general and administrative expense (623) 953
Payable on demand,noninterest-bearing Unsecured
h. Aviation services (1,540) 6,890Payable on demand,noninterest-bearing Unsecured
i. Purchases of office supplies andrefreshments (2,726) 5,659
Payable on demand,noninterest-bearing Unsecured
j. Labor charges (2,184) –Payable on demand,noninterest-bearing Unsecured
e. Office and parking rental expenses (33) 2,793
Payable on demand,noninterest-bearing Unsecured
- 84 -
*SGVFS007333*
2012Due from
(Due to) Amount / Volume* Term ConditionsAssociates
Othersb. Advances to subcontractors,
suppliers and contract owners P=12,870 P=– 1-30 daysUnsecured, no
impairment
b. Retention receivables 104,900 – 1-30 daysUnsecured, no
impairment
b. Construction contracts 170,020 653,300 1-30 daysUnsecured, no
impairmentb. Billings in excess of costs and
estimated earnings on uncompleted contracts (57,600) –
Payable on demand,noninterest-bearing Unsecured
AffiliatesReceivable from related parties
c. Rental income 187,296 6,942 1-30 daysUnsecured, no
impairmentPayable to related partiesd. Mine exploration and hauling
services (55,893) 438,73130 days;
noninterest-bearing Unsecured
f. Supply of materials (3,532) 30,33530 days;
noninterest-bearing Unsecurede. Office and parking rental
expenses (1,790) 3,668Payable on demand;noninterest-bearing Unsecured
*Balances presented pertain to transactions between related parties during the year. Amounts are not reduced by subsequentcollections/payments during the year.
(a) In December 2013, DMC sold various property, plant and equipment on account to BNC, anassociate of TMC, which will be used for its mining operations in Palawan.
(b) In 2013 and 2012, DMCI is engaged in the construction of Tarlac - Pangasinan - La Union TollExpressway (TPLEX) through PIDC an associate of the Group.
Related contract revenue recorded by DMCI on PIDC amounted to P=1,223.15 million andP=653.30 million in 2013 and 2012, respectively.
DMCI has outstanding receivables from PIDC amounting to P=287.01 million andP=170.02 million as of December 31, 2013 and 2012, respectively.
Retention receivable and advances to contract owners amounted to P=98.53 million andP=1.98 million as of December 31, 2013 and P=104.90 million and P=12.87 million as atDecember 31, 2012, respectively.
Unliquidated advances from contract owners amounted to P=29.29 million and P=57.60 million asat December 31, 2013 and 2012, respectively.
(c) Receivable from DMC Urban Property Developers, Inc. (UPDI), an affiliate under commonstockholder amounted to P=19.21 million and P=187.30 million as at December 31, 2013 and2012, respectively.
In 2013, UPDI had transactions with SMC representing long-term lease on office space andother transactions rendered to SMC necessary for the coal operations.
(d) DMC-Construction Equipment Resources, Inc. (DMC-CERI), an affiliate, under commonstockholder, has transactions with SMC for services rendered relating to the SMC’s coaloperations. These services are for the confirmatory drilling for coal reserve evaluation of
- 85 -
*SGVFS007333*
identified potential areas, exploratory drilling of other minerals within Semirara Island,dewatering well drilling along cut-off wall of Panian mine and fresh water well drilling forindustrial and domestic supply under an agreement.
DMC-CERI also provides to SMC marine vessels for use in the delivery of coal to its variouscustomers. The coal freight billing is on a per metric ton basis plus demurrage charges whendelay will be incurred in the loading and unloading of coal cargoes.
The outstanding receivable of DMC from DMC-CERI pertains to repairs and maintenance, fueland materials and meal allowances of barge and tugboat crews incurred, which are initially paidby DMC in behalf of DMC-CERI. The outstanding receivable is included in “Receivable fromrelated parties” under “Receivables” account in the consolidated statements of financialposition.
(e) Asia Industries Inc., an affiliate, under common stockholder, had transactions with the Groupfor the rental of office and parking spaces to which related expenses are included in “Operatingexpenses” in the consolidated statements of income. The outstanding balance to AsiaIndustries, Inc. is lodged under “Payable to related parties” in the consolidated statements offinancial position.
(f) M&S Company, Inc. (M&S), an affiliate under common control, provides various supplies andmaterials to DMC in cash on delivery basis. M&S also rents out various equipment used inDMC’s operations. This is included in “Cost of sales and services” in the consolidatedstatements of income.
(g) Dacon, a shareholder of the Parent Company, provided maintenance of the Group’s accountingsystem, Navision, to which related expenses are included under “Others” of “Operatingexpenses” in the consolidated statements of income.
(h) Royal Star Aviation Inc. transports SMC’s visitors and employees from Manila to SemiraraIsland and vice versa and bills the related party for the utilization costs of the aircrafts. Therelated expenses are included in “Cost of sales and services” in the consolidated statements ofincome. The outstanding balance to Royal Star Aviation, Inc. is included in “Payable to relatedparties” in the consolidated statements of financial position.
(i) Prominent Fruits, Inc. supplies various office supplies and refreshments to SMC. Theoutstanding balance to Prominent Fruits, Inc. is included under “Payable to related parties” inthe consolidated statements of financial position.
(j) Payable to Sirawai pertains to labor charges incurred by DMC, which are initially paid bySirawai in behalf of DMC. The outstanding payable to Sirawai is recorded in “Payable torelated parties” in the consolidated statements of financial position.
Terms and conditions of transactions with related partiesOutstanding balances as of December 31, 2013 and 2012, which are unsecured and interest free,are all due within one year. As of December 31, 2013 and 2012, the Parent Company has notmade any provision for impairment loss relating to amounts owed by related parties. Thisassessment is undertaken each financial year through examining the financial position of therelated party and the market in which the related party operates.
- 86 -
*SGVFS007333*
Compensation of Key Management PersonnelKey management personnel of the Group include all directors and senior management. Theaggregate compensation and benefits of key management personnel of the Group follows:
There are no agreements between the Group and any of its directors and key officers providing forbenefits upon termination of employment, except for such benefits to which they may be entitledunder the Group’s pension plan.
22. Equity
Capital StockAs of December 31, 2013 and 2012, the Parent Company’s capital stock consists of:
2013 2012Preferred stock - P=1 par value cumulative and
Common stock - P=1 par valueAuthorized - 5,900,000,000 sharesIssued - 2,655,494,000 shares 2,655,494 2,655,494
P=2,655,498 P=2,655,498
The preferred stock is redeemable, convertible, non-voting, non-participating and cumulative withpar value of P=1.00 per share. The preferred shareholders’ right of converting the preferred sharesto common shares expired in March 2002.
In 2011, the Parent Company retired 600 preferred shares. The difference between the redemptionprice amounting P=0.60 million was charged against the additional paid-in capital account.
On December 18, 1995, the Parent Company launched its Initial Public Offering where a total of1.13 billion common shares were offered at an offering price of P=9.12 per share.
Additional paid in capital account as of December 31, 2013 and 2012 and January 1, 2012amounted to P=4.77 billion.
- 87 -
*SGVFS007333*
Below is the summary of the Parent Company’s track record of registration of securities with theSEC as of December 31, 2013:
Year
Number ofShares
Registered(in billions)
Number of holders of
securities as ofyear end
December 31, 2011 2.66 714Add/(Deduct) Movement – –December 31, 2012 2.66 714Add/(Deduct) Movement – (8)December 31, 2013 2.66 706
Retained EarningsIn accordance with SEC Memorandum Circular No. 11 issued in December 2008, the ParentCompany’s retained earnings available for dividend declaration (after reconciling items) as ofDecember 31, 2013 and 2012 amounted to P=18.60 billion and P=8.48 billion, respectively.
Under the tax code, publicly held corporations are allowed to accumulate retained earnings inexcess of capital stock and are exempt from improperly accumulated earnings tax.
Dividend declarationThe Parent Company’s BOD approved the declaration of cash dividends in favor of all itsstockholders as follows:
2013 2012 2011April 11, 2013, P=1.20 per share
cash dividend to stockholdersof record as of April 26, 2013,payable on or beforeMay 10, 2013. P=3,186,593 P=− P=−
April 11, 2013, P=1.00 per sharespecial cash dividend tostockholders of record as ofApril 26, 2013, payable on orbefore May 10, 2013. 2,655,494 − −
November 14, 2013, P=1.20 pershare special cash dividend tostockholders of record as ofNovember 29, 2013, payableon or beforeDecember 13, 2013. 3,186,593 − −
May 15, 2012, P=1.20 per sharecash dividend to stockholdersof record as of June 11, 2012,payable on or beforeJuly 7, 2011. − 3,186,593 −
(Forward)
- 88 -
*SGVFS007333*
2013 2012 2011May 31, 2011, P=1.00 per share
cash dividend to stockholdersof record as of June 15, 2011payable on or beforeMay 11, 2012 P=− P=− P=2,655,494
P=9,028,680 P=3,186,593 P=2,655,494
On various dates in 2013, 2012 and 2011, Semirara, Beta and Wirerope declared dividendsamounting P=4,283.70 million, P=4,282.46 million and P=3,607.40 million, respectively, of whichdividends to non-controlling interest amounted to P=1,870.65 million, P=1,870.18 million andP=1,575.71 million, respectively.
Appropriation of retained earningsOn December 29, 2011 the BOD authorized the Parent Company to appropriate P=3,000.00 millionof its retained earnings for capital expenditures and investments which are expected to be utilizedfrom 2012 to 2014.
On December 28, 2012, the Parent Company’s BOD has appropriated P=1,600.00 million from itsunrestricted retained earnings as of December 31, 2012. The appropriated amount will be utilizedfor the stock subscription in DMCI Mining which it can use to fund ongoing acquisition of sharesof stocks in TMC. The acquisition was completed in 2013. As of December 31, 2013, DMCIMining accumulated shares in TMC aggregated 98.09% of outstanding shares (Note 33).
On December 27, 2013, the Parent Company’s BOD has approved the reversal of theappropriation made in 2012 amounting to P=3,800.00 million pertaining to the stock subscription inDMCI Mining which was used to fund the acquisition of shares of stocks in TMC. Theappropriation was reversed to unappropriated retained earnings. On the same date, the BOD of theParent Company authorized the appropriation out of its retained earnings for capital expendituresand investments amounting to P=1,300.00 million.
The unappropriated retained earnings include accumulated equity in undistributed net earnings ofconsolidated subsidiaries, associates and jointly controlled entities accounted for under equitymethod of P=22,816.89 million and P=20,530.81 million as of December 31, 2013 and 2012,respectively. These are not available for dividend declaration until declared by the subsidiaries,associates and the jointly controlled entities.
Capital ManagementThe primary objective of the Group’s capital management strategy is to ensure that it maintains astrong credit rating and healthy capital ratios in order to support its business and maximizeshareholder value.
The Group manages its capital structure and makes adjustments to it, in light of changes ineconomic conditions. To maintain or adjust the capital structure, the Group may adjust thedividend payment to shareholders or issue new shares. There were no changes made in theGroup’s capital management objectives, policies or processes. The Group considers totalstockholders’ equity as capital. Equity, which the Group considers as capital, pertains to theequity attributable to equity holders of the Group less unrealized gain or loss on AFS financialassets.
The Group is not subject to any externally imposed capital requirements.
- 89 -
*SGVFS007333*
23. Employee Benefits
Retirement PlansThe Group has a funded, noncontributory, defined benefit pension plan covering substantially allof its regular employees. Provisions for pension obligations are established for benefits payable inthe form of retirement pensions. Benefits are dependent on years of service and the respectiveemployee’s final compensation. The Group updates the actuarial valuation every year by hiringthe services of a third party professionally qualified actuary. The latest actuarial valuation reportsof the retirement plans were made as of December 31, 2013.
The Retirement Plan Trustee, as appointed by the Group in the Trust Agreement executed betweenthe Group and the duly appointed Retirement Plan Trustee, is responsible for the generaladministration of the Retirement Plan and the management of the Retirement Fund. TheRetirement Plan Trustee may seek the advice of counsel and appoint an investment manager ormanagers to manage the Retirement Fund, an independent accountant to audit the Fund and anactuary to value the Retirement Fund.
Under the existing regulatory framework, Republic Act 7641, The Retirement Pay Law, requiresa provision for retirement pay to qualified private sector employees in the absence of anyretirement plan in the entity, provided however that the employee’s retirement benefits under anycollective bargaining and other agreements shall not be less than those provided under the law.The law does not require minimum funding of the plan.
The following table summarizes the components of net pension expense (included in “Salaries,wages and employee benefits” account) and pension income (included in “Other income - net”account) in the consolidated statements of income (see Notes 25 and 28):
Pension Expense
20132012
(As restated)2011
(As restated)Current service cost P=154,761 P=108,857 P=67,926Effect of the asset limit - loss 23,181 18,522 976Net interest income on benefit
obligation and plan assets (57,899) (44,280) 1,900Past service cost - curtailment (15,997) − −Total pension expense P=104,046 P=83,099 P=70,802
Pension Income
20132012
(As restated)2011
(As restated)Current service cost P=1,893 P=1,673 P=28,588Effect of the asset limit - loss 1,819 1,217 22,488Net interest income on benefit
obligation and plan assets (4,141) (2,998) (52,808)Total pension income (P=429) (P=108) (P=1,732)
- 90 -
*SGVFS007333*
Movements in the fair value of plan assets of the Group follow:
December 31,2013
December 31,2012
(As restated)
January 1,2012
(As restated)Balances at beginning of year P=1,934,152 P=1,530,206 P=1,247,551Interest income on plan assets 115,403 97,242 98,839Remeasurement gains 102,771 308,872 108,410Contributions 37,000 − 78,623Benefits paid (3,324) (2,037) (3,162)Transfers from the plan − (131) (55)Balances at end of year P=2,186,002 P=1,934,152 P=1,530,206
Changes in the present value of the defined benefit obligation follow:
December 31,2013
December 31,2012
(As restated)
January 1,2012
(As restated)Balances at beginning of year P=914,845 P=774,999 P=593,509Interest expense on obligation 53,363 49,964 47,931Current service cost 156,654 110,531 96,514Past service cost - curtailment (15,997) − −Benefits paid - from plan assets (3,324) (2,037) (3,162)Benefits paid - direct payments (6,858) (1,929) −Remeasurement losses (gains)
year (P=684,791) (P=518,021) (P=382,226)Net pension income 16,016 26,730 26,306Amounts recognized in other
comprehensive income (90,948) (193,500) (112,085)Contributions (37,000) − (50,016)Net pension asset at end of year (P=796,723) (P=684,791) (P=518,021)
Below is the net pension liability for those entities within the Group with net pension liabilityposition:
December 31,2013
December 31,2012
(As restated)
January 1, 2012
(As restated)Present value of funded defined
benefit obligations P=375,498 P=339,467 P=282,596Fair value of plan assets 281,733 253,118 206,697Net pension liability P=93,765 P=86,349 P=75,899
Movements in the net pension liability follow:
December 31,2013
December 31,2012
(As restated)
January 1, 2012
(As restated)Net pension liability at beginning
of year P=86,349 P=75,899 P=25,353Net pension expense 87,600 56,261 42,764Amounts recognized in other
comprehensive income (73,324) (43,880) 36,390Contributions − − (28,608)Benefits paid - direct payments (6,860) (1,931) −Net pension liability at end of
year P=93,765 P=86,349 P=75,899
The Group does not expect to contribute into the pension fund for the year ending 2014.
- 92 -
*SGVFS007333*
The major categories and corresponding fair values of plan assets by class of the Group’s Plan asat the end of each reporting period are as follow:
December 31,2013
December 31,2012
(As restated)
January 1,2012
(As restated)Cash and cash equivalents
Cash in banks P=6,686 P=7,204 P=48,590Time deposits 59,868 552 3,408
66,554 7,756 51,998Investments in stocks
Common shares 1,484,374 1,429,494 1,088,902Preference shares 18,149 38,217 31,510
1,502,523 1,467,711 1,120,412Investment in government securities
119,639 61,802 75,984Other receivables 17,048 11,010 6,897Accrued trust fees and other payables (334) (238) (485)Fair value of plan assets P=2,186,002 P=1,934,152 P=1,530,206
The investment in stocks is further categorized as follows:
December 31,2013
December 31,2012
(As restated)
January 1,2012
(As restated)Common shares
QuotedHoldings P=1,457,305 P=1,403,762 P=1,074,381Mining and oil 17,146 13,894 –
1,474,451 1,417,656 1,074,381Unquoted
Service 9,923 11,838 14,5211,484,374 1,429,494 1,088,902
Trust fee paid in 2013, 2012 and 2011 amounted to P=1.15 million, P=0.83 million andP=1.44 million, respectively.
The composition of the fair value of the Fund includes:
· Cash and cash equivalents - include savings and time deposit with various banks and specialdeposit account with Bangko Sentral ng Pilipinas (BSP SDA).
· Investment in stocks- includes investment in common and preferred shares both traded andnot traded in the Philippine Stock Exchange (PSE).
· Investment in government securities - include investment in Philippine Retail TreasuryBonds (RTBs) and Fixed Rate Treasury Notes (FXTNs).
· Investments in other securities and debt instruments - include investment in long-term debtnotes and retail bonds.
· Other receivables - includes interest and dividends receivable generated from investmentsincluded in the plan.
· Accrued trust fees and other payables - pertain mainly to charges of trust or in themanagement of the plan.
In 2013 and 2012, the Group’s investments in stocks include equity securities of related parties asfollows:
December 312013 2012 Total
Equity securities:Fair value P=27,268 P=357,622 P=1,521,791Unrealized gains or losses on
equity securities 14,125 28,518 384,200
The fund holds investments in shares of stock of the Parent Company with fair market value ofP=1,468.67 million, P=1,083.22 million and P=1,414.97 million in 2013, 2012 and 2011, respectively.
The overall administration and management of the plan rest upon the Plan’s BOT. The votingrights on the above securities rest to the BOT for funds directly held through the Group’s officersand indirectly for those entered into through other trust agreements with the trustee bankauthorized to administer the investment and reinvestments of the funds.
The cost of defined benefit pension plans and the present value of the pension obligation aredetermined using actuarial valuations. The actuarial valuation involves making variousassumptions. The principal assumptions used in determining pension and post-employmentmedical benefit obligations for the defined benefit plans are shown below:
2013 2012 2011Discount rate 4.26% to 6.15% 4.69% to 6.15% 6.08% to 6.75%Salary increase rate 3.00% to 10.00% 3.00% to 10.00% 3.00% to 10.00%
- 94 -
*SGVFS007333*
There are no unusual or significant risks to which the Plan exposes the Group. However, in theevent a benefit claim arises under the Retirement Plan and the Retirement Fund is not sufficient topay the benefit, the unfunded portion of the claim shall immediately be due and payable from theGroup to the Retirement Fund.
There was no plan amendment, curtailment, or settlement recognized in the years endedDecember 31, 2013 and 2012.
Sensitivity analysis on the actuarial assumptionsEach sensitivity analysis on the significant actuarial assumptions was prepared by remeasuring theDBO at the reporting date after first adjusting one of the current assumptions according to theapplicable sensitivity increment or decrement (based on changes in the relevant assumption thatwere reasonably possible at the valuation date) while all other assumptions remained unchanged.The sensitivities were expressed as the corresponding change in the DBO.
It should be noted that the changes assumed to be reasonably possible at the valuation date areopen to subjectivity, and do not consider more complex scenarios in which changes other thanthose assumed may be deemed to be more reasonable.
It should be noted that the changes assumed to be reasonably possible at the valuation date areopen to subjectivity, and do not consider more complex scenarios in which changes other thanthose assumed may be deemed to be more reasonable.
Asset-liability matching strategiesEach year, an Asset-Liability Matching Strategy (ALM) is performed with the result beinganalyzed in terms of risk-and-return profiles. It is the policy of the Trustee that immediate andnear-term retirement liabilities of the Group’s Retirement Fund are adequately covered by itsassets. As such, due considerations are given that portfolio maturities are matched in accordancewith due benefit payments. The retirement fund’s expected benefit payments are determinedthrough the latest actuarial reports. The allocation of the Group’s plan assets consists of 68.73%equity instruments, 21.98% debt instruments in government bonds, 3.04% in cash and cashequivalents and 6.24% to others such as receivables generated from interest and dividends.
Funding arrangementsThe Group is not required to pre-fund the future defined benefits payable under the RetirementPlan before they become due. For this reason, the amount and timing of contributions to theRetirement Fund are at the Group’s discretion. However, in the event a benefit claim arises andthe Retirement Fund is insufficient to pay the claim, the shortfall will then be due and payablefrom the Group to the Retirement Fund.
- 95 -
*SGVFS007333*
Shown below is the maturity analysis of the undiscounted benefit payments:
December 31, 2013Less than 1 year P=283,447More than 1 year to 5 years 105,575More than 5 years to 10 years 327,985More than 10 years to 15 years 6,161More than 15 years to 20 years 9,901
P=733,069
24. Costs of Sales and Services
Details of cost of sales and services follow:
2013 2012 2011Cost of SalesCost of real estate inventory P=6,567,151 P=4,434,929 P=4,080,030Materials and supplies 3,157,875 4,172,074 1,821,355Fuel and lubricants 2,453,660 3,043,332 4,242,030Depreciation and amortization
(Notes 12, 13 and 14) 1,114,655 1,448,149 1,797,211Outside services (Note 21) 740,963 967,163 1,410,563Hauling, shiploading and
Property, plant and equipment (Note 13) P=4,566,006 P=3,743,700 P=3,496,747
Other noncurrent assets (Note 14) 36,726 28,123 18,009
Investment properties (Note 12) 6,826 4,908 6,313
P=4,609,558 P=3,776,731 P=3,521,069
Depreciation, depletion and amortization capitalized in ending inventories amounted toP=423.50 million, P=446.89 million and P=427.23 million in 2013, 2012 and 2011, respectively.
Salaries, wages and employee benefits included in the consolidated statements of comprehensiveincome follow:
2013 2012 2011Presented under:
Costs of construction contracts P=1,256,569 P=1,129,094 P=1,136,608
Finance income is derived from the following sources:
2013 2012 2011Interest on:
Real estate installmentreceivables P=321,457 P=475,792 P=666,258Short-term placements (Notes 4 and 10) 205,840 277,342 328,309Bank savings account
(Note 4) 119,307 77,677 88,597Invesment from sinking fund (Note 14) 12,173 17,210 7,210Accretion on unamortized
discount on real estatereceivables (Note 7) – 1,444 7,160
Accretion on unamortizeddiscount on securitydeposits (Note 10) – – 169
P=658,777 P=849,465 P=1,097,703
- 98 -
*SGVFS007333*
27. Finance Costs
The finance costs are incurred from the following:
2013 2012 2011Long-term borrowings P=770,573 P=1,075,984 P=1,103,810Bank loans and short-term
borrowings 126,962 50,799 87,091Accretion on unamortized
discount on liabilities onpurchased land and provisionfor decommissioning and siterehabilitation(Notes 16 and 20) 10,041 32,997 40,381
Amortization of debt issuancecost (Note 19) 21,752 38,748 30,603
P=929,328 P=1,198,528 P=1,261,885
28. Other Income - Net
This account consists of:
2013 2012 2011Forfeitures and cancellation of real estate
contracts P=419,379 P=157,579 P=160,145Sales of Fly Ash 203,180 130,236 6,871Despatch income 170,349 – –Gain on sale of property, plant and
equipment - net (Note 13) 144,855 127,497 57,565Reversal of allowance for doubtful
accounts (Note 7) 138,310 9,552 7,892Rental income (Note 12) 84,453 274,170 53,807Gain on reversal of impairment
(Notes 6 and 14) 61,549 – 6,670Gain on bargain purchase (Note 33) 31,041 – –Guarantee fee income 19,150 – –Management fee (Note 21) 10,890 3,131 55,308Recoveries from insurance claims 10,632 41,546 35,180Dividend income (Note 5) 4,291 5,679 4,547Pension income (Note 23) 430 54,481 37,707Loss on writedown of property, plant and
equipment (Note 13) (443,349) (341,146) –Foreign exchange gain (loss) - net (356,121) 332,447 (46,567)Others 18,927 (8,789) 53,748
P=517,966 P=786,383 P=432,873
Despatch incomeDespatch income pertains to shiploading services rendered by the DMC to its customers.Despatch income is earned upon completion of loading of nickel ore to the vessel. Income earnedfrom shiploading services are based on the difference between the allowed and actual laytime of
- 99 -
*SGVFS007333*
nickel ore to the respective vessels nominated by its customers multiplied by the prevailing dailyinternational market rates. These rates are provided by the ship owners prior to the loading ofnickel ore and determined when the vessel is nominated and accepted. The rates to be used shallbe included in the customer’s vessel nomination and shall be confirmed by the DMC through itsmarketing agent.
Loss on writedown of property, plant and equipmentThe Group incurred a loss from property, plant and equipment writedown due to the replacementof generation units and retirement of mining equipment amounting to P=443.35 million andP=341.15 million in 2013 and 2012, respectively (Note 13).
OthersOthers include income arising from penalty charges for delayed payments of contracts receivable-housing, holding fees, fee for change of ownership, transfer fees, restructuring fees, leasefacilitation fees, income derived from selling excess electricity produced by SMC to neighboringcommunities and others.
29. Income Tax
The provision for income tax shown in the consolidated statements of comprehensive incomeconsists of:
Unamortized discount on payable to landowners 2,710 6,239Unamortized discount on receivables − 414
42,111 35,722Deferred tax liabilities on:
Excess of book over tax income pertaining toconstruction contracts and real estate sales (922,333) (727,933)
Capitalized interest on real estate for sale anddevelopment deducted in advance (220,815) (137,384)
Unamortized transaction cost on loans payable (32,770) (25,551)Pension liabilities (12,292) (7,246)Unrealized marked to market gain (945) (378)Others - net unrealized gain (2,340) –
(1,191,495) (898,492)(P=1,149,384) (P=862,770)
The Group has the following deductible temporary differences, NOLCO and MCIT that areavailable for offset against future taxable income or tax payable for which deferred tax assets havenot been recognized:
20132012
(As restated)Allowance for doubtful accounts P=467,431 P=121,698NOLCO 74,024 10,863Pension liabilities 23,780 92,606Allowance for impairment losses 1,970 145,793MCIT 1,139 525Unrealized forex losses 177 51,468Unrealized forex gains (991) –Provision for decommissioning and site
rehabilitation – 51,738Organizational costs – 20
P=567,530 P=474,711
The deferred income tax effects of the above deductible temporary differences for which nodeferred tax assets are recognized amounted to P=171.06 million and P=142.78 million as ofDecember 31, 2013 and December 31, 2012, respectively. Deferred tax assets are recognized onlyto the extent that taxable income will be available against which the deferred tax assets can beused.
- 101 -
*SGVFS007333*
The reconciliation of the statutory income tax rate to the effective income tax rate follows:
20132012
(As restated)2011
(As restated)Statutory income tax rate 30.00% 30.00% 30.00%Adjustments for:
Tax-exempt income (11.27) (11.21) (12.60)Gain on sale of investment
subjected to final tax at alower rate - net (8.00) − −
Nontaxable equity in netearnings of associates andjointly controlled entities (7.40) (16.59) (16.08)
Nondeductible expenses 5.08 8.65 8.77Interest income subjected to
final tax at a lower rate - net (0.17) (0.21) (0.34)Nondeductible interest expense 0.04 0.11 0.12Changes in unrecognized
Board of Investments (BOI) IncentivesPDI - New Developer of Mass Housing ProjectOn various dates in 2013 and 2012, several projects of the Company are registered on a non-pioneer status by the BOI as these projects fall under the infrastructure (Mass Housing Projects)listing of the Investment Priorities Plan.
Under the terms of its registrations with BOI, the Company is entitled, among others, to thefollowing incentives:a. Income tax holiday (ITH) for a period of three (3) to four (4) years;b. Employment of foreign officials may be allowed in supervisory, technical or advisory
positions for five (5) years from date of registration; andc. Importation of consigned equipment for a period of ten (10) years from date of registration,
subject to the posting of re-export bond.
SMC - Expanding Producer of CoalOn September 26, 2008, BOI issued in favor of SMC a Certificate of Registration as an ExpandingProducer of Coal in accordance with the provisions of the Omnibus Investments Code of 1987.Pursuant thereto, SMC shall be entitled to the following incentives, among others:
a. ITH for six (6) years from September 2008 or actual start of commercial operations,whichever is earlier, but in no case earlier than the date of registration. For purposes ofavailment of ITH, a base figure of 2,710,091 metric tons (MT) representing SMC’s averagesales volume for the past three (3) years prior to the expansion shall be used.
SMC shall initially be granted a four (4) year - ITH. The additional two (2) year ITH shall begranted upon submission of completed or on-going projects in compliance with its CorporateSocial Responsibility (CSR), which shall be submitted before the lapse of its initial four (4)year - ITH. SMC’s ITH of 6 years is expected to lapse in September 2014. SMC has apending application with BOI for another extension, the period of which is still to bedetermined.
- 102 -
*SGVFS007333*
b. Employment of foreign nationals. This may be allowed in supervisory, technical or advisorypositions for five (5) years from the date of registration. The president, general manager andtreasurer of foreign-owned registered companies or their equivalent shall not be subject to theforegoing limitations.
Date of filing: Application shall be filed with the BOI Incentives Department beforeassumption to duty of newly hired foreign nationals and at least one (1) month beforeexpiration of existing employment for renewal of visa.
c. Simplification of Customs procedures for the importation of equipment, spare parts, rawmaterials and supplies.
On August 19, 2009, BOI granted SMC’s request for a reduced base figure from 2,710,091 MT to1,900,000 MT representing the average sales volume for the past eight (8) years (2000 to 2007)prior to registration with BOI.
SMC availed of tax incentive in the form of ITH on its income under registered activitiesamounting to P=1.48 billion, P=1.47 billion and P=1.35 billion in 2013, 2012 and 2011, respectively.
SCPC - New Operator of the 600-MW Calaca Coal-Fired Power PlantOn April 19, 2010, SCPC was registered with the BOI as New Operator of the 600-MW CalacaCoal-Fired Power Plant on a Non-Pioneer Status in accordance with the provisions of theOmnibus Investments Code of 1987. Pursuant thereto, SCPC shall be entitled to the followingincentives, among others:
a. SCPC shall enjoy income tax holiday for four (4) years from April 2011 or actual start ofcommercial operations, whichever is earlier, but in no case earlier than the date of registration.Other incentive s with no specific number of years of entitlement maybe enjoyed for amaximum period of ten (10) years from the start of commercial operation and/or date ofregistration. The ITH incentives shall be limited to the revenue generated from the sales ofelectricity of the 600 MW Batangas Coal-Fired Power Plant.
b. For the first five (5) years from the date of registration, SCPC shall be allowed an additionaldeduction from taxable income of 50% of the wages corresponding to the increment in thenumber of direct labor for skilled and unskilled workers in the year of availment as against theprevious year if the project meets the prescribed ratio of capital equipment to the number ofworkers set by the BOI of $10,000 to one worker and provided that this incentive shall not beavailed of simultaneously with the ITH.
c. Employment of foreign nationals. This may be allowed in supervisory, technical or advisorypositions for five (5) years from the date of registration. The president, general manager andtreasurer of foreign-owned registered companies or their equivalent shall not be subject to theforegoing limitations.
d. Importation of consigned equipment for a period of ten (10) years from the date ofregistration, subject to the posting of re-export bond.
On January 7, 2011, BOI approved SCPC’s request for an earlier application of the ITH to beeffective January 1, 2010.
On December 17, 2013, BOI approved SCPC’s request for the extension for one (1) year of theITH for the period January 1 to December 31, 2014.
- 103 -
*SGVFS007333*
SCPC availed of tax incentive in the form of ITH on its income under registered activitiesamounting to P=5.02 billion and P=2.53 billion in 2013 and 2012, respectively.
SLPGC - New Operator of 300-MW Batangas Coal Fired Power PlantOn June 21, 2012, the application for registration of SLPGC as new operator of 300 MW (Phase1) Batangas Coal Fired Power Plant on a Non-Pioneer Status under the Omnibus InvestmentsCode of 1987 (Executive Order No. 226) was approved. Pursuant thereto, SLPGC shall beentitled to the following incentives, among others:
a. ITH for four (4) years from January 2015 or actual start of commercial operations, whicheveris earlier but in no case earlier than the date of registration;
b. For the first five (5) years from date of registration, the enterprise shall be allowed anadditional deduction from taxable income of fifty percent (50%) of the wages correspondingto the increment in number of direct labor for skilled and unskilled workers in the year ofavailments as against the previous year if the project meets the prescribed ratio of capitalequipment to the number of workers set by the Board and provided that this incentive shall notbe availed of simultaneously with the ITH;
c. Importation of consigned equipment for a period of ten (10) years from date of registration,subject to posting of re-export bond;
d. Employment of foreign nationals. This may be allowed in supervisory, technical or advisorypositions for five (5) years from date of registration; and
e. Simplification of customs procedures for the importation of equipment, spare parts, rawmaterials and supplies.
DMCI Masbate - New Operator of a 24.4 MW Diesel Power Plant in Mobo, MasbateOn September 23, 2010, the BOI approved the registration of DMCI Masbate as New Operator ofa 24.4 MW Diesel Power Plant in Mobo, Masbate on a Pioneer status under the OmnibusInvestment Code of 1987. As a registered entity, DMCI Masbate is entitled to certain fiscal andnon-fiscal incentives which include, among others, an income tax holiday (ITH) on the registeredoperations of the entity. Other incentives with no specific number of years of entitlement may beenjoyed for a maximum of ten (10) years from the start of commercial operation/date ofregistration.
DMCI Masbate availed of tax incentive in the form of ITH on its income under registeredactivities amounting to P=65.46 million and P=36.10 million in 2013 and 2012, respectively.
- 104 -
*SGVFS007333*
30. Earnings Per Share
The following table presents information necessary to calculate basic earnings per share on netincome attributable to equity holders of the Parent Company (in thousands except basic earningsper share):
Basic/diluted earnings per share
20132012
(As restated)2011
(As restated)Net income attributable to equity holders
of Parent Company P=18,937,380 P=9,735,834 P=9,562,954Divided by weighted average number
of common shares 2,655,494 2,655,494 2,655,494Basic earnings per share P=7.13 P=3.67 P=3.60
There were no dilutive potential ordinary shares. Accordingly, no diluted earnings per share ispresented in 2013, 2012 and 2011.
31. Coal Operating Contract with DOE
On July 11, 1977, the Government, through its former Energy Development Board, awarded a35-year COC to a consortium led by Vulcan Industrial & Mineral Exploration Corporation andSulu Sea Oil Development Corporation that subsequently assigned said COC to SMC on April 7,1980. On July 27, 1977, Presidential Decree (PD) 972 was amended by PD 1174: (a) increasingcoal operators’ maximum cost recovery from an amount not exceeding 70% to 90% of the grossproceeds from production, and (b) increasing the amount of a special allowance for Philippinecorporations from an amount not exceeding 20% to 30% of the balance of the gross income, afterdeducting all operating expenses. As a result, SMC's COC was subsequently amended onJanuary 16, 1981 reflecting said changes.
On June 8, 1983, the Ministry of Energy (now DOE), issued a new COC to SMC, incorporatingthe foregoing assignment and amendments. The COC gives SMC the exclusive right to conductexploration, development and coal mining operations on Semirara Island until July 13, 2012. OnMay 13, 2008, the DOE granted SMC’s request for an extension of its COC for another 15-year oruntil July 14, 2027.
On November 12, 2009, the COC was amended further, expanding its contract area to includeportions of Caluya and Sibay islands, Antique, covering an additional area of 5,500 hectares and300 hectares, respectively.
On April 29, 2013, the DOE issued a new COC to SMC, which grants it the exclusive right toconduct exploration, development and coal mining operations in the municipality of Bulalacao,province of Oriental Mindoro, up to a maximum of 36 years from its effective date. The COCcovers two coal-bearing parcels of land covering areas of 2,000 and 5,000 hectares, respectively.
On June 7, 2013, the DOE issued a new COC to SMC, which grants it the exclusive right toconduct exploration, development and coal mining operations in the municipalities of Maitum andKiamba, province of Sarangani, up to a maximum of 36 years from its effective date. The COCcovers a coal-bearing parcel of land covering area of 5,000 hectares.
- 105 -
*SGVFS007333*
In return for the mining rights granted to SMC, the Government is entitled to receive annualroyalty payments consisting of the balance of the gross income after deducting operating expenses,operator’s fee and special allowance. SMC’s provision for DOE’s share under this contract and tothe different LGU in the province of Antique, under the provisions of the Local Government Codeof 1991, amounted to P=1.30 billion, P=1.56 billion and P=1.50 billion in 2013, 2012 and 2011,respectively, included under “Operating expenses” in the consolidated statements of income (seeNote 25). The liabilities, amounting to P=0.88 billion and P=1.01 billion as of December 31, 2013and 2012 are included under the “Accounts and other payables” account in the consolidatedstatements of financial position (see Note 17).
The DOE, through the Energy Resources Development Bureau, approved the exclusion of coalproduced and used solely by SMC to feed its power plant in determining the amount due to DOE.
32. Material Partly-Owned Subsidiary
The financial information of the Group’s subsidiary with material non-controlling interest (NCI) isprovided below. This information is based on amounts before intercompany eliminations.
Statement of comprehensive incomeRevenue P=27,331,160 P=24,150,248Cost of sales 14,110,496 14,643,941Gross profit 13,220,664 9,506,307Operating expenses (5,264,518) (3,398,375)Other income (expenses) (554,393) 290,312Income before income tax 7,401,753 6,398,244Provision for (benefit from) income tax (117,838) 39,604Net income 7,519,591 6,358,640Other comprehensive income 12,589 (16,393)Total comprehensive income P=7,532,180 P=6,342,247
Cash flow informationOperating P=12,654,664 P=6,934,202Investing (8,877,860) (6,235,677)Financing 498,470 (5,106,300)Effect of exchange rate changes on cash and cash
equivalents 9,643 (63,074)Net increase (decrease) in cash and cash
equivalents P=4,284,917 (P=4,470,849)
- 106 -
*SGVFS007333*
The accumulated balances of material noncontrolling interest as at December 31, 2013 and 2012amounted to P=7,363.54 million and P=8,790.17 million, respectively. Dividends paid tononcontrolling interests amounted to P=1,867.32 million and P=1,867.23 million, respectively.
33. Business Combination
On October 23, 2012, DMCI Mining Corporation (DMC), a wholly owned subsidiary of theGroup, purchased from Daintree Resources Limited 8,480,250 common shares or 17.01%ownership in TMC for GBP 3.4 million or P=226.90 million. TMC is an investment holdingcompany incorporated in England and Wales on May 29, 2007 and is engaged in ore and mineralmining and exploration. TMC has strategic interests in privately owned nickel companies in thePhilippines, Berong Nickel Corporation, Ipilan Nickel Corporation and Ulugan NickelCorporation.
In 2013, DMC increased its interest in TMC by acquiring additional shares through a mandatorycash offer to TMC’s shareholders. As of December 31, 2013, DMC holds 49,148,335 shares andvoting rights representing 98.06% of voting rights. The acquisition of majority interest in TMCstrengthens the Group’s strategic objective to be a nickel mining corporation.
On December 20, 2013, DMC acquired majority seats in the Board of TMC.
As at December 31, 2013, the Group assessed that its investment in TMC be accounted for asinvestment in subsidiary in accordance with the guidance set out by PFRS 10. The assets,liabilities and equity of TMC have been consolidated in the financial statements of the Group onDecember 20, 2013, the date when control is obtained.
In its 2013 financial statements, the initial accounting for business combination was not yetcompleted because the valuation of TMC’s mining rights was not yet finalized.
The following table summarizes the amounts of the provisional assets acquired and liabilitiesassumed recognized at the acquisition date (in thousand British Pounds):
Fair valuerecognized on
acquisition dateAssetsCash and cash equivalents £391Trade and other receivables 67Other current assets 25Furniture and equipment 6Noncurrent receivables 13,711Investment in associates 10,676Other noncurrent assets 41
24,917LiabilitiesTrade and other payables 561Accrued expenses 241
802Fair value of net assets acquired £24,115
- 107 -
*SGVFS007333*
The Group assessed that the carrying values of the assets acquired and liabilities assumedapproximates fair values for the purpose of provisional accounting.
Excess of provisional fair values of net identifiable assets over the consideration paid on thebusiness combination of TMC follows in thousands:
Fair value of net assets acquired £24,115Less amount of consideration paid for the acquisition 23,688Excess of fair value of identifiable net assets over the consideration, in London Pound £427Excess of fair value of identifiable net assets over the consideration, as converted to Philippine Peso ₱31,041
Excess of fair value of net identifiable assets over the consideration paid is recorded under “Otherincome” account in the consolidated statements of income.
TMC has no contributed profits or loss from the date of acquisition to December 31, 2013. If theacquisition had taken place at the beginning of the year, net income before tax would havedecreased by P=263.61 million because of the losses incurred by TMC.
34. Cumulative Translation Adjustment
Cumulative translation adjustment represents exchange differences arising from the translation offinancial statements of the foreign subsidiary, TMC, whose functional currency is the BritishPounds.
35. Operating Segments
Business Segment InformationFor management purposes, the Group is organized into six (6) major business units that are largelyorganized and managed separately according to industry.
Construction - engaged in various construction component businesses such as production andtrading of concrete products, handling steel fabrication and electrical and foundation works.
Coal mining - engaged in the exploration, mining and development of coal resources on SemiraraIsland in Caluya, Antique.
Nickel mining - engaged primarily in mining and selling nickel ore from existing stockpile inBenguet and Acoje mines in Zambales.
Real estate - focused in mid-income residential development carried under the brand nameDMCI Homes.
Power - engaged in the business of a generation company which designs, constructs, invest in, andoperate power plants.
- 108 -
*SGVFS007333*
Water - includes share in net earnings from associates, DMWC and Subic Water, which areengaged in water services for the west portion of Metro Manila and Olongapo City and Subic BayFreeport, respectively.
No operating segments have been aggregated to form the above reportable operating segments.Management monitors the operating results of its business units separately for the purpose ofmaking decisions about resource allocation and performance assessment. Segment performance isevaluated based on revenue, earnings before interest, income taxes and depreciation andamortization (EBITDA) and operating profit or loss, and is measured consistently in theconsolidated financial statements.
The Group has no significant customer which contributes 10.00% or more to the revenues of theGroup.
Group financing (including finance costs and finance income) and income taxes are also managedper operating segments. Transfer prices between operating segments are on an arm’s length basisin a manner similar to transactions with third parties.
Business SegmentsThe following tables present revenue, net income (loss) and depreciation, depletion andamortization information regarding business segments for the years ended December 31, 2013,2012 and 2011 and property, plant and equipment additions, total assets and total liabilities for thebusiness segments as of December 31, 2013, 2012 and 2011:
- 109 -
*SGVFS007333*
Year ended December 31, 2013 (Amounts in Thousands)
P=6,694,894 P=9,412,289 P=588,871 P=14,369,438 P=11,803,770 P=– P=691,394 P=43,560,656Other disclosuresAcquisition of land for future development P=– P=– P=– P=1,438,978 P=376,605 P=– P=– P=1,815,583Property, plant and equipment additions (Note 13) P=635,117 P=2,065,988 P=188,037 P=300,356 P=347,790 P=– P=2,053 P=3,539,341
*Revenue from construction segment includes sales revenue from WRCP.
- 112 -
*SGVFS007333*
The Group's management reporting and controlling systems use accounting policies that are thesame as those described in Note 2 in the summary of significant accounting policies under PFRS.
The Group measures the performance of its operating segments through a measure of segmentprofit or loss which is referred to as “EBITDA” in the management and reporting system.
EBITDA is the measure of segment profit (loss) used in segment reporting and comprises grossprofit, selling and general administrative expenses, research and non-capitalized developmentcosts, other operating income (expense), net, as well as other financial income (expense), net.
Intersegment revenue is generally recorded at values that approximate third-party selling prices.
Segment assets principally comprise all assets. The industrial business segments' assets excludeincome tax assets, assets from defined benefit plans and certain financial assets.
Segment liabilities principally comprise all liabilities. The industrial business segments' liabilitiesexclude income tax liabilities, liabilities from defined benefit plans and certain financial liabilities.
Geographic InformationAnalysis of sales and revenue by geographical locationThe financial information about the operations of the coal mining as of December 31, 2013, 2012and 2011 reviewed by the management follows:
Customer Location 2013 2012 2011Revenue
Local P=5,287,388 P=7,440,134 P=9,041,168Export 7,286,181 7,010,021 7,189,363
P=12,573,569 P=14,450,155 P=16,230,531
Substantially all revenue from external customers are from open cut mining and sales of thermalcoal. Local and export classification above is based on the geographic location of the customer.Customers on the export sales are significantly from China.
Sales to power company amounted to P=8.47 billion, P=3.18 billion and P=7.01 billion for the yearsended December 31, 2013, 2012 and 2011, respectively. All these revenue were from the Coalmining segment.
36. Financial Risk Management Objectives and Policies
The Group’s principal financial instruments comprise interest-bearing loans and borrowings. Themain purpose of these financial instruments is to raise financing for its operations and capitalexpenditures. The Group has various other financial assets and liabilities, such as receivables andpayables which arise directly from its operations.
- 113 -
*SGVFS007333*
The main risks arising from the use of financial instruments are liquidity risk, market risk andcredit risk. The Group’s BOD reviews and approves policies for managing each of these risks andthey are summarized below.
a. Liquidity RiskLiquidity risk is the risk that an entity will encounter difficulty in meeting obligationsassociated with financial liabilities. The Group seeks to manage its liquidity profile to be ableto service its maturing debts and to finance capital requirements. The Group maintains a levelof cash and cash equivalents deemed sufficient to finance operations.
A significant part of the Group’s financial assets that are held to meet the cash outflowsinclude cash equivalents and accounts receivables. Although accounts receivables arecontractually collectible on a short-term basis, the Group expects continuous cash inflowsthrough continuous production and sale of coal and power generation. In addition, althoughthe Group’s short-term deposits are collectible at a short notice, the deposit base is stable overthe long term as deposit rollovers and new deposits can offset cash outflows.
Moreover, the Group considers the following as mitigating factors for liquidity risk:· It has available lines of credit that it can access to answer anticipated shortfall in sales and
collection of receivables resulting from timing differences in programmed inflows andoutflows.
· It has very diverse funding sources.· It has internal control processes and contingency plans for managing liquidity risk. Cash
flow reports and forecasts are reviewed on a weekly basis in order to quickly addressliquidity concerns. Outstanding trade receivables are closely monitored to avoid past duecollectibles.
· The Group regularly evaluates its projected and actual cash flows. It also continuouslyassesses conditions in the financial markets for opportunities to pursue fund-raisingactivities. Fund-raising activities may include bank loans and capital market issues bothon-shore and off-shore which is included in the Group’s corporate planning for liquiditymanagement.
The following table summarizes the maturity profile of the Group’s financial assets andliabilities as of December 31, 2013 and 2012, based on contractual undiscounted cash flows.The table also analyses the maturity profile of the Group’s financial assets in order to providea complete view of the Group’s contractual commitments (amounts in thousands).
2013
On DemandWithin1 year 1-2 years 2-3 years 3-4 years Total
Loans and ReceivableCash and cash equivalents P=24,774,495 P=− P=− P=− P=− P=24,774,495Receivables Trade: Real estate 6,884,163 849,257 774,769 626,425 1,612,036 10,746,650 General construction 1,068,705 2,438,659 − − − 3,507,364 Mining 2,218,925 − − − − 2,218,925 Electricity sales 3,247,991 − − − − 3,247,991 Merchandising and others 73,054 − − − − 73,054 Receivables from related parties 131,596 − − − − 131,596 Other receivables 181,592 − − − − 181,592Security deposits − 407,519 − − − 407,519
(Forward)
- 114 -
*SGVFS007333*
2013
On DemandWithin1 year 1-2 years 2-3 years 3-4 years Total
b. Market RiskMarket risk is the risk of loss to future earnings, to fair values or to future cash flows that mayresult from changes in the price of a financial instrument. The value of a financial instrumentmay change as a result of changes in equity prices, market prices, interest rates and foreigncurrency exchange rates.
- 115 -
*SGVFS007333*
The sensitivity analyses have been prepared on the following bases:· Equity price risk - movements in equity indices· Market price risk - movements in one-year historical coal prices· Interest rate risk - market interest rate on unsecured bank loans· Foreign currency risk - yearly movement in the foreign exchange rates
The assumption used in calculating the sensitivity analyses of the relevant income statementitem is the effect of the assumed changes in respective market risks. This is based on thefinancial assets and financial liabilities held at December 31, 2013 and 2012.
Equity Price RiskThe Group’s equity price risk exposure at year-end relates to financial assets whose valueswill fluctuate as a result of changes in market prices, principally, equity securities classified asAFS financial assets.
Quoted securities are subject to price risk due to changes in market values of instrumentsarising either from factors specific to individual instruments or their issuers or factorsaffecting all instruments traded in the market. The Group’s market risk policy requires it tomanage such risks by setting and monitoring objectives and constraints on investments;diversification plan; and limits on investment in each industry or sector.
The analyses below are performed for reasonably possible movements in the Philippine StockExchange (PSE) index for quoted shares and other sources for golf and club shares with allother variables held constant, showing the impact on equity:
Change in variableEffect on equity
(Other comprehensive income)2013 2012 2013 2012
PSE 0.49% 32.20% 4,469,443 4,636,228-0.49% -32.20% (4,469,443) (4,636,228)
The sensitivity analyses shown above are based on the assumption that the movement in PSEcomposite index and other quoted equity securities will be most likely be limited to an upwardor downward fluctuation of 0.49% and 23.82% in 2013, and 32.20% and 158.31% in 2012.
The Group, used as basis of these assumptions, the annual percentage change in PSEcomposite index and annual percentage change of quoted prices as obtained from publishedquotes of golf and club shares.
The impact of sensitivity of equity prices on the Group’s equity already excludes the impacton transactions affecting the Company’s consolidated statements of income.
Commodity Price RiskPrice risk is the risk that the fair value or future cash flows of a financial instrument willfluctuate because of changes in market prices (other than those arising from interest rate riskor currency risk), whether those changes are caused by factors specific to the individualfinancial instrument or its issuer, or factors affecting all similar financial instruments traded inthe market.
- 116 -
*SGVFS007333*
The price that the Group can charge for its coal is directly and indirectly related to the price ofcoal in the world coal market. In addition, as the Group is not subject to domestic competitionin the Philippines, the pricing of all of its coal sales is linked to the price of imported coal.World thermal coal prices are affected by numerous factors outside the Group’s control,including the demand from customers which is influenced by their overall performance anddemand for electricity. Prices are also affected by changes in the world supply of coal andmay be affected by the price of alternative fuel supplies, availability of shipping vessels aswell as shipping costs. As the coal price is reset on a periodic basis under coal supplyagreements, this may increase its exposure to short-term coal price volatility.
There can be no assurance that world coal prices will be sustained or that domestic andinternational competitors will not seek to replace the Group in its relationship with its keycustomers by offering higher quality, better prices or larger guaranteed supply volumes, any ofwhich would have a materially adverse effect on the Group’s profits.
To mitigate this risk, the Group continues to improve the quality of its coal and diversify itsmarket from power industry, cement industry, other local industries and export market. Thiswill allow flexibility in the distribution of coal to its target customers in such manner thatminimum target average price of its coal sales across all its customers will still be achieved(i.e. domestic compared to local). Also, in order to mitigate any negative impact resultingfrom price changes, it is the Group’s policy to set minimum contracted volume for customerswith long term supply contracts for each given period (within the duration of the contract) andpricing is negotiated on a monthly basis to even out the impact of any fluctuation in coalprices, thus, protecting its target margin.
The excess volumes are allocated to spot sales which may command different price than thosecontracted already since the latter shall follow pricing formula per contract. Nevertheless, oncertain cases temporary adjustments on coal prices with reference to customers following acertain pricing formula are requested in order to recover at least the cost of coal if the resultingprice is abnormally low vis-à-vis cost of production (i.e. abnormal rise in cost of fuel, foreignexchange).
Below are the details of the Group’s coal sales to the domestic market and to the exportmarket (as a percentage of total coal sales volume):
The following table shows the effect on income before income tax should the change in theprices of coal occur based on the inventory of the Group as of December 31, 2013 and 2012with all other variables held constant. The change in coal prices used in the simulationassumes fluctuation from the lowest and highest price based on 1-year historical pricemovements in 2013 and 2012.
Effect on income before income taxChange in coal price 2013 2012Based on ending coal inventoryIncrease by 42% in 2013 and 30% in 2012 P=1,022,494 P=1,053,009Decrease by 42% in 2013 and 30% in 2012 (1,022,494) (1,053,009)
(Forward)
- 117 -
*SGVFS007333*
Effect on income before income taxChange in coal price 2013 2012Based on coal sales volumeIncrease by 42% in 2013 and 30% in 2012 P=5,643,685 P=4,335,047Decrease by 42% in 2013 and 30% in 2012 (5,643,685) (4,335,047)
Interest Rate RiskInterest rate risk is the risk that the fair value or future cash flows of a financial instrumentwill fluctuate because of changes in market interest rates. The Group’s exposure to marketrisk for changes in interest rates relates primarily to the Group’s long-term debt obligations.The Group’s policy is to manage its interest cost using a mix of fixed and variable rate debt.
The following table demonstrates the sensitivity of the Group’s profit before tax and equity toa reasonably possible change in interest rates, with all variables held constant, through theimpact on floating rate borrowings.
2013
Change inbasis points
Effect on incomebefore
income tax Effect on equityDollar floating rate borrowings +100 bps (2,126,831) (1,488,782)
The sensitivity analyses shown above are based on the assumption that the interest movementswill be more likely be limited to hundred basis points upward or downward fluctuation in both2013 and 2012. The forecasted movements in percentages of interest rates used were derivedbased on the Group’s historical changes in the market interest rates on unsecured bank loans.
Foreign Currency RiskForeign currency risk is the risk that the future cash flows of a financial instrument willfluctuate because of changes in foreign exchange rates. The Group’s currency risks arisemainly from cash and cash equivalents, receivables, accounts and other payable, short-termloans and long-term loans of the Group which are denominated in a currency other than theGroup’s functional currency. The effect on the Group’s consolidated statements of income iscomputed based on the carrying value of the floating rate receivables as at December 31, 2013and 2012.
- 118 -
*SGVFS007333*
The Group does not have any foreign currency hedging arrangements.
The following tables demonstrates the sensitivity to a reasonably possible change in foreignexchange rates, with all variables held constant, of the Company’s profit before tax (due tochanges in the fair value of monetary assets and liabilities).
1 The exchange rates used were P=44.40 to $1 and P=41.05 to $1 for the year ended December 31, 2013 and 2012, respectively.2 The exchange rates used were P=0.42 to ¥1 and P=0.48 to ¥1 for the year ended December 31, 2013 and 2012, respectively.3 The exchange rates used were P=72.90 to £1 and P=66.32 to £1 for the year ended December 31, 2013 and 2012, respectively.4 The exchange rates used were P=60.82 to €1 and P=54.53 to €1 for the year ended December 31, 2013 and 2012, respectively.5 The exchange rates used were P=35.00 to 1 SG $ for the year ended December 31, 2013.
Information on the Group’s foreign currency-denominated monetary assets and liabilities andtheir Philippine peso equivalents as of December 31, 2013 and 2012 follows:
2013
. U.S. Dollar Japanese Yen UK Pounds E.M.U Euro SG DollarEquivalent in
c. Credit RiskCredit risk is the risk that one party to a financial instrument will cause a financial loss for theother party by failing to discharge an obligation. The Group’s maximum exposure to creditrisk for the components of the statement of financial position at December 31, 2013 and 2012is the carrying amounts except for real estate receivables. The Group’s exposure to credit riskarises from default of the counterparties which include certain financial institutions, real estatebuyers, subcontractors, suppliers and various electric companies. Credit risk managementinvolves dealing only with recognized, creditworthy third parties. It is the Group’s policy thatall counterparties who wish to trade on credit terms are subject to credit verificationprocedures. The Treasury Department’s policy sets a credit limit for each counterparty. Inaddition, receivable balances are monitored on an ongoing basis. The Group’s financial assetsare not subject to collateral and other credit enhancement except for real estate receivables andmining receivables from export sales. As of December 31, 2013 and 2012, the Group’sexposure to bad debts is not significant.
Real estate contractsCredit risk is managed primarily through credit reviews and an analysis of receivables on acontinuous basis. The Group also undertakes supplemental credit review procedures forcertain installment payment structures. The Group’s stringent customer requirements andpolicies in place contributes to lower customer default. Customer payments are facilitatedthrough various collection modes including the use of postdated checks. The credit risk forreal estate receivable is also mitigated as the Group has the right to cancel the sales contractand takes possession of the subject house without need for any court action in case of defaultin payments by the buyer. This risk is further mitigated because the corresponding title to thesubdivision units sold under this arrangement is transferred to the buyers only upon fullpayment of the contract price. The fair value of collateral for installment contracts receivablesamounted to P=12,643.92 million and P=7,970.00 million in 2013 and 2012, respectively. Thisresulted to a net exposure of P=82.23 million and P=93.00 million in 2013 and 2012,respectively.
Electricity salesThe Group earns substantially all of its revenue from bilateral contracts and WESM and fromvarious electric companies. WESM and the various electric companies are committed to payfor the energy generated by the power plant facilities.
Under the current regulatory regime, the generation rate charged by the Group to WESM isnot regulated but is determined in accordance with the WESM Price DeterminationMethodology (PDM) approved by the Energy Regulatory Commission (ERC) and arecomplete pass-through charges to WESM. PDM is intended to provide the specificcomputational formula that will enable the market participants to verify the correctness of thecharges being imposed. Likewise, the generation rate charged by the Group to various electriccompanies is not subject to regulations and are complete pass-through charges to variouselectric companies.
- 120 -
*SGVFS007333*
MiningThe Group evaluates the financial condition of the local customers before deliveries are madeto them. On the other hand, export sales are covered by sight letters of credit issued byforeign banks subject to the Group’s approval, hence, mitigating the risk on collection.
The Group generally offers 80% of coal delivered payable within thirty (30) days upon receiptof billing and the remaining 20% payable within 15 days after receipt of final billing based onfinal analysis of coal delivered.
Construction contractsThe credit risk for construction receivables is mitigated by the fact that the Group can resort tocarry out its contractor’s lien over the project with varying degrees of effectiveness dependingon the jurisprudence applicable on location of the project. A contractor’s lien is the legal rightof the Group to takeover the projects-in-progress and have priority in the settlement ofcontractor’s receivables and claims on the projects-in-progress and have priority in thesettlement of contractor’s receivables and claims on the projects in progress is usually higherthan receivables from and future commitments with the project owners. Trade and retentionreceivables from project owners are normally high standard because of the creditworthiness ofproject owners and collection remedy of contractor’s lien accorded contractor in certain cases.
With respect to the credit risk arising from the other financial assets of the Group, whichcomprise cash and cash equivalents, the Group’s exposure to credit risk arises from default ofthe counterparty, with a maximum exposure equal to the carrying amount of these instruments.The Group transacts only with institutions or banks that have proven track record in financialsoundness.
Given the Group’s diverse base of counterparties, it is not exposed to large concentrations ofcredit risk.
As of December 31, 2013 and 2012, the credit quality per class of financial assets that wereneither past due nor impaired is as follows:
2013
Neither past due nor impairedPast due or
IndividuallyGrade A Grade B Grade C Impaired Total
Cash in bank and cash equivalents P=24,747,312 P=– P=– P=– P=24,747,312Available-for-sale financial assets Quoted 59,200 – – – 59,200 Unquoted 1,729 – – – 1,729Receivables Trade Real estate 7,779,769 1,002,013 767,043 1,197,825 10,746,650 General construction 3,057,886 – – 456,266 3,514,152 Mining 1,863,328 355,597 – 29,743 2,248,668 Electricity sales 3,247,991 – – 506,538 3,754,529 Merchandising 73,054 – – – 73,054 Receivable from related parties 131,596 – – – 131,596 Other receivables 127,019 27,804 – 29,517 184,340
(Forward)
- 121 -
*SGVFS007333*
2013
Neither past due nor impairedPast due or
IndividuallyGrade A Grade B Grade C Impaired Total
Cash and Cash EquivalentsCash and cash equivalents are short-term placements and working cash fund placed, investedor deposited in foreign and local banks belonging to top ten (10) banks in the Philippines interms of resources and profitability. These financial assets are classified as Grade A due to thecounterparties’ low probability of insolvency.
AFS Financial AssetsThe Group’s AFS financial assets are classified as Grade B because these assets aresusceptible to untoward consequences due to the current financial positions of counterparties.
- 122 -
*SGVFS007333*
ReceivablesIncluded under Grade A are accounts considered to be of high value and are covered with coalsupply, power supply, and construction contracts. The counterparties have a very remotelikelihood of default and have consistently exhibited good paying habits. Grade B accountsare active accounts with minimal to regular instances of payment default, due to collectionissues. These accounts are typically not impaired as the counterparties generally respond tocredit actions and update their payments accordingly. The Group determines financial assetsas impaired when probability of recoverability is remote and in consideration of lapse inperiod which the asset is expected to be recovered.
For real estate receivables, advances to officers and employees and other receivables, Grade Aare classified as financial assets with high credit worthiness and probability of default isminimal. While receivables under Grade B and C have favorable and acceptable riskattributes, respectively, with average credit worthiness.
Receivable from related parties are considered Grade A due to the Group’s positive collectionexperience.
Receivables are aged and analyzed on a continuous basis to minimize credit risk associatedwith these receivables. Receivable balances are monitored on an ongoing basis to ensuretimely execution of necessary intervention efforts, such as raising the case to the Group’s legaldepartment. Regular monitoring of receivables resulted to manageable exposure to bad debts.
Security and Refundable DepositsSecurity and refundable deposits are classified as Grade A since these are to be refunded bythe lessor and utility companies at the end of lease term and holding period, respectively, asstipulated in the agreements.
As of December 31, 2013 and 2012, the aging analysis of the Group’s financial assetspresented per class follows:
2013Past due but not impaired Impaired
<30 days 30-60 days 61-90 days 91-120 days >120 days Assets TotalReceivables Trade Real estate P=942,336 P=3,443 P=4,105 P=247,941 P=– P=– P=1,197,825 General
<30 days 30-60 days 61-90 days 91-120 days >120 days Assets TotalReceivables Trade Real estate P=686,682 P=2,509 P=2,991 P=180,675 P=– P=– P=872,857 General
The repossessed lots and residential houses are transferred back to inventory under the accountReal estate for sale and held for development and are held for sale in the ordinary course ofbusiness. The total of these inventories is P=700.77 million and P=204.57 million in 2013 and2012, respectively. The Group performs certain repair activities on the said repossessed assetsin order to put their condition at a marketable state. Costs incurred in bringing the repossessedassets to its marketable state are included in their carrying amounts.
The Group did not accrue any interest income on impaired financial assets.
Fair Value of Financial InstrumentsThe table below presents a comparison by category of carrying amounts and estimated fair valuesof all the Group’s financial instruments as of December 31, 2013 and 2012:
2013 2012Carrying Value Fair Value Carrying Value Fair Value
Loans and ReceivablesCash and cash equivalents Cash on hand and in banks P=8,079,962 P=8,079,962 P=2,875,761 P=2,875,761 Cash equivalents 16,694,533 16,694,533 6,841,281 6,841,281Receivables - net Trade Real estate 10,746,650 13,719,814 7,831,097 10,927,246 General construction 3,507,364 3,507,364 4,072,662 4,072,662 Coal mining 2,218,925 2,218,925 1,453,964 1,453,964 Electricity sales 3,247,991 3,247,991 2,626,199 2,626,199 Merchandising and others 73,054 73,054 67,157 67,157 Receivable from related parties 131,596 131,596 187,296 187,296 Other receivables 181,592 181,592 379,661 379,661Security deposits 407,519 407,519 191,390 191,390Refundable deposits 252,353 252,353 325,859 325,859
Other Financial LiabilitiesAccounts and other payables P=13,688,734 P=13,688,734 P=12,983,610 P=12,983,610Liabilities for purchased land 1,372,477 1,286,856 1,145,324 1,097,633Payable to related parties 33,992 33,992 61,215 61,215Short-term and long-term debt -
including current portion 36,764,139 36,764,139 24,833,115 24,833,115Other noncurrent liabilities 1,693,214 1,693,214 1,527,655 1,527,655
Financial assetsThe fair values of cash and short-term receivables approximate their carrying amounts as ofreporting dates due to the short-term nature of the transactions.
The fair values of installment contracts receivable, loans payable and liabilities for purchased landare based on the discounted value of future cash flows using the applicable rates for similar typesof loans and receivables. The discount rates used for installment contracts receivable range from9.51% to 14.65% in 2013 and 13.29% to 16.5% in 2012.
The fair values of financial assets at FVPL are based on quoted market rates.
- 124 -
*SGVFS007333*
Refundable deposits are carried at cost since these are mostly deposits to a utility company as aconsequence of its subscription to the electricity services of the said utility company needed forthe Group’s residential units.
Security deposits other than those pertaining to operating leases and unquoted AFS financial assets- In the absence of a reliable basis of determining fair values due to the unpredictable nature offuture cash flows and the lack of suitable methods in arriving at a reliable fair value, these securitydeposits are carried at cost less impairment allowance, if any.
Financial liabilitiesThe fair values of accounts and other payables and accrued expenses and payables to relatedparties approximate their carrying amounts as of reporting dates due to the short-term nature of thetransactions.
The discount rates used for loans payable range from 5.25% to 5.75% in 2013 and 5% to 6.5% in2012. Liabilities for purchased land were discounted at 2.48% to 5.28% in 2013 and 3.28% to3.62% in 2012.
The carrying values approximated the fair values because of recent and regular repricing ofinterest rates based on current market conditions. As of December 31, 2013 and 2012, interest rateranges from 1% to 3% and 1.03% to 4%, respectively.
Estimated fair value of long-term fixed rate loans and liabilities for purchased land are based onthe discounted value of future cash flows using the applicable rates for similar types of loans withmaturities consistent with those remaining for the liability being valued. For floating rate loans,the carrying value approximates the fair value because of recent and regular repricing (quarterly)based on market conditions.
Fair Value HierarchyThe Group uses the following hierarchy for determining and disclosing the fair value of financialinstruments by valuation technique:
Level 1: quoted (unadjusted) prices in active markets for identical assets or liabilities
Level 2: other techniques for which all inputs which have a significant effect on the recordedfair value are observable, either directly or indirectly
Level 3: techniques which use inputs which have a significant effect on the recorded fair valuethat are not based on observable market data.
Fair values of real estate receivables, long-term debt, liabilities for purchased land and investmentproperties are based on level 3 inputs while that of available for sale financial assets and financialassets through profit or loss are from level 1 inputs.
Carrying values of financial instruments, except for long-term debt and liabilities for purchasedland, approximate the fair values due to relatively short term nature of the transactions.
Installment contracts receivable, loans payable and liabilities for purchased landThe fair values of installment contracts receivable, loans payable and liabilities for purchased landare based on the discounted value of future cash flows using the applicable rates for similar typesof loans and receivables. The discount rates used for installment contracts receivable range from9.51% to 14.65% in 2013 and 13.29% to 16.5% in 2012.
- 125 -
*SGVFS007333*
The discount rates used for loans payable range from 5.25% to 5.75% in 2013 and 5% to 6.5% in2012. Liabilities for purchased land were discounted at 2.48% to 5.28% in 2013 and 3.28% to3.62% in 2012.
Financial asset at FVPLThe fair values are based on quoted market prices.
Long-term debtThe carrying values approximated the fair values because of recent and regular repricing ofinterest rates based on current market conditions. As of December 31, 2013 and 2012, interest rateranges from 1% to 3% and 1.03% to 4%, respectively.
37. Contingencies and Commitments
ContingenciesProvision for probable legal claimsThe Group is contingently liable for lawsuits or claims filed by third parties which are eitherpending decision by the courts or are under negotiation, the outcomes of which are not presentlydeterminable. In the opinion of management and its legal counsel, the eventual liability underthese lawsuits or claims, if any, will not have a material effect on the consolidated financialstatements. The information usually required by PAS 37, Provisions, Contingent Liabilities andContingent Assets, is not disclosed on the grounds that it can be expected to prejudice the outcomeof these lawsuits, claims and assessments.
Provision for billing disputesOn October 20, 2010, SCPC filed a Petition for dispute resolution (“Petition”) before the EnergyRegulatory Commission (ERC) against NPC and PSALM involving over-nominations made byNPC during the billing periods January to June 2010 beyond the 169,000 kW Manila ElectricCompany (MERALCO) allocation of SCPC, as provided under the Schedule W of the APA.
In its Petition, SCPC sought to recover the cost of energy (a) sourced by SCPC from WESM inorder to meet NPC’s nominations beyond the 169,000 kW MERALCO contracted demand, or (b)procured by NPC from the WESM representing energy nominated by NPC in excess of the169,000 kW limit set in Schedule W, cost of which was charged by PSALM against SCPC. Inrelation to this, NPC withheld the payments of MERALCO and remitted to SCPC the collections,net of the cost of the outsourced energy.
SCPC has likewise sought to recover interest on the withheld MERALCO payments collected byPSALM that is unpaid to SCPC as of due date, to be charged at the rate of 11% computed from thedate of the SCPC’s extrajudicial demand until full payment by PSALM.
During the preliminary conference scheduled on November 25, 2010, the ERC’s hearing officerdirected the parties to explore the possibility of settling the dispute amicably. As the parties failedto arrive at a compromise during the prescribed period, hearings resumed with the conduct ofpreliminary conference on February 23, 2011, without prejudice to the result of any furtherdiscussions between the parties for amicable settlement. The ERC set the next hearing for thepresentation of witnesses on March 22 and 23, 2011.
- 126 -
*SGVFS007333*
In 2010, SCPC made a provision for the total amount withheld by NPC, which amounted toP=383.29 million. Though a provision has already been made, SCPC has not waived its right tocollect the said amount in case the outcome of the dispute resolution would be a favorablesettlement for SCPC. The provision will be reversed and an income would be recognized in the"Other income" account upon collection of the said receivable.
On July 6, 2011, the ERC rendered its Decision in favor of SCPC and directed the parties, amongothers to submit the reconciled computation of the over-nominations and other MERALCOpayments withheld by PSALM during the periods January 2010 to June 2010, and for PSALM toreturn to SCPC the amount computed and reconciled, including the interests thereon a rate of 6%per annum. PSALM filed a Motion for Reconsideration on the Decision which is denied by ERCin an order dated February 13, 2012 due to the lack of merit.
On April 24, 2012, SCPC and PSALM each filed their Compliance submitting the reconciledcomputations of the over-nominations and other MERALCO payments withheld by PSALM, asagreed upon by the parties, in the principal amount of P=476 million.
On December 4, 2013, SCPC filed a Motion for Issuance of Writ of Execution praying for theissuance of a Writ of Execution directing PSALM to remit the Principal Amount, includinginterest of 6% per annum computed from August 4, 2010 until the date of actual payment, as wellas the value added tax collected by PSALM from Meralco, pursuant to the ERC’s Decision datedJuly 6, 2011 and Order dated February 13, 2012.
On December 18, 2013, PSALM field its Comment to SCPC’s Motion for Issuance of Writ ofExecution essentially arguing that the Commission on Audit must first verify and confirm, throughthe proper proceeding, the claim against PSALM before PSALM can remit the Principal Amountpursuant to the ERC’s judgment.
As of December 31, 2013, decision of Supreme Court regarding the case is still pendingresolution.
PSALM’s Petition for Review before the Court of Appeals and Supreme Court of the PhilippinesMeanwhile, PSALM filed a Petition for Review with Prayer for Temporary Restraining Orderand/or Preliminary Injunction with the Court of Appeals on March 30, 2012, questioning theERC’s decision dated July 6, 2011 and Order dated February 13, 2012. On September 4, 2012,the Court of Appeals rendered a Decision, denying PSALM’s petition and affirming the relatedDecision and Order previously issued.
PSALM subsequently filed a Motion for Reconsideration dated September 26, 2012 and seekingthe reconsideration of the Decision dated September 4, 2012. SCPC filed its Opposition toPSALM’s Motion for Reconsideration on November 5, 2012. Subsequently, the Court of Appealsissued a Resolution denying the Motion for Reconsideration filed by PSALM on November 27,2012.
On December 27, 2012, PSALM filed a Petition for Review on Certiorari with Prayer for Issuanceof Temporary Restraining Order and/or Preliminary Injunction with the Supreme Court.
Subsequently the Supreme Court issued a Resolution dated January 21, 2013 requiring SCPC tofile a Comment to PSALM’s Petition. Thus, on March 25, 2013, SCPC filed its Comment.
- 127 -
*SGVFS007333*
PSALM filed a Motion for Extension to file reply on July 25, 2013, requesting for an additionalperiod of ten (10) days from July 25, 2013, or until August 4, 2013, within which to file its Reply.PSALM subsequently filed its Reply on August 2, 2013.
In a Resolution dated September 30, 2013, the Supreme Court granted PSALMs Motion forExtension to File Reply and noted the filing of PSALM’s Reply.
PSALM’s Petition has not yet been resolved as of December 31, 2013.
Equipment Rental AgreementOn various dates in 2009 and 2008, SMC entered into Equipment Rental Agreement (theAgreement) with Banco de Oro Rental, Inc. (the Lessor) for the rental of various equipment for aperiod of twenty (20) months starting on various dates. The Agreement requires for the paymentof a fixed monthly rental. The Agreement also requires SMC to pay security deposit which shallbe held by the lessor as security for the faithful and timely performance by SMC of all itsobligations. Upon termination of the Agreement, the lessor shall return to SMC the securitydeposit after deducting any unpaid rental and/or other amounts due to lessor. The equipment are,at all times, shall be and remain the sole and exclusive equipment of the lessor, and no title shallpass to SMC.
As of December 31, 2013, the Agreement with the Lessor is terminated.
Lease CommitmentsOperating Lease - As LessorThe Group entered into lease agreements with third parties covering its investment propertyportfolio (Note 12). The lease agreements provide for a fixed monthly rental with an escalation of3% to 7% annually and is renewable under the terms and condition agreed with the lessees.
As of December 31, 2013 and 2012, future minimum lease receivables under the aforementionedoperating lease (in thousands) are as follows:
2013 2012Within one year P=19,972 P=9,320After one year but not more than five years 67,154 6,591More than five years 79,986 798
P=167,112 P=16,709
Operating Lease - As LesseeThe Group has a noncancellable lease agreement with a various lessors covering office premises,for seven (7) years with escalation rate ranging from 5.00% to 10.00%. The leases are renewableunder such terms and conditions that are agreed upon by the contracting parties.
As of December 31, 2013 and 2012, future minimum lease payments under the above mentionedoperating lease (in thousands) are as follows:
2013 2012Within one year P=36,107 P=21,304After one year but not more than five years 51,123 65,846
P=87,230 P=87,150
- 128 -
*SGVFS007333*
Also as discussed in Note 13, the Group entered into a Land Lease Agreement with PSALM forthe lease of land in which the plant is situated, for a period of 25 years, renewable for another 25years with the mutual agreement of both parties. In 2009, the Group paid US$3.19 million or itspeso equivalent P=150.57 million as payment for the 25 years of rental.
Provisions of the LLA include that the Group has the option to buy the Option Assets uponissuance of an Option Existence Notice (OEN) by the lessor. Optioned assets are parcels of landthat form part of the leased premises which the lessor offers for the sale to the lease.
The Group was also required to deliver and submit to the lessor a performance security amountingto P=34.83 million in the form of Stand-by Letter of Credits. The Performance Security shall bemaintained by the Group in full force and effect continuously without any interruption until thePerformance Security expiration date. The Performance Security initially must be effective for theperiod of one year from the date of issue, to be replaced prior to expiration every year thereafterand shall at all times remain valid.
In the event that the lessor issues an OEN and SCPC buys the option assets in consideration forthe grant of the option, the land purchase price should be equivalent to the highest of the followingand / or amounts: (i) assessment of the Provincial Assessors of Batangas Province; (ii) theassessment of the Municipal or City Assessor having jurisdiction over the particular portion of theleased premises; (iii) the zonal valuation of Bureau of Internal Revenue or, (iv) 21.00 per squaremeter (dollar). Valuation basis for 1 to 3 shall be based on the receipt of PSALM of the option toexercise notice. The exchange rate to be used should be the Philippine Dealing Exchange rate atthe date of receipt of PSALM of the OEN.
The exchange rate to be used should be the Philippine Dealing Exchange rate at the date of receiptof PSALM of the option to exercise notice.
On July 12, 2010, PSALM issued an OEN and granted SCPC the “Option” to purchase theOptioned Assets that form part of the leased premises. SCPC availed of the “Option” and paid theOption Price amounting US$0.32 million or a peso equivalent of P=14.72 million exercisablewithin one year from the issuance of the OEN.
On April 28, 2011, SCPC sent a letter to PSALM requesting for the assignment of the option topurchase a lot with an area of 82,740 sqm in favor of its Parent Company. On May 5, 2011,PSALM approved the assignment. On June 1, 2011, SCPC exercised the land lease option at apurchase price of P=292.62 million.
On June 1, 2011, SMC and SCPC exercised its option to purchase the Option Asset andsubsequently entered into a Deed of Absolute Sale with PSALM for the total consideration ofP=376.61 million.
On October 12, 2011, SCPC reiterated its proposal to purchase the remainder of the LeasedPremises not identified as Optioned Assets. One of the salient features of the proposal includedthe execution of Contract to Sell (CTS) between SCPC and PSALM.
On February 13, 2012, PSALM held off the approval of the proposal to purchase the portion ofCalaca Leased Premises not identified as Optioned Assets, subject to further studies. On the samedate, PSALM Board has approved SCPC’s request to sub-lease a portion of the Calaca LeasedPremises to SLPGC for the purpose of constructing and operating a power plant.
- 129 -
*SGVFS007333*
On February 24, 2012, SCPC sent a letter to PSALM for its proposal to handle the titling ofCalaca Land.
As of the December 31, 2013, PSALM is pending for any response in connection therewith.
Finance Lease - As LesseeDuring 2011, the Group has entered into finance lease agreements for some of its service vehiclesand equipment used in its construction activities. The said leased assets are capitalized anddepreciated over their estimated useful lives of four (4) years (Note 13). In 2011, finance leasefacilities amounting P=12.35 million was approved at 6.50% interest. In 2012, the Group pre-terminated the finance lease obligation and exercised the option to acquire the service vehicles andequipment used in construction activities.
As of December 31, 2011, the future minimum lease payments under finance lease and the presentvalue of the net minimum lease payments follows:
Within one year P=8,366After one (1) year but not more than five (5) years 4,663Total minimum lease payments 13,029Less finance charges 678Present value of minimum lease payment P=12,351
ContingenciesThe Group is contingently liable for lawsuits or claims filed by third parties (substantially laborrelated and civil cases) that are either pending decision by the courts or are under negotiation, theoutcomes of which are not presently determinable. In the opinion of management and its legalcounsels, the eventual liability under these lawsuits or claims, if any, will not have a material oradverse effect on the Group’s financial position and results of operations. The information usuallyrequired by PAS 37, is not disclosed on the grounds that it can be expected to prejudice theoutcome of these lawsuits, claims or assessments. No provisions were made during the year.
Capital CommitmentsFor the year 2011, the Group has capital commitments on acquisition of mining equipmentamounting P=841.07 million in relation to its income tax holiday registration with the BOI. TheGroup has no capital commitments in 2013 and 2012.
38. Note to Consolidated Statements of Cash Flows
On October 10, 2012, the subscription payable to DMWC amounting P=379.71 million wascancelled as a result of reduction of DMWC’s authorized capital stock. On the same date, theParent Company has fully settled its due to DMWC amounting P=234.58 million. The amountfrom the return of capital amounting P=150.91 million was applied against a portion of the liability(Note 11).
- 130 -
*SGVFS007333*
39. Other Matters
a. EPIRA
In June 2001, the Congress of the Philippines approved and passed into law R.A. No. 9136,otherwise known as the EPIRA, providing the mandate and the framework to introducecompetition in the electricity market. EPIRA also provides for the privatization of the assetsof NPC, including its generation and transmission assets, as well as its contract withIndependent Power Producers (IPPs). EPIRA provides that competition in the retail supply ofelectricity and open access to the transmission and distribution systems would occur withinthree years from EPIRA’s effective date. Prior to June 2002, concerned government agencieswere to establish WESM, ensure the unbundling of transmission and distribution wheelingrates and remove existing cross subsidies provided by industrial and commercial users toresidential customers. The WESM was officially launched on June 23, 2006 and begancommercial operations for Luzon. The ERC has already implemented a cross subsidy removalscheme. The inter-regional grid cross subsidy was fully phased-out in June 2002. ERC hasalready approved unbundled rates for Transmission Company (TRANSCO) and majority ofthe distribution utilities.
Under EPIRA, NPC’s generation assets are to be sold through transparent, competitive publicbidding, while all transmission assets are to be transferred to TRANSCO, initially agovernment-owned entity that was eventually being privatized. The privatization of theseNPC assets has been delayed and is considerably behind the schedule set by the DOE. EPIRAalso created PSALM, which is to accept transfers of all assets and assume all outstandingobligations of NPC, including its obligations to IPPs. One of PSALM’s responsibilities is tomanage these contracts with IPPs after NPC’s privatization. PSALM is also responsible forprivatizing at least 70% of the transferred generating assets and IPP contracts within threeyears from the effective date of EPIRA.
In August 2005, the ERC issued a resolution reiterating the statutory mandate under theEPIRA law for the generation and distribution companies, which are not publicly listed, tomake an initial public offering (IPO) of at least 15% of their common shares. Provided,however, that generation companies, distribution utilities or their respective holdingcompanies that are already listed in the Philippine Stock Exchange (PSE) are deemed incompliance. SCPC was already compliant with this requirement given that the ParentCompany is a publicly listed company.
WESMWith the objective of providing competitive price of electricity, the EPIRA authorized DOE toconstitute an independent entity to be represented equitably by electric power industryparticipants and to administer and operate WESM. WESM will provide a mechanism foridentifying and setting the price of actual variations from the quantities transacted undercontracts between sellers and purchasers of electricity.
In addition, the DOE was tasked to formulate the detailed rules for WESM which include thedetermination of electricity price in the market. The price determination methodology willconsider accepted economic principles and should provide a level playing field to all electricpower industry participants. The price determination methodology was subject to the approvalof the ERC.
- 131 -
*SGVFS007333*
In this regard, the DOE created Philippine Electricity Market Corporation (PEMC) to act asthe market operator governing the operation of WESM. On June 26, 2006, WESM becameoperational in the Luzon grid and adopts the model of a “gross pool, net settlement” electricitymarket.
b. Power Supply Agreement with Manila Electric Company (MERALCO)
On December 20, 2011, SCPC entered into a new power supply agreement with MERALCO,a distributor of electric power, which took effect in December 26, 2011 and shall have a termof seven (7) years, which may be extended by the parties for another three (3) years.
SCPC will be providing MERALCO with an initial contracted capacity of 210 MW and willbe increased to 420 MW upon the commercial operation of the plant’s Unit 1.
On March 12, 2012, MERALCO filed an application for the Approval of the Power SupplyAgreement (PSA) between MERALCO and SCPC, with a Prayer for Provisional Authority,docketed as ERC Case No. 2011-037 RC.
In the said application, MERALCO alleged and presented on the following: a.) the salientprovisions of the PSA; b.) payment structure under the PSA; c.) the impact of the approval ofthe proposed generation rates on MERALCO’s customers; and d.) the relevance and urgentneed for the implementation of the PSA.
On December 17, 2012, the Commission (ERC) issued a Decision approving withmodification of the ERC Case No. 2012-037 RC.
c. Clean Air Act
On November 25, 2000, the Implementing Rules and Regulations (IRR) of the PhilippineClean Air Act (PCAA) took effect. The IRR contains provisions that have an impact on theindustry as a whole and on SCPC in particular, that need to be complied with within 44months (or until July 2004) from the effectivity date, subject to the approval by DENR. Thepower plant of SCPC uses thermal coal and uses a facility to test and monitor gas emissions toconform with Ambient and Source Emissions Standards and other provisions of the Clean AirAct and its IRR. Based on SCPC’s initial assessment of its power plant’s existing facilities,SCPC believes that it is in full compliance with the applicable provisions of the IRR of thePCAA.
d. Contract for the Fly Ash of the Power Plant
On October 20, 1987, NPC and Pozzolanic Australia Pty, Ltd. (“Pozzolanic”) executed theContract for the Purchase of Fly Ash of the Power Plant (the “Pozzolanic Contract”). Underthe Pozzolanic Contract, Pozzolanic was given the right to sell, store, process, remove orotherwise dispose of all fly ash produced at the first unit of the Power Plant. It was alsogranted the first option to purchase fly ash, under similar terms and conditions, from thesecond unit of the Power Plant that NPC may construct. It may also exercise the exclusiveright of first refusal to purchase fly ash from any new coal-fired power plants which will beput up by NPC.
- 132 -
*SGVFS007333*
The Pozzolanic Contract is effective for a period of five consecutive five-year terms from itssigning, or a period of 25 years from October 20, 1987 or until 2012, subject to cancellationby NPC upon default or any breach of contract by Pozzolanic. At the end of each five-yearterm, the parties will agree to assess and evaluate the Pozzolanic Contract, and if necessary,revise, alter, modify the same upon their mutual consent.
The Philippine Government has determined the provision of the Pozzolanic Contract whichgrants Pozzolanic the exclusive right of first refusal to purchase fly ash from the second unitof the Power Plant and from any coal-fired power plant put up by NPC after the execution ofthe Pozzolanic Contract as invalid. This is the subject of a case filed by Pozzolanic andpending before the regional trial court of Quezon City as of December 31, 2011.
On April 30, 2012, the Group and Pozzolanic sealed its new contract valid and effective for aperiod of fifteen (15) years beginning February 1, 2012. Pozzolanic, as agreed, shall purchaseOne Hundred (100 %) percent of fly ashes produced or generated by the Power Plant.
e. Temporary Restraining Order on MERALCO
On December 23, 2013, the Supreme Court (SC) issued a temporary restraining order (TRO)to MERALCO enjoining it from increasing the generation rates it charges to its consumersarising from the increased generation costs from its suppliers for the supply month ofNovember 2013. The said TRO also enjoined the Energy Regulatory Commission (ERC)from implementing its December 9, 2013 Order authorizing MERALCO to stagger thecollection of its increased generation costs for the supply month of November 2013. The TROwas for a period of 60 days from December 23, 2013 to February 21, 2014.
On January 10, 2014, the SC impleaded MERALCO’s suppliers of generation costs, includingPEMC, the operator of the wholesale electricity supply market (WESM), as parties-respondents in the cases.
On February 18, 2014, the SC extended the TRO for another 60 days up to April 22, 2014.
As a result of the TRO, MERALCO has not been able to fully bill its consumers for thegeneration costs for the supply month of November 2013; and in turn, it has not been able tofully pay its suppliers of generation costs, including PEMC.
On March 11, 2014, the ERC released its ERC Order (Case No 2014-021MC, dated March 3,2014) voiding the Luzon WESM prices during the November and December 2013 supplymonths and declaring the imposition of regulated prices in lieu thereof. PEMC was herebydirected within 7 days from receipt of the Order to calculate these regulated prices andimplement the same in the revised WESM bills of the concerned distribution utilities in Luzonfor the November and December 2013 supply months for their immediate settlement, exceptfor MERALCO whose November 2013 WESM bill shall be maintained in compliance withthe TRO issued by the SC.
Pending PEMC’s actions and/or recalculation of the WESM prices for the November andDecember 2013 supply months in accordance with the ERC Order, and its effect on eachgeneration company that trade in the WESM, the Group estimated its exposure to the saidERC order. Please see judgments and estimates in Note 3.
- 133 -
*SGVFS007333*
f. Transfer of Rights
On December 4, 2007, the BOD of DMCI Masbate authorized the transfer to DMCI Masbate,all rights, interests, and obligations over applications, permits, registrations, certifications,endorsements and approvals which DMCI Masbate may have applied with and secured fromthe Department of Energy, BOI, Bureau of Customs, and other agencies of government, andthose from private entities and financial institutions relative to the power project in Masbate,such as but not limited to the Coal Supply Agreement (CSA) executed with SMC datedSeptember 4, 2007, and BOI executed last September 17, 2007.
g. Power Supply Agreement with Masbate Electric Cooperative, Inc. (MASELCO)
On May 4, 2007, MASELCO and DMCI Masbate entered into a Power Supply Agreement(PSA) wherein DMCI Masbate shall deliver a guaranteed dependable capacity of 13,000 kWwhich MASELCO may dispatch for its load and ancillary services requirements.
The PSA has a term commencing on the date of its execution and expiring on the last day ofthe fifteenth (15th) year of the commercial operations period as provided therein, unlessextended or earlier terminated. The commercial operations period shall commence not laterthan eighteen (18) months from effective date. MASELCO shall only pay for actual energydelivered, not on a take or pay basis, except in extraordinary circumstances as provided in thePSA. In exceptional circumstances, payments shall be based on a pre-defined net expectedenergy rate.
h. Subsidy Agreement between National Power Corporation (NPC), Masbate ElectricCooperative (MASELCO) and DMCI Masbate Power Corporation
In 2008, DMCI Masbate, National Power Corporation (NPC) and MASELCO have signed theSubsidy Agreement which governs the availment by the Company of the MissionaryElectrification Subsidy (ME Subsidy) as New Power Provider (NPP) in the province ofMasbate.
The agreement shall take effect from the time of execution until expiration of the PSA ortermination of the Subsidy Agreement, as provided under Section 8 of the SubsidyAgreement, whichever comes earlier.
The ME Subsidy shall be computed as the difference between the True Cost of Generationcomputed under the PSA and the Socially Acceptable Generation Rate (SAGR) paid byMaselco. The amount of the ME Subsidy shall be taken from the Universal Charge-Missionary Electrification (UC-ME) fund being maintained by NPC.
i. Reinstated and Amended Subsidy Agreement between National Power Corporation, MasbateElectric Cooperative and DMCI Masbate Power Corporation
On October 27, 2010, in line with the Transitory Agreement with MASELCO, DMCIMasbate, NPC and MASELCO signed the Reinstated and Amended Subsidy Agreement. Thisagreement will entitle DMCI Masbate to avail of the ME Subsidy while the TransitoryAgreement is effective. Moreover, this agreement includes an additional provision pertainingto Financing of Power Station and an amendment of a provision pertaining to Payment ofSubsidy Fee and True-Up Adjustments.
- 134 -
*SGVFS007333*
j. Amended Power Supply Agreement and Transitory Supply Agreement
In June 8, 2010, an Application was filed with ERC for the approval of the PSA, as amendedby the Reinstated and Amendment to the Power Supply Agreement and Transitory SupplyAgreement (TSA), and Supplement to the Transitory Agreement as well as the New PowerProvider-True Cost Generation Rate (“NPP-TCGR”). The ERC, in its Order of July 12, 2010,provisionally approved the Application filed by MASELCO and DMCI Masbate, andsubsequently, issued another Order on July 4, 2011, extending the provisional authoritygranted until revoked or made permanent.
Meanwhile, upon MASELCO’s request, DMCI Masbate constructed two (2) satellite powerplants: a 1 x 2MW diesel-fired gensets and 1 x 1 MW diesel-fired gensets in the Municipalityof Aroroy and another 2 X 1 MW diesel-fired gensets and 1 x 2 diesel-fired gensets in theMunicipality of Cataingan. The construction of such power plants significantly improved andstabilized the power supply in the province of Masbate.
In view of the aforementioned improvements and developments, the existing tariff rates ascontained in the PSA and its Supplements as approved by the ERC no longer reflect the trueand actual cost of power generation in the Province. Thus, realizing the need to adjust theexisting tariff schedule to reflect the actual costs of the power generated during the remainingterm of the PSA, MASELCO and DMCI Masbate entered into a Memorandum of Agreement(“MOA”) on August 3, 2011, incorporating therein the revised rate formula computation and aprovision for prompt payment discount.
On January 28, 2013, ERC issued a Decision for the approval with modification of theapplication for the Power Supply Agreement (PSA) and the supplemental Memorandum ofAgreement (MOA) both filed by MASELCO and DMPC.
On June 3, 2013, ERC issued an Order authorizing DMCI Masbate to recover from theUniversal Charge for Missionary Electrification (UC-ME) the amount of P=75.16 million,representing the difference between the final and provisionally approved rates, in three (3)monthly payments of P=25.05 million (plus the applicable VAT) starting its June 2013 billingperiod.
k. ERC Approval of 3rd - 6th Deferred Accounting Adjustment (DAA) for Generation RateAdjustment Mechanism (GRAM) and Incremental Currency Exchange Rate Adjustment(ICERA)
On January 31, 2011, ERC issued an Order authorizing the National Power Corporation-SmallPower Utilities Group (NPC-SPUG) to recover the DAA for 3rd GRAM amounting toP=0.9492/kWh starting the January 2011 billing period. Furthermore, the Commission thru itsdecision dated August 1, 2011 hereby authorized to recover the additional DAA for 4th to 6th
GRAM and ICERA amounting to P=1.4282/kWh for the billing period January 25, 2012 toJune 25, 2012. The said decision on the DAA for the 3rd to 6th GRAM and ICERA wasimplemented effective January 2012 billing month as an addition to the existing SAGR ofMASELCO. Subsequently, the ERC issued an order dated 30 July 2012 amending its earlierdecision on the charging of the DAA for the 4th to 6th GRAM and ICERA that startingAugust 2012 billing, the said DAA will no longer be included in the SAGR of all distributionutilities located in the off-grid areas including MASELCO.
- 135 -
*SGVFS007333*
l. Power Supply Agreement with Palawan Electric Cooperative, Inc.(PALECO)
On July 25, 2012, PALECO and the Group entered into a PSA wherein the Group shall delivera guaranteed dependable capacity of up to 25 MW which PALECO may dispatch for its activepower requirements, frequency regulation, contingency reserve, spinning reserve and voltageregulation control.
The PSA has a term commencing on the effective date of its execution and expiring on the lastday of the fifteenth (15th) year of the commercial operations period counted from thecommercial operations date as provided therein, unless extended or earlier terminated. Theeffective date shall be no later than one hundred eighty (180) days from issuance of Notice ofAward. PALECO shall only pay for actual energy delivered, except otherwise expresslyprovided therein.
m. Memorandum of Agreement (MOA) with PALECO
On October 4, 2012, due to an impending power shortage in Puerto Princesa City and somemunicipalities in the Province of Palawan, and upon the request of PALECO, the Groupentered into a MOA with PALECO wherein the Group undertakes to construct, commission,operate and maintain at least 5 MW generated dependable capacity diesel generating sets byDecember 1, 2012, ahead of the date of effectivity of the Group’s obligation to deliver powerunder the executed PSA between the parties.
On November 26, 2012, the ERC issued an Order provisionally approving the MOA betweenthe Group and PALECO. The order further states that the Group is entitled to avail thesubsidy for the UC-ME fund.
The MOA shall continue to be in full force and effect until August 31, 2013, unless earlierterminated or amended by mutual agreement of the parties.
n. Subsidy Agreement with NPC and PALECO
On December 2012, the Group, NPC and PALECO are in the process of signing the SubsidyAgreement which governs the availment by the Group of the ME Subsidy as NPP in theprovince of Palawan.
The ME Subsidy shall be computed as the difference between the True Cost of Generationcomputed under the PSA and the SAGR paid by PALECO. The amount of the ME Subsidyshall be taken from the UC-ME fund being maintained by NPC.
o. MOA with Benguet Corp Nickel Mines, Inc. (BNMI)
In March 2010, the DMCI Mining Corporation and BNMI, an affiliate of BC, agreed toestablish and maintain a Mine Rehabilitation Fund as a reasonable environmental deposit toensure the availability of funds for its satisfactory compliance with the commitments andperformance of activities stipulated in its EPEP/AEPEP during a specific project phase. Thisremains in effect in 2013.
- 136 -
*SGVFS007333*
p. Memorandum of Agreement (MOA) with Fil-Asian Strategic Resources and PropertiesCorporation (Fil-Asian)
In March 2007, the Parent Company, entered into a MOA with Fil-Asian wherein Fil-Asianappointed the former to exclusively undertake mining operations in the municipalities of Sta.Cruz and Candelaria, Province of Zambales. The Parent Company assigned DMC toundertake the mining operations covered by the MOA at the time the latter has established itscorporate identity. The annual work program shall aim to accomplish five (5) million tons ofore in five (5) years. This agreement shall terminate upon the DMC’s extraction of five (5)million tons of laterite from the property, or the expiration of five (5) years from the date ofthe execution of this agreement, whichever comes first.
On March 3, 2011, Fil-Asian assigned and transferred to ZDMC (Zambales Diversified MetalsCorporation) all rights to the MOA stated above. Subject to its submission of a Work Plan toinclude mining and environmental plans and to be approved by ZDMC and to the conditionsof this Agreement, DMC shall continue to be allowed by ZDMC to undertake miningoperations. This Agreement shall commence on the date of its execution and shall be effectiveuntil December 31, 2012.
DMC and ZDMC mutually agreed to terminate the MOA in May 2012, but resumed miningoperations in October 2012.
q. Administration Agreement with ZDMC
In October 2012, the Company entered into an administration agreement with ZMDC, inwhich the Company undertakes, in behalf of ZDMC, the trucking and mining of nickel lateriteore.
Mining services revenue arising from the said agreement amounted to P=163.92 million in2013.
40. Events After the Reporting Period
Acquisition of additional shares in ENK Plc.On March 25, 2014, the Parent Company purchased from D&A Income Ltd. the remaining 40%interest in ENK for approximately P=3.12 billion. ENK is a nickel laterite development andproduction company focused on developing the Acoje and Zambales chromite projects in thePhilippines. Upon completion of the acquisition, ENK became a wholly owned subsidiary of theParent Company.
The Stockholders and the Board of DirectorsDMCI Holdings, Inc.3rdFloor, Dacon Building2281 Don Chino Roces AvenueMakati City
We have audited in accordance with Philippine Standards on Auditing, the consolidated financialstatements of DMCI Holdings, Inc. and Subsidiaries (the Group) as at December 31, 2013 and 2012and for each of the three years in the period ended December 31, 2013, included in this Form 17-A,and have issued our report thereon dated April 3, 2014. Our audits were made for the purpose offorming an opinion on the consolidated financial statements taken as a whole. The schedules listed inthe Index to the Consolidated Financial Statements and Supplementary Schedules are theresponsibility of the Group’s management. These schedules are presented for purposes of complyingwith the Securities Regulation Code Rule No. 68, As Amended (2011) and are not part of theconsolidated financial statements. These schedules have been subjected to the auditing proceduresapplied in the audit of the consolidated financial statements and, in our opinion, fairly state in allmaterial respects, the information required to be set forth therein in relation to the consolidatedfinancial statements taken as a whole.
SYCIP GORRES VELAYO & CO.
Cyril Jasmin B. ValenciaPartnerCPA Certificate No. 90787SEC Accreditation No. 1229-A (Group A), May 31, 2012, valid until May 30, 2015Tax Identification No. 162-410-623BIR Accreditation No. 08-001998-74-2012, April 11, 2012, valid until April 10, 2015PTR No. 4225226, January 2, 2014, Makati City
BOA/PRC Reg. No. 0001, December 28, 2012, valid until December 31, 2015SEC Accreditation No. 0012-FR-3 (Group A), November 15, 2012, valid until November 16, 2015
A member firm of Ernst & Young Global Limited
*SGVFS007333*
DMCI HOLDINGS, INC. AND SUBSIDIARIESINDEX TO CONSOLIDATED COMPANY FINANCIAL STATEMENTS AND
SUPPLEMENTARY SCHEDULES
CONSOLIDATED COMPANY FINANCIAL STATEMENTS
Statement of Management’s Responsibility for Consolidated Financial Statements
Report of Independent Auditors’ Report
Consolidated Statements of Financial Position as of December 31, 2013 and 2012 andJanuary 1, 2012
Consolidated Statements of Comprehensive Income for the Years EndedDecember 31, 2013, 2012 and 2011
Consolidated Statements of Changes in Equity for the Years EndedDecember 31, 2013, 2012 and 2011
Consolidated Statements of Cash flows for the Years EndedDecember 31, 2013, 2012 and 2011
Notes to Consolidated Financial Statements
SUPPLEMENTARY SCHEDULES
Report of Independent Auditors on Supplementary Schedules
I. Schedules required by Annex 68-EA. Financial Assets (Current Marketable Equity and Debt Securities and Other Short-Term Cash
Investments)B. Amounts Receivable from Directors, Officers, Employees,
Related Parties and Principal Stockholders (Other than Related Parties)C. Amounts Receivable from Related Parties which are
Eliminated during the Consolidation of Financial StatementsD. Intangible AssetsE. Long-term DebtF. Indebtedness to Related PartiesG. Guarantees of Securities of Other IssuersH. Capital Stock
II. Schedule of all of the effective standards and interpretations (Part 1, 4J)
III. Reconciliation of Retained Earnings Available for Dividend Declaration(Part 1, 4C; Annex 68-C)
IV. Map of the relationships of the companies within the group (Part 1, 4H)
V. Schedule of Financial Ratios
*SGVFS007333*
DMCI HOLDINGS, INC. AND SUBSIDIARIESSUPPLEMENTARY INFORMATION AND DISCLOSURES REQUIRED ON SRC RULE 68 AS AMENDEDDECEMBER 31, 2013
Philippine Securities and Exchange Commission (SEC) issued the amended Securities Regulation Code Rule SRC Rule 68 which consolidates the twoseparate rules and labeled in the amendment as “Part I” and “Part II”, respectively. It also prescribed the additional information and schedule requirements forissuers of securities to the public.
Below are the additional information and schedules required by SRC Rule 68, as Amended (2011), that are relevant to the Group. This information ispresented for purposes of filing with the SEC and is not required part of the basic financial statements.
Schedule A. Financial Assets
Name of issuing entity and associationof each issue
Number of shares orprincipal amount of
bonds and notes
Amount shown in thebalance sheet
Value based on marketquotation at end ofreporting period
Income received andaccrued
Manila Electric Company 38,553 P=9,664,076 P=9,664,076Manila Southwoolds Golf-Academy 3 1,330,000 1,330,000Subic Bay Yatch Club 2 400,000 400,000Manila Golf and Country Club 1 30,000,000 30,000,000Capitol Hills Golf and Country Club 1 30,000 30,000Canlubang Golf and Country Club 1 500,000 500,000Mabuhay Vinyl Corp. 34,889 77,104 77,104Alabang Country Club Inc. 1 2,200,000 2,200,000Wack Wack Golf & Country Club 1 15,000,000 15,000,000Wirerope Corporation of the Philippines 19,925 6,432,811 6,432,811
(Forward)
*SGVFS007333*
Name of issuing entity and associationof each issue
Number of shares orprincipal amount of
bonds and notes
Amount shown in thebalance sheet
Value based on marketquotation at end ofreporting period
Income received andaccrued
DMC Conex Freight Services, Inc. 1 P=661,014 P=661,014Northwoods Development Corporation 1 650,000 650,000Bayantel 1 400,000 400,000Philippine Columbian Association 1 16,896 16,896Purefoods Preferred Shares 70,000 73,150,000 73,150,000 P=4,200,000
Schedule B. Amounts Receivable from Directors, Officers, Employees, Related Partiesand Principal Stockholders (other than related parties)
Name and Designation ofdebtor
Balance atbeginning of
periodAdditions Amounts
collectedAmounts
written off Current Notcurrent
Balance atend of period
Not applicable. The Group’s receivables from officers and employees pertain to ordinary purchases subject to usual terms, travel and expense advancesand other transactions arising from the Group’s ordinary course of business.
*SGVFS007333*
Schedule C. Amounts Receivable from/Payable to Related Parties which are Eliminated during the Consolidation of Financial StatementsThe following is the schedule of receivables from related parties, which are eliminated in the consolidated financial statements as at December 31, 2013:
Entity withReceivable Balance
Name of Entity withPayable Balance
Due fromrelated party
Due torelated party
D.M. Consunji, Inc. Semirara Mining Corporation P=736,886,254 (P=736,886,254)D.M. Consunji, Inc. Southwest Luzon Power Generation Corporation 530,379,345 (530,379,345)Beta Electric Corporation D.M. Consunji, Inc. 401,278,903 (401,278,903)Southwest Luzon Power Generation Corporation D.M. Consunji, Inc. 383,721,078 (383,721,078)Project Developers, Inc. DMCI Homes, Inc. 284,288,111 (284,288,111)D.M. Consunji, Inc. Beta Electric Corporation 209,705,193 (209,705,193)Semirara Mining Corporation D.M. Consunji, Inc. 166,191,976 (166,191,976)Riviera Land Corporation Project Developers, Inc. 86,000,628 (86,000,628)Hampstead Gardens Corporation Project Developers, Inc. 75,880,220 (75,880,220)D.M. Consunji, Inc. Sem-Calaca Power Corporation 66,906,302 (66,906,302)DMCI Power Corporation Semirara Mining Corporation 66,138,356 (66,138,356)Project Developers, Inc. DMCI Hotel Property Management, Inc. 50,096,774 (50,096,774)DMCI Power Corporation Sem-Calaca Power Corporation 40,283,914 (40,283,914)DMCI Holdings, Inc. DMCI Power Corporation 21,275,000 (21,275,000)D.M. Consunji, Inc. DMCI Power Corporation 17,597,771 (17,597,771)Semirara Mining Corporation DMCI Mining Corporation 8,717,043 (8,717,043)Wirerope Corporation D.M. Consunji, Inc. 5,975,981 (5,975,981)D.M. Consunji, Inc. DMCI Masbate Power Corporation 5,828,127 (5,828,127)Riviera Land Corporation DMCI Homes, Inc. 5,663,401 (5,663,401)Sem-Calaca Power Corporation D.M. Consunji, Inc. 4,456,536 (4,456,536)Hampstead Gardens Corporation DMCI Homes, Inc. 2,399,955 (2,399,955)DMCI Palawan Power Corporation DMCI Power Corporation 2,817,716 (2,817,716)DMCI Homes, Inc. Riviera Land Corporation 2,545,103 (2,545,103)Beta Electric Corporation Raco Haven Automation Philippines, Inc. 1,528,767 (1,528,767)D.M. Consunji, Inc. DMCI Homes, Inc. 850,564 (850,564)D.M. Consunji, Inc. DMCI Mining Corporation 811,509 (811,509)Semirara Mining Corporation DMCI Masbate Power Corporation 659,515 (659,515)DMCI Homes, Inc. D.M. Consunji, Inc. 486,026 (486,026)DMCI Power Corporation DMCI Palawan Power Corporation 248,854 (248,854)D.M. Consunji, Inc. Wirerope Corporation of the Philippines, Inc. 133,933 (133,933)D.M. Consunji, Inc. DMCI Hotel Property Management, Inc. 35,546 (35,546)DMCI Holdings, Inc. Semirara Mining Corporation 30,000 (30,000)DMCI Masbate Power Corporation DMCI Mining Corporation 6,000 (6,000)
As of December 31, 2013, the balances above of due from and due to related parties are expected to be realized and settled within twelve months from thereporting date and are classified under current assets and liabilities. There were no amounts written off during the year.
*SGVFS007333*
Schedule D. Intangible Asset
Description Beginningbalance Additions at cost Charged to costs
See Note 14 of the Consolidated Financial Statements.
*SGVFS007333*
Schedule E. Long-term DebtBelow is the schedule of long-term debt of the Group:
Title of issueand type ofobligation
Amountauthorized by
indentureInterest rates Maturity date Number of periodic
installments
Amount shownunder caption
"Current portionof long-term
debt" in relatedbalance sheet
Amount shownunder caption"Long-term
debt" in relatedbalance sheet
Mortgage payable
P=5,342,447,546 PDST-F benchmark yield for 3-month treasury securities +1.75%
May 2017 Payable in twenty-five (25)equal consecutive quarterlyinstallments commencing onMay 2011
P=1,519,639,144 P=3,822,808,402
Mortgage payable
5,675,501,237 PDST-F benchmark yield for 3-month treasury securities +1.00%
May 2022 Payable in twenty-five (27)equal consecutive quarterlyinstallments commencing onNovember 24, 2015
– 5,675,501,237
Bank loans 320,373,016 Floating rate payablequarterly and in arrears, to berepriced every 90 days
January 2015 Principal repayable in bulletat the end of three (3) yearsfrom drawdown date
– 320,373,016
Bank loans 21,309,600 Floating rate payablequarterly and in arrears, to berepriced every 90 days
January 2015 Principal repayable in bulletat the end of three (3) yearsfrom drawdown date
– 21,309,600
Bank loans 97,713,395 Floating rate to be repricedevery 90 days
March 2014 Principal repayable atmaturity date
97,713,395 –
Bank loans 52,119,730 Floating rate to be repricedevery 90 days
April 2014 Principal repayable atmaturity date
52,119,730 –
Bank loans 144,550,120 Floating rate to be repricedevery 90 days
July 2014 Principal repayable atmaturity date
144,550,120 –
Bank loans 127,502,440 Floating rate to be repricedevery 90 days
August 2014 Principal repayable atmaturity date
127,502,440 –
Bank loans 9,544,925 Floating rate to be repricedevery 90 days
September 2014 Principal repayable atmaturity date
9,544,925 –
Bank loans 97,979,765 Floating rate to be repricedevery 90 days
November 2014 Principal repayable atmaturity date
97,979,765 –
Bank loans 176,779,079 Floating rate to be repricedevery 90 days
March 2015 Principal repayable atmaturity date
– 176,779,079
(Forward)
*SGVFS007333*
Title of issueand type ofobligation
Amountauthorized by
indentureInterest rates Maturity date Number of periodic
installments
Amount shownunder caption
"Current portionof long-term
debt" in relatedbalance sheet
Amount shownunder caption"Long-term
debt" in relatedbalance sheet
Bank loans P=290,691,985 Floating rate to be repricedevery 90 days
May 2015 Principal repayable atmaturity date
P=– P=290,691,985
Bank loans 18,632,435 Floating rate to be repricedevery 90 days
June 2015 Principal repayable atmaturity date
– 18,632,435
Bank loans 215,493,330 Floating rate to be repricedevery 90 days
April 2015 Principal repayable atmaturity date
– 215,493,330
Bank loans 14,739,140 Floating rate to be repricedevery 90 days
July 2015 Principal repayable atmaturity date
– 14,739,140
Bank loans 1,497,566,016 Floating rate to be repricedevery 90 days
December 2016 Principal repayable atmaturity date
– 1,497,566,016
Bank loans 102,108,500 Floating rate, aggregate of themargin (1.20%) and LIBOR, to berepriced every 90 to 180 days
December 2014 Principal repayable in semi-annual installmentscommencing on the 12th
month after the date of theAgreement until date of finalmaturity
102,108,500 –
Bank loans 104,328,250 Floating rate, aggregate of themargin (1.20%) and LIBOR, to berepriced every 90 to 180 days
June 2015 Principal repayable in semi-annual installmentscommencing on the 12th
month after the date of theAgreement until date of finalmaturity
– 104,328,250
Bank loans 104,328,250 Floating rate, aggregate of themargin (1.20%) and LIBOR, to berepriced every 90 to 180 days
December 2015 Principal repayable in semi-annual installmentscommencing on the 12th
month after the date of theAgreement until date of finalmaturity
– 104,328,250
(Forward)
*SGVFS007333*
Title of issueand type ofobligation
Amountauthorized by
indentureInterest rates Maturity date Number of periodic
installments
Amount shownunder caption
"Current portionof long-term
debt" in relatedbalance sheet
Amount shownunder caption"Long-term
debt" in relatedbalance sheet
Bank loans P=621,530,000 Floating rate, aggregate of themargin (1.20%) and LIBOR, to berepriced every 90 to 180 days
June 2016 Principal repayable in semi-annual installmentscommencing on the 12th
month after the date of theAgreement until date of finalmaturity
P=– P=621,530,000
Bank loans 621,530,000 Floating rate, aggregate of themargin (1.20%) and LIBOR, to berepriced every 90 to 180 days
December 2016 Principal repayable in semi-annual installmentscommencing on the 12th
month after the date of theAgreement until date of finalmaturity
– 621,530,000
Bank loans 151,877,594 Floating rate September 2015 Principal payable on the dateof maturity
– 151,877,594
Corporate notes 1,960,000,000 7.220% 5 years 1% every year 20,000,000 1,940,000,000Corporate notes 2,940,000,000 7.890% 5 years 1% every year 30,000,000 2,910,000,000Corporate notes 1,000,000,000 6.080% 7 years 7th to 27th Quarter from
issue date10,000,000 990,000,000
Corporate notes 4,000,000,000 5.250% 8 years 9th to 30th Quarter fromissue date
– 4,000,000,000
Corporate notes 5,000,000,000 5.000% 8 years 8th to 29th Quarter fromissue date
See Note 22 of the Consolidated Financial Statements
*SGVFS007333*
DMCI HOLDINGS, INC. AND SUBSIDIARIESSCHEDULE OF ALL EFFECTIVE STANDARDS AND INTERPRETATIONSUNDER PFRS AS OF DECEMBER 31, 2013
Philippine Securities and Exchange Commission (SEC) issued the amended Securities RegulationCode Rule 68 and 68.1 which consolidates the two separate rules and labeled in the amendment as“Part I” and “Part II”, respectively. It also prescribed the additional schedule requirements for largeentities showing a list of all effective standards and interpretations under Philippine FinancialReporting Standards (PFRS).
Below is the list of all effective PFRS, Philippine Accounting Standards (PAS) and PhilippineInterpretations of International Financial Reporting Interpretations Committee (IFRIC) as atDecember 31, 2013:
PHILIPPINE FINANCIAL REPORTING STANDARDS ANDINTERPRETATIONSEffective as of December 31, 2013
Adopted NotEarly
Adopted
NotApplicable
Framework for the Preparation and Presentation of FinancialStatementsConceptual Framework Phase A: Objectives and qualitativecharacteristics
P
PFRSs Practice Statement Management Commentary P
Philippine Financial Reporting Standards
PFRS 1(Revised)
First-time Adoption of Philippine Financial ReportingStandards P
Amendments to PFRS 1 and PAS 27: Cost of anInvestment in a Subsidiary, Jointly Controlled Entity orAssociate
P
Amendments to PFRS 1: Additional Exemptions for First-time Adopters P
Amendment to PFRS 1: Limited Exemption fromComparative PFRS 7 Disclosures for First-time Adopters P
Amendments to PFRS 1: Severe Hyperinflation andRemoval of Fixed Date for First-time Adopters P
Amendments to PFRS 1: Government Loans P
PFRS 2 Share-based Payment P
Amendments to PFRS 2: Vesting Conditions andCancellations P
Amendments to PFRS 2: Group Cash-settled Share-basedPayment Transactions P
PFRS 3(Revised)
Business CombinationsP
PFRS 4 Insurance Contracts P
Amendments to PAS 39 and PFRS 4: Financial GuaranteeContracts P
PFRS 5 Non-current Assets Held for Sale and DiscontinuedOperations P
- 2 -
*SGVFS007333*
PHILIPPINE FINANCIAL REPORTING STANDARDS ANDINTERPRETATIONSEffective as of December 31, 2013
Adopted NotEarly
Adopted
NotApplicable
PFRS 6 Exploration for and Evaluation of Mineral Resources P
PFRS 7 Financial Instruments: Disclosures P
Amendments to PAS 39 and PFRS 7: Reclassification ofFinancial Assets P
Amendments to PAS 39 and PFRS 7: Reclassification ofFinancial Assets - Effective Date and Transition P
Amendments to PFRS 7: Improving Disclosures aboutFinancial Instruments P
Amendments to PFRS 7: Disclosures - Transfers ofFinancial Assets P
Amendments to PFRS 7: Disclosures - OffsettingFinancial Assets and Financial Liabilities P
Amendments to PFRS 7: Mandatory Effective Date ofPFRS 9 and Transition Disclosures P
PFRS 8 Operating Segments P
PFRS 9 Financial Instruments P
Amendments to PFRS 9: Mandatory Effective Date ofPFRS 9 and Transition Disclosures P
New Hedge Accounting Requirements P
PFRS 10 Consolidated Financial Statements P
Amendments to PFRS 10: Investment Entities P
PFRS 11 Joint Arrangements P
PFRS 12 Disclosure of Interests in Other Entities P
Amendments to PFRS 12: Investment Entities P
PFRS 13 Fair Value Measurement P
Philippine Accounting Standards
PAS 1(Revised)
Presentation of Financial Statements P
Amendment to PAS 1: Capital Disclosures P
Amendments to PAS 32 and PAS 1: Puttable FinancialInstruments and Obligations Arising on Liquidation P
Amendments to PAS 1: Presentation of Items of OtherComprehensive Income or OCI P
PAS 2 Inventories P
PAS 7 Statement of Cash Flows P
PAS 8 Accounting Policies, Changes in Accounting Estimatesand Errors P
PAS 10 Events after the Reporting Date P
PAS 11 Construction Contracts P
- 3 -
*SGVFS007333*
PHILIPPINE FINANCIAL REPORTING STANDARDS ANDINTERPRETATIONSEffective as of December 31, 2013
Adopted NotEarly
Adopted
NotApplicable
PAS 12 Income Taxes P
Amendment to PAS 12 - Deferred Tax: Recovery ofUnderlying Assets P
PAS 16 Property, Plant and Equipment P
PAS 17 Leases P
PAS 18 Revenue P
PAS 19(Revised)
Employee Benefits P
Amendments to PAS 19: Defined Benefit Plans -Employee Contributions P
PAS 20 Accounting for Government Grants and Disclosure ofGovernment Assistance P
PAS 21 The Effects of Changes in Foreign Exchange Rates P
Amendment: Net Investment in a Foreign Operation P
PAS 23(Revised)
Borrowing CostsP
PAS 24(Revised)
Related Party DisclosuresP
PAS 26 Accounting and Reporting by Retirement Benefit Plans P
PAS 27(Amended)
Separate Financial Statements P
Amendments to PAS 27: Investment Entities P
PAS 28(Amended)
Investments in Associates and Joint VenturesP
PAS 29 Financial Reporting in Hyperinflationary Economies P
PAS 32 Financial Instruments: Disclosure and Presentation P
Amendments to PAS 32 and PAS 1: Puttable FinancialInstruments and Obligations Arising on Liquidation P
Amendment to PAS 32: Classification of Rights Issues P
Amendments to PAS 32: Offsetting Financial Assets andFinancial Liabilities P
PAS 33 Earnings per Share P
PAS 34 Interim Financial Reporting P
PAS 36 Impairment of Assets P
Amendments to PAS 36: Impairment of Assets -Recoverable Amount Disclosures for Non-Financial Assets P
PAS 37 Provisions, Contingent Liabilities and Contingent Assets P
PAS 38 Intangible Assets P
PAS 39 Financial Instruments: Recognition and Measurement P
- 4 -
*SGVFS007333*
PHILIPPINE FINANCIAL REPORTING STANDARDS ANDINTERPRETATIONSEffective as of December 31, 2013
Adopted NotEarly
Adopted
NotApplicable
Amendments to PAS 39: Transition and Initial Recognitionof Financial Assets and Financial Liabilities P
Amendments to PAS 39: Cash Flow Hedge Accounting ofForecast Intragroup Transactions P
Amendments to PAS 39: The Fair Value Option P
Amendments to PAS 39 and PFRS 4: Financial GuaranteeContracts P
Amendments to PAS 39 and PFRS 7: Reclassification ofFinancial Assets P
Amendments to PAS 39 and PFRS 7: Reclassification ofFinancial Assets - Effective Date and Transition P
Amendments to Philippine Interpretation IFRIC 9 and PAS39: Embedded Derivatives P
Amendment to PAS 39: Eligible Hedged Items P
Amendments to PAS 39: Financial Instruments:Recognition and Measurement - Novation of Derivativesand Continuation of Hedge Accounting
P
PAS 40 Investment Property P
PAS 41 Agriculture P
Philippine Interpretations
IFRIC 1 Changes in Existing Decommissioning, Restoration andSimilar Liabilities P
IFRIC 2 Members' Share in Co-operative Entities and SimilarInstruments P
IFRIC 4 Determining Whether an Arrangement Contains a Lease P
IFRIC 5 Rights to Interests arising from Decommissioning,Restoration and Environmental Rehabilitation Funds P
IFRIC 6 Liabilities arising from Participating in a Specific Market -Waste Electrical and Electronic Equipment P
IFRIC 7 Applying the Restatement Approach under PAS 29Financial Reporting in Hyperinflationary Economies P
IFRIC 8 Scope of PFRS 2 P
IFRIC 9 Reassessment of Embedded Derivatives P
Amendments to Philippine Interpretation IFRIC 9 and PAS39: Embedded Derivatives P
IFRIC 10 Interim Financial Reporting and Impairment P
IFRIC 11 PFRS 2- Group and Treasury Share Transactions P
IFRIC 12 Service Concession Arrangements P
IFRIC 13 Customer Loyalty Programmes P
- 5 -
*SGVFS007333*
PHILIPPINE FINANCIAL REPORTING STANDARDS ANDINTERPRETATIONSEffective as of December 31, 2013
Adopted NotEarly
Adopted
NotApplicable
IFRIC 14 The Limit on a Defined Benefit Asset, Minimum FundingRequirements and their Interaction P
Amendments to Philippine Interpretations IFRIC- 14,Prepayments of a Minimum Funding Requirement P
IFRIC 15 Agreements for the Construction of Real Estate P
IFRIC 16 Hedges of a Net Investment in a Foreign Operation P
IFRIC 17 Distributions of Non-cash Assets to Owners P
IFRIC 18 Transfers of Assets from Customers P
IFRIC 19 Extinguishing Financial Liabilities with EquityInstruments P
IFRIC 20 Stripping Costs in the Production Phase of a Surface Mine P
IFRIC 21 Levies P
SIC-10 Government Assistance - No Specific Relation toOperating Activities P
SIC-12 Consolidation - Special Purpose Entities P
Amendment to SIC - 12: Scope of SIC 12 P
SIC-13 Jointly Controlled Entities - Non-Monetary Contributionsby Venturers P
SIC-15 Operating Leases - Incentives P
SIC-21 Income Taxes - Recovery of Revalued Non-DepreciableAssets P
SIC-25 Income Taxes - Changes in the Tax Status of an Entity orits Shareholders P
SIC-27 Evaluating the Substance of Transactions Involving theLegal Form of a Lease P
SIC-29 Service Concession Arrangements: Disclosures. P
SIC-31 Revenue - Barter Transactions Involving AdvertisingServices P
SIC-32 Intangible Assets - Web Site Costs P
Standards tagged as “Not early adopted” are standards issued but not yet effective as of December 31,2013. The Group will adopt the Standards and Interpretations when these become effective.
Standards tagged as “Not applicable” have been adopted by the Group but have no significant coveredtransactions for the year ended December 31, 2013.
*SGVFS007333*
DMCI HOLDINGS, INC.SUPPLEMENTARY SCHEDULE OF RETAINED EARNINGS AVAILABLEFOR DIVIDENDS DECLARATIONFOR THE YEAR ENDED DECEMBER 31, 2013
Adjustments –Amortization of discount on payable to landowners 48,653Effect of adoption of the Revised PAS 19 (21,319,084)
Unappropriated Retained Earnings as adjusted, beginning 8,481,083,493
Net income actually earned/realized during the year
Net income during the year closed to Retained Earnings 16,651,290,588
Less: Non-actual/unrealized income, net of taxEquity in net income of associate/joint venture –Unrealized foreign exchange gain - net –Unrealized actuarial gain –Fair value adjustment (M2M gains) –Fair value adjustment of Investment Property
resulting to gain –Adjustment due to deviation from PFRS/GAAP - gain –Other unrealized gains or adjustments to the retained
earnings as a result of certain transactions accounted for under the PFRS –
Add: Non-actual lossesMovements in deferred tax assets –Depreciation on revaluation increment (after tax) –Adjustment due to deviation from PFRS/GAAP - loss –Loss on fair value adjustment of investment property
(after tax) –16,651,290,588
Less: Dividend declarations during the yearCash dividends (9,028,679,600)
Appropriation for capital expenditures, investments and future dividend declaration (1,300,000,000)Reversal of Appropriation for capital expenditures, investments and
future dividend declaration 3,800,000,000
Total Unappropriated Retained Earnings Available ForDividend Distribution, December 31, 2013 P=18,603,694,481
*SGVFS007333*
DMCI HOLDINGS, INC. AND SUBSIDIARIESMAP OF RELATIONSHIPS OF THE COMPANIES WITHIN THE GROUP
Group StructureBelow is a map showing the relationship between and among the Group and its ultimate parent company, subsidiaries, and associates as ofDecember 31, 2013:
DMCI Holdings, Inc.
Semirara CementCorporation
(100%)
Wire RopeCorporation of the
Philippines(61.70%)
DMCI MiningCorporation
(100%)
Semirara MiningCorporation
(56.32%)
DMCI ProjectDevelopers, Inc.
(100%)
DMCI PowerCorporation
(100%)
D. M. Consunji,Inc. (100%)
DMCI MasbatePower Corporation
(100%)
DMCI PalawanPower Corporation
(100%)
AB
C
D
ENK Plc.(60%)
Private InfraDev Corp.
(33%)DMCI-MPIC
Water Co.(27.19%)
Associates and Joint Ventures
*SGVFS007333*
Beta ElectricCorporation
(51.77%)
Oriken DynamixCompany, Inc.
(89%)
A
Raco HavenAutomation
Phil.(50.14%)
Bachy SolentachePhilippines
Corporation(49%)
Obayashi PhilippinesCorporation(39.55%)
DM Consunji, Inc.-FirstBalfour Joint Venture
(51%)
Associates
Joint Venture
*SGVFS007333*
DMCI Homes(100%)
Hampstead GardensCorporation
(100%)
DMCI PDI Hotel(100.00%)
DMCI PropertyManagement Corporation
(100%)
Riviera LandCorporation
(100%)
B
Subic Water andSewerage Company
(40%)
*SGVFS007333*
*newly incorporated entities
Sem-Calaca PowerCorporation
(100%)
Southwest Luzon PowerGeneration Corp.
(100%)
Sem-Cal IndustrialPark Developers, Inc.
(100.00%)
SemiraraClaystone, Inc
(100%)
C
Sem-Balayan PowerGeneration Corporation*
(100%)
Semirara EnergyUtilities, Inc. *
(100%)
St. Raphael PowerGeneration Corporation*
(100%)
*SGVFS007333*
Toledo MiningCorporation
(98.09%)
NickelineResources
Holdings, Inc.(31%)
D
*SGVFS007333*
DMCI HOLDINGS, INC. AND SUBSIDIARIESSCHEDULE OF FINANCIAL SOUNDNESS INDICATORSFOR THE YEAR ENDED DECEMBER 31, 2013 and 2012
Financial Soundness Indicator 2013 2012
i. Liquidity ratios:Current ratio 246.61% 180.02%Quick ratio 166.34% 101.34%
ii. Leverage ratios:Debt-to-equity ratio 61.07% 52.23%Interest coverage ratio 2621.40% 1165.33%
iii. Management ratios:Inventory turnover ratio 153.18% 177.34%Accounts receivable turnover ratio 424.08% 522.09%Return on assets ratio 20.17% 13.76%Return on equity ratio 40.85% 27.81%
iv. Asset-to-equity ratio 205.56% 198.92%
v. Profitability ratios:Gross margin ratio 38.85% 33.16%Net profit margin ratio 39.77% 24.14%
*See attached reporting computation.
*SGVFS007333*
DMCI HOLDINGS, INC. AND SUBSIDIARIESSCHEDULE OF FINANCIAL SOUNDNESS INDICATORSFOR THE YEAR ENDED DECEMBER 31, 2013 and 2012
2013 2012(Amounts in thousands)
Current assets P=71,185,790 P=49,225,654Current liabilities 28,865,344 27,344,422Current ratio 246.61% 180.02%
Current assets P=71,185,790 P=49,225,654Inventories 23,171,833 21,515,161Quick assets 48,013,957 27,710,493Current liabilities 28,865,344 27,344,422Quick ratio 166.34% 101.34%
Interest-bearing loans P=36,764,139 P=25,466,086Equity 60,203,077 48,756,092Debt-to-equity ratio 61.07% 52.23%
Earnings before income tax P=24,361,409 P=13,966,809Interest expense 929,328 1,198,528Interest coverage ratio 2621.40% 1165.33%
Cost of goods sold P=34,224,968 P=34,580,636Average inventory 22,343,497 19,499,918Inventory turnover ratio 153.18% 177.34%
Net credit sales P=55,970,630 P=51,739,879Average accounts receivable 13,198,212 9,910,055Accounts receivable turnover ratio 424.08% 522.09%
Net income P=22,256,759 P=12,492,255Average total assets 110,367,423 90,806,704Return on assets ratio 20.17% 13.76%
Net income P=22,256,759 P=12,492,255Average total equity 54,479,585 44,912,379Return on equity ratio 40.85% 27.81%
Total assets P=123,750,759 P=96,984,086Total equity 60,203,077 48,756,092Asset-to-equity ratio 205.56% 198.92%