SECURITIES AND EXCHANGE COMMISSION Washington, D.C. 20549 FORM 8-K CURRENT REPORT Pursuant to Section 13 or 15(d) of the Securities Exchange Act of 1934 Date of Report (Date of earliest event reported): July 30, 2007 SIMON PROPERTY GROUP, INC. (Exact name of registrant as specified in its charter) Delaware 001-14469 046268599 (State or other jurisdiction of incorporation) (Commission File Number) (IRS Employer Identification No.) 225 WEST WASHINGTON STREET INDIANAPOLIS, INDIANA 46204 (Address of principal executive offices) (Zip Code) Registrant’s telephone number, including area code: 317.636.1600 Not Applicable (Former name or former address, if changed since last report) Check the appropriate box below if the Form 8-K filing is intended to simultaneously satisfy the filing obligation of the registrant under any of the following provisions: Written communications pursuant to Rule 425 under the Securities Act (17 CFR 230.425) Soliciting material pursuant to Rule 14a-12 under the Exchange Act (17 CFR 240.14a-12) Pre-commencement communications pursuant to Rule 14d-2(b) under the Exchange Act (17 CFR 240.14d-2(b)) Pre-commencement communications pursuant to Rule 13e-4(c) under the Exchange Act (17 CFR 240.13e-4(c))
Transcript
SECURITIES AND EXCHANGE COMMISSION Washington, D.C. 20549
FORM 8-K
CURRENT REPORT Pursuant to Section 13 or 15(d) of the
Securities Exchange Act of 1934
Date of Report (Date of earliest event reported): July 30, 2007
SIMON PROPERTY GROUP, INC. (Exact name of registrant as specified in its charter)
Delaware 001-14469 046268599 (State or other jurisdiction
of incorporation) (Commission
File Number) (IRS Employer
Identification No.)
225 WEST WASHINGTON STREET INDIANAPOLIS, INDIANA 46204
(Address of principal executive offices) (Zip Code)
Registrant’s telephone number, including area code: 317.636.1600
Not Applicable (Former name or former address, if changed since last report)
Check the appropriate box below if the Form 8-K filing is intended to simultaneously satisfy the filing obligation of the registrant under any of the following provisions:
Written communications pursuant to Rule 425 under the Securities Act (17 CFR 230.425)
Soliciting material pursuant to Rule 14a-12 under the Exchange Act (17 CFR 240.14a-12)
Pre-commencement communications pursuant to Rule 14d-2(b) under the Exchange Act (17 CFR 240.14d-2(b))
Pre-commencement communications pursuant to Rule 13e-4(c) under the Exchange Act (17 CFR 240.13e-4(c))
2
Item 2.02. Results of Operation and Financial Condition
On July 30, 2007, Simon Property Group, Inc. (the “Registrant”) issued a press release containing information on earnings for the quarter ended June 30, 2007 and other matters. A copy of the press release is attached hereto as Exhibit 99.2 and the information in the press release is incorporated by reference into this report.
The press release and Supplemental Information package attached as Exhibit 99.1 use the non-GAAP financial measure of Funds from Operations (“FFO”). The Supplemental Information package also uses the non-GAAP measure of Net Operating Income (“NOI”). The Registrant considers FFO and NOI key measures of its operating performance that are not specifically defined by accounting principles generally accepted in the United States (“GAAP”). The Registrant believes that FFO and NOI are helpful to investors because they are widely recognized measures of the performance of real estate investment trusts and provide relevant bases for comparison among REITs. The Registrant also uses FFO and NOI internally to measure the operating performance of its portfolio. Reconciliations of net income to FFO on an estimated and historical basis are provided on pages 62 and 72 furnished herewith in Exhibit 99.2. Reconciliations of net income to NOI on a historical basis are provided on page 14 furnished herewith in Exhibit 99.1.
The Registrant is furnishing the information contained herein, including Exhibit 99.2, pursuant to Item 2.02 of Form 8-K promulgated by the Securities and Exchange Commission (the “SEC”). This information shall not be deemed to be “filed” with the SEC or incorporated by reference into any other filing with the SEC.
Item 7.01. Regulation FD Disclosure
On July 30, 2007, the Registrant made available additional ownership and operational information concerning the Registrant, Simon Property Group, L.P., and properties owned or managed as of June 30, 2007 in the form of a Supplemental Information package, a copy of which is attached as Exhibit 99.1. The Supplemental Information package is also available upon request as specified therein.
The Registrant is furnishing the information contained herein, including Exhibit 99.1, pursuant to Item 7.01 of Form 8-K promulgated by the SEC. This information shall not be deemed to be “filed” with the SEC or incorporated by reference into any other filing with the SEC.
Item 9.01. Financial Statements and Exhibits
Financial Statements:
None
Exhibits: Page Number in
Exhibit No. Description This Filing 99.1 Supplemental Information as of June 30, 2007 . . . . . . . . . . . . . . . . . . . . . . . . 5
99.2 Earnings Release for the quarter ended June 30, 2007 . . . . . . . . . . . . . . . . . 61
3
SIGNATURES
Pursuant to the requirements of the Securities Exchange Act of 1934, the Registrant has duly caused this report to be signed on its behalf by the undersigned thereunto duly authorized.
Dated: July 30, 2007
SIMON PROPERTY GROUP, INC.
By: /s/ STEPHEN E. STERRETT
Stephen E. Sterrett, Executive Vice President and Chief Financial Officer
Simon Property Group, Inc. (the “Company” or “Simon Property”) (NYSE:SPG) is a self-administered and self-managed real estate investment trust (“REIT”). Simon Property Group, L.P. (the “Operating Partnership”) is a subsidiary partnership of the Company. The Company and the Operating Partnership (collectively, “Simon Group”) are engaged primarily in the ownership, development and management of retail real estate properties. Simon Group operates from five retail real estate platforms: regional malls, Premium Outlet Centers®, The Mills®, community/lifestyle centers and international properties. At June 30, 2007, the Company owned or had an interest in 383 properties comprising 258 million square feet of gross leasable area in North America, Europe and Asia.
On March 29, 2007, SPG-FCM Ventures, LLC (“SPG-FCM”), a joint venture between an entity owned 50% by the Company and 50% by funds managed by Farallon Capital Management, L.L.C. (“Farallon”), acquired all of the outstanding common stock of The Mills Corporation (“Mills”). As a result, the Company now holds an interest in an additional 38 joint venture properties with approximately 44 million square feet of GLA. A detailed listing of the names and locations of Mills properties acquired is included on page 41. The information in this supplemental information package reflects the ownership of the Mills properties with the exception of NOI composition; operational and statistical information; capital expenditures; and development activity. Prior to March 29, 2007, the Company held a 50% interest in two properties in the Mills portfolio.
This package was prepared to provide (1) ownership information, (2) certain operational information, and (3) balance sheet information as of June 30, 2007, for the Company and the Operating Partnership.
Certain statements made in this Supplemental Package may be deemed “forward-looking statements” within the meaning of the Private Securities Litigation Reform Act of 1995. Although the Company believes the expectations reflected in any forward-looking statements are based on reasonable assumptions, the Company can give no assurance that our expectations will be attained, and it is possible that actual results may differ materially from those indicated by these forward-looking statements due to a variety of risks and uncertainties. Those risks and uncertainties include, but are not limited to: the Company’s ability to meet debt service requirements, the availability of financing, changes in the Company’s credit rating, changes in market rates of interest and foreign exchange rates for foreign currencies, the ability to hedge interest rate risk, risks associated with the acquisition, development and expansion of properties, general risks related to retail real estate, the liquidity of real estate investments, environmental liabilities, international, national, regional and local economic climates, changes in market rental rates, trends in the retail industry, relationships with anchor tenants, the inability to collect rent due to the bankruptcy or insolvency of tenants or otherwise, risks relating to joint venture properties, costs of common area maintenance, competitive market forces, risks related to international activities, insurance costs and coverage, impact of terrorist activities, inflation and maintenance of REIT status. The Company discusses these and other risks and uncertainties under the heading “Risk Factors” in its annual and quarterly periodic reports filed with the SEC that could cause the Company’s actual results to differ materially from the forward-looking statements that the Company makes. The Company may update that discussion in its period reports, but otherwise the Company undertakes no duty or obligation to update or revise these forward-looking statements, whether as a result of new information, future developments, or otherwise.
6
We hope you find this Supplemental Package beneficial. Any questions, comments or suggestions should be directed to: Shelly J. Doran, Vice President of Investor Relations-Simon Property Group, P.O. Box 7033, Indianapolis, IN 46207. Telephone: (317) 685-7330; e-mail: [email protected]
Reporting Calendar
Results for the next two quarters will be announced according to the following approximate schedule:
Simon Property Group Ownership Structure(1) June 30, 2007
SimonFamily (2)
Simon Property Group, Inc.223,398,016 shares
Simon Property Group, L.P.281,286,263 units
PublicStockholders
Other Executivesand Directors (5)
4,485,330 common shares;8,000 Class B commonshares (3)2.0%
223,398,016 units79.4%(sole general partner)
635,459 units0.2% (limited partner)
1,069,272 common shares0.5%
217,831,414 commonshares - 97.5%
34,564,455 units12.3%(limited partner)
OtherLimited Partners
22,688,333 units8.1% (limited partner)
4,000 Class Ccommon shares (4)
(1) Schedule excludes preferred stock (see "Preferred Stock/Units Outstanding") and units not convertible into common stock.
(2) Consists of Melvin Simon, Herbert Simon, David Simon, and/or trusts established for the benefit of members of the Simon family and Melvin Simon & Associates, Inc.
(3) Holders of Class B common stock are entitled to elect 4 of the 13 members of the Board of Directors and also have voting rights with common stock.
(4) An affiliate of one of the limited partners owns the Company's Class C common stock. Holders of Class C common stock are entitled to elect 2 of the 13 members of the Board of Directors and also have voting rights with common stock.
(5) Other executives includes directors and executive officers of Simon Property, other than Simon family members.
8
SIMON PROPERTY GROUP Changes in Common Shares and Unit Ownership
For the Period from December 31, 2006 through June 30, 2007
(1) Market value of Common Stock, Units and all issues of Preferred Stock of the Company.
10
On the next three pages, we present balance sheet and income statement data on a pro-rata basis reflecting the Company’s proportionate economic ownership of each asset in the Simon Group portfolio.
Basis of Presentation: The consolidated amounts shown are prepared on a consistent basis with the consolidated financial statements prepared by the Company. The Company’s Share of Joint Ventures column was derived on a property-by-property basis by applying the same percentage interests used to arrive at our share of net income during the period and applying them to all financial statement line items of each property. A similar calculation was performed for minority interests.
11
SIMON PROPERTY GROUP Unaudited Pro-Rata Statement of Operations For The Three Months Ended June 30, 2007
The Company’s The Company’s Total Minority Consolidated Share of Company’s Consolidated Interest Share Joint Ventures Share
SIMON PROPERTY GROUP Reconciliation of Net Income to NOI
As of June 30, 2007 (in thousands, except as noted)
Industry practice is to evaluate real estate properties on an unleveraged basis. Net Operating Income (“NOI”) is a standard industryperformance measure which is defined as operating income plus depreciation and amortization, both calculated in accordance with accounting principles generally accepted in the United States (“GAAP”). We consider NOI to be a key measure of our operating performance that is not specifically defined by GAAP. We believe that NOI is helpful to investors because it is a widely recognized measure of the performance of REITs and provides a relevant basis for comparison among REITs. We also use NOI internally to measure the operating performance of our portfolio.
However, you should understand that NOI:
• does not represent cash flow from operations as defined by GAAP,
• should not be considered as an alternative to net income determined in accordance with GAAP as a measure of operating performance,
• is not an alternative to cash flows as a measure of liquidity, and
• is not indicative of cash flows from operating, investing and financing activities.
The Reconciliation of Net Income to NOI provides net income, which we believe is the most directly comparable GAAP financial measure, and reconciles the amounts to “Total NOI of the Simon Group Portfolio.” This schedule also provides the increase in NOI of regional malls and Premium Outlet Centers that are comparable properties for the quarter and six months ended June 30, 2007.
(1) Includes $13.4 million and $25.2 million for the three and six months, respectively, of income from a mezzanine financing provided by the Company on February 13, 2007 in connection with the Mills acquisition.
(2) Includes $19 million related to two department store locations that are being redeveloped by the Company.
17
SIMON PROPERTY GROUP U.S. Portfolio GLA As of June 30, 2007
Total % of Type of Property GLA-Sq. Ft. Owned GLA Owned GLA Regional Malls
Leasing Activity During the Period(2): Average Base Rent(4) Amount of Change Lease Store Closings/ (Referred to as Signings Lease Expirations “Leasing Spread”)
(1) Does not include operational information for the additional 18 regional malls from the Mills portfolio in which the Company acquired an interest in on March 29, 2007.
(2) Includes mall and freestanding stores (3) Based upon the standard definition of sales for regional malls adopted by the International Council of
Shopping Centers which includes only mall and freestanding stores less than 10,000 square feet. (4) Represents the average base rent in effect during the period for those tenants who signed leases as
compared to the average base rent in effect during the period for those tenants whose leases terminated or expired.
19
SIMON PROPERTY GROUP U.S. Regional Mall Lease Expirations(1)(2)
As of June 30, 2007
Avg. Base Rent Number of Square per Square Foot
Year Leases Expiring Feet at 6/30/07 Mall Stores & Freestanding
(1) Does not include the additional 18 regional malls from the Mills portfolio in which the Company acquired an interest in on March 29, 2007.
(2) Includes space leased and owned by the anchor.
21
SIMON PROPERTY GROUP U.S. Regional Mall Anchor/Big Box Openings(1)
2007-2010
Property Name Location New Tenant Former Tenant Openings through June 30, 2007 Boynton Beach Mall Boynton Beach, FL Muvico Theater Macy’s Circle Centre Indianapolis, IN Carson Pirie Scott Parisian Eastland Mall Evansville, IN Dillard’s L.S. Ayres Firewheel Town Center Garland, TX Ethan Allen N/A Lakeline Mall Austin, TX Dillard’s Mervyn’s Orange Park Mall Jacksonville, FL Dick’s Sporting Goods N/A Smith Haven Mall Lake Grove, NY Dick’s Sporting Goods Stern’s Macy’s Furniture N/A South Shore Plaza Braintree, MA The Cheesecake Factory N/A Square One Mall Saugus, MA Dick’s Sporting Goods N/A
Openings Projected for the Remainder of 2007 Avenues, The Jacksonville, FL Belk Parisian Burlington Mall Burlington, MA Crate & Barrel N/A Castleton Square Indianapolis, IN AMC Theatres L.S. Ayres Borders L.S. Ayres Cordova Mall Pensacola, FL Belk Parisian Greenwood Park Mall Indianapolis, IN Barnes & Noble L.S. Ayres Gwinnett Place Duluth, GA Belk Parisian Lehigh Valley Mall Whitehall, PA Barnes & Noble N/A Bonefish Grill N/A Bravo N/A Lenox Square Atlanta, GA Neiman Marcus expansion N/A North East Mall Hurst, TX Dick’s Sporting Goods Saks Fifth AvenueNorthgate Mall Seattle, WA Barnes & Noble N/A Bed Bath & Beyond Gottschalks DSW Gottschalks Northshore Mall Peabody (Boston), MA The Cheesecake Factory N/A Phipps Plaza Atlanta, GA Belk Parisian Richmond Town Square Cleveland, OH Regal Cinema AMC Theatre River Oaks Mall Calumet City, IL Steve & Barry’s N/A Smith Haven Mall Lake Grove, NY California Pizza Kitchen Stern’s Barnes & Noble Stern’s South Ridge Mall Des Moines, IA Steve & Barry’s N/A Town Center at Boca
Raton Boca Raton, FL Crate & Barrel N/A
Town Center at Cobb Kennesaw, GA Belk Parisian Upper Valley Mall Springfield, OH MC Sports N/A Steve & Barry’s N/A Walt Whitman Mall Huntington Station, NY The Cheesecake Factory Organized Living West Town Mall Knoxville, TN Belk Parisian Westminster Mall Westminster, CA Target Macy’s Woodland Hills Mall Tulsa, OK The Cheesecake Factory N/A
22
SIMON PROPERTY GROUP U.S. Regional Mall Anchor/Big Box Openings(1)
2007-2010
Property Name Location New Tenant Former Tenant Openings Projected in 2008 Anderson Mall Anderson, SC Dillard’s Belk Mens Aventura Mall Miami Beach, FL Nordstrom Lord & Taylor Burlington Mall Burlington (Boston), MA Nordstrom Filene’s Crystal Mall Waterford, CT Bed Bath & Beyond Macy’s Christmas Tree Shop Macy’s Fashion Mall at Keystone Indianapolis, IN Nordstrom Parisian Firewheel Town Center Garland, TX Dick’s Sporting Goods N/A Lake Square Mall Leesburg, FL Best Buy N/A Livingston Mall Livingston, NJ Barnes & Noble N/A Markland Mall Kokomo, IN MC Sports N/A Montgomery Mall Montgomeryville, PA Dick’s Sporting Goods N/A Northlake Mall Atlanta, GA Kohl’s Parisian Richardson Square Richardson, TX Lowe’s N/A Ross Park Mall Pittsburgh, PA Nordstrom Macy’s Springfield Mall Springfield, PA Target Macy’s Valle Vista mall Harlingen, TX Circuit City OfficeMax West Ridge Mall Topeka, KS Burlington Montgomery WardWhite Oaks Mall Springfield, IL Barnes & Noble N/A
Openings Projected in 2009 Coddingtown Mall Santa Rosa, CA Whole Foods Ralph’s Grocery Northshore Mall Peabody (Boston), MA Nordstrom Macy’s Tacoma Mall Seattle, WA Nordstrom (relocated) Mervyn’s
Openings Projected in 2010 Quaker Bridge Mall Lawrenceville, NJ Neiman Marcus N/A Nordstrom N/A South Shore Plaza Braintree (Boston), MA Nordstrom Macy’s
(1) Does not include the additional 18 regional malls from the Mills portfolio in which the Company acquired an interest in on March 29, 2007.
SIMON PROPERTY GROUP U.S. Regional Mall Property Listing(1)
23
Gross Leasable Area Legal Mall &
Property Name State City (CBSA) Ownership Anchor Freestanding Total 1. McCain Mall AR N. Little Rock 100.0% 554,156 221,353 775,5092. University Mall AR Little Rock 100.0% 364,992 153,603 518,5953. Brea Mall CA Brea (Los Angeles) 100.0% 874,802 443,665 1,318,4674. Coddingtown Mall CA Santa Rosa 50.0% 547,090 265,402 812,4925. Fashion Valley Mall CA San Diego 50.0% 1,053,305 653,993 1,707,2986. Laguna Hills Mall CA Laguna Hills (Los Angeles) 100.0% 536,500 329,227 865,7277. Santa Rosa Plaza CA Santa Rosa 100.0% 428,258 270,468 698,7268. Shops at Mission Viejo,
The CA Mission Viejo (Los Angeles) 100.0% 677,215 472,775 1,149,990
9. Stanford Shopping Center CA Palo Alto (San Francisco) 100.0% 849,153 529,586 (7) 1,378,73910. Westminster Mall CA Westminster (Los Angeles) 100.0% 716,939 493,611 1,210,55011. Mesa Mall(2) CO Grand Junction 50.0% 441,208 443,015 884,22312. Town Center at Aurora CO Aurora (Denver) 100.0% 682,169 402,135 1,084,30413. Crystal Mall CT Waterford 74.6% 442,311 351,069 793,38014. Aventura Mall(2) FL Miami Beach 33.3% 1,116,938 662,246 1,779,18415. Avenues, The FL Jacksonville 25.0%(3) 754,956 363,011 1,117,96716. Boynton Beach Mall FL Boynton Beach (Miami-Fort Lauderdale) 100.0% 714,210 317,794 1,032,00417. Coconut Point FL Estero (Cape Coral-Fort Myers) 50.0% 503,819 498,411 1,002,23018. Coral Square FL Coral Springs (Miami-Fort Lauderdale) 97.2% 648,144 297,393 945,53719. Cordova Mall FL Pensacola 100.0% 395,875 451,265 847,14020. Crystal River Mall FL Crystal River 100.0% 302,495 121,964 424,45921. Dadeland Mall FL Miami 50.0% 1,132,072 338,170 1,470,24222. DeSoto Square FL Bradenton (Sarasota-Bradenton) 100.0% 435,467 243,092 678,55923. Edison Mall FL Fort Myers 100.0% 742,667 309,124 1,051,79124. Florida Mall, The FL Orlando 50.0% 1,232,465 617,083 1,849,54825. Gulf View Square FL Port Richey (Tampa-St. Pete) 100.0% 461,852 291,977 753,82926. Indian River Mall FL Vero Beach 50.0% 445,552 302,881 748,43327. Lake Square Mall FL Leesburg (Orlando) 50.0% 296,037 239,992 536,02928. Melbourne Square FL Melbourne 100.0% 416,167 294,482 710,64929. Miami International Mall FL Miami 47.8% 778,784 295,350 1,074,13430. Orange Park Mall FL Orange Park (Jacksonville) 100.0% 576,051 383,076 959,12731. Paddock Mall FL Ocala 100.0% 387,378 167,733 555,11132. Palm Beach Mall FL West Palm Beach (Miami-Fort
Lauderdale) 100.0% 749,288 335,073 1,084,361
33. Port Charlotte Town Center
FL Port Charlotte (Punta Gorda) 80.0%(4) 458,251 323,694 781,945
34. Seminole Towne Center FL Sanford (Orlando) 45.0%(3) 768,798 368,618 1,137,41635. Shops at Sunset Place, The FL S. Miami 37.5%(3) 0 510,056 510,05636. St. Johns Town Center FL Jacksonville 50.0% 653,291 379,230 1,032,52137. Town Center at Boca
38. Treasure Coast Square FL Jensen Beach 100.0% 511,372 350,830 862,20239. Tyrone Square FL St. Petersburg (Tampa-St. Pete) 100.0% 748,269 372,022 1,120,29140. University Mall FL Pensacola 100.0% 478,449 230,652 709,10141. Gwinnett Place GA Duluth (Atlanta) 75.0% 843,609 434,180 1,277,78942. Lenox Square GA Atlanta 100.0% 821,356 633,260 (7) 1,454,61643. Mall of Georgia GA Buford (Atlanta) 100.0% 1,069,590 723,888 1,793,47844. Northlake Mall GA Atlanta 100.0% 665,745 296,474 962,21945. Phipps Plaza GA Atlanta 100.0% 472,385 346,555 818,94046. Town Center at Cobb GA Kennesaw (Atlanta) 75.0% 866,381 406,082 1,272,46347. Lindale Mall(2) IA Cedar Rapids 50.0% 305,563 387,878 693,44148. NorthPark Mall IA Davenport 50.0% 650,456 422,921 1,073,377
SIMON PROPERTY GROUP U.S. Regional Mall Property Listing(1)
24
Gross Leasable Are Legal Mall &
Property Name State City (CBSA) Ownership Anchor Freestanding Total 49. Southern Hills Mall(2) IA Sioux City 50.0% 372,937 431,874 804,81150. SouthRidge Mall(2) IA Des Moines 50.0% 388,752 513,590 902,34251. Alton Square IL Alton (St. Louis) 100.0% 426,315 211,655 637,97052. Lincolnwood Town Center IL Lincolnwood (Chicago) 100.0% 220,830 201,085 421,91553. Northfield Square Mall IL Bourbonnais 31.6%(4) 310,994 246,540 557,53454. Northwoods Mall IL Peoria 100.0% 472,969 220,986 693,95555. Orland Square IL Orland Park (Chicago) 100.0% 773,295 437,867 1,211,16256. River Oaks Center IL Calumet City (Chicago) 100.0% 807,871 559,859 (7) 1,367,73057. SouthPark Mall IL Moline (Davenport - IA-Moline) 50.0% 578,056 447,509 1,025,56558. White Oaks Mall IL Springfield 77.5% 556,831 379,603 936,43459. Castleton Square IN Indianapolis 100.0% 908,481 410,175 1,318,65660. Circle Centre IN Indianapolis 14.7% 350,000 433,016 (7) 783,01661. College Mall IN Bloomington 100.0% 356,887 275,101 631,98862. Eastland Mall IN Evansville 50.0% 489,144 375,118 864,26263. Fashion Mall at Keystone IN Indianapolis 100.0% 249,721 434,399 (7) 684,12064. Greenwood Park Mall IN Greenwood (Indianapolis) 100.0% 754,928 409,314 1,164,24265. Lafayette Square IN Indianapolis 100.0% 937,223 269,835 1,207,05866. Markland Mall IN Kokomo 100.0% 273,094 141,969 415,06367. Muncie Mall IN Muncie 100.0% 435,756 204,728 640,48468. Tippecanoe Mall IN Lafayette 100.0% 537,790 322,553 860,34369. University Park Mall IN Mishawaka (South Bend) 100.0% 499,876 320,449 820,32570. Washington Square IN Indianapolis 100.0% 616,109 348,740 964,84971. Towne East Square KS Wichita 100.0% 779,490 351,080 1,130,57072. Towne West Square KS Wichita 100.0% 619,269 332,484 951,75373. West Ridge Mall KS Topeka 100.0% 716,811 281,378 998,18974. Prien Lake Mall LA Lake Charles 100.0% 644,124 177,528 821,65275. Arsenal Mall MA Watertown (Boston) 100.0% 191,395 309,982 (7) 501,37776. Atrium Mall MA Chestnut Hill (Boston) 49.1% 0 205,751 205,75177. Auburn Mall MA Auburn (Worcester) 49.1% 417,620 174,250 591,87078. Burlington Mall MA Burlington (Boston) 100.0% 642,411 423,627 1,066,03879. Cape Cod Mall MA Hyannis 49.1% 420,199 303,658 723,85780. Copley Place MA Boston 98.1% 150,847 1,090,921 (7) 1,241,76881. Emerald Square MA North Attleboro (Providence - RI New
Bedford) 49.1% 647,372 375,108 1,022,480
82. Greendale Mall MA Worcester (Boston) 49.1% 132,634 298,680 (7) 431,31483. Liberty Tree Mall MA Danvers (Boston) 49.1% 498,000 358,417 856,41784. Mall at Chestnut Hill MA Chestnut Hill (Boston) 47.2% 297,253 180,133 477,38685. Northshore Mall MA Peabody (Boston) 49.1% 677,433 680,176 1,357,60986. Solomon Pond Mall MA Marlborough (Boston) 49.1% 538,843 370,742 909,58587. South Shore Plaza MA Braintree (Boston) 100.0% 547,287 613,683 1,160,97088. Square One Mall MA Saugus (Boston) 49.1% 608,601 321,446 930,04789. Bowie Town Center MD Bowie (Washington, D.C.) 100.0% 355,557 328,589 684,14690. St. Charles Towne Center MD Waldorf (Washington, D.C.) 100.0% 631,602 350,903 982,50591. Bangor Mall ME Bangor 66.4%(6) 416,582 237,528 654,11092. Maplewood Mall MN Minneapolis 100.0% 588,822 341,893 930,71593. Miller Hill Mall MN Duluth 100.0% 429,508 379,427 808,93594. Battlefield Mall MO Springfield 100.0% 770,111 432,615 1,202,72695. Independence Center MO Independence (Kansas City) 100.0% 499,284 532,647 1,031,93196. SouthPark NC Charlotte 100.0% 1,044,742 566,219 1,610,961
25
SIMON PROPERTY GROUPU.S. Regional Mall Property Listing(1)
Gross Leasable Area Legal Mall & Property Name State City (CBSA) Ownership Anchor Freestanding Total
97. Crossroads Mall NE Omaha 100.0% 522,119 188,553 710,67298. Mall at Rockingham Park, The NH Salem (Boston) 24.6% 638,111 381,954 1,020,06599. Mall of New Hampshire, The NH Manchester 49.1% 444,889 362,861 807,750
100. Pheasant Lane Mall NH Nashua (Manchester) (5) 555,474 313,849 869,323101. Brunswick Square NJ East Brunswick
(New York) 100.0% 467,626 299,836 767,462
102. Livingston Mall NJ Livingston (New York) 100.0% 616,128 337,198 953,326103. Menlo Park Mall NJ Edison (New York) 100.0% 527,591 797,581 (7) 1,325,172104. Ocean County Mall NJ Toms River (New York) 100.0% 616,443 275,250 891,693105. Quaker Bridge Mall NJ Lawrenceville (Trenton) 38.0%(6) 686,760 413,189 1,099,949106. Rockaway Townsquare NJ Rockaway (New York) 100.0% 786,626 455,766 1,242,392107. Cottonwood Mall NM Albuquerque 100.0% 631,556 408,570 1,040,126108. Forum Shops at Caesars, The NV Las Vegas 100.0% 0 635,258 635,258109. Chautauqua Mall NY Lakewood (Jamestown) 100.0% 213,320 218,887 432,207110. Jefferson Valley Mall NY Yorktown Heights
(New York) 100.0% 310,095 277,860 587,955
111. Mall at The Source, The NY Westbury (New York) 25.5%(3) 210,798 515,098 725,896112. Nanuet Mall NY Nanuet (New York) 100.0% 583,711 331,394 915,105113. Roosevelt Field NY Garden City
(New York) 100.0% 1,430,425 779,730 (7) 2,210,155
114. Smith Haven Mall NY Lake Grove (New York) 25.0% 743,868 473,095 1,216,963115. Walt Whitman Mall NY Huntington Station
(New York) 100.0% 742,214 294,206 1,036,420
116. Westchester, The NY White Plains (New York)
40.0% 349,393 478,192 (7) 827,585
117. Great Lakes Mall OH Mentor (Cleveland) 100.0% 879,300 378,779 1,258,079118. Lima Mall OH Lima 100.0% 541,861 203,770 745,631119. Richmond Town Square OH Richmond Heights
(Cleveland) 100.0% 685,251 331,663 1,016,914
120. Southern Park Mall OH Boardman (Youngstown)
100.0% 811,858 383,769 1,195,627
121. Summit Mall OH Akron 100.0% 432,936 316,129 749,065122. Upper Valley Mall OH Springfield (Dayton-
Springfield) 100.0% 479,418 263,062 742,480
123. Penn Square Mall OK Oklahoma City 94.5% 588,137 461,698 1,049,835124. Woodland Hills Mall OK Tulsa 94.5% 706,159 382,178 1,088,337125. Century III Mall PA West Mifflin
(Pittsburgh) 100.0% 831,439 459,122 (7) 1,290,561
126. Granite Run Mall PA Media (Philadelphia) 50.0% 500,809 535,458 1,036,267127. King of Prussia Mall PA King of Prussia
128. Lehigh Valley Mall PA Whitehall (Allentown-Bethlehem)
37.6%(6) 564,353 482,967 (7) 1,047,320
129. Montgomery Mall PA North Wales (Philadelphia)
53.5%(6) 684,855 410,758 1,095,613
130. Oxford Valley Mall PA Langhorne (Philadelphia)
63.2%(6) 762,558 557,455 (7) 1,320,013
26
SIMON PROPERTY GROUPU.S. Regional Mall Property Listing(1)
Gross Leasable Area Legal Mall & Property Name State City (CBSA) Ownership Anchor Freestanding Total
131. Ross Park Mall PA Pittsburgh 100.0% 589,644 423,938 1,013,582132. South Hills Village PA Pittsburgh 100.0% 655,987 484,906 1,140,893133. Springfield Mall(2) PA Springfield
(Philadelphia) 38.0%(6) 367,176 221,489 588,665
134. Plaza Carolina PR Carolina (San Juan) 100.0% 504,796 609,185 (7) 1,113,981135. Anderson Mall SC Anderson (Greenville) 100.0% 404,394 179,745 584,139136. Haywood Mall SC Greenville 100.0% 902,400 328,344 1,230,744137. Empire Mall(2) SD Sioux Falls 50.0% 497,341 547,704 1,045,045138. Rushmore Mall(2) SD Rapid City 50.0% 470,660 363,218 833,878139. Knoxville Center TN Knoxville 100.0% 597,028 383,981 981,009140. Oak Court Mall TN Memphis 100.0% 532,817 313,926 (7) 846,743141. Raleigh Springs Mall TN Memphis 100.0% 691,230 225,965 917,195142. West Town Mall TN Knoxville 50.0% 878,311 451,156 1,329,467143. Wolfchase Galleria TN Memphis 94.5% 761,648 510,560 1,272,208144. Barton Creek Square TX Austin 100.0% 922,266 507,491 1,429,757145. Broadway Square TX Tyler 100.0% 427,730 201,898 629,628146. Cielo Vista Mall TX El Paso 100.0% 793,716 449,848 1,243,564147. Domain, The TX Austin 100.0% 220,000 411,866 (7) 631,866148. Firewheel Town Center TX Garland (Dallas-Forth
Worth) 100.0% 295,532 618,921 (7) 914,453
149. Galleria, The TX Houston 31.5% 1,233,802 1,114,583 2,348,385150. Highland Mall(2) TX Austin 50.0% 732,000 359,126 1,091,126151. Ingram Park Mall TX San Antonio 100.0% 750,888 376,351 1,127,239152. Irving Mall TX Irving (Dallas-Fort
Worth) 100.0% 637,415 406,696 1,044,111
153. La Plaza Mall TX McAllen 100.0% 776,397 427,071 1,203,468154. Lakeline Mall TX Cedar Park (Austin) 100.0% 745,179 339,359 1,084,538155. Longview Mall TX Longview 100.0% 402,843 209,321 612,164156. Midland Park Mall TX Midland 100.0% 339,113 279,405 618,518157. North East Mall TX Hurst (Dallas-Fort
Worth) 100.0% 1,094,589 452,473 1,547,062
158. Rolling Oaks Mall TX San Antonio 100.0% 596,308 285,809 882,117159. Sunland Park Mall TX El Paso 100.0% 575,837 342,163 918,000160. Valle Vista Mall TX Harlingen 100.0% 389,781 242,237 632,018161. Apple Blossom Mall VA Winchester 49.1% 229,011 213,778 442,789162. Charlottesville Fashion Square VA Charlottesville 100.0% 381,153 190,383 571,536163. Chesapeake Square VA Chesapeake (Virginia
Beach-Norfolk) 75.0%(4) 534,760 271,705 806,465
164. Fashion Centre at Pentagon City, The VA Arlington (Washington, DC)
42.5% 472,729 517,499 (7) 990,228
165. Valley Mall VA Harrisonburg 50.0% 315,078 190,679 505,757166. Virginia Center Commons VA Glen Allen (Richmond) 100.0% 506,639 280,960 787,599167. Columbia Center WA Kennewick 100.0% 408,052 367,130 775,182168. Northgate Mall WA Seattle 100.0% 612,073 291,487 903,560169. Tacoma Mall WA Tacoma (Seattle) 100.0% 924,045 406,992 1,331,037170. Bay Park Square WI Green Bay 100.0% 447,508 267,592 715,100171. Forest Mall WI Fond Du Lac 100.0% 327,260 172,476 499,736
Total Regional Mall GLA 100,277,827 65,564,872 165,842,699
27
FOOTNOTES:
(1) Does not include the additional 18 regional malls from the Mills portfolio in which the Company acquired an interest in on March 29, 2007.
(2) This Property is managed by a third party.
(3) The Operating Partnership’s direct and indirect interests in some of the Properties held as joint venture interests are subject to preferences on distributions in favor of other partners or the Operating Partnership.
(4) The Operating Partnership receives substantially all the economic benefit of the Property due to a preference, advance, or other partnership arrangement.
(5) The Operating Partnership owns a mortgage note that encumbers Pheasant Lane Mall that entitles it to 100% of the economics of this Property.
(6) The Operating Partnership’s indirect ownership interest is through an approximately 76% ownership interest in Kravco Simon Investments or an affiliate of Kravco Simon Investments.
(7) Mall & Freestanding GLA includes office space as follows: Arsenal Mall—105,807 sq. ft. Century III Mall—35,929 sq. ft. Circle Centre Mall—9,123 sq. ft. Copley Place—867,007 sq. ft. Fashion Centre at Pentagon City, The—169,089 sq. ft. Fashion Mall at Keystone, The—10,927 sq. ft. Firewheel Town Center—75,000 sq. ft. Greendale Mall—119,860 sq. ft. King of Prussia Mall—13,627 sq. ft. Lehigh Valley Mall—11,754 sq. ft. Lenox Square—2,674 sq. ft. Menlo Park Mall—50,482 sq. ft. Oak Court Mall—126,067 sq. ft. Oxford Valley Mall—111,160 sq. ft. Plaza Carolina—28,192 sq. ft. River Oaks Center—117,507 sq. ft. Roosevelt Field—1,610 sq. ft. Stanford Shopping Center—5,748 sq. ft. The Domain—92,955 sq. ft. The Westchester—820 sq. ft.
28
SIMON PROPERTY GROUP U.S. Premium Outlet Centers Operational Information
As of June 30, 2007
As of or for the Six Months Ended
June 30, 2007 2006
Total Number of U.S. Premium Outlet Centers . . . . . . . . . . 36 34Total U.S. Premium Outlet Centers GLA (in millions of
(2) Represents the average base rent for tenants who signed leases compared to the average base rent in effect for tenants whose leases terminated or expired in the same space.
29
SIMON PROPERTY GROUP U.S. Premium Outlet Centers Lease Expirations(1)
As of June 30, 2007
Weighted Avg. Base Rent Number of Square per Square Foot
(1) Does not include the 3 community centers from the Mills portfolio in which the Company acquired an interest in on March 29, 2007.
(2) For all owned gross leasable area.
(3) Represents the average base rent in effect during the period for those tenants who signed leases as compared to the average base rent in effect during the period for those tenants whose leases terminated or expired.
33
SIMON PROPERTY GROUP U.S. Community/Lifestyle Centers Lease Expirations(1)(2)
As of June 30, 2007
Avg. Base Rent Number of Square per Square Foot
Year Leases Expiring Feet at 6/30/07 Mall Stores & Freestanding
(1) Does not include the 3 community centers from the Mills portfolio in which the Company acquired an interest in on March 29, 2007.
(2) Includes space leased and owned by the anchor.
35
SIMON PROPERTY GROUP U.S. Community/Lifestyle Centers Property Listing(1)
Gross Leasable Area Legal Mall & Property Name State City (CBSA) Ownership Anchor Freestanding Total 1. Plaza at Buckland Hills, The CT Manchester (Hartford) 35.0%(3) 252,179 82,214 334,393
2. Gaitway Plaza FL Ocala 23.3%(3) 123,027 85,713 208,7403. Highland Lakes Center FL Orlando 100.0% 352,405 140,871 493,2764. Indian River Commons FL Vero Beach 50.0% 233,358 19,396 252,7545. Royal Eagle Plaza FL Coral Springs (Miami-Ft. Lauderale) 35.0%(3) 124,479 77,624 202,103
6. Terrace at the Florida Mall FL Orlando 100.0% 289,252 42,731 331,9837. Waterford Lakes Town Center FL Orlando 100.0% 622,244 329,446 951,6908. West Town Corners FL Altamonte Springs (Orlando) 23.3%(3) 263,782 121,477 385,2599. Westland Park Plaza FL Orange Park (Jacksonville) 23.3%(3) 123,548 39,606 163,154
10. Mall of Georgia Crossing GA Buford (Atlanta) 100.0% 341,503 99,109 440,612
11. Bloomingdale Court IL Bloomingdale (Chicago) 100.0% 467,513 162,846 630,35912. Countryside Plaza IL Countryside (Chicago) 100.0% 327,418 76,338 403,75613. Crystal Court IL Crystal Lake (Chicago) 35.0%(3) 201,993 76,977 278,97014. Forest Plaza IL Rockford 100.0% 324,794 100,584 425,37815. Lake Plaza IL Waukegan (Chicago) 100.0% 170,789 44,673 215,46216. Lake View Plaza IL Orland Park (Chicago) 100.0% 261,856 109,396 371,25217. Lincoln Crossing IL O’Fallon (St. Louis) 100.0% 229,820 13,446 243,26618. Matteson Plaza IL Matteson (Chicago) 100.0% 230,885 40,070 270,95519. North Ridge Plaza IL Joliet (Chicago) 100.0% 190,323 114,747 305,07020. White Oaks Plaza IL Springfield 100.0% 275,703 115,723 391,42621. Willow Knolls Court IL Peoria 35.0%(3) 341,328 41,049 382,377
22. Brightwood Plaza IN Indianapolis 100.0% 20,450 18,043 38,49323. Clay Terrace IN Carmel (Indianapolis) 50.0% 161,281 337,751 499,03224. Eastland Convenience Center IN Evansville 50.0% 161,849 13,790 175,63925. Greenwood Plus IN Greenwood (Indianapolis) 100.0% 134,141 21,178 155,31926. Griffith Park Plaza IN Griffith (Chicago) 100.0% 175,595 88,455 264,05027. Keystone Shoppes IN Indianapolis 100.0% 0 29,140 29,14028. Markland Plaza IN Kokomo 100.0% 49,051 41,476 90,52729. Muncie Plaza IN Muncie 100.0% 271,626 27,195 298,82130. New Castle Plaza IN New Castle 100.0% 24,912 66,736 91,64831. Northwood Plaza IN Fort Wayne 100.0% 136,404 71,841 208,24532. Teal Plaza IN Lafayette 100.0% 98,337 2,750 101,08733. Tippecanoe Plaza IN Lafayette 100.0% 85,811 4,711 90,52234. University Center IN Mishawaka (South Bend) 100.0% 104,347 46,177 150,52435. Village Park Plaza IN Carmel (Indianapolis) 35.0%(3) 414,593 134,956 549,54936. Washington Plaza IN Indianapolis 100.0% 21,500 28,607 50,107
37. West Ridge Plaza KS Topeka 100.0% 182,161 71,459 253,620
38. Park Plaza KY Hopkinsville 100.0% 82,398 32,526 114,924
39. St. Charles Towne Plaza MD Waldorf (Washington, D.C.) 100.0% 286,306 108,690 394,996
40. Regency Plaza MO St. Charles (St. Louis) 100.0% 235,642 51,831 287,473
41. Ridgewood Court MS Jackson 35.0%(3) 185,939 54,732 240,671
42. Dare Centre NC Kill Devil Hills 100.0% 127,172 41,391 168,56343. MacGregor Village NC Cary (Raleigh) 100.0% 0 144,119 144,11944. North Ridge Shopping Center NC Raleigh 100.0% 43,247 123,308 166,555
45. Rockaway Convenience Center NJ Rockaway (New York) 100.0% 99,556 49,355 148,91146. Rockaway Plaza NJ Rockaway (New York) 100.0% 407,501 51,316 458,817
47. Cobblestone Court NY Victor (Rochester) 35.0%(3) 206,680 58,781 265,461
36
SIMON PROPERTY GROUP U.S. Community/Lifestyle Centers Property Listing(1)
Gross Leasable Area Legal Mall & Property Name State City (CBSA) Ownership Anchor Freestanding Total 48. Boardman Plaza OH Youngstown 100.0% 408,007 198,231 606,23849. Great Lakes Plaza OH Mentor (Cleveland) 100.0% 159,194 4,910 164,10450. Lima Center OH Lima 100.0% 189,584 47,294 236,878
51. Eastland Plaza OK Tulsa 100.0% 152,451 33,623 186,074
52. DeKalb Plaza PA King of Prussia (Philadelphia) 50.3%(4) 81,368 20,374 101,74253. Henderson Square PA King of Prussia (Philadelphia) 76.0%(4) 72,683 34,690 107,37354. Lincoln Plaza PA King of Prussia (Philadelphia) 63.2%(4) 251,224 16,007 267,23155. Whitehall Mall PA Whitehall 38.0%(4) 493,475 94,609 588,084
56. Charles Towne Square SC Charleston 100.0% 71,794 0 71,794
59. Arboretum at Great Hills TX Austin 100.0% 35,773 167,446 203,21960. Gateway Shopping Centers TX Austin 95.0% 396,494 115,781 512,27561. Ingram Plaza TX San Antonio 100.0% 52,231 59,287 111,51862. Lakeline Plaza TX Cedar Park (Austin) 100.0% 307,966 79,497 387,46363. Shops at Arbor Walk, The TX Austin 100.0% 181,857 231,652 413,50964. Shops at North East Mall, The TX Hurst (Dallas-Ft. Worth) 100.0% 265,595 99,148 364,74365. Wolf Ranch TX Georgetown (Austin) 100.0% 395,071 218,908 613,979
66. Chesapeake Center VA Chesapeake (Virginia Beach-Norfolk) 100.0% 213,651 92,284 305,93567. Fairfax Court VA Fairfax (Washington, D.C.) 26.3%(3) 169,043 80,615 249,65868. Martinsville Plaza VA Martinsville 100.0% 88,470 13,635 102,105
Total Community/Lifestyle Center GLA 13,897,281 5,293,430 19,190,711
FOOTNOTES:(1) Does not include the 3 community centers from the Mills portfolio in which the Company acquired an interest in on March 29, 2007.
(2) This Property is managed by a third party.
(3) Outside partner receives substantially all of the economic benefit due to a partner preference.
(4) The Operating Partnership’s indirect ownership interest is through an approximately 76% ownership interest in Kravco Simon Investments.
37
SIMON PROPERTY GROUP International Operational Information(1)
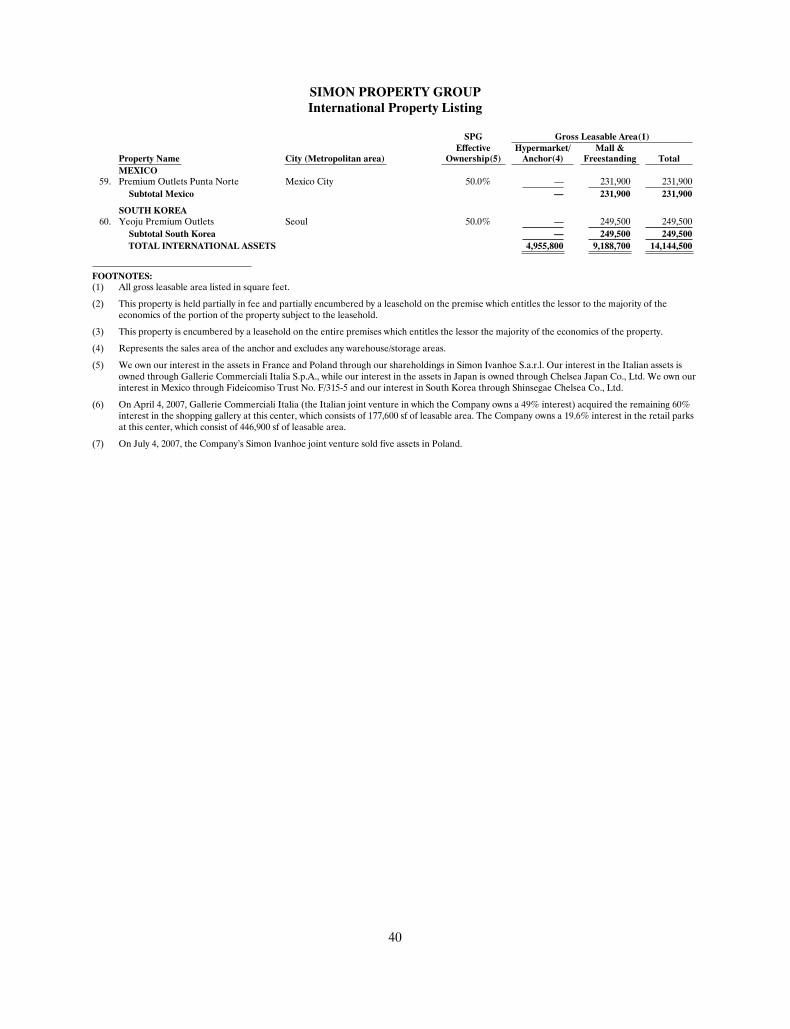
SIMON PROPERTY GROUP International Property Listing
SPG Gross Leasable Area(1) Effective Hypermarket/ Mall & Property Name City (Metropolitan area) Ownership(5) Anchor(4) Freestanding Total
MEXICO 59. Premium Outlets Punta Norte Mexico City 50.0% — 231,900 231,900
Subtotal Mexico — 231,900 231,900
SOUTH KOREA 60. Yeoju Premium Outlets Seoul 50.0% — 249,500 249,500
Subtotal South Korea — 249,500 249,500 TOTAL INTERNATIONAL ASSETS 4,955,800 9,188,700 14,144,500
FOOTNOTES: (1) All gross leasable area listed in square feet.
(2) This property is held partially in fee and partially encumbered by a leasehold on the premise which entitles the lessor to the majority of the economics of the portion of the property subject to the leasehold.
(3) This property is encumbered by a leasehold on the entire premises which entitles the lessor the majority of the economics of the property.
(4) Represents the sales area of the anchor and excludes any warehouse/storage areas.
(5) We own our interest in the assets in France and Poland through our shareholdings in Simon Ivanhoe S.a.r.l. Our interest in the Italian assets is owned through Gallerie Commerciali Italia S.p.A., while our interest in the assets in Japan is owned through Chelsea Japan Co., Ltd. We own our interest in Mexico through Fideicomiso Trust No. F/315-5 and our interest in South Korea through Shinsegae Chelsea Co., Ltd.
(6) On April 4, 2007, Gallerie Commerciali Italia (the Italian joint venture in which the Company owns a 49% interest) acquired the remaining 60% interest in the shopping gallery at this center, which consists of 177,600 sf of leasable area. The Company owns a 19.6% interest in the retail parks at this center, which consist of 446,900 sf of leasable area.
(7) On July 4, 2007, the Company’s Simon Ivanhoe joint venture sold five assets in Poland.
41
SIMON PROPERTY GROUP Mills Property Listing
Total Gross Property Name State City (CBSA) Leasable Area
The Mills® 1. Arizona Mills AZ Tempe (Phoenix) 1,228,770 2. Arundel Mills MD Hanover (Baltimore) 1,283,074 3. Cincinnati Mills OH Cincinnati 1,442,399 4. Colorado Mills CO Lakewood (Denver) 1,097,466 5. Concord Mills NC Concord (Charlotte) 1,288,901 6. Discover Mills GA Lawrenceville (Atlanta) 1,191,924 7. Franklin Mills PA Philadelphia 1,722,954 8. Grapevine Mills TX Grapevine (Dallas-Ft. Worth) 1,619,900 9. Great Mall of the Bay Area CA Milpitas (Silicon Valley) 1,284,629
10. Gurnee Mills IL Gurnee (Chicago) 1,817,042 11. Katy Mills TX Katy (Houston) 1,245,070 12. Ontario Mills CA Ontario (Los Angeles) 1,488,466 13. Opry Mills TN Nashville 1,153,588 14. Potomac Mills VA Prince William (Washington, D.C.) 1,418,085 15. Sawgrass Mills FL Sunrise (Ft. Lauderdale) 2,285,479 16. St. Louis Mills MO Hazelwood (St. Louis) 1,085,393 17. The Block at Orange CA Orange (Los Angeles) 702,721
Subtotal The Mills® 23,355,861
Regional Malls 18. Briarwood Mall MI Ann Arbor 1,013,591 19. Broward Mall FL Plantation (Ft. Lauderdale) 994,838 20. Del Amo Fashion Center CA Torrance (Los Angeles) 2,370,027 21. Dover Mall DE Dover (Wilmington) 886,881 22. Galleria at White Plains NY White Plains 871,544 23. Gwinnett Place(1) GA Duluth (Atlanta) 1,277,789 24. Hilltop Mall CA Richmond 1,129,679 25. Lakeforest Mall MD Gaithersburg 1,069,119 26. Marley Station MD Glen Burnie 1,066,897 27. Meadwood Mall NV Reno 887,550 28. Northpark Mall MS Ridgeland (Jackson) 958,320 29. Riverside Square NJ Hackensack 764,950 30. Southdale Center MN Edina (Minneapolis) 1,336,725 31. Southridge Mall WI Greendale (Milwaukee) 1,227,007 32. Stoneridge Mall CA Pleasanton 1,301,027 33. The Esplanade LA Kenner (New Orleans) 901,213 34. The Falls FL Miami 812,741 35. Town Center at Cobb(1) GA Kennesaw (Atlanta) 1,272,463 36. Tuttle Crossing OH Dublin (Columbus) 1,127,897 37. Westland Mall FL Hialeah (Miami) 833,795
Subtotal Regional Malls 22,104,053
Community Centers 38. Arundel Mills Marketplace MD Hanover (Baltimore) 101,613 39. Concord Mills Marketplace NC Concord (Charlotte) 230,683 40. Liberty Plaza PA Philadelphia 371,467
Subtotal Community Centers 703,763
Total Mills Properties 46,163,677
(1) Prior to the closing of the tender offer on March 29, 2007, the Company held a 50% interest in this asset.
42
SIMON PROPERTY GROUP Capital Expenditures in the U.S. Portfolio(1)
For the Six Months Ended June 30, 2007 (In thousands)
Unconsolidated
Entities Simon Consolidated Group’s Properties Total Share
(1) Does not include the Mills portfolio in which the Company acquired an interest in on March 29, 2007.
(2) Expenditure included in the pool of expenses allocated to tenants as common area maintenance or CAM.
(3) Agrees with the line item “Capital expenditures” on the Combined Statements of Cash Flows for the consolidated properties. No statement of cash flows is prepared for the joint venture properties as this is not required by the SEC or GAAP; however, the above reconciliation was completed in the same manner as the reconciliation for the consolidated properties.
43
SIM
ON
PR
OP
ER
TY
GR
OU
P
U.S
. Dev
elop
men
t Act
ivit
y R
epor
t(1)
(2)
Pro
ject
Ove
rvie
w, C
onst
ruct
ion-
in-P
rogr
ess
and
Lan
d H
eld
for
Dev
elop
men
t A
s of
Jun
e 30
, 200
7
C
onst
ruct
ion-
in-P
rogr
ess
T
he
Com
pany
’s
P
roje
cted
Pro
ject
ed
The
C
ompa
ny’s
St
abil
ized
U
ncon
solid
ated
E
ntit
ies
O
wne
rshi
p P
roje
cted
G
ross
Cos
t(3)
N
et C
ost
Shar
e of
R
ate
of
Con
solid
ated
T
he C
ompa
ny’s
Pro
pert
y/ L
ocat
ion
P
roje
ct D
escr
ipti
on
Per
cent
age
Ope
ning
(i
n m
illio
ns)
(in
mill
ions
)N
et C
ost
Ret
urn
Pro
pert
ies
Tot
al
Shar
e N
ew D
evel
opm
ent P
roje
cts:
Ham
ilton
Tow
n C
ente
r N
oble
svill
e (I
ndia
napo
lis),
IN
95
0,00
0 sq
uare
foot
cen
ter
wit
h a
tow
n ce
nter
com
pone
nt
anch
ored
by
Ham
ilton
16
The
atre
(w
ith I
MA
X),
Bor
ders
B
ooks
& M
usic
, Dic
k’s
Spor
ting
Goo
ds a
nd O
ld N
avy
and
com
mun
ity c
ente
r co
mpo
nent
s a
ncho
red
by J
CP
enne
y, B
ed
Bat
h &
Bey
ond,
DSW
and
Ulta
50%
5/08
$ 1
26
$
118
$ 59
10%
—
$
25.6
$ 12
.8
Hou
ston
Pre
miu
m O
utle
ts
Hou
ston
, TX
43
3,00
0 sq
uare
foot
ups
cale
out
let c
ente
r
100%
5/08
$ 1
35
$
96
$
96
15
%
$
38.5
—
—
Pal
ms
Cro
ssin
g M
cAlle
n, T
X
396,
000
squa
re fo
ot c
omm
unity
cen
ter
anch
ored
by
Bea
ll’s,
D
SW, B
arne
s &
Nob
le, B
abie
s “R
” U
s, S
port
s A
utho
rity
, U
lta, G
uita
r C
ente
r an
d C
aven
dar’
s B
oot C
ity
100%
11/0
7
$
76
$
65
$
65
8%
$ 34
.2
—
—
Phi
lade
lphi
a P
rem
ium
Out
lets
L
imer
ick,
PA
42
5,00
0 sq
uare
foot
ups
cale
out
let c
ente
r
100%
11/0
7
$ 1
19
$
119
$ 11
9
12
%
$
80.4
—
—
Pie
r P
ark
Pan
ama
Cit
y B
each
, FL
92
0,00
0 sq
uare
foot
hyb
rid
com
mun
ity/li
fest
yle
cent
er
anch
ored
by
Tar
get,
Dill
ard’
s, J
CPe
nney
, Gra
nd 1
6 T
heat
re,
Bor
ders
Boo
ks &
Mus
ic, O
ld N
avy,
Ron
Jon
Sur
f Sho
p,
The
Fre
sh M
arke
t and
Jim
my
Buf
fett
’s M
arga
rita
ville
100%
10/0
6 (T
arge
t)5/
07 (
The
ater
)3/
08 (
All
othe
r)
$
155
$ 12
7
$
127
9%
$
64.6
—
—
Sign
ifica
nt R
edev
elop
men
t Pro
ject
s w
ith I
ncre
men
tal G
LA
Ave
ntur
a M
all
N. M
iam
i Bea
ch, F
L
Add
ition
of N
ords
trom
in fo
rmer
Lor
d &
Tay
lor
build
ing;
ad
ditio
n of
sm
all s
hops
and
par
king
dec
k
33
%
3/
08
$
124
$ 12
4
$
41
8%
—
$
17.2
$ 5.
7
Bur
lingt
on M
all
Bur
lingt
on (
Bos
ton)
, MA
A
cqui
sitio
n of
form
er F
ilene
’s b
uild
ing
and
addi
tion
of
Nor
dstr
om a
nd s
mal
l sho
ps; C
rate
& B
arre
l rel
ocat
ion
10
0%
8/
07
(Cra
te &
B
arre
l)3/
08(N
ords
trom
&sh
ops)
$
78
$ 78
$ 78
11%
$ 53
.1
—
—
Cas
tlet
on S
quar
e In
dian
apol
is, I
N
Acq
uisi
tion
of fo
rmer
L.S
. Ayr
es b
uild
ing
and
addi
tion
of
lifes
tyle
com
pone
nt w
ith
AM
C T
heat
res
and
Bor
ders
100%
11/0
7
$
42
$
42
$
42
8%
$ 15
.9
—
—
Gre
enw
ood
Par
k M
all
Gre
enw
ood
(Ind
iana
polis
), I
N
Acq
uisi
tion
of fo
rmer
L.S
. Ayr
es b
uild
ing
and
addi
tion
of
lifes
tyle
com
pone
nt w
ith B
arne
s &
Nob
le a
nd s
mal
l sho
ps,
The
Che
esec
ake
Fac
tory
, Stir
Cra
zy, a
nd B
.J.’s
Bre
who
use
100%
11/0
7
$
42
$
42
$
42
7%
$ 16
.0
—
—
Las
Veg
as P
rem
ium
Out
lets
—
Pha
se I
I L
as V
egas
, NV
104,
000
squa
re fo
ot e
xpan
sion
of u
psca
le o
utle
t cen
ter,
in
clud
ing
the
addi
tion
of tw
o fiv
e-le
vel p
arki
ng g
arag
es
100%
12/0
7
$
59
$
56
$
56
13
%
$
31.1
—
—
Leh
igh
Val
ley
Mal
l W
hite
hall,
PA
A
dditi
on o
f a li
fest
yle
com
pone
nt c
onsi
stin
g of
Bar
nes
&
Nob
le, P
otte
ry B
arn,
Will
iam
s-So
nom
a, B
onef
ish
Gri
ll an
d B
ravo
; inc
lude
s re
nova
tion
and
add
ition
of o
utlo
ts
38%
10/0
7
$
45
$
44
$
16
9%
—
$
24.3
$ 9.
1
Len
ox S
quar
e A
tlan
ta, G
A
Nei
man
Mar
cus
expa
nsio
n; a
dditi
on o
f sec
ond
leve
l of s
mal
l sh
ops
and
reno
vatio
n of
the
atri
um a
rea
10
0%
7/
07
(Nei
man
exp
an)
10/0
7(s
mal
l sho
ps)
$
53
$ 46
$ 46
8%
$
32.8
—
—
44
SIM
ON
PR
OP
ER
TY
GR
OU
P
U.S
. Dev
elop
men
t Act
ivit
y R
epor
t(1)
(2)
Pro
ject
Ove
rvie
w, C
onst
ruct
ion-
in-P
rogr
ess
and
Lan
d H
eld
for
Dev
elop
men
t A
s of
Jun
e 30
, 200
7 C
onst
ruct
ion-
in-P
rogr
ess
The
Com
pany
’sP
roje
cted
P
roje
cted
T
heC
ompa
ny’s
Stab
iliz
edU
ncon
solid
ated
E
ntit
ies
Ow
ners
hip
Pro
ject
ed
Gro
ss C
ost(
3)N
et C
ost
Shar
e of
R
ate
of
Con
solid
ated
The
Com
pany
’sP
rope
rty/
Loc
atio
n P
roje
ct D
escr
ipti
on
Per
cent
age
Ope
ning
(i
n m
illio
ns)
(in
mill
ions
)N
et C
ost
Ret
urn
Pro
pert
ies
Tot
al
Shar
eSi
gnifi
cant
Red
evel
opm
ent P
roje
cts
with
Inc
rem
enta
l GL
A
Nor
thga
te M
all
Seat
tle,
WA
A
ddit
ion
of B
arne
s &
Nob
le, P
aner
a B
read
, Mac
aron
i Gri
ll,
Stan
ford
’s S
teak
Hou
se a
nd G
ene
Juar
ez S
pa in
a li
fest
yle
com
pone
nt; c
reat
ion
of tw
o ou
tpar
cels
100%
9/07
$
49
$ 44
$ 44
8%
$ 40
.5—
—
Nor
thsh
ore
Mal
l P
eabo
dy (
Bos
ton)
, MA
A
dditi
on o
f Nor
dstr
om a
nd s
mal
l sho
ps, T
he C
hees
ecak
e F
acto
ry, P
.F. C
hang
’s, a
nd m
all r
enov
atio
n 49
%11
/07
(C
hees
ecak
e)6/
08 (
P.F
. Cha
ng’s
)11
/08
(sh
ops/
reno
v)4/
09 (
Nor
dstr
om)
$ 11
3 $
113
$ 55
7%
—$
2.0
$ 1.
0
Orl
ando
Pre
miu
m
Out
lets
—P
hase
II
Orl
ando
, FL
144,
000
squa
re fo
ot e
xpan
sion
of u
psca
le o
utle
t cen
ter,
in
clud
ing
the
addi
tion
of a
four
-leve
l par
king
gar
age
100%
11/0
8 $
69
$ 69
$ 69
15%
$ 25
.2—
—
Rio
Gra
nde
Val
ley
Pre
miu
m O
utle
ts —
Pha
se I
I M
erce
des,
TX
144,
000
squa
re fo
ot e
xpan
sion
of u
psca
le o
utle
t cen
ter
100%
Spri
ng 2
008
$ 27
$
23$
2318
%$
0.4
——
Ros
s P
ark
Mal
l P
itts
burg
h, P
A
Add
ition
of N
ords
trom
and
sm
all s
hops
10
0%10
/08
$ 32
$
25$
258
%$
3.6
——
St. J
ohns
Tow
n C
ente
r—P
hase
II
Jack
sonv
ille
, FL
19
2,00
0 sq
uare
foot
ups
cale
exp
ansi
on in
clud
ing
the
addi
tion
of a
res
taur
ant c
lust
er w
ith M
itche
ll’s
Fis
h M
arke
t, J.
A
lexa
nder
s, C
antin
a L
ared
o an
d T
he C
apita
l Gri
lle
50%
10/0
7 $
79
$ 76
$ 38
10%
—$
42.1
$ 21
.0
Tac
oma
Mal
l T
acom
a (S
eatt
le),
WA
R
eloc
atio
n of
Nor
dstr
om a
nd tw
o-ph
ase
lifes
tyle
add
ition
10
0%5/
08 (
Phas
e I)
20
09 (
Nor
dstr
om &
Phas
e II
)
$ 77
$
77$
778
%$
4.0
——
Tow
n C
ente
r at
Boc
a R
aton
B
oca
Rat
on, F
L
Life
styl
e ad
ditio
n an
chor
ed b
y C
rate
& B
arre
l 10
0%11
/07
$ 70
$
64$
6479
%$
20.9
——
Uni
vers
ity
Par
k M
all
Mis
haw
aka
(Sou
th B
end)
, IN
D
emol
ition
of f
orm
er M
arsh
all F
ield
’s a
nd r
epla
cem
ent w
ith
lifes
tyle
add
ition
incl
udin
g B
arne
s &
Nob
le, U
lta,
Gra
nite
C
ity F
ood
& B
rew
ery,
Bar
Lou
ie a
nd P
arad
iseC
afé
100%
6/08
$
45
$ 45
$ 45
6%
$ 8.
8—
—
Oth
er R
edev
elop
men
t Pro
ject
s w
ith I
ncre
men
tal G
LA
C
olle
ge M
all
Blo
omin
gton
, IN
A
dditi
on o
f foo
d co
urt a
nd D
ress
Bar
n 10
0%11
/07
Lak
elin
e M
all
Aus
tin,
TX
R
econ
figur
atio
n of
cen
ter
cour
t, ad
d or
exp
and
tena
nt
spac
es
100%
12/0
7
Liv
ings
ton
Mal
l L
ivin
gsto
n, N
J A
ddit
ion
of B
arne
s &
Nob
le, e
xpan
sion
of M
odel
l’s a
nd fo
od
cour
t add
ition
10
0%8/
08
Ric
hard
son
Squa
re
Ric
hard
son,
TX
R
edev
elop
men
t of e
xist
ing
mal
l int
o co
mm
unity
cen
ter
with
th
e ad
ditio
n of
Low
e’s
Hom
e Im
prov
emen
t 10
0%5/
08
Sum
mit
Mal
l A
kron
, OH
A
dditi
on o
f life
styl
e co
mpo
nent
10
0%4/
08
Subt
otal
Oth
er R
edev
elop
men
t P
roje
cts
wit
h In
crem
enta
l G
LA
$
64
$ 64
$ 64
7%
$ 8.
4—
—
Ren
ovat
ions
T
he F
orum
Sho
ps a
t Cae
sars
L
as V
egas
, NV
M
all r
enov
atio
n 10
0%12
/07
Roc
kaw
ay T
owns
quar
e R
ocka
way
(N
ew Y
ork)
, NY
M
all r
enov
atio
n 10
0%7/
08
St. C
harl
es T
owne
Cen
ter
Wal
dorf
(W
ashi
ngto
n, D
.C.)
, MD
M
all r
enov
atio
n 10
0%2/
08
Subt
otal
Ren
ovat
ions
$
49
$ 49
$ 49
3%
$ 5.
0—
—
45
SIM
ON
PR
OP
ER
TY
GR
OU
P
U.S
. Dev
elop
men
t Act
ivit
y R
epor
t(1)
(2)
Pro
ject
Ove
rvie
w, C
onst
ruct
ion-
in-P
rogr
ess
and
Lan
d H
eld
for
Dev
elop
men
t A
s of
Jun
e 30
, 200
7
C
onst
ruct
ion-
in-P
rogr
ess
T
he
Com
pany
’s
Pro
ject
ed
Pro
ject
ed
The
C
ompa
ny’s
Stab
iliz
ed
Unc
onso
lidat
ed
Ent
itie
s
Ow
ners
hip
Pro
ject
edG
ross
Cos
t(3)
Net
Cos
t Sh
are
of
Rat
e of
C
onso
lida
ted
T
he C
ompa
ny’s
Pro
pert
y/ L
ocat
ion
P
roje
ct D
escr
ipti
on
Per
cent
age
Ope
ning
(i
n m
illio
ns)
(in
mill
ions
)N
et C
ost
Ret
urn
Pro
pert
ies
Tot
alSh
are
Anc
hor/
Big
Box
/The
ater
Act
ivity
And
erso
n M
all
A
dditi
on o
f Dill
ard’
s an
d ex
pans
ion
of B
elk
10
0%
10
/08
And
erso
n, S
C
Cry
stal
Mal
l W
ater
ford
, CT
A
dditi
on o
f Bed
Bat
h &
Bey
ond
and
Chr
istm
as T
ree
Shop
75
%5/
08
F
irew
heel
Tow
n C
ente
r
Add
ition
of D
ick’
s Sp
ortin
g G
oods
100%
5/08
G
arla
nd, T
X
Mon
tgom
ery
Mal
l
Add
ition
of D
ick’
s Sp
ortin
g G
oods
54%
4/08
N
orth
Wal
es (
Phi
lade
lphi
a), P
A
Nor
th E
ast M
all
Hur
st, T
X
Add
ition
of D
ick’
s Sp
ortin
g G
oods
10
0%11
/07
Nor
thga
te M
all
A
dditi
on o
f Bed
Bat
h &
Bey
ond
and
DSW
100%
12/0
7
Se
attl
e, W
A
Nor
thsh
ore
Mal
l P
eabo
dy (
Bos
ton)
, MA
E
xpan
sion
of F
ilene
’s B
asem
ent
49%
11/0
7
Wes
t Rid
ge M
all
Top
eka,
KS
A
dditi
on o
f Bur
lingt
on C
oat F
acto
ry
100%
10/0
7
Woo
dlan
d H
ills
Mal
l
Add
ition
of T
he C
hees
ecak
e F
acto
ry
95
%
8/
07
Tul
sa, O
K
Subt
otal
Anc
hor/
Big
Box
/The
ater
Act
ivit
y
$
82
$
70
$ 60
9%
$ 31
.7
$ 5.
7 $
4.8
Ass
et I
nten
sific
atio
n
C
astl
eton
Squ
are
Se
lf-st
orag
e
50%
10/0
7
In
dian
apol
is, I
N
Fir
ewhe
el T
own
Cen
ter
R
esid
enti
al
50
%
7/
07
Gar
land
, TX
In
gram
Par
k M
all
Se
lf-st
orag
e
50%
12/0
7
Sa
n A
nton
io, T
X
Rol
ling
Oak
s M
all
Se
lf-st
orag
e
50%
12/0
7
Sa
n A
nton
io, T
X
Vill
age
at S
outh
Par
k, T
he C
harl
otte
, NC
Res
iden
tial
40%
7/07
Su
btot
al A
sset
Int
ensi
fica
tion
$ 1
09
$
102
$
39
8%
—
$
66.8
$
28.6
Mis
cella
neou
s
$ 21
.9
$
46.5
$
12.6
Tot
al C
onst
ruct
ion
in P
rogr
ess(
4)
$ 53
7.0
$
230.
2 $
95.6
Lan
d H
eld
for
Dev
elop
men
t
$
67.9
$
380.
7 $
161.
0
(1)
Doe
s no
t inc
lude
the
Mill
s po
rtfo
lio in
whi
ch th
e C
ompa
ny a
cqui
red
an in
tere
st in
on
Mar
ch 2
9, 2
007.
(2)
Cos
t and
ret
urn
are
base
d up
on c
urre
nt b
udge
t ass
umpt
ions
. Act
ual r
esul
ts m
ay v
ary.
(3)
Pro
ject
ed G
ross
Cos
t inc
lude
s so
ft c
osts
suc
h as
arc
hite
ctur
e an
d en
gine
erin
g fe
es, t
enan
t cos
ts (
allo
wan
ces/
leas
ing
com
mis
sion
s), d
evel
opm
ent,
lega
l and
oth
er fe
es, m
arke
ting
cost
s, c
ost o
f cap
ital,
and
othe
r re
late
d co
sts.
(4)
Doe
s no
t inc
lude
the
Com
pany
’s in
tern
atio
nal p
rope
rtie
s.
46
SIM
ON
PR
OP
ER
TY
GR
OU
P
Inte
rnat
iona
l Dev
elop
men
t Act
ivit
y R
epor
t*
Pro
ject
Ove
rvie
w, C
onst
ruct
ion-
in-P
rogr
ess
As
of J
une
30, 2
007
The
Com
pany
’s
Ow
ners
hip
P
roje
cted
Sho
ppin
g ce
nter
/
Per
cent
age
N
et C
ost*
Loc
atio
n (M
etro
poli
tan
area
)
Pro
ject
Des
crip
tion
A
ncho
rs/ M
ajor
Ten
ants
of
Pro
ject
O
peni
ng
(in
mil
lion
s)
New
Dev
elop
men
t Pro
ject
s:
Eur
ope:
Arg
ine—
Nap
oli,
Ital
y 30
0,00
0 sq
uare
foot
cen
ter
anch
ored
by
a
hype
rmar
ket w
ith a
ppro
xim
atel
y 75
sho
ps
A
ucha
n 24
.0%
D
ecem
ber
2008
€
64
Cin
isel
lo—
Mila
no, I
taly
40
0,00
0 sq
uare
foot
cen
ter
anch
ored
by
a
hype
rmar
ket w
ith a
ppro
xim
atel
y 10
0 sh
ops
Auc
han
49.0
%
Sept
embe
r 20
07
€
129
Nol
a—N
apol
i, It
aly
1.0
mill
ion
squa
re fo
ot c
ente
r in
clud
ing
a
hype
rmar
ket a
nd d
epar
tmen
t sto
re
Auc
han,
Coi
n, H
olid
ay I
nn, M
edia
W
orld
22
.1%
N
ovem
ber
2007
€
165
(1)
Por
ta d
i Rom
a—R
oma,
Ita
ly
1.3
mill
ion
squa
re fo
ot c
ente
r in
clud
ing
a hy
perm
arke
t, de
part
men
t sto
re a
nd d
o-it-
your
self
cent
ers
Auc
han,
Ler
oy M
erlin
, UG
C T
heat
res,
Ik
ea (
open
ed 6
/05)
, Med
ia W
orld
, D
ecat
hlon
19.6
%
July
200
7
€
235
Asi
a:
Cha
ngsh
u, C
hina
47
0,00
0 sq
uare
foot
cen
ter
anch
ored
by
a
hype
rmar
ket w
ith a
ppro
xim
atel
y 14
0 sh
ops
Wal
-Mar
t, F
orev
er 2
1, S
epho
ra,
Star
buck
s, V
ero
Mod
a, S
port
100
32
.5%
M
arch
200
8 C
NY
527
Han
gzho
u, C
hina
30
0,00
0 sq
uare
foot
cen
ter
anch
ored
by
a
hype
rmar
ket w
ith a
ppro
xim
atel
y 85
sho
ps
Wal
-Mar
t, F
orev
er 2
1, S
epho
ra,
Ver
o M
oda
32.5
%
Win
ter
(Q4)
200
8C
NY
452
Kob
e Sa
nda
Pre
miu
m
Out
lets
—K
obe,
Jap
an
195,
000
squa
re fo
ot u
psca
le o
utle
t cen
ter
Ban
ana
Rep
ublic
, Coa
ch, G
AP,
Guc
ci,
Hug
o B
oss,
Lor
a Pi
ana,
Sa
lvat
ore
Fer
raga
mo
40.0
%
July
200
7 JP
Y
5,9
00
Suzh
ou, C
hina
75
0,00
0 sq
uare
foot
cen
ter
anch
ored
by
a
hype
rmar
ket a
nd th
eate
r w
ith a
ppro
xim
atel
y
200
shop
s
Wal
-Mar
t, G
olde
n H
arve
st C
inem
as,
For
ever
21,
C&
A, S
epho
ra, S
tarb
ucks
, V
ero
Mod
a, S
port
100
32.5
%
Fal
l (Q
3) 2
009
CN
Y9
03
Zhe
ngzh
ou, C
hina
44
0,00
0 sq
uare
foot
cen
ter
anch
ored
by
a
hype
rmar
ket a
nd th
eate
r w
ith a
ppro
xim
atel
y
90 s
hops
Wal
-Mar
t, C
hina
Film
Cin
emas
, F
orev
er 2
1, S
epho
ra, V
ero
Mod
a,
Spor
t 100
32.5
%
Win
ter
(Q4)
200
8C
NY
515
Red
evel
opm
ent P
roje
cts:
Got
emba
Pre
miu
m O
utle
ts—
Got
emba
, Jap
an
95,0
00 s
quar
e fo
ot p
hase
III
exp
ansi
on o
f up
scal
e ou
tlet c
ente
r 40
.0%
A
pril
2008
JP
Y
6,0
96
Tos
u P
rem
ium
Out
lets
—F
ukuo
ka, J
apan
53
,000
squ
are
foot
pha
se I
I ex
pans
ion
of
upsc
ale
outle
t cen
ter
40.0
%
Dec
embe
r 20
07JP
Y
2,8
00
Oth
er p
roje
cts
(1 le
aseh
old
deve
lopm
ent,
1 le
aseh
old
exte
nsio
n)
€
1
* C
ost i
s ba
sed
upon
cur
rent
bud
get a
ssum
ptio
ns. A
ctua
l res
ults
may
var
y.
(1)
The
Com
pany
is n
ot o
blig
ated
to fu
nd it
s sh
are
of €
22 m
illio
n in
crea
se in
pro
ject
cos
ts fr
om €
143
mill
ion
to €
165
mill
ion.
47
SIMON PROPERTY GROUP The Company’s Share of Total Debt Amortization and Maturities by Year
As of June 30, 2007 (In thousands)
The Company’s The Company’s The Company’s Share of Share of Share of Secured Unsecured Unconsolidated The Company’s Consolidated Consolidated Joint Venture Share of Total
(1) Covenants for indentures dated June 7, 2005 and later. Covenants and other provisions of prior supplemental indentures apply to all unsecured debt for as long as any securities issued under prior supplemental indentures remain outstanding or until the covenants in the prior supplemental indentures have been amended. For a complete listing of all debt covenants related to the Company’s senior unsecured notes, as well as definitions of the above terms, please refer to Simon Property Group, L.P. filings with the Securities and Exchange Commission.
Footnotes: (1) Variable rate debt interest rates are based on the following base rates as of June 30, 2007: LIBOR at 5.32%; EURIBOR at 5.36%;
and YEN LIBOR at .64%.
(2) Includes applicable extensions available at Company’s option.
(3) These two Properties are secured by cross-collateralized and cross-defaulted mortgages.
(4) These four Properties are secured by cross-collateralized and cross-defaulted mortgages.
(5) These three Properties are secured by cross-collateralized and cross-defaulted mortgages.
(6) These four Properties are secured by cross-collateralized and cross-defaulted mortgages.
(7) These four Properties are secured by cross-collateralized and cross-defaulted mortgages.
(8) These eleven Properties are secured by cross-collateralized and cross-defaulted mortgages.
(9) These four Properties are secured by cross-collateralized and cross-defaulted mortgages.
(10) These eleven Properties are secured by cross-collateralized and cross-defaulted mortgages.
(11) Simultaneous with the issuance of this loan, the Company entered into a $70 million notional amount variable rate swap agreement which is designated as a hedge against this loan. As of June 30, 2007, after including the impacts of this swap, the terms of the loan are effectively $150 million fixed at 3.60% and $70 million variable rate at 5.39%.
(12) Amounts shown in USD Equivalent. Euro equivalent is 45.8 million.
(13) Amounts shown in USD Equivalent. Euro equivalent is 709.2 million. Associated with Facility A and B are interest rate swapagreements with a total combined 517.9 million euros notional amount that effectively fixes Facility A and B and Giugliano at 4.02%.
(14) Amounts shown in USD Equivalent. Euro equivalent is 207.5 million. Associated with these loans are interest rate swap agreements with a total combined 199.3 million euros notional amount that effectively fix these loans at a combined 4.69%.
(15) Amounts shown in USD Equivalent. Yen equivalent is 20,625.4 million.
(16) The Company has $300 million notional amount variable rate swap agreement which is a designated hedge against this unsecured note effectively converting to a six month LIBOR variable rate.
(17) Amounts shown in USD Equivalent. Balance includes borrowings on multi-currency tranche of Yen 1,746.4 million.
(18) Amounts shown in USD Equivalent. Balance includes borrowings on multi-currency tranche of Euro 224.0 million.
(19) Property debt consists of three components; fixed loans at 9.80% and 13.80%(pay rate of 10.36%), and a variable rate loan at LIBOR plus 500 basis points. The variable component has LIBOR capped at 7.50%, which effectively fixes the three components at a weighted average rate of 10.61%
(20) The Company’s share of indebtedness for joint ventures excludes our share of indebtedness of $78.7 million in joint venture entities in which a non-controlling interest is held by Gallerie Commerciali Italia, an entity in which we have a 49% interest.
56
SIMON PROPERTY GROUP Unencumbered Assets
As of June 30, 2007
Property Name City State Regional Malls: McCain Mall N. Little Rock AR University Mall Little Rock AR Brea Mall Brea CA Laguna Hills Mall Laguna Hills CA Santa Rosa Plaza Santa Rosa CA Shops at Mission Viejo, The Mission Viejo CA Westminster Mall Westminster CA Town Center at Aurora Aurora CO Boynton Beach Mall Boynton Beach FL Cordova Mall Pensacola FL Edison Mall Fort Meyers FL Gulf View Square Port Richey FL Lake Square Mall Leesburg FL Melbourne Square Melbourne FL Orange Park Mall Orange Park FL Paddock Mall Ocala FL Town Center at Boca Raton Boca Raton FL Treasure Coast Square Jensen Beach FL Tyrone Square St. Petersburg FL University Mall Pensacola FL Lenox Square Atlanta GA Phipps Plaza Atlanta GA Lindale Mall Cedar Rapits IA North Park Mall Davenport IA South Ridge Mall Des Moines IA Alton Square Alton IL Lincolnwood Town Center Lincolnwood IL Northwoods Shopping Center Peoria IL Orland Square Orland Park IL River Oaks Center Calumet City IL South Park Mall Moline IL Castleton Square Mall Indianapolis IN Fashion Mall at Keystone, The Indianapolis IN Lafayette Square Indianapolis IN Muncie Mall Muncie IN Tippecanoe Mall Lafayette IN Prien Lake Mall Lake Charles LA Burlington Mall Burlington MA South Shore Plaza Braintree MA Bowie Town Center Bowie MD St. Charles Towne Center Waldorf MD
57
SIMON PROPERTY GROUP Unencumbered Assets
As of June 30, 2007
Property Name City State
Maplewood Mall Minneapolis MN Miller Hill Mall Duluth MN
Independence Center Independence MO
SouthPark Charlotte NC
Pheasant Lane Nashua NH
Livingston Mall Livingston NJ Menlo Park Mall Edison NJ Ocean County Mall Toms River NJ Rockaway Townsquare Rockaway NJ
Cottonwood Mall Albuquerque NM
Chautauqua Mall Lakewood NY Nanuet Mall Nanuet NY Jefferson Valley Mall Yorktown Heights NY Roosevelt Field Garden City NY Walt Whitman Mall Huntington Station NY
Great Lakes Mall Mentor OH Lima Mall Lima OH Southern Park Mall Boardman OH
Ross Park Mall Pittsburgh PA South Hills Village Pittsburgh PA
Haywood Mall Greenville SC
Oak Court Mall Memphis TN Raleigh Springs Mall Memphis TN
Barton Creek Square Austin TX Broadway Square Tyler TX Cielo Vista El Paso TX Firewheel Town Center Garland TX Irving Mall Irving TX La Plaza Mall McAllen TX Lakeline Mall Cedar Park TX North East Mall Hurst TX Richardson Square Mall Richardson TX Rolling Oaks Mall San Antonio TX
Charlottesville Fashion Square Charlottesville VA Virginia Center Commons Glen Allen VA
Columbia Center Kennewick WA Northgate Mall Seattle WA
Bay Park Square Green Bay WI
58
SIMON PROPERTY GROUP Unencumbered Assets
As of June 30, 2007
Property Name City State Premium Outlet Centers:
Camarillo Premium Outlets Camarillo CA Carlsbad Premium Outlets Carlsbad CA Desert Hills Premium Outlets Cabazon CA Folsom Premium Outlets Folsom CA Napa Premium Outlets Napa CA Petaluma Village Premium Outlets Petaluma CA Vacaville Premium Outlets Vacaville CA
Clinton Crossing Premium Outlets Clinton CT
Orlando Premium Outlets Orlando FL St. Augustine Premium Outlets St. Augustine FL
North Georgia Premium Outlets Dawsonville GA
Waikele Premium Outlets Waipahu HI
Chicago Premium Outlets Aurora IL
Edinburgh Premium Outlets Edinburgh IN
Wrentham Village Premium Outlets Wrentham MA
Albertville Premium Outlets Albertville MN
Osage Beach Premium Outlets Osage Beach MO
Jackson Premium Outlets Jackson NJ Liberty Village Premium Outlets Flemington NJ
Las Vegas Outlet Center Las Vegas NV Las Vegas Premium Outlets Las Vegas NV
Woodbury Common Premium Outlets Central Valley NY
Aurora Farms Premium Outlets Aurora OH
Columbia Gorge Premium Outlets Troutdale OR
Allen Premium Outlets Allen TX Rio Grande Valley Premium Outlets Mercedes TX Round Rock Premium Outlets Austin TX
Leesburg Corner Premium Outlets Leesburg VA
Seattle Premium Outlets Seattle WA
Johnson Creek Premium Outlets Johnson Creek WI
The Mills: Cincinnati Mills Cincinnati OH
Community/Lifestyle Centers:
Royal Eagle Plaza Coral Springs FL Terrace at Florida Mall Orlando FL Waterford Lakes Town Center Orlando FL Westland Park Plaza Orange Park FL
59
SIMON PROPERTY GROUP Unencumbered Assets
As of June 30, 2007
Property Name City State
Mall of Georgia Crossing Atlanta GA
Countryside Plaza Countryside IL Crystal Court Crystal Lake IL Lake Plaza Waukegan IL North Ridge Plaza Joliet IL Willow Knolls Court Peoria IL
Brightwood Plaza Indianapolis IN Eastland Convenience Center Evansville IN Greenwood Plus Greenwood IN Griffith Park Plaza Griffith IN Keystone Shoppes Indianapolis IN Markland Plaza Kokomo IN New Castle Plaza New Castle IN Northwood Plaza Fort Wayne IN Teal Plaza Lafayette IN Tippecanoe Plaza Lafayette IN University Center Mishawaka IN Washington Plaza Indianapolis IN
Park Plaza Hopkinsville KY
Rockaway Convenience Center Rockaway NJ Rockaway Town Plaza Rockaway NJ
Great Lakes Plaza Mentor OH Lima Center Lima OH
Eastland Plaza Tulsa OK
Lincoln Plaza Langhorne PA
Charles Towne Square Charleston SC
Empire East Sioux Falls SD
Knoxville Commons Knoxville TN
The Arboretum Austin TX Celina Plaza El Paso TX Wolf Ranch Town Center Georgetown TX Ingram Plaza San Antonio TX Shops at North East Mall Hurst TX
Chesapeake Center Chesapeake VA Fairfax Court Fairfax VA Martinsville Plaza Martinsville VA
Other:
Factory Merchants Branson Branson MO
Crossville Outlet Center Crossville TN
Factory Stores at North Bend North Bend WA
60
SIMON PROPERTY GROUP Preferred Stock/Units Outstanding
As of June 30, 2007 ($ in 000’s, except per share amounts)
Per Share Aggregate Number of Liquidation Liquidation Ticker
Issuer Description Shares/Units Preference Preference Symbol Preferred Stock: Simon Property Group, Inc. Series G 7.89%
(1) The Cumulative Step-Up Premium Rate Preferred Stock was issued at 7.89%. The shares are redeemable after September 30, 2007. Beginning October 1, 2012, the rate increases to 9.89%. The shares are not convertible into any other securities of the Company. The shares are traded on the New York Stock Exchange. The closing price on June 29, 2007 was $50.02 per share.
(2) Each share was convertible into 0.78957 of a share of common stock during the period beginning on April 2, 2007 and ending on June 29, 2007. Each share is convertible into 0.790897 of a share of common stock during the period beginning on July 2, 2007 and ending on September 28, 2007. The shares are redeemable on or after October 14, 2009, in whole or in part, for cash only at a liquidation preference of $50 per share, if the closing price per share of common stock exceeds 130% of the applicableconversion price for 20 trading days within a period of 30 consecutive trading days ending on the trading day before notice of redemption is issued. The shares are traded on the New York Stock Exchange. The closing price on June 29, 2007 was $75.99 per share.
(3) Each share is redeemable on or after October 15, 2027. The shares are traded on the New York Stock Exchange. The closing price on June 29, 2007 was $67.50 per share.
(4) Each unit is convertible into 0.75676 of a share of common stock. Each unit is redeemable on or after August 27, 2009.
(5) Each unit is redeemable on or after August 27, 2009.
(6) Each unit was convertible into 0.78957 of a share of common stock during the period beginning on April 2, 2007 and ending on June 29, 2007. Each unit is convertible into 0.790897 of a share of common stock during the period beginning on July 2, 2007 and ending on September 28, 2007. Each unit may be exchanged for a share of Series I 6% Convertible Perpetual Preferred stock or cash, at Simon Group’s option.
(7) Each unit is redeemable on or after November 10, 2013 or earlier upon the occurrence of certain tax triggering events.
(8) Each unit is redeemable on or after January 1, 2011 or earlier upon the occurrence of certain tax triggering events.
61
Exhibit 99.2
CONTACTS: Shelly Doran 317.685.7330 Investors Les Morris 317.263.7711 Media
FOR IMMEDIATE RELEASE
SIMON PROPERTY GROUP ANNOUNCES SECOND QUARTER RESULTS AND QUARTERLY DIVIDENDS
Indianapolis, Indiana—July 30, 2007...Simon Property Group, Inc. (the “Company” or “Simon”) (NYSE:SPG) today announced results for the quarter ended June 30, 2007:
• Funds from operations (“FFO”) of the Simon portfolio for the quarter increased 4.1% to $373.0 million from $358.4 million in the second quarter of 2006. On a diluted per share basis the increase was 4.0% to $1.31 from $1.26 in 2006. FFO of the Simon portfolio for the six months increased 6.7% to $765.4 million from $717.3 million in 2006. On a diluted per share basis the increase was 6.3% to $2.68 per share from $2.52 per share in 2006.
• Net income available to common stockholders for the quarter decreased 27.7% to $59.9 million from $82.9 million in the second quarter of 2006. On a diluted per share basis the decrease was 27.0% to $0.27 from $0.37 in 2006. Net income available to common stockholders for the six months decreased 15.3% to $158.3 million from $186.9 million in 2006. On a diluted per share basis the decrease was 15.5% to $0.71 per share from $0.84 per share in 2006. The decrease in net income for the quarter and six months is primarily attributable to higher gains recognized in 2006 on the sale of interests in unconsolidated entities than in 2007 and lower income from unconsolidated entities in 2007. Income from unconsolidated entities was lower in the second quarter of 2007 than the year earlier period primarily as a result of increased depreciation expense attributable to the acquisition of the Mills portfolio of assets.
(3) For mall and freestanding stores with less than 10,000 square feet.
62
Dividends
Today the Company announced a quarterly common stock dividend of $0.84 per share. This dividend will be paid on August 31, 2007 to stockholders of record on August 17, 2007.
The Company also declared dividends on its three outstanding issues of preferred stock:
• 7.89% Series G Cumulative Preferred (NYSE:SPGPrG) dividend of $0.98625 per share is payable on September 28, 2007 to stockholders of record on September 14, 2007.
• 6% Series I Convertible Perpetual Preferred (NYSE:SPGPrI) dividend of $0.75 per share is payable on August 31, 2007 to stockholders of record on August 17, 2007.
• 8 3/8% Series J Cumulative Redeemable Preferred (NYSE:SPGPrJ) dividend of $1.046875 per share is payable on September 28, 2007 to stockholders of record on September 14, 2007.
Common Stock Repurchase Program
On July 26, 2007, the Company announced that its Board of Directors had authorized a common stock repurchase program. Under the program, the Company may purchase up to $1 billion of its common stock over the next 24 months as market conditions warrant. The shares may be repurchased in the open market or in privately negotiated transactions.
2007 Guidance
Today the Company increased its guidance for 2007. The Company expects diluted FFO to be within a range of $5.83 to $5.88 per share for the year ending December 31, 2007, and diluted net income available to common stockholders to be within a range of $1.58 to $1.63 per share.
The following table provides the reconciliation of the range of estimated diluted net income available to common stockholders per share to estimated diluted FFO per share.
During June and July of 2007, the Company opened the 48,000 square foot small shop retail component and the residential component of 150 luxury apartments at The Village at SouthPark—a mixed-use project located adjacent to the highly successful SouthPark in Charlotte, North Carolina. Crate & Barrel opened in November of 2006.
In late July, the Company commenced construction on Jersey Shore Premium Outlets, a 435,000 square foot upscale manufacturers’ outlet center in Tinton Falls, New Jersey. The center is scheduled to open in the fall of 2008.
The Company continues construction on:
• Palms Crossing—a 396,000 square foot community center in McAllen, Texas. The first phase of the center is scheduled to open in November of 2007.
63
• Philadelphia Premium Outlets—a 425,000 square foot upscale manufacturers’ outlet center in Limerick, Pennsylvania, 35 miles northwest of Philadelphia. The center is scheduled to open in November of 2007.
• Pier Park—a 920,000 square foot community/lifestyle center in Panama City Beach, Florida. Target and a 16-screen theater have already opened at the center. The remainder of the project is scheduled to open in March of 2008.
• Hamilton Town Center—a 950,000 square foot open-air retail center in Noblesville, Indiana. The 690,000 square foot first phase of the center is scheduled to open in May of 2008.
• Houston Premium Outlets—a 433,000 square foot upscale manufacturers’ outlet center in Houston, Texas. The center is scheduled to open in May of 2008.
International Activity
Recent international activities include:
• On April 4th, Gallerie Commerciali Italia (“GCI”), Simon’s Italian joint venture partnership with Groupe Auchan, acquired the remaining 60% interest in the venture’s shopping center in Giugliano (a suburb of Naples).
• On June 1st, the Company’s Chelsea division opened Yeoju Premium Outlets, the first Premium Outlet Center in South Korea. The project is located on Expressway 50 approximately 36 miles southeast of Seoul in Gyeonggi Province. The 250,000 square-foot first phase of the project opened with 120 tenants. The center was 100% leased at opening, with approximately 90% of the center leased to international brands and the balance to Korean domestic brands. Population within a 40-mile radius of Yeoju Premium Outlets is approximately nine million people.
Yeoju Premium Outlets is the first project to be completed by Shinsegae Chelsea Co., Ltd., a joint venture between Simon (50%) and Shinsegae Co., Ltd. and Shinsegae International Co., Ltd. (together 50%). Shinsegae is one of Korea’s leading retailers.
• On July 5th, the Company’s Simon Ivanhoe joint venture completed the sale of five non-core assets in Poland. Proceeds approximated 183 million euros, net of debt and transaction costs. SPG’s share of the gain is expected to be in excess of $70 million.
• On July 5th, the Company’s Chelsea division opened Kobe-Sanda Premium Outlets, the sixth Premium Outlet Center in Japan and the second in the Kansai region. The project is located 22 miles north of downtown Kobe and 30 miles northwest of central Osaka. It is accessible via the region’s three most heavily traveled major highways—the Chugoku Expressway, the Sanyo Expressway and the Rokko-kita Toll Road. The 195,000 square-foot first phase of the project opened 100% leased to 90 tenants. Approximately 70% of the center has been leased to international brands and the balance to Japanese domestic brands. The population within a 30-mile radius is approximately 13 million people.
Kobe-Sanda Premium Outlets was developed by Chelsea Japan Co., Ltd., a joint venture of Simon Property Group (40% interest), Mitsubishi Estate Co., Ltd. and Sojitz Corporation (each 30%), and brings the joint venture’s operating portfolio of Premium Outlet Centers to 1.6 million square feet of gross leasable area.
• On July 26th, the Company announced that the Porta di Roma shopping center in Rome, Italy opened to the public. The center is located on the north side of Rome adjacent to the Grande Annulare, the peripheral highway which circles the city. The 1.3 million square foot center (Italy’s largest shopping center) opened 97% leased and is anchored by Auchan, LeRoy Merlin, IKEA and
64
a 14-screen UGC Movie Theatre. The center’s 210 small shops have been leased to significant national and international retailers. The trade area for Porta di Roma contains approximately 1.3 million people.
The center is the joint development of the Lamaro Group, a major Rome-based construction and development organization, and GCI. GCI owns 40% of this project.
Development projects:
• Construction continues on three shopping center projects in Italy, fully or partially owned by GCI. Two of the shopping centers are expected to open in 2007 and are located in Cinisello (Milan) and Nola (Naples). Another project, located in Argine (Naples), is scheduled to open in late 2008. After the opening of these three projects, GCI will own interests in 45 shopping centers in Italy comprising approximately 10.6 million square feet of gross leasable area.
• Construction also continues on four projects in China located in Changshu, Hangzhou, Suzhou, and Zhengzhou. The centers range in size from 300,000 to 720,000 square feet and will be anchored by Wal-Mart. 2008 openings are scheduled for Changshu, Hangzhou, and Zhengzhou, followed by an anticipated fall 2009 opening for Suzhou. The Company expects to begin construction on a 5th
center, in Hefei, by year-end 2007 for a 2009 opening. Simon owns 32.5% of these projects through its partnership with Morgan Stanley Real Estate Fund and Shenzhen International Trust and Investment Company CP.
The Mills Corporation
On March 29th, the Company announced the successful completion of the $25.25 per share cash tender offer for all outstanding shares of common stock of The Mills Corporation by SPG-FCM Ventures, LLC, a joint venture between an entity owned by Simon and funds managed by Farallon Capital Management, L.L.C. On April 3rd, the acquisition by SPG-FCM Ventures, LLC was completed by means of a merger of a subsidiary of SPG-FCM Ventures and The Mills Corporation.
The Mills portfolio of assets consists primarily of two distinctive types of assets—regional malls and The Mills®. The Mills® are centers that typically comprise over one million square feet of gross leasable area with a combination of traditional mall, outlet center and big box retailers and entertainment uses, all focused on delivering value for the consumer. The Mills portfolio of assets is included in the Company’s financial statements as joint venture assets.
Recent and anticipated capital market activities related to the Mills transaction are as follows:
• Seven of the portfolio assets were refinanced, totaling $2.3 billion and generating $962 million of excess net loan proceeds at an average rate of 5.78%.
• A senior corporate credit facility was completed, raising $925 million at Libor plus 125 basis points.
• An announced liquidation of The Mills Corporation is expected to occur on August 1, 2007—this will include the concurrent liquidation of the five outstanding series’ of Mills’ preferred stock.
Effective July 1, 2007, Simon also completed the transfer of all accounting and financial operations related to the Mills portfolio to Simon’s Indianapolis headquarters.
Conference Call
The Company will provide an online simulcast of its quarterly conference call at www.simon.com (Investor Relations tab), www.earnings.com, and www.streetevents.com. To listen to the live call, please go to any of these websites at least fifteen minutes prior to the call to register, download and install any necessary audio software. The call will begin at 11:00 a.m. Eastern Daylight Time today, July 30, 2007. An
65
online replay will be available for approximately 90 days at www.simon.com, www.earnings.com, and www.streetevents.com. A fully searchable podcast of the conference call will also be available at www.REITcafe.com shortly after completion of the call.
Supplemental Materials
The Company will publish a supplemental information package which will be available at www.simon.com in the Investor Relations section, Financial Information tab. It will also be furnished to the SEC as part of a current report on Form 8-K. If you wish to receive a copy via mail or email, please call 800-461-3439.
Forward-Looking Statements
Certain statements made in this press release may be deemed “forward-looking statements” within the meaning of the Private Securities Litigation Reform Act of 1995. Although the Company believes the expectations reflected in any forward-looking statements are based on reasonable assumptions, the Company can give no assurance that our expectations will be attained, and it is possible that actual results may differ materially from those indicated by these forward-looking statements due to a variety of risks and uncertainties. Those risks and uncertainties include, but are not limited to: the Company’s ability to meet debt service requirements, the availability of financing, changes in the Company’s credit rating, changes in market rates of interest and foreign exchange rates for foreign currencies, the ability to hedge interest rate risk, risks associated with the acquisition, development and expansion of properties, general risks related to retail real estate, the liquidity of real estate investments, environmental liabilities, international, national, regional and local economic climates, changes in market rental rates, trends in the retail industry, relationships with anchor tenants, the inability to collect rent due to the bankruptcy or insolvency of tenants or otherwise, risks relating to joint venture properties, costs of common area maintenance, competitive market forces, risks related to international activities, insurance costs and coverage, impact of terrorist activities, inflation and maintenance of REIT status. The Company discusses these and other risks and uncertainties under the heading “Risk Factors” in its annual and quarterly periodic reports filed with the SEC that could cause the Company’s actual results to differ materially from the forward-looking statements that the Company makes. The Company may update that discussion in its periodic reports, but otherwise the Company undertakes no duty or obligation to update or revise these forward-looking statements, whether as a result of new information, future developments, or otherwise.
Funds from Operations (“FFO”)
The Company considers FFO a key measure of its operating performance that is not specifically defined by accounting principles generally accepted in the United States (“GAAP”). The Company believes that FFO is helpful to investors because it is a widely recognized measure of the performance of real estate investment trusts (“REITs”) and provides a relevant basis for comparison among REITs. The Company determines FFO in accordance with the definition set forth by the National Association of Real Estate Investment Trusts (“NAREIT”).
About Simon
Simon Property Group, Inc. is an S&P 500 company and the largest public U.S. real estate company. Simon is a fully integrated real estate company which operates from five retail real estate platforms: regional malls, Premium Outlet Centers®, The Mills®, community/lifestyle centers and international properties. It currently owns or has an interest in 380 properties comprising 258 million square feet of gross leasable area in North America, Europe and Asia. The Company is headquartered in Indianapolis, Indiana and employs more than 4,500 people worldwide. Simon Property Group, Inc. is publicly traded on the NYSE under the symbol SPG and has a current total market capitalization of approximately $50 billion. For further information, visit the Company’s website at www.simon.com.
CAPITAL STOCK OF SIMON PROPERTY GROUP, INC. (750,000,000 total shares authorized, $.0001 par value, 237,996,000 shares of excess common stock):
All series of preferred stock, 100,000,000 shares authorized, 17,819,267 and 17,578,701 issued and outstanding, respectively, and with liquidation values of $890,963 and $878,935, respectively . . . . . . . 897,255 884,620
Common stock, $.0001 par value, 400,000,000 shares authorized, 227,511,348 and 225,797,566 issued and outstanding, respectively . . . . 23 23
Class B common stock, $.0001 par value, 12,000,000 shares authorized, 8,000 issued and outstanding . . . . . . . . . . . . . . . . . . . . . . . . . — —
(A) Consolidation occurs when the Company acquires an additional ownership interest in a joint venture and, as a result, gains control of the joint venture. These interests have been separated from operational interests to present comparative results of operations for those joint ventures held as of June 30, 2007.
Discontinued joint venture interests represent assets and partnership interests that have been sold.
(B) Relates to the sale of Great Northeast Plaza, a community center, on April 25, 2006, and Metrocenter, a regional mall, in January 2005.
(C) As a result of the consolidation of Mall of Georgia during the fourth quarter of 2006 and Town Center at Cobb and Gwinnett Mall as of March 31, 2007, we reclassified our share of the pre-consolidation earnings from these properties.
(D) Excess investment represents the unamortized difference of the Company’s investment over equity in the underlying net assets of the partnerships and joint ventures. The Company generally amortizes excess investment over the life of the related properties, typically no greater than 40 years, and the amortization is included in income from unconsolidated entities.
72
SIMONReconciliation of Net Income to FFO(1)
Unaudited (In thousands, except as noted)
For the Three Months Ended For the Six Months Ended June 30, June 30, 2007 2006 2007 2006
Net Income(2)(3)(4)(5) . . . . . . . . . . . . . . . . . . . . . . . . . . . . . . . . $ 74,220 $ 101,263 $ 187,007 $ 223,853Adjustments to Net Income to Arrive at FFO:
Limited Partners’ interest in the Operating Partnership and preferred distributions of the Operating Partnership . . . . . . 21,045 28,852 52,162 63,232
Limited Partners’ interest in discontinued operations. . . . . . . . 3 (28) (38) 12Depreciation and amortization from consolidated properties
and discontinued operations . . . . . . . . . . . . . . . . . . . . . . . . . 226,853 210,448 439,341 423,990Simon’s share of depreciation and amortization from
and discontinued operations, net of Limited Partners’ interest (2,880) (7,687) (500 ) (42,015)Minority interest portion of depreciation and amortization . . . (2,276) (2,031) (4,293 ) (4,131)Preferred distributions and dividends . . . . . . . . . . . . . . . . . . . . (19,900) (25,323) (39,545 ) (50,722)
FFO of the Simon Portfolio . . . . . . . . . . . . . . . . . . . . . . . . . . . . . $ 373,034 $ 358,440 $ 765,434 $ 717,297Per Share Reconciliation: Diluted net income available to common stockholders per share . $ 0.27 $ 0.37 $ 0.71 $ 0.84Adjustments to net income to arrive at FFO:
Depreciation and amortization from consolidated properties and Simon’s share of depreciation and amortization from unconsolidated entities, net of minority interest portion of depreciation and amortization. . . . . . . . . . . . . . . . . . . . . . . . 1.07 0.94 2.01 1.88
Gain on sales of assets and interests in unconsolidated entities and discontinued operations, net of Limited Partners’ interest (0.01) (0.03) 0.00 (0.15)
SIMONFootnotes to Reconciliation of Net Income to FFO
Unaudited
Notes:
(1) The Company considers FFO a key measure of its operating performance that is not specifically defined by GAAP and believes that FFO is helpful to investors because it is a widely recognized measure of the performance of REITs and provides a relevant basis for comparison among REITs. The Company also uses this measure internally to measure the operating performance of the portfolio. The Company’s computation of FFO may not be comparable to FFO reported by other REITs.
As defined by NAREIT, FFO is consolidated net income computed in accordance with GAAP, excluding real estate related depreciation and amortization, excluding gains and losses from extraordinary items, excluding gains and losses from the sales of real estate, plus the allocable portion of FFO of unconsolidated joint ventures based upon economic ownership interest, and all determined on a consistent basis in accordance with GAAP. The Company has adopted NAREIT’s clarification of the definition of FFO that requires it to include the effects of nonrecurring items not classified as extraordinary, cumulative effect of accounting change or resulting from the sale of depreciable real estate. However, you should understand that FFO does not represent cash flow from operations as defined by GAAP, should not be considered as an alternative to net income determined in accordance with GAAP as a measure of operating performance, and is not an alternative to cash flows as a measure of liquidity.
(2) Includes the Company’s share of gains on land sales of $3.7 million and $19.7 million for the three months ended June 30, 2007 and 2006, respectively, and $11.3 million and $26.3 million for the six months ended June 30, 2007 and 2006, respectively.
(3) Includes the Company’s share of straight-line adjustments to minimum rent of $5.6 million and $1.5 million for the three months ended June 30, 2007 and 2006, respectively and $10.7 million and $5.3 million for the six months ended June 30, 2007 and 2006, respectively.
(4) Includes the Company’s share of the fair market value of leases from acquisitions of $12.3 million and $17.8 million for the three months ended June 30, 2007 and 2006, respectively, and $26.2 million and $35.2 million for the six months ended June 20, 2007 and 2006, respectively.
(5) Includes the Company’s share of debt premium amortization of $15.0 million and $6.7 million for the three months ended June 30, 2007 and 2006, respectively, and $22.0 million and $13.4 million for the six months ended June 30, 2007 and 2006, respectively.
(6) Includes dividends and distributions of Series I preferred stock and Series C and Series I preferred units.