SECURITIES AND EXCHANGE COMMISSION SEC FORM 17-Q QUARTERLY REPORT PURSUANT TO SECTION 17 OF THE SECURITIES REGULATION CODE AND SRC RULE 17(2)(b) THEREUNDER 1. For the quarterly period ended June 30, 2007 2. Commission identification number 9170 3. BIR Tax Identification No. 000-400-016-000 4. Universal Robina Corporation Exact name of issuer as specified in its charter 5. Quezon City, Philippines Province, country or other jurisdiction of incorporation or organization 6. Industry Classification Code: __________ (SEC Use Only) 7. 110 E. Rodriguez Jr. Ave., Bagumbayan, Quezon City 1110 Address of issuer’s principal office Postal Code 8. 671-2935; 635-0751; 671-3954 Issuer’s telephone number, including area code 9. Not applicable Former name, former address and former fiscal year, if changed since last report 10. Securities registered pursuant to Sections 8 and 12 of the Code, or Sections 4 and 8 of the RSA Title of Each Class Common stock, P1.00 Par value Number of Shares of Common Stock Outstanding and Amount of Debt Outstanding 2,221,851,481shares 11. Are any or all of the securities listed on the Philippine Stock Exchange? Yes [ / ] No [ ]
Transcript
SECURITIES AND EXCHANGE COMMISSION
SEC FORM 17-Q
QUARTERLY REPORT PURSUANT TO SECTION 17 OF THE SECURITIES REGULATION CODE AND SRC RULE 17(2)(b) THEREUNDER
1. For the quarterly period ended June 30, 2007 2. Commission identification number 9170 3. BIR Tax Identification No. 000-400-016-000 4. Universal Robina Corporation Exact name of issuer as specified in its charter 5. Quezon City, Philippines Province, country or other jurisdiction of incorporation or organization 6. Industry Classification Code: __________ (SEC Use Only) 7. 110 E. Rodriguez Jr. Ave., Bagumbayan, Quezon City 1110 Address of issuer’s principal office Postal Code 8. 671-2935; 635-0751; 671-3954 Issuer’s telephone number, including area code
9. Not applicable Former name, former address and former fiscal year, if changed since last report 10. Securities registered pursuant to Sections 8 and 12 of the Code, or Sections 4 and 8 of the
RSA
Title of Each Class
Common stock, P1.00 Par value
Number of Shares of Common Stock Outstanding and
Amount of Debt Outstanding
2,221,851,481shares
11. Are any or all of the securities listed on the Philippine Stock Exchange?
Yes [ / ] No [ ]
- 2 -
If yes, state the name of such Stock Exchange and the class/es of securities listed therein Philippine Stock Exchange Common stock 12. Indicate by check mark whether the registrant:
(a) has filed all reports required to be filed by Section 17 of the Code and SRC Rule 17
thereunder or Sections 11 of the RSA and RSA Rule 11(a)-1 thereunder, and Sections 26 and 141 of the Corporation Code of the Philippines, during the preceding twelve (12) months (or for such shorter period the registrant was required to file such reports)
Yes [ / ] No [ ]
(b) has been subject to such filing requirements for the past ninety (90) days. Yes [ / ] No [ ]
PART I - FINANCIAL INFORMATION Item 1. Financial Statements. The unaudited consolidated financial statements are filed as part of this Form 17-Q (pages 11-23). Item 2. Management's Discussion and Analysis of Financial Condition and Results of
Operations. The following discussions should be read in conjunction with the attached unaudited consolidated financial statements of the Company as of and for the period ended June 30, 2007 (with comparative figures as of September 30, 2006 and for the period ended June 30, 2006) Business Overview URC is one of the largest branded food product companies in the Philippines and has a growing presence in other markets in Asia. It was founded in 1954 when Mr. John Gokongwei, Jr. established Universal Corn Products, Inc., a cornstarch manufacturing plant in Pasig. The Company is involved in a wide range of food-related businesses, including the manufacture and distribution of branded consumer foods and beverage products, production of hogs and day-old chicks, manufacture and distribution of branded and unbranded animal and fish feeds, glucose and veterinary compounds, flour milling, and sugar milling and refining. The Company is a leading market player in snack foods, candies, chocolates, ready-to-drink tea-based products, day-old chicks and fish feeds. The Company operates its food business through operating divisions and wholly owned or majority owned subsidiaries that are organized into three business segments; branded consumer foods, agro-industrial products and commodity food products.
- 3 -
The branded consumer foods group (BCFG) consists of three main divisions: snack foods, beverage and grocery products. The grocery products division includes joint venture companies, Hunts-URC and Nissin URC. The group distributes a diverse mix of salty snacks, chocolates, candies, biscuits, bakery products, beverages, noodles and tomato-based products in the Philippines and other countries in Asia. URC has leading market shares in salty snacks, chocolates, candies and ready-to-drink tea in the Philippines, and in some other Southeast Asian markets. The agro-industrial group (AIG) operates three divisions engaged in hog and poultry farming, the production and distribution of animal health products and the manufacture and distribution of branded and unbranded animal feeds, glucose and soya bean products. URC is one of the biggest players in hogs and poultry raising in the Philippines. The commodity foods group (CFG) engages in sugar milling and refining, flour milling and the manufacture and marketing of pasta. The group supplies all the flour and sugar needs of the BCFG. The following table summarizes the net sales and services for the nine months ended June 30,2007 and June 30, 2006:
Nine (9) Months Ended June 30 (PhP millions) 2007 2006 Branded Consumer Foods Group Domestic P 14,765 P 12,972 International 5,484 5,800 20,249 18,772 Packaging 730 950 BCFG Total 20,979 19,722 Agro-Industrial Group 3,919 3,559 Commodity Foods Group 2,583 2,762 URC Total P 27,481 P 26,043
Recent Developments On March 30, 2007, URC acquired South Luzon Green Land, Inc. and the manufacturing facilities as well as HIDDEN SPRING trademark of Nestle Waters Philippines, Inc. (NWPI) for a total consideration of P243.0 million. This acquisition will boost the water business of URC.
- 4 -
Results of Operations Nine Months Ended June 30, 2007 versus June 30, 2006 URC posted a consolidated net sales and services of P=27.481 billion for the nine months ended June 30, 2007, 5.5% higher than the P=26.043 billion reported revenues in the same period of last year. Net sales and services performance by business segment follows: Net sales in URC’s branded consumer foods group (BCFG) (excluding packaging) increased by P1.476 billion, or 7.9%, to P20.249 billion in the first nine months of fiscal 2007 from P18.772 billion recorded in the same period last year. This increase was primarily due to 24.7% jump in sales volume of BCFG’s domestic operations. Beverage, accounting for 25.7% of BCFG’s domestic sales, is still growing exponentially with 53.8% growth in sales value on the back of 71.5% increase in volume. C2, a tea-based product, registered a 52.1%% increase in sales value out of the 36.1% increase in sales volume. Sales of beverages includes new products: Nature’s Harvest which contributed P39.6 million in revenues for the first nine months of fiscal 2007, and Hidden Spring and Nestle Pure Life water brands contributed P61.3 million in revenues in its first three months of operations. Sales of snack foods increased by 4.9% to P8.706 billion on salty snacks, candies and chocolates, biscuits and bakery sales increases, boosted by domestic consumption recovery and election spending. BCFG international sales in US dollar terms increased by 3.3% from US $109.7 million in the first nine months of fiscal 2006 to US $113.3 million in the same period this fiscal year with China and Indonesia only posting lower sales. China sales were down as a result of the scaling back of business activities in order to rationalize operating costs. In Philippine peso terms, however, BCFG International sales were down by 5.4% to P5.484 billion primarily due to strengthening of the Philippine peso. Net sales of BCFG (excluding packaging) accounted for 73.7% of the total URC consolidated net sales and services in the first nine months of fiscal 2007.
Net sales in URC’s packaging division decreased by 23.1% to P730.2 million in the first nine months of fiscal 2007 from P950.2 million posted in the same period last year due to 28.0% decline in sales volume which was partially offsett by a 6.7 % increase in average selling price.
Net sales in URC’s agro-industrial group (AIG) amounted to P 3.919 billion in the first nine months of fiscal 2007, an increase of 9.9% from same period last year’s sales of P3.559 billion. This was due to 18.9% rise in animal feeds sales which was attributed to a 10.5% increase in sales volume and a 7.6% increase in average selling price. The feeds business continued to expand due to increasing strength of its “Uno” Feeds brand. The farm group generated a 2.7% revenue growth for the first nine months of fiscal 2007 due to higher prices particularly for poultry products.
Net sales in URC’s commodity foods group (CFG) decreased by P 179 million or 6.5% to P 2.583 billion in the first nine months of fiscal 2007 as against P2.762 billion for the same reporting period last year. This was due to 32.6% increase in internal transfers of flour and sugar to BCFG. However, gross sales inclusive of internal transfers increased by 6.7% from P4.141 billion for the fist nine months of fiscal 2006 to P4.420 billion in the same period this year. URC’s cost of sales and services consists primarily of raw and packaging materials costs, manufacturing costs and direct labor costs. Cost of sales and services increased to P 20.323 billion in the first nine months of fiscal 2007, or 5.8% from P19.213 billion recorded in the same period last year. This cost increase was due to higher sales volume and generally higher prices for major raw materials such as coffee beans, fresh potatoes, potato flakes, wheat, corn and resin.
- 5 -
URC’s gross profit increased by P327 million, or 4.8%, to P7.158 billion in the first nine months of fiscal 2007 from P6.831 billion recorded in the same period last year. URC’s gross profit as a percentage of net sales was maintained at 26% in the first nine months of both fiscal years. URC’s operating expenses consist primarily of salaries, wages and other staff costs (4.2% to sales), advertising and promotion costs (6.1% to sales), freight and other selling expenses (4.1% to sales), depreciation (0.6% to sales), repairs and maintenance expenses (0.2% to sales) and other operating expenses (2.0% to sales). Operating expenses increased by P 108 million, or 2.3%, to P4.735 billion in the first nine months of fiscal 2007 from P 4.627 billion recorded in the same period last year. This increase resulted primarily from the following factors: • 9.5% increase in freight and handling, from P912.4 million in the first nine months of fiscal
2006 to P999.0 million in the same period this year. This was due to higher sales volume and increase in freight rate charges associated with higher fuel prices and increase in trucking and shipping costs.
• 7.8% increase in salaries, wages and other staff costs substantially due to annual salary
adjustments given in May 2006. • 4.9% increase in advertising and promotions due to launching of new products and sustaining
the Company’s market shares in domestic operations. • 26.8% increase in depreciation expense due to new capital expenditures. As a result of the above factors, income from operations increased by 10.0% to P2.423 billion for the first nine months of fiscal 2007 from P2.204 billion in the same reporting period last year. Net income increased by P3.130 billion, or 200.1%, to P4.694 billion in the first nine months of fiscal 2007 from P1.564 billion in the same period last fiscal year. Non-recurring items like the P2.859 billion gain from sale of investment of URC in Robinsons Land Corporation (RLC) shares and P435.0 million impairment loss provision for URC-BOPP machines and equipment are included in the result. On a recurring basis, URC's net income amounted to P2.118 billion, or 35.4% higher than the amount reported in the same period last year. The Company is not aware of any material off-balance sheet transactions, arrangements, and obligations (including contingent obligations), and other relationship of the Company with unconsolidated entities or other persons created during the reporting period that would have a significant impact on the Company’s operations and/or financial condition. Financial Position June 30, 2007 vs. September 30, 2006 The Company remains to be financially strong with a current ratio of 2.48:1 as of June 30, 2007 although lower than the reported current ratio of 2.96:1 as of September 30, 2006. The decrease was basically due to US$125 million, 9% Guaranteed Notes Due February 2008 which was reported under current portion of long term debt resulting in higher total current liabilities. Financial debt to equity improved further to 0.53:1 from 0.76:1 as of last fiscal year. Book value per share was P 15.11 as at June 30, 2007 from P13.72 as at September 30, 2006.
- 6 -
The Company’s fund requirements have been sourced from cash flow from operations supplemented by proceeds from sale of the Company’s primary common shares and shareholdings in Robinsons Land Corporation (RLC). URC’s EBITDA (income from operations before depreciation and amortization) amounted to P=4.279 billion for the nine months ended June 30, 2007 which is 12.7% higher than P= 3.798 billion it had in the same reporting period last fiscal year. Net cash provided by operations amounted to P=1.782 billion. Net cash provided by investing activities for the period amounted to P 2.923 billion, primarily from the proceeds of sale of RLC shares and investment in bonds partially offsetted by acquisition of fixed assets. Net cash used in financing activities amounted to P7.232 billion, mainly for the payment of financial debt and dividends to stockholders. As of June 30, 2007, the Company is not aware of any events that will trigger direct or contingent financial obligation that is material to the Company, including any default or acceleration of an obligation.
Material Changes in Fiscal Year 2007 Financial Statements (Increase/Decrease of 5% or more versus FY 2006)
Income Statements Nine months ended June 30, 2007 versus same period in Fiscal Year 2006. 150.3% increase in mark-to-market gain on financial assets at fair value through profit and loss Due to improvement in market value of marketable securities net of decline in market value of investment in bonds. 3,299.1% increase in foreign exchange losses Due to appreciation of Philippine peso vis-à-vis US Dollar. 27.7% decrease in investment income Due to lower bond portfolio financial asset. 93.2% decrease in equity in net earnings Due to sale of equity investment in RLC shares. 27.8% decrease in finance costs Due to retirement of URC 06 notes and payment of loans. Impairment loss Represents impairment loss provision on Packaging division’s certain assets. Gain on sale of equity investment Represents net gain on sale of RLC shares. 33.0% decrease in other income - net Due to lower miscellaneous income. 83.6% decrease in minority interest Due mainly to net loss incurred by URC International.
- 7 -
Balance Sheets As of June 30, 2007 versus September 30, 2006 42.2% decrease in cash and cash equivalents Due to decrease in cash in bank and money market placements. 7.5% decrease in financial assets at fair value through profit and loss Due to disposal of investment in bonds and decline in market value of certain bonds held. 4.8% decrease in trade and other receivables Decrease due to collection of trade receivables. 11.8% increase in due from affiliated companies Due to advances made to certain affiliated companies in the ordinary course of the business. 40.3% increase in inventories-net Due to increase in finished goods, raw and packaging materials, and supplies and spareparts inventories. 95.7% decrease in investment and advances Due to sale of equity investment in RLC shares. 4.7% increase in property, plant and equipment – net Due to additional acquisition of fixed assets partially offsetted by depreciation and provision for impairment loss. 14.7% increase in biological assets Due to increase in population of livestocks and increased market prices of hogs. 7.7% decrease in loans payable Due to payment of short-term bank loans. 12.1% decrease in accounts payable and accrued expenses Due to payment of trade payables. 97.2% decrease in trust receipts and acceptances payable Due to settlement of trust receipts payable. 127.6% increase in due to affiliated companies Due to advances made by affiliates in the normal course of business. 71.2% increase in income tax payable Due to tax liabilities on income for the first nine months of fiscal 2007. 23.8% decrease in long term debt (including current portion) Due to long term debt amortization, retirement of URC06 notes and appreciation of Philippine peso vis-à-vis US dollar. 11.9% decrease in cumulative translation adjustment Due to appreciation of Philippine peso vis-à-vis US dollar.
- 8 -
5.2% decrease in minority interests Due to decrease in net income of consolidated subsidiaries and appreciation of Philippine peso vis-à-vis US dollar. 19.6% increase in retained earnings Due to net income for the first nine months of fiscal 2007 offsetted by dividends paid to stockholders. The Company’s key performance indicators are employed across all businesses. Comparisons are then made against internal target and previous period’s performance. The Company and its significant subsidiaries’ top five (5) key performance indicators are as follows: (in Million PhPs)
Universal Robina Corporation (Consolidated) YTD June 2007 YTD June 2006 Index Revenue 27,481 26,043 106 EBIT 2,423 2,204 110 EBITDA 4,279 3,798 113 Net Income 4,694 1,564 300 As of June 2007 As of June 2006 Index Total Assets 57,056 57,591 99
URC INT'L. YTD June 2007 YTD June 2006 Index Revenue 5,168 5,800 89 EBIT (138) (107) 129 EBITDA 344 324 106 Net Loss (64) 54 (219) As of June 2007 As of June 2006 Index Total Assets 8,836 10,823 82
Nissin -URC YTD June 2007 YTD June 2006 Index Revenue 722 661 109 EBIT 68 24 283 EBITDA 92 49 188 Net Income 54 22 245 As of June 2007 As of June 2006 Index Total Assets 761 694 110
- 9 -
URC Philippines, Limited YTD June 2007 YTD June 2006 Index Revenue - - - EBIT (21) (16) 131 EBITDA (21) (16) 131 Net Income (142) (637) 22 As of June 2007 As of June 2006 Index Total Assets 17,518 25,937 68
URC-Robina (Cayman), Limited YTD June 2007 YTD June 2006 Index Revenue - - - EBIT (1) (1) 100 EBITDA (1) (1) - Net Income 19 208 9 As of June 2007 As of June 2006 Index Total Assets 262 8,137 3
- 11 -
UNIVERSAL ROBINA CORPORATION AND SUBSIDIARIES Consolidated Balance Sheets (In Thousand Pesos)
Unaudited Audited June 30 September 30 2007 2006
ASSETS Current Assets Cash and cash equivalents (Note 3) P 3,453,235 P 5,979,875Financial assets at fair value through profit and loss 16,541,360 17,889,646Trade and other receivables – net (Note 4) 4,419,141 4,641,131Due from affiliated companies (Note 5) 533,229 476,982Inventories – net (Note 6) 7,565,347 5,391,591Other current assets 119,997 122,596 Total Current Assets 32,632,309 34,501,821Noncurrent Assets Investment and advances (Note 7) 84,254 1,958,481Property, plant and equipment – net 21,533,804 20,563,903Investment property (Note 8) 83,501 86,200Biological assets 937,167 817,003Net pension asset 236,346 236,346Other noncurrent assets – net 1,548,401 1,526,191 Total Noncurrent Assets 24,423,473 25,188,124 P P57,055,782 P 59,689,945 LIABILITIES AND STOCKHOLDERS’ EQUITY Current Liabilities Loans payable P 3,716,842 P 4,026,418Accounts payable and accrued expenses (Note 9) 3,639,868 4,142,156Trust receipts and acceptances payable 18,763 661,147Due to affiliated companies (Note 10) 362,676 159,323Income tax payable 246,829 144,211Current portion of long – term debt (Note 11) 5,192,043 2,534,798 Total Current Liabilities 13,177,021 11,668,054Noncurrent Liabilities Deferred income tax – net
285,864 294,959
Long-term debt – net of current portion (Note 11) 9,314,906 16,499,917 Total Noncurrent Liabilities 9,600,770 16,794,876 22,777,791 28,462,930Equity attributable to equity holders of the parent Capital Stock (Note 12) 2,221,851 2,221,851Additional paid-in capital 11,207,662 11,207,662Deposits for future stock subscriptions 26,044 26,044Cumulative translation adjustments 674,806 765,869Retained earnings (Note 13) 19,435,606 16,254,344 33,565,969 30,475,770Minority Interests 712,022 751,245 Total Equity 34,277,991 31,227,015 P 57,055,782 P 59,689,945
See accompanying Notes to Unaudited Consolidated Financial Statements
- 12 -
UNIVERSAL ROBINA CORPORATION AND SUBSIDIARIES Unaudited Consolidated Statements of Income (In Thousand Pesos, Except Per Share Amount)
Income from operations 811,780 597,701 2,423,449 2,204,031Mark to market gain (loss) on
financial instruments at fair value through profit and loss (63,210) (701,168) 331,671 (658,890)
Foreign exchange gain (loss) (128,664) 83,593 (227,911) (6,705)Investment income 407,299 533,672 1,237,377 1,711,243Equity in net earnings 4,325 85,810 17,669 259,045Finance costs (365,274) (546,792) (1,264,765) (1,752,844)Impairment loss – – (435,000) –Gain on sale of equity investment – – 2,858,765 –Other income – net 36,749 54,529 86,005 128,440Income before income tax and
minority interest 703,005 107,345 5,027,260 1,884,321 Provision for income tax
Current 58,588 40,943 342,501 261,921
Deferred 69,616 (31,030) (9,633) 58,241 128,204 9,913 332,868 320,162 Net Income P 574,081 P 97,432 P 4,694,392 P 1,564,159 Attributable to: Equity holders of the parent P 592,218 P 138,684 P 4,692,121 P 1,550,270Minority Interest (17,417) (41,252) 2,271 13,889 P574,081 P 97,432 P 4,694,392 P 1,564,159 Basic and diluted earnings per share attributable to the common equity holders of the parent (Note 14)
P 0.27
P 0.06
P 2.11
P 0.70 See accompanying Notes to Unaudited Consolidated Financial Statements
- 13 -
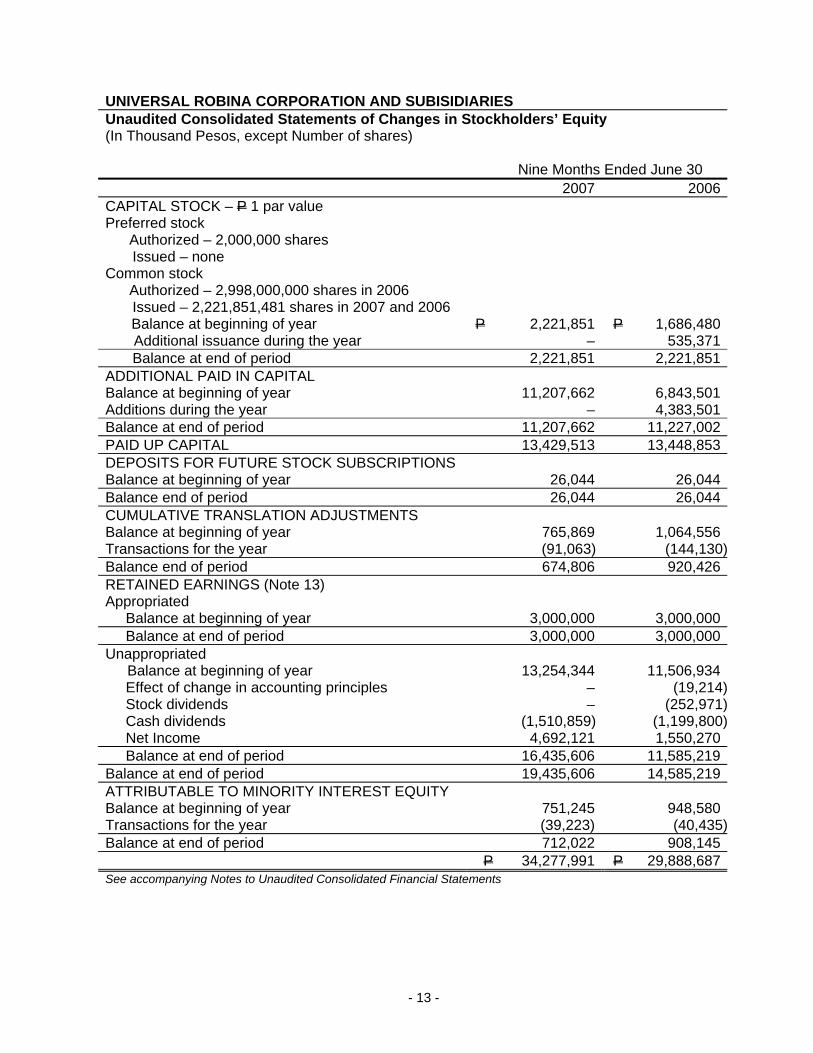
UNIVERSAL ROBINA CORPORATION AND SUBISIDIARIES Unaudited Consolidated Statements of Changes in Stockholders’ Equity (In Thousand Pesos, except Number of shares)
Nine Months Ended June 30
2007 2006CAPITAL STOCK – P 1 par value Preferred stock
Authorized – 2,000,000 shares Issued – none Common stock Authorized – 2,998,000,000 shares in 2006 Issued – 2,221,851,481 shares in 2007 and 2006 Balance at beginning of year P 2,221,851 P 1,686,480 Additional issuance during the year – 535,371 Balance at end of period 2,221,851 2,221,851ADDITIONAL PAID IN CAPITAL Balance at beginning of year 11,207,662 6,843,501Additions during the year – 4,383,501Balance at end of period 11,207,662 11,227,002PAID UP CAPITAL 13,429,513 13,448,853DEPOSITS FOR FUTURE STOCK SUBSCRIPTIONS Balance at beginning of year 26,044 26,044Balance end of period 26,044 26,044CUMULATIVE TRANSLATION ADJUSTMENTS Balance at beginning of year 765,869 1,064,556Transactions for the year (91,063) (144,130)Balance end of period 674,806 920,426RETAINED EARNINGS (Note 13) Appropriated Balance at beginning of year 3,000,000 3,000,000 Balance at end of period 3,000,000 3,000,000Unappropriated Balance at beginning of year 13,254,344 11,506,934 Effect of change in accounting principles – (19,214) Stock dividends – (252,971) Cash dividends (1,510,859) (1,199,800) Net Income 4,692,121 1,550,270 Balance at end of period 16,435,606 11,585,219Balance at end of period 19,435,606 14,585,219ATTRIBUTABLE TO MINORITY INTEREST EQUITY Balance at beginning of year 751,245 948,580Transactions for the year (39,223) (40,435)Balance at end of period 712,022 908,145 P 34,277,991 P 29,888,687See accompanying Notes to Unaudited Consolidated Financial Statements
- 14 -
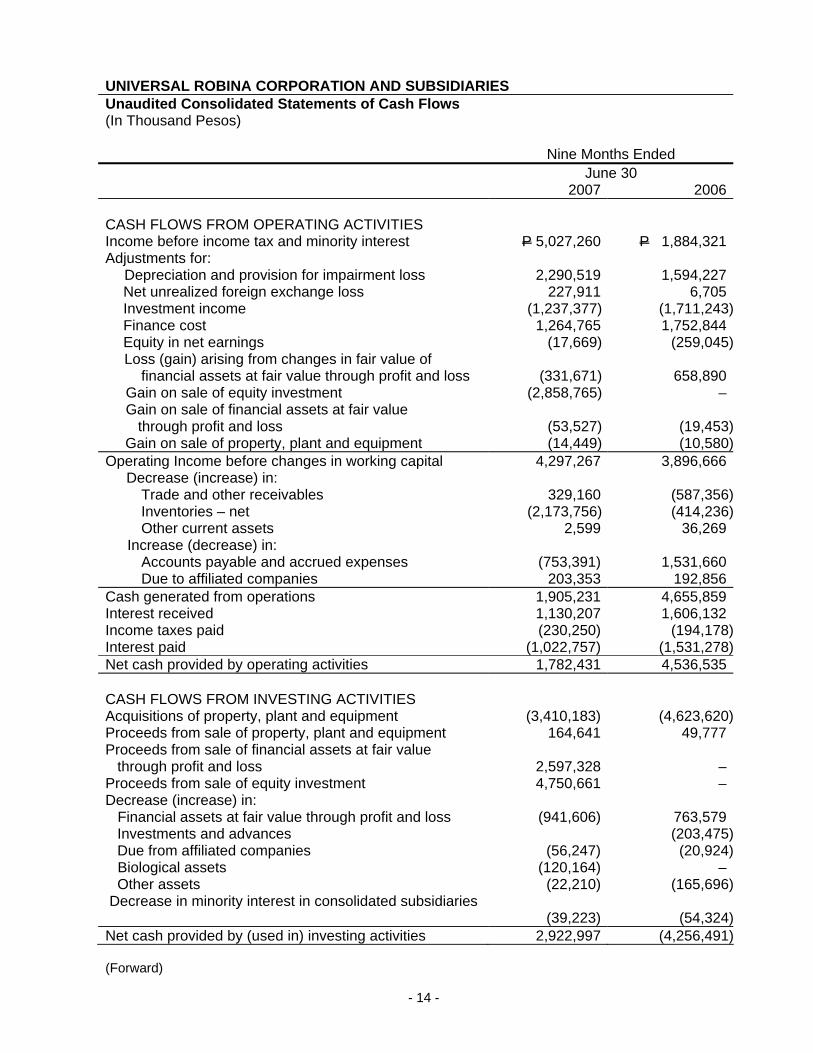
UNIVERSAL ROBINA CORPORATION AND SUBSIDIARIES Unaudited Consolidated Statements of Cash Flows (In Thousand Pesos)
Nine Months Ended
June 30 2007 2006
CASH FLOWS FROM OPERATING ACTIVITIES Income before income tax and minority interest
P 5,027,260 P 1,884,321 Adjustments for: Depreciation and provision for impairment loss 2,290,519 1,594,227 Net unrealized foreign exchange loss 227,911 6,705 Investment income (1,237,377) (1,711,243) Finance cost 1,264,765 1,752,844 Equity in net earnings (17,669) (259,045) Loss (gain) arising from changes in fair value of
financial assets at fair value through profit and loss
(331,671) 658,890 Gain on sale of equity investment (2,858,765) – Gain on sale of financial assets at fair value through profit and loss
(53,527) (19,453)
Gain on sale of property, plant and equipment (14,449) (10,580)Operating Income before changes in working capital 4,297,267 3,896,666 Decrease (increase) in: Trade and other receivables
329,160 (587,356)
Inventories – net (2,173,756) (414,236) Other current assets 2,599 36,269 Increase (decrease) in: Accounts payable and accrued expenses (753,391) 1,531,660 Due to affiliated companies 203,353 192,856Cash generated from operations 1,905,231 4,655,859Interest received 1,130,207 1,606,132Income taxes paid (230,250) (194,178)Interest paid (1,022,757) (1,531,278)Net cash provided by operating activities 1,782,431 4,536,535 CASH FLOWS FROM INVESTING ACTIVITIES
Acquisitions of property, plant and equipment (3,410,183) (4,623,620)Proceeds from sale of property, plant and equipment 164,641 49,777Proceeds from sale of financial assets at fair value
through profit and loss 2,597,328 –Proceeds from sale of equity investment 4,750,661 –Decrease (increase) in: Financial assets at fair value through profit and loss (941,606) 763,579 Investments and advances (203,475) Due from affiliated companies (56,247) (20,924) Biological assets (120,164) – Other assets (22,210) (165,696) Decrease in minority interest in consolidated subsidiaries
CASH FLOWS FROM FINANCING ACTIVITIES Payments of: Short-term borrowings
(309,576) (612,716)
Long–term debt (4,769,249) (2,120,317) Cash dividends (1,510,859) (1,199,800)Trust receipts and acceptances payable (642,384) (1,172,162)Proceeds from primary offering – 4,665,901Net cash used in financing activities (7,232,068) (439,094) NET DECREASE IN CASH AND CASH
EQUIVALENTS
(2,526,640) (159,050) CASH AND CASH EQUIVALENTS AT BEGINNING OF YEAR
5,979,875 930,303 CASH AND CASH EQUIVALENTS AT END OF YEAR
P 3,453,235 P 771,253
See Accompanying Notes to Unaudited Consolidated Financial Statements
- 16 -
UNIVERSAL ROBINA CORPORATION AND SUBSIDIARIES Notes to Unaudited Consolidated Financial Statements (In Thousand Pesos, Except Per Share Amounts) 1. Basis of Preparation The unaudited consolidated financial statements of Universal Robina Corporation and
Subsidiaries (the Group) have been prepared in compliance with Philippine Financial Reporting Standards.
These interim financial statements followed the same accounting policies and methods of
computation by which the most recent annual audited financial statements have been prepared. The preparation of financial statements in compliance with Philippine Financial Reporting Standards requires the Group to make estimates and assumptions that affect the reported amounts on income, expenses, assets and liabilities and disclosures of contingent assets and liabilities. There were no changes in estimates of amounts reported in prior interim periods of the current fiscal year or changes in estimates of amounts reported in prior financial years that would have a material effect in the current interim period. Actual results could differ from those estimates. Management believes that actual results will not be materially different from those estimates.
The following are the revised accounting standards which the Group adopted on the Group’s
financial statements beginning the fiscal year ended September 30, 2006:
New Accounting Standards: - PFRS1, First Time Adoption of PFRS - PFRS 5, Noncurrent Assets Held for Sales and Discontinued Operations - PAS 1, Presentation of Financial Statements - PAS 2, Inventories - PAS 8, Accounting Policies, Changes in Accounting Estimates and Errors - PAS 10, Events After the Balance Sheet Date - PAS 16, Property, Plant and Equipment - PAS 17, Leases - PAS 19, Employee Benefits - PAS 24, Related Party Disclosures - PAS 27, Consolidated and Separate Financial Statements - PAS 28, Investments in Associates - PAS 31, Interest in Joint Ventures - PAS 32, Financial Instruments: Disclosure and Presentation - PAS 33, Earnings per share - PAS 39, Financial Instruments: Recognition and Measurement
2. Principles of Consolidation
The unaudited consolidated financial statements for the nine (9) months ended June 30, 2007
and 2006 represent the consolidation of the financial statements of Universal Robina Corporation (the Parent Company) and the following subsidiaries directly and indirectly owned by the Parent Company:
URC Confectionery Corp. 100.0 – 100.0 100.0 URC International Company Limited 77.0 – 77.0 – Hongkong China Foods Co. Ltd. – 77.0 – 77.0 URC Asean Brands Co. Ltd. – 77.0 – 77.0 Nissin-Universal Robina Corporation 65.0 – 65.0 – Southern Negros Development Corporation – 94.0 – 94.0 URC China Commercial Co. Ltd. 100.0 – – – South Luzon Green Land, Inc. (SLGL) 100.0 – – –
The investments in associates include the 50% and 19% equity in Hunt-Universal Robina
Corporation (HUR), and Robinsons Land Corporation (RLC), respectively. The financial information of these associates is summarized as follows:
RLC HUR Unaudited June 30 2007 2006 2007 2006Revenue P – P 5,278,911 P450,241 P 401,694Cost and Expenses – 3,418,402 401,586 371,101Income from Operations – 1,860,509 48,655 30,593Net Income P – P 1,224,655 P35,337 P 22,272
In October 2006, URC sold all of its shareholdings in RLC.
3. Cash and Cash Equivalents This account consists of: Unaudited
June 30, 2007
AuditedSeptember 30,
2006Cash on hand P 162,732 P 116,309 Cash in banks 359,064 1,047,715 Short-term investments 2,931,439 4,815,851 P 3,453,235 P 5,979,875
- 18 -
4. Trade and Other Receivables – net
This account consists of: Unaudited June 30, 2007
Up to Six Months
Over Six Months to One Year Total
Audited September 30,
2006Trade receivables – net P2,707,475 P 251,738 P 2,959,213 P 3,247,843 Other receivables 816,600 643,328 1,459,928 1,393,288 P3,524,075 P 895,066 P 4,419,141 P 4,641,131
5. Due from Affiliated Companies
This account consists of: Unaudited
June 30, 2007
AuditedSeptember 30,
2006Digital Telecommunications Philippines, Inc. P 219,269 P 190,784 Litton Mills, Inc. 148,873 147,720Hunts - Universal Robina Corporation 43,126 32,564 Cebu Air, Inc. 60,934 31,157 JG Summit Holdings, Inc. – 36,173Others 61,027 38,584 P 533,229 P 476,982
6. Inventories
This account consists of:
Unaudited
June 30, 2007
AuditedSeptember 30,
2006Finished goods – net P 2,149,108 P 1,253,578 Goods in process 136,807 154,978 Raw materials 2,386,833 1,791,184 Containers and packaging materials 1,097,306 915,193 Spare parts and supplies 847,285 649,574 Less: Allowance for Inventory writedown (131,517) (101,385) 6,485,822 4,663,122Materials in transit 1,079,525 728,469 P 7,565,347 P 5,391,591
- 19 -
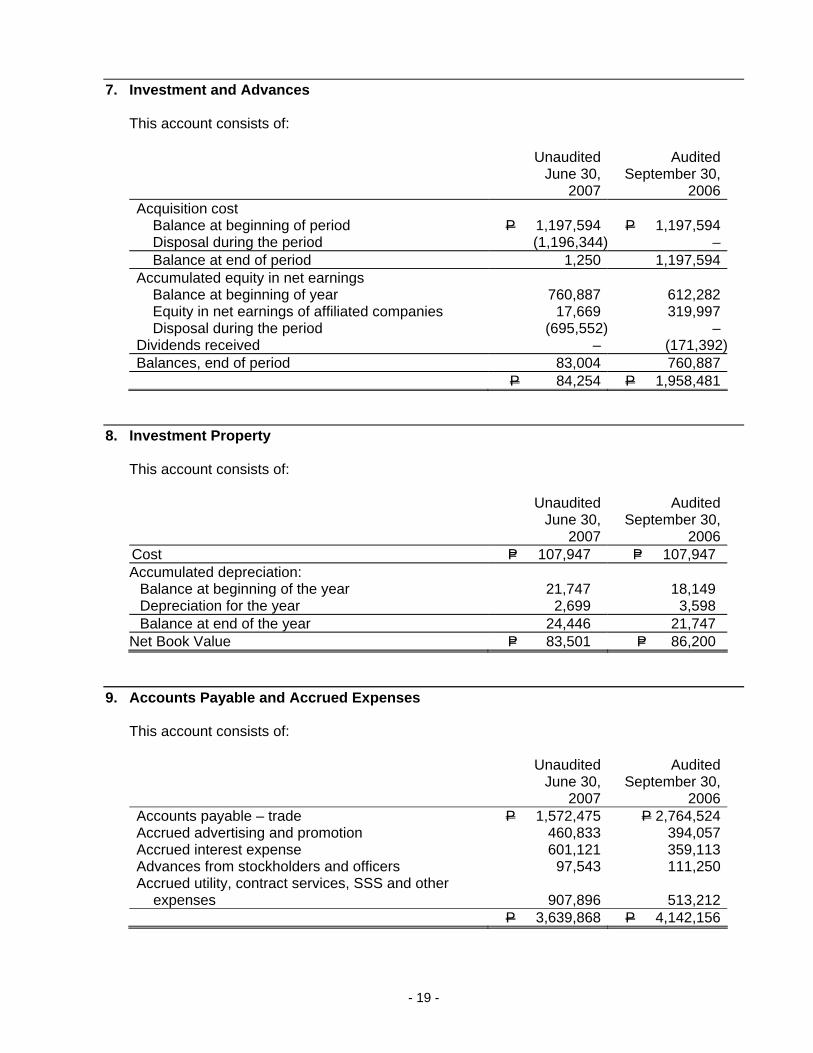
7. Investment and Advances
This account consists of:
Unaudited
June 30, 2007
AuditedSeptember 30,
2006Acquisition cost Balance at beginning of period P 1,197,594 P 1,197,594 Disposal during the period (1,196,344) – Balance at end of period 1,250 1,197,594Accumulated equity in net earnings Balance at beginning of year 760,887 612,282 Equity in net earnings of affiliated companies 17,669 319,997 Disposal during the period (695,552) –Dividends received – (171,392)Balances, end of period 83,004 760,887 P 84,254 P 1,958,481
Balance at beginning of the year 21,747 18,149 Depreciation for the year 2,699 3,598 Balance at end of the year 24,446 21,747
Net Book Value P= 83,501 P= 86,200 9. Accounts Payable and Accrued Expenses
This account consists of: Unaudited
June 30, 2007
AuditedSeptember 30,
2006Accounts payable – trade P 1,572,475 P 2,764,524 Accrued advertising and promotion 460,833 394,057 Accrued interest expense 601,121 359,113 Advances from stockholders and officers 97,543 111,250 Accrued utility, contract services, SSS and other
expenses 907,896 513,212 P 3,639,868 P 4,142,156
- 20 -
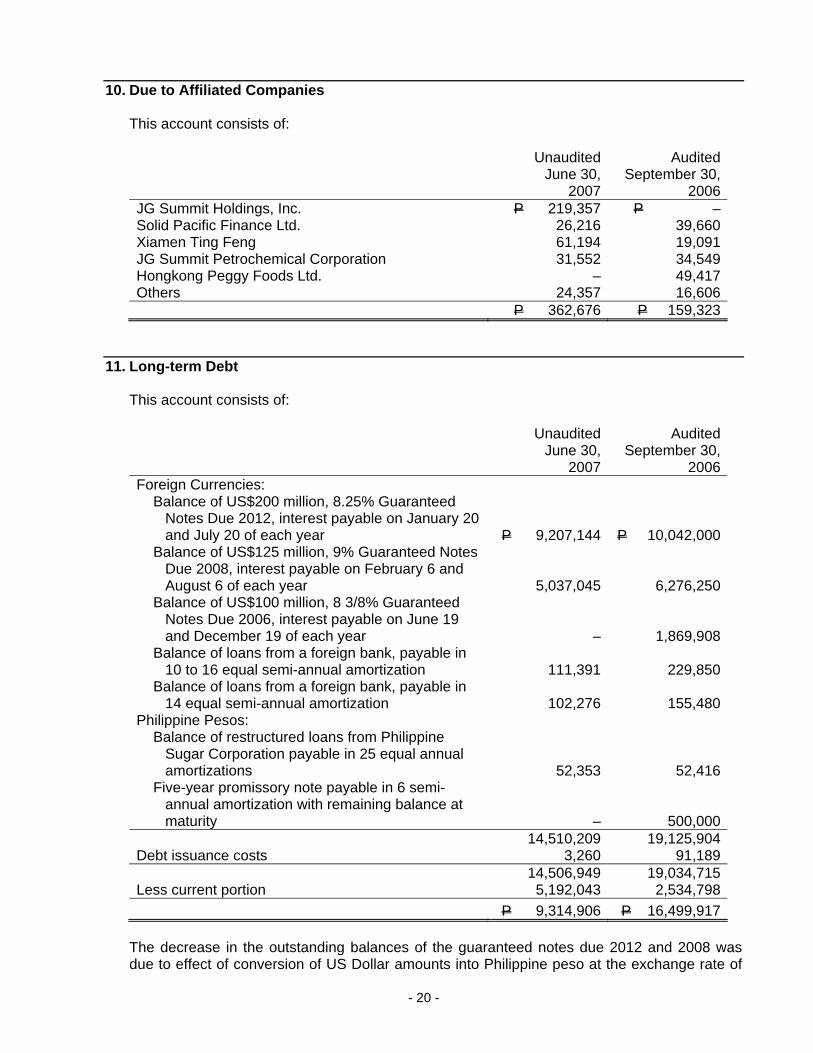
10. Due to Affiliated Companies
This account consists of: Unaudited
June 30, 2007
AuditedSeptember 30,
2006JG Summit Holdings, Inc. P 219,357 P –Solid Pacific Finance Ltd. 26,216 39,660Xiamen Ting Feng 61,194 19,091JG Summit Petrochemical Corporation 31,552 34,549Hongkong Peggy Foods Ltd. – 49,417 Others 24,357 16,606 P 362,676 P 159,323
11. Long-term Debt
This account consists of: Unaudited
June 30, 2007
AuditedSeptember 30,
2006Foreign Currencies:
Balance of US$200 million, 8.25% Guaranteed Notes Due 2012, interest payable on January 20 and July 20 of each year P 9,207,144 P 10,042,000
Balance of US$125 million, 9% Guaranteed Notes Due 2008, interest payable on February 6 and August 6 of each year 5,037,045 6,276,250
Balance of US$100 million, 8 3/8% Guaranteed Notes Due 2006, interest payable on June 19 and December 19 of each year – 1,869,908
Balance of loans from a foreign bank, payable in 10 to 16 equal semi-annual amortization 111,391 229,850
Balance of loans from a foreign bank, payable in 14 equal semi-annual amortization 102,276 155,480
Philippine Pesos: Balance of restructured loans from Philippine
Sugar Corporation payable in 25 equal annual amortizations 52,353 52,416
Five-year promissory note payable in 6 semi-annual amortization with remaining balance at maturity – 500,000
14,510,209 19,125,904Debt issuance costs 3,260 91,189 14,506,949 19,034,715Less current portion 5,192,043 2,534,798 P 9,314,906 P 16,499,917
The decrease in the outstanding balances of the guaranteed notes due 2012 and 2008 was due to effect of conversion of US Dollar amounts into Philippine peso at the exchange rate of
- 21 -
US$1: P46.24 at June 30, 2007 against US$1: P50.21 at September 30, 2006. Furthermore, the guaranteed notes due 2008 was net of US$15 million worth of notes reacquired during the current period.
12. Capital Stock
Unaudited June 30,
2007
AuditedSeptember 30,
2006Preferred stock – P1 par value
Authorized – 2,000,000 shares Issued – none
Common stock – P1 par value Authorized – 2,998,000,000 shares Issued – 2,221,851,481 shares in 2007 and 2006 P 2,221,851 P 2,221,851
The preferred stock is 12% cumulative, nonparticipating, nonvoting, and redeemable at par upon dissolution and liquidation of the Company. On October 7, 2005, the Board of Directors approved the increase in the authorized capital stock from 2,000,000,000 divided into 1,998,000,000 common shares and 2,000,000 preferred shares both at P 1 par value per share to 3,000,000,000 divided into 2,998,000,000 common shares and 2,000,000 preferred shares both at P 1 par value per share. On a special meeting of the stockholders held on November 22, 2005, the stockholders also approved the above increase in the authorized capital stock and the 15% stock dividends to all stockholders of record as of January 14, 2006, which was subsequently approved by the SEC on December 16, 2005. On December 19, 2005, the SEC authorized the issuance of 252,971,932 common shares with P 1 par value per share or P 252,971,932 to cover the 15% stock dividends declared by the Board of Directors and ratified by the stockholders.
13. Retained Earnings
A portion of the unappropriated retained earnings representing the undistributed earnings of the investee companies is not available for dividend declaration until received in the form of dividends.
14. Earnings Per Share
Earnings per share amounts were computed as follows:
Quarters Ended June 30 Nine Months June 30 2007 2006 2007 2006 Net income P 592,218 P 138,684 P 4,692,121 P 1,550,270
Divide by the number
of shares issued
2,221,851,481
2,221,851,481
2,221,851,481
2,221,851,481 P 0.27 P 0.06 P 2.11 P 0.70
- 22 -
15. Business Segment Information
The industry segments where the Group operates are as follows:
a. Branded consumer food products - manufactures and distributes a diverse mix of snack
foods, instant coffee products, instant noodles, chocolates, soft and hard candies, biscuits, pasta, tomato-based products and ready-to-drink beverages. Its revenues are in their peak during the opening of classes in June and Christmas season.
b. Agro-industrial products - engages in hog and poultry farming, manufactures and
distributes branded and unbranded animal feeds, corn products and vegetable oils, and produces and distributes animal health products. Its peak season is during summer.
c. Commodity food products - engages in sugar milling and refining, flour milling and pasta
manufacturing. The peak season for sugar is during its crop season, which normally starts in September and ends in May of the following year.
d. Packaging - engages in manufacture of bi-axially polypropylene films for packaging
companies. e. Corporate businesses - engages in bonds and securities investment and fund sourcing
activities. Financial information about the operations of these business segments is summarized as follows:
Revenue Total Assets Total Liabilities Unaudited June 20
2007 2006 2007 2006 2007 2006 Branded Consumer Food Products P 20,249,180 P 18,772,640 P 25,545,207 P 24,922,037 P 6,631,317 P 7,095,779
P 27,481,008 P 26,043,422 P 57,055,782 P 57,591,300 P 22,777,791 P 27,702,619
16. Contingencies
The Group has various contingent liabilities arising in the ordinary conduct of business which are either pending decision by the courts or are being contested, the outcome of which are not presently determinable. In the opinion of management and its legal counsel, the eventual liability under these claims, if any, will not have a material or adverse effect on the Group's financial position and results of operations. There were no significant changes in the contingent liabilities as of to date.
- 23 -
17. Subsequent Events
There were no material events that occurred subsequent to June 30, 2007 that were not reflected in the financial statements for the period.