39
Security Attribute Evaluation Method: A Cost Benefit Analysis Shawn A. Butler Computer Science Department Carnegie Mellon University 9 November 2001
| Date post: | 21-Dec-2015 |
| Category: |
Documents |
| View: | 215 times |
| Download: | 2 times |
Security Attribute Evaluation Method: A Cost Benefit Analysis
Shawn A. ButlerComputer Science Department
Carnegie Mellon University9 November 2001
MS
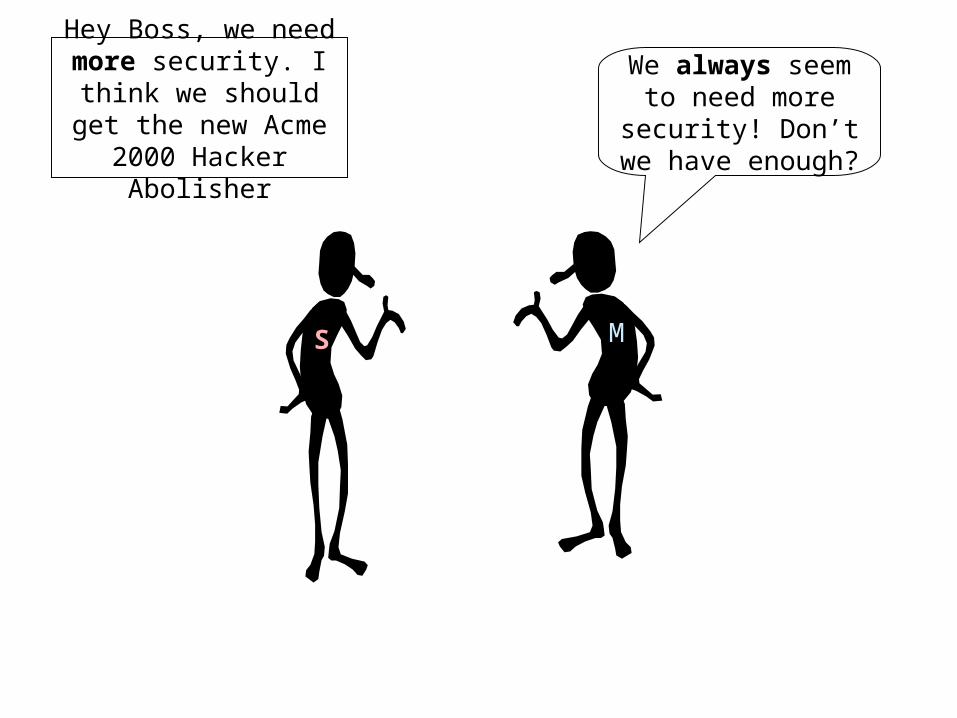
Hey Boss, we need more security. I think we
should get the new Acme 2000 Hacker Abolisher
We always seem to need more security!
Don’t we have enough?

MS
Trust me, we will be more secure!
What are my alternatives?
What is it going to cost?
What is the added value?

Value?
Alternatives?
S
Problem
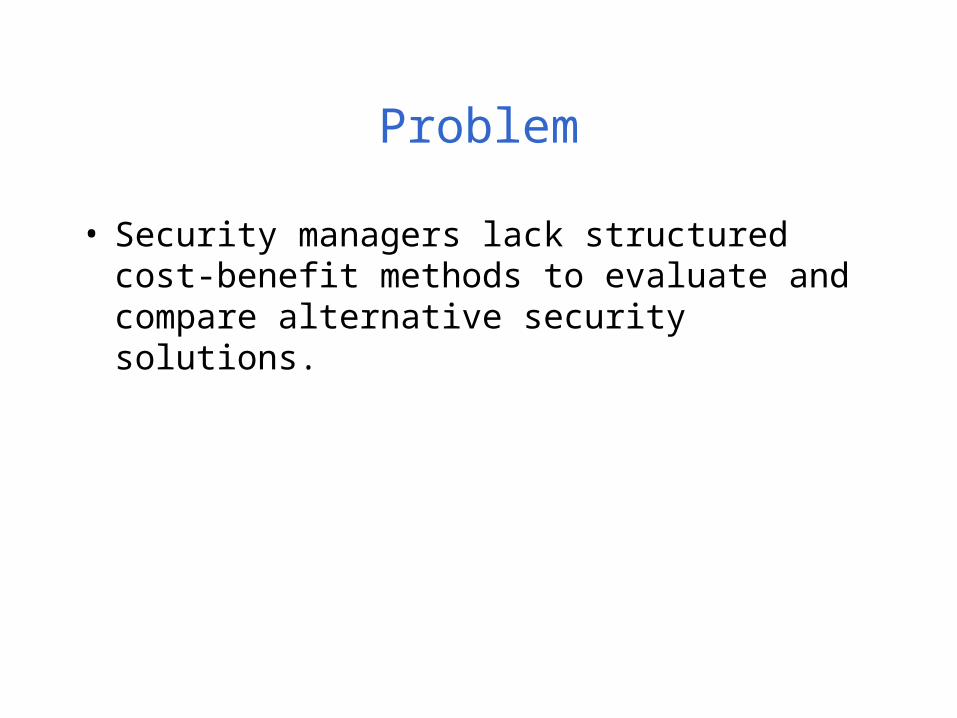
• Security managers lack structured cost-benefit methods to evaluate and compare alternative security solutions.
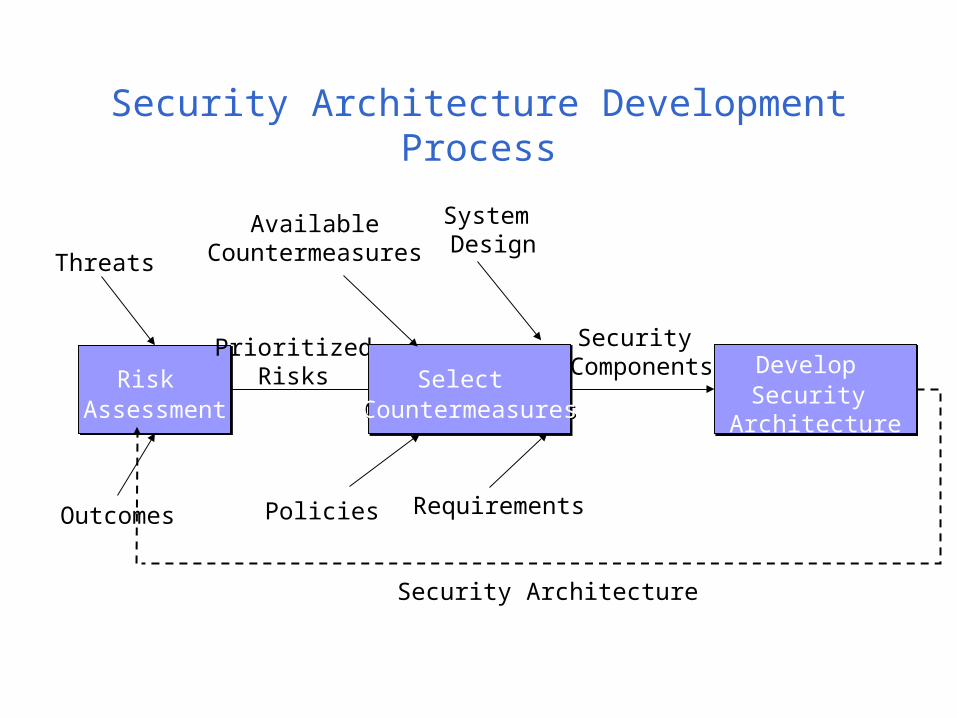
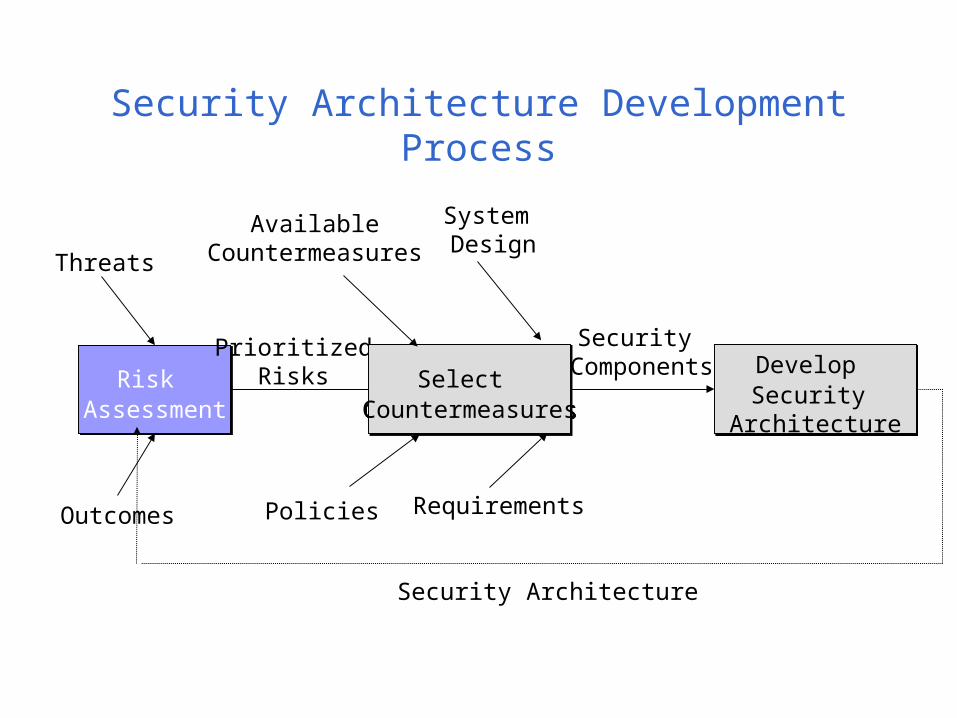
Security Architecture Development Process
Risk Assessment
Risk Assessment
Outcomes
Threats
PrioritizedRisks Select
CountermeasuresSelect
Countermeasures
System Design
Policies Requirements
AvailableCountermeasures
Security Components Develop
Security Architecture
Develop Security
Architecture
Security Architecture

The Multi Attribute Risk Assessment
1. Determine threats and outcomes2. Assess outcome attribute values3. Assess weights4. Compute threat indices5. Sensitivity Analysis
Risk Assessment
Risk Assessment
Outcomes
Threats
PrioritizedRisks
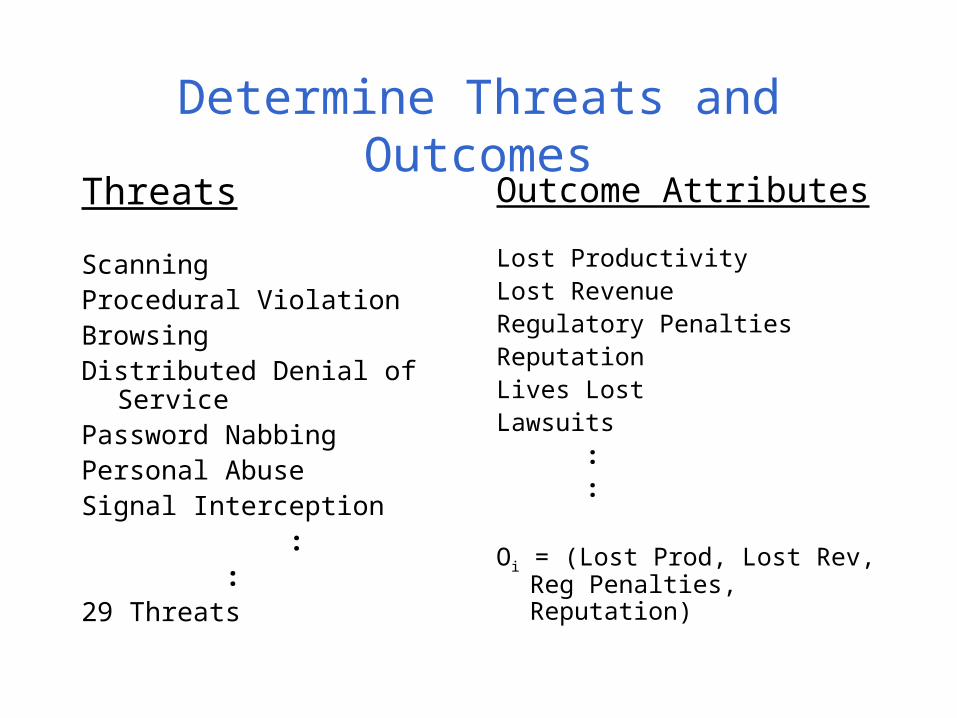
Threats
ScanningProcedural ViolationBrowsingDistributed Denial of
ServicePassword NabbingPersonal AbuseSignal Interception : :29 Threats
Determine Threats and Outcomes
Outcome Attributes
Lost ProductivityLost RevenueRegulatory PenaltiesReputationLives LostLawsuits : :
Oi = (Lost Prod, Lost Rev, Reg Penalties, Reputation)
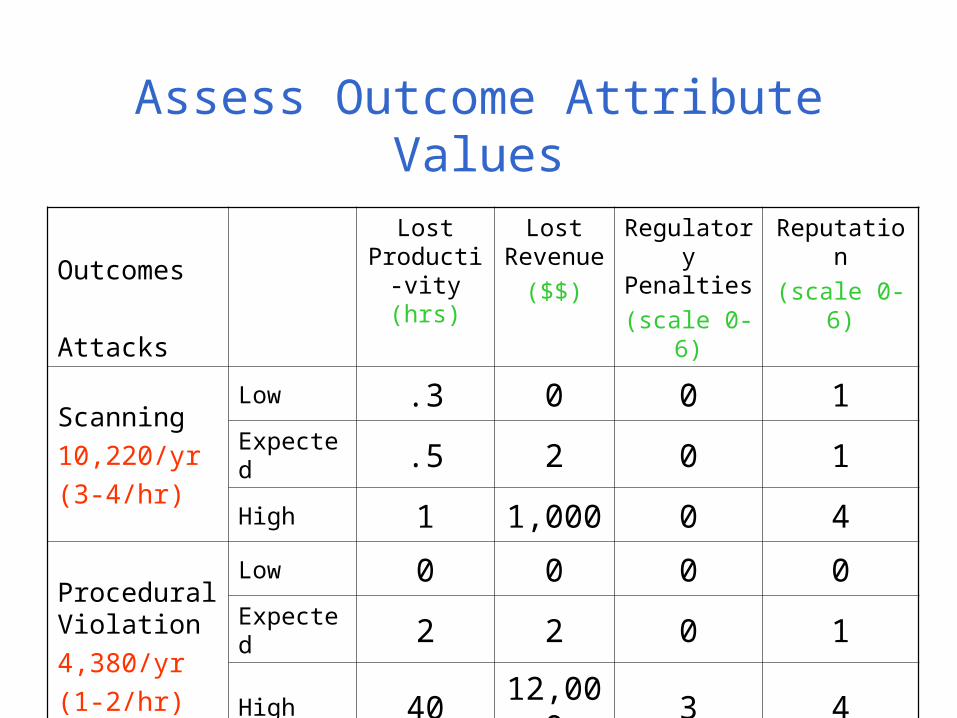
Assess Outcome Attribute Values
Outcomes
Attacks
Lost Producti-vity (hrs)
Lost Revenu
e($$)
Regulatory
Penalties(scale 0-6)
Reputation(scale 0-6)
Scanning10,220/yr(3-4/hr)
Low .3 0 0 1Expected .5 2 0 1
High 1 1,000 0 4
Procedural Violation4,380/yr(1-2/hr)
Low 0 0 0 0Expected 2 2 0 1
High 4012,00
03 4
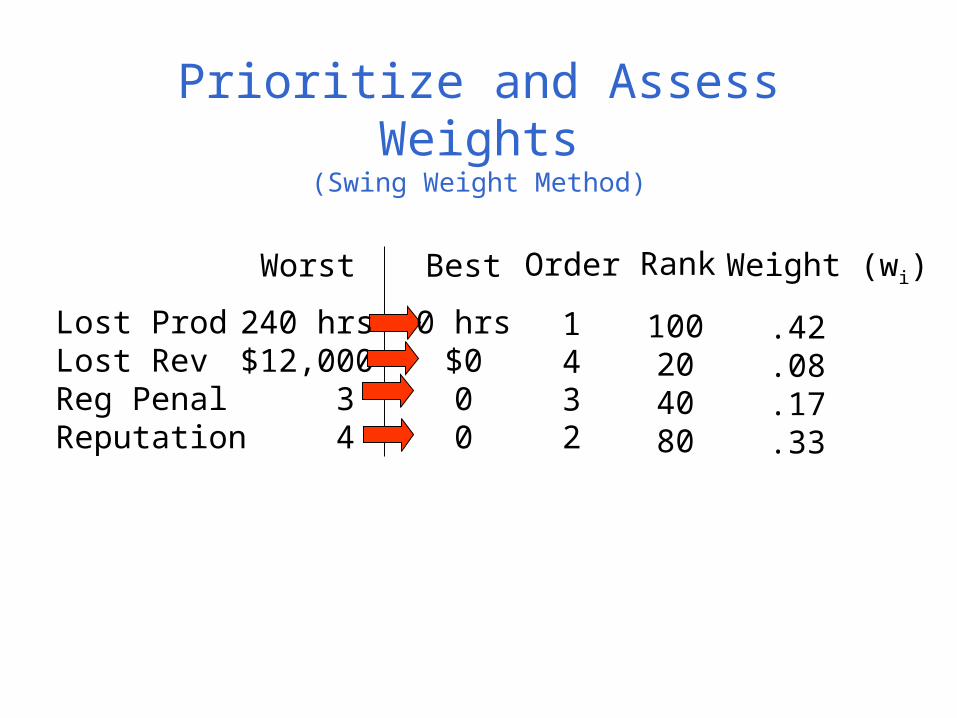
Prioritize and Assess Weights(Swing Weight Method)
BestWorst
Lost ProdLost RevReg PenalReputation
240 hrs$12,000 3 4
0 hrs$000
Rank
100204080
Weight (wi)
.42
.08
.17
.33
Order
1
2
43

Compute Threat IndicesHours + $$ + Reputation + Regulatory Penalties = ?
1
0
P: Lost Productivity R: Reputation G: Regulatory
PenaltiesL: Lost Revenue
1
0
1
0
1
012,000 240 340 000
So determine Value Functions Vj(xj)
L(x1) $$ + P(x2)Hours + R(x3)Reputation + G(x4)Regulatory Penalties = TI
Nonsense !
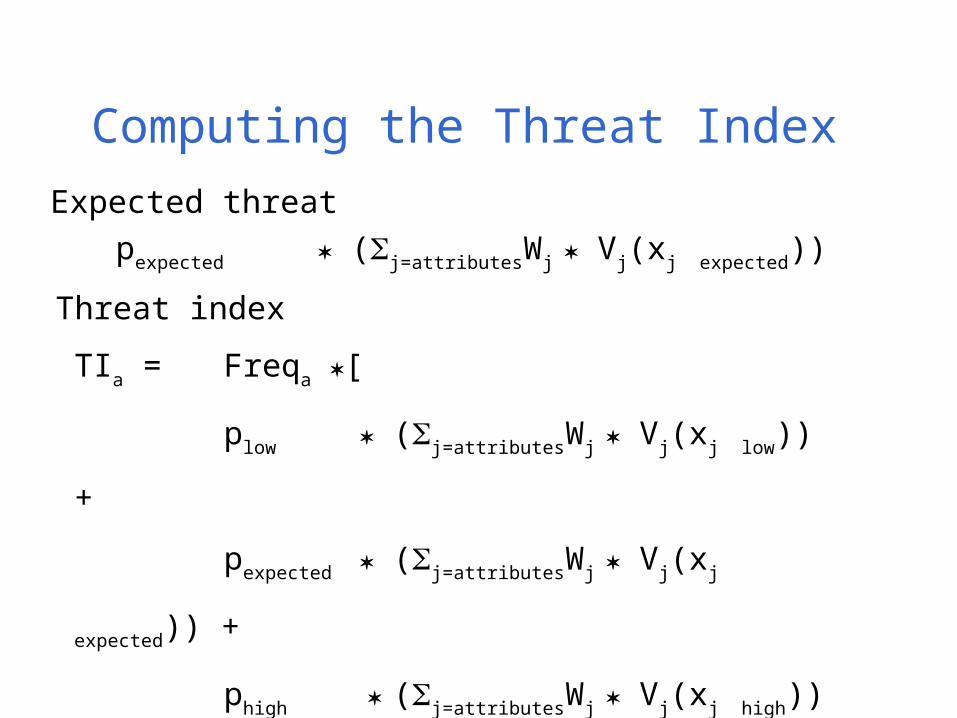
Computing the Threat Index
pexpected (j=attributesWj Vj(xj expected))
Expected threat
TIa = Freqa [
plow (j=attributesWj Vj(xj low)) +
pexpected (j=attributesWj Vj(xj expected)) +
phigh (j=attributesWj Vj(xj high))
]
Threat index
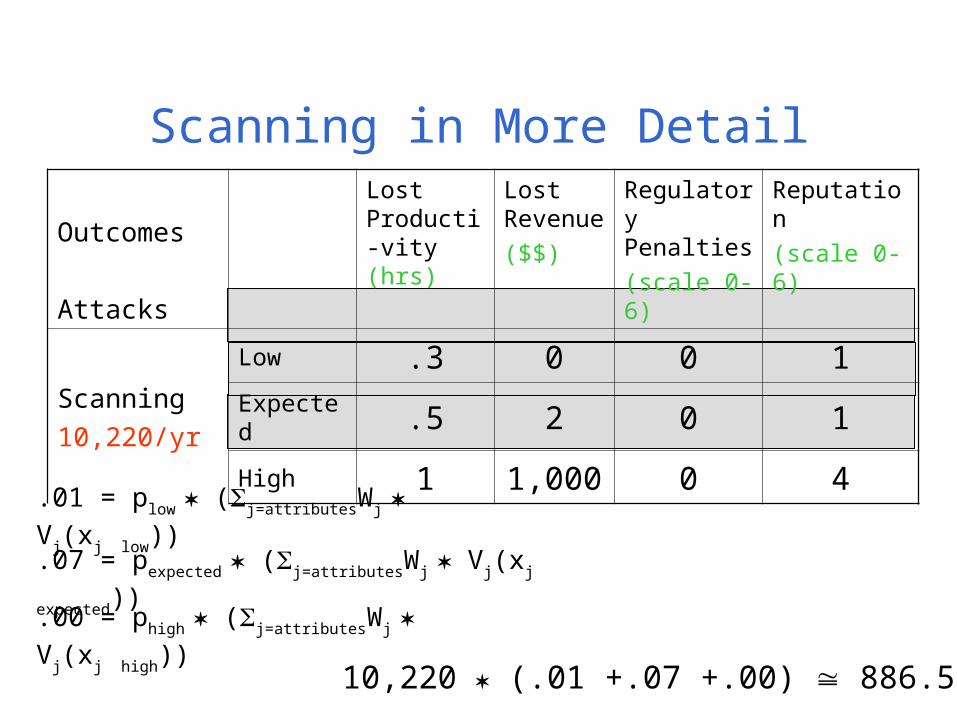
Scanning in More Detail Outcomes
Attacks
Lost Producti-vity (hrs)
Lost Revenue($$)
Regulatory Penalties(scale 0-6)
Reputation(scale 0-6)
Scanning10,220/yr
Low .3 0 0 1Expected .5 2 0 1
High 1 1,000 0 4.01 = plow (j=attributesWj Vj(xj
low)).07 = pexpected (j=attributesWj Vj(xj expected))
.00 = phigh (j=attributesWj Vj(xj
high)) 10,220 (.01 +.07 +.00) 886.57
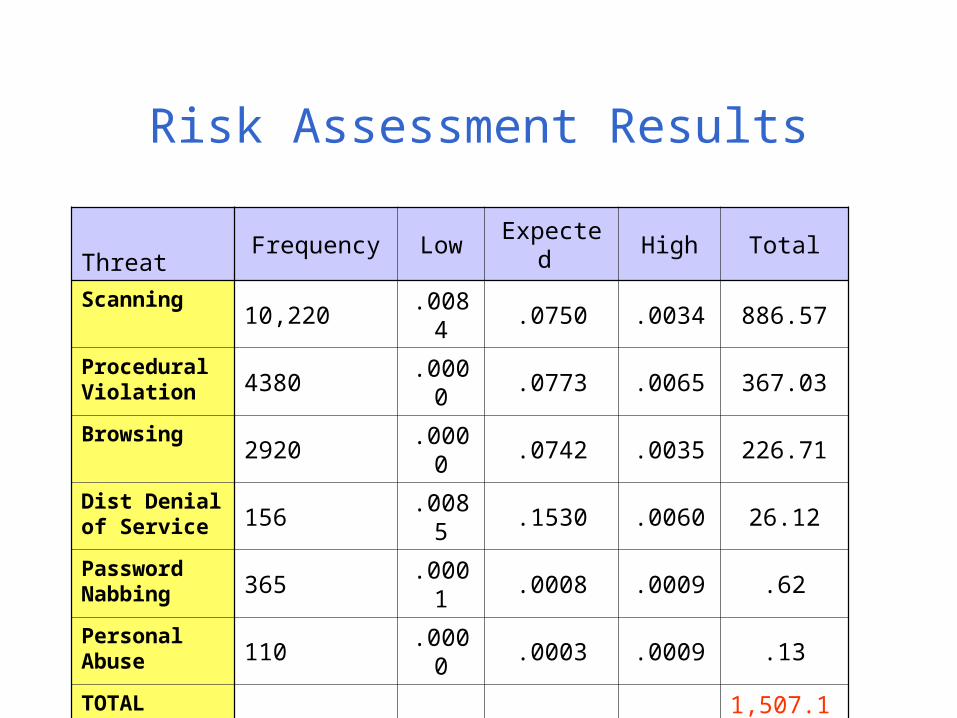
Risk Assessment Results
ThreatFrequency Low Expected High Total
Scanning 10,220 .0084 .0750 .0034 886.57
Procedural Violation 4380 .0000 .0773 .0065 367.03
Browsing 2920 .0000 .0742 .0035 226.71
Dist Denial of Service 156 .0085 .1530 .0060 26.12
Password Nabbing 365 .0001 .0008 .0009 .62
Personal Abuse 110 .0000 .0003 .0009 .13
TOTAL 1,507.18

But what about the numbers?
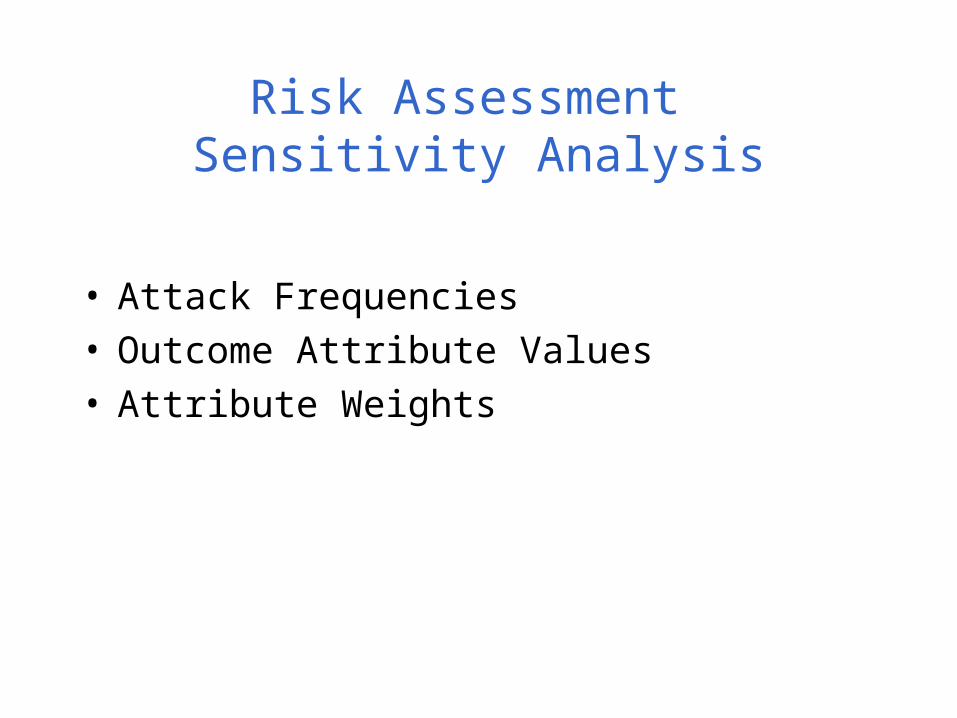
Risk Assessment Sensitivity Analysis
• Attack Frequencies• Outcome Attribute Values• Attribute Weights
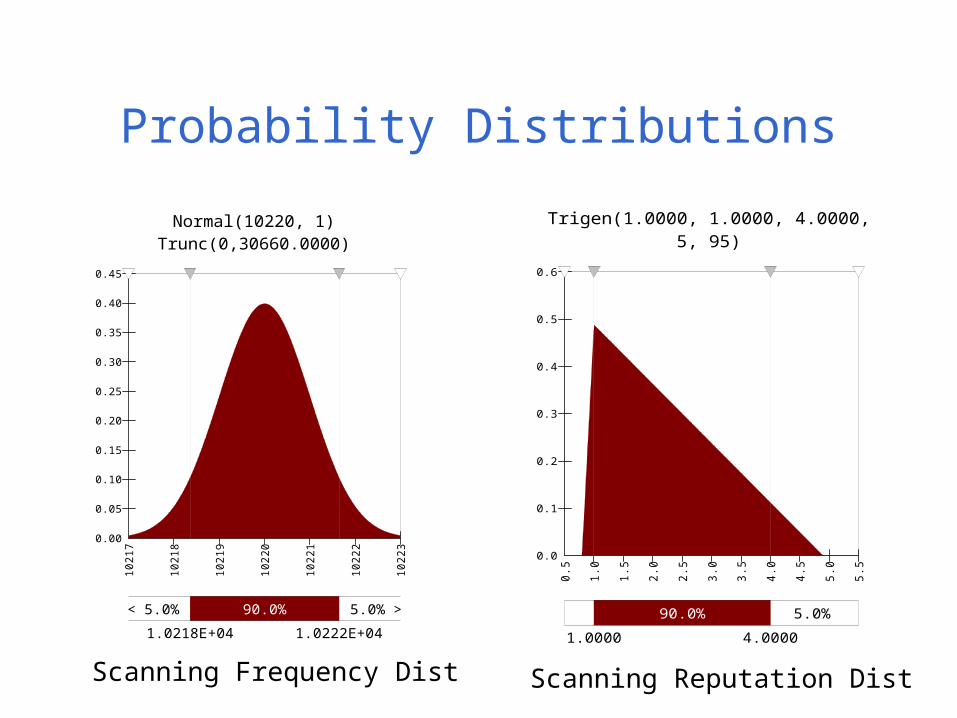
Probability Distributions
Normal(10220, 1)Trunc(0,30660.0000)
0.00
0.05
0.10
0.15
0.20
0.25
0.30
0.35
0.40
0.45
10217
10218
10219
10220
10221
10222
10223
< >5.0% 5.0%90.0%1.0218E+04 1.0222E+04
Trigen(1.0000, 1.0000, 4.0000,5, 95)
0.0
0.1
0.2
0.3
0.4
0.5
0.6
0.5
1.0
1.5
2.0
2.5
3.0
3.5
4.0
4.5
5.0
5.5
5.0%90.0%
1.0000 4.0000
Scanning Frequency Dist Scanning Reputation Dist
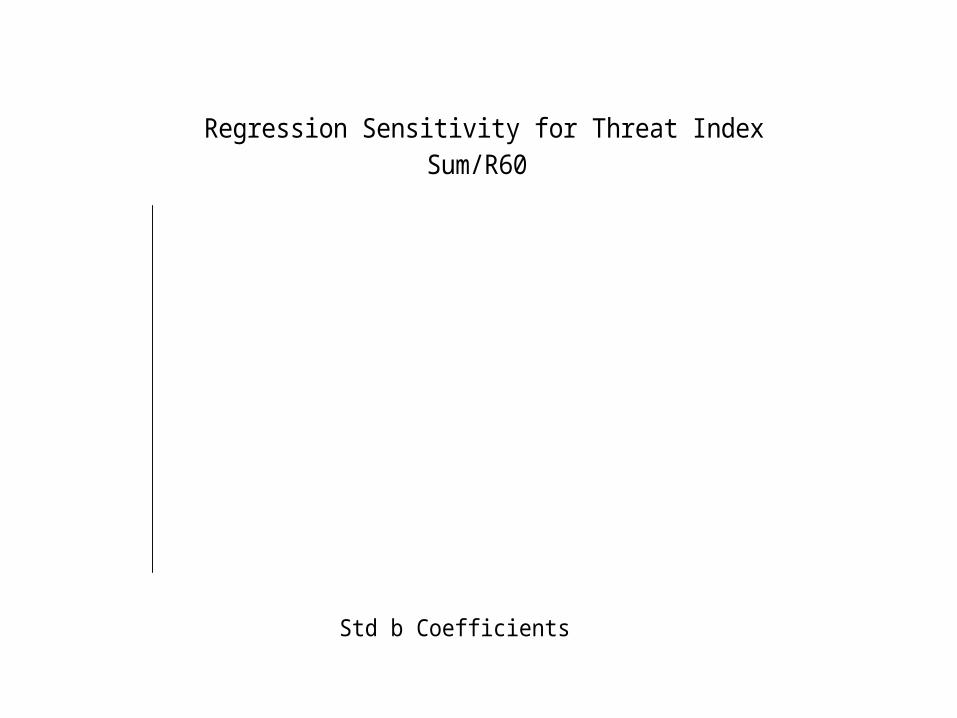
Regression Sensitivity for Threat IndexSum/R60
Std b Coefficients
Compromising Emanations / .../F58 .022 Trojan Horse / Low/F44 .024 DDoS / Low/I39 .026 Alteration / Low/F37 .029 Scanning / Ranking/C34 .029 Signal Interception / Low/L40 .03 Signal Interception / Low/F40 .055 Procedural Violation / Ran.../C35 .057 Procedural Violation / Low.../I35 .057
Lost Productivity/K30-.073 Procedural Violation / Low.../L35 .167 Browsing / Low/F36 .199 Signal Interception / Low/I40 .268 Procedural Violation / Low.../F35 .309 Scanning / Low/F34 .56 Reputation/K31 .568
-1 -0.75 -0.5 -0.25 0 0.25 0.5 0.75 1
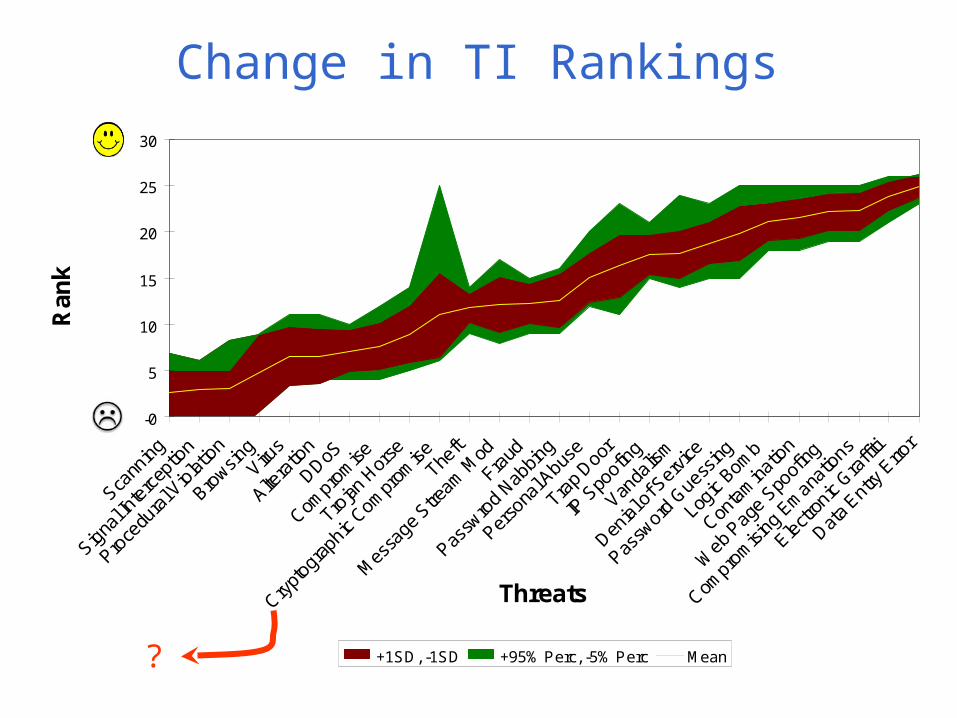
Change in TI Rankings
-0
5
10
15
20
25
30
Scann
ing
Signa
l Inte
rcep
tion
Proce
dura
l Vio
latio
n
Browsin
gViru
s
Altera
tion
DDoS
Compr
omise
Trojan
Hor
se
Crypto
grap
hic
Compr
omise
Theft
Mes
sage
Stre
am M
od
Fraud
Passw
rod
Nabbin
g
Perso
nal A
buse
Trap
Door
IP S
poof
ing
Vanda
lism
Denia
l of S
ervic
e
Passw
ord
Guess
ing
Logi
c Bom
b
Conta
mina
tion
Web
Pag
e Spo
ofing
Compr
omisi
ng E
man
atio
ns
Electr
onic
Graffi
ti
Data E
ntry
Erro
r
Threats
Ra
nk
+1SD, -1SD +95% Perc, -5% Perc Mean?
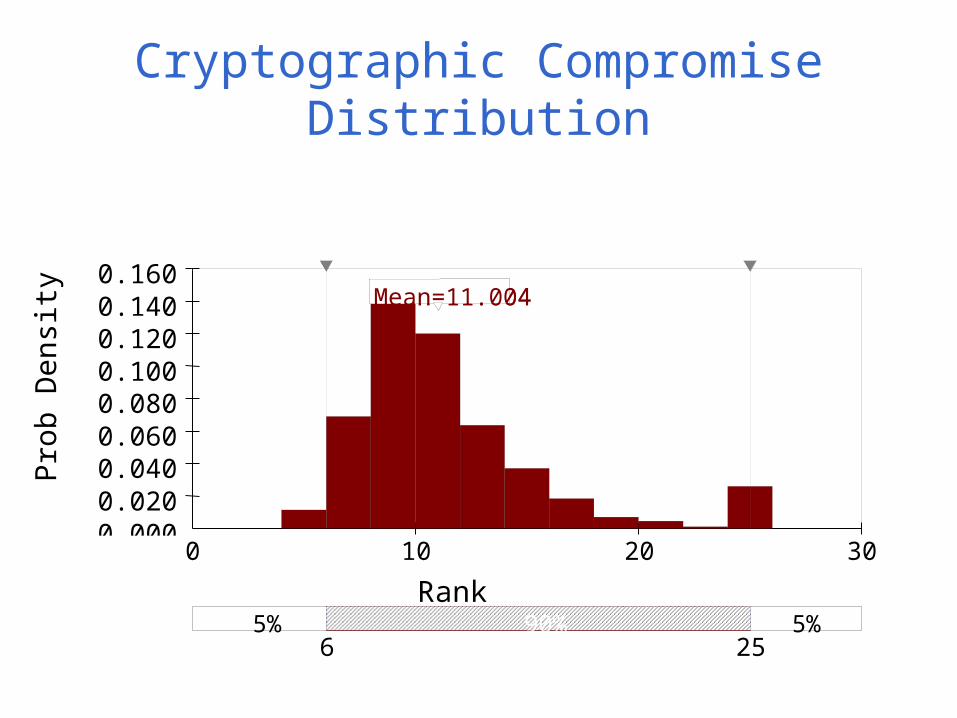
Cryptographic Compromise Distribution
Pro
b D
ensi
ty
Rank
0.0000.0200.0400.0600.0800.1000.1200.1400.160
Mean=11.004
0 10 20 300 10 20 30
5% 90% 5% 6 25
Mean=11.004
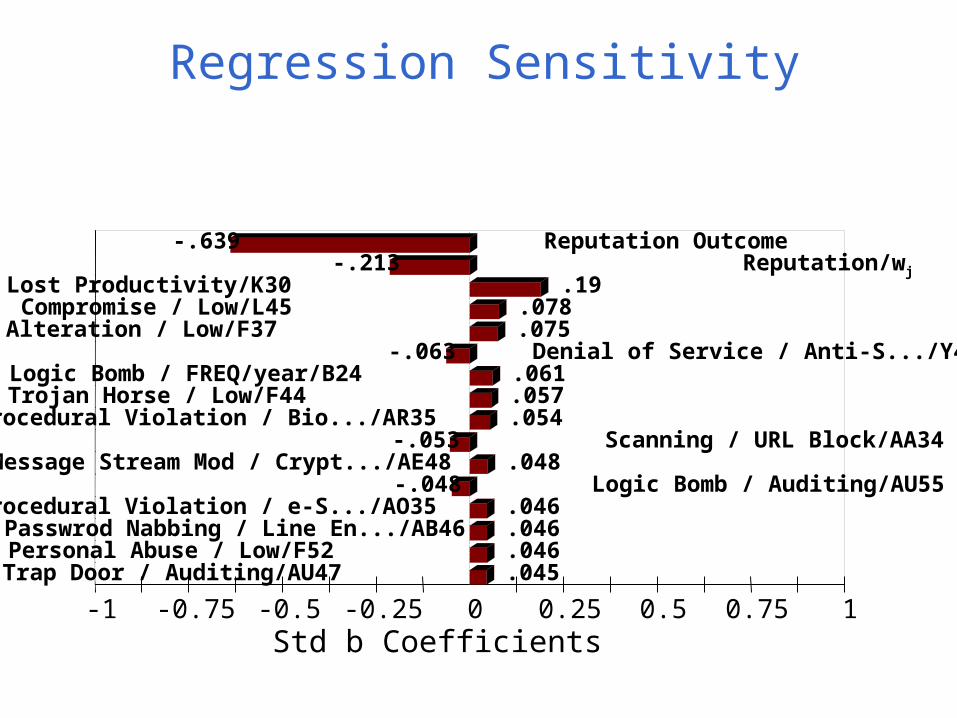
Regression Sensitivity
Std b Coefficients
Trap Door / Auditing/AU47 .045 Personal Abuse / Low/F52 .046 Passwrod Nabbing / Line En.../AB46 .046
Procedural Violation / e-S.../AO35 .046 Logic Bomb / Auditing/AU55-.048
Message Stream Mod / Crypt.../AE48 .048 Scanning / URL Block/AA34-.053
Procedural Violation / Bio.../AR35 .054 Trojan Horse / Low/F44 .057 Logic Bomb / FREQ/year/B24 .061
Denial of Service / Anti-S.../Y49-.063 Alteration / Low/F37 .075 Compromise / Low/L45 .078 Lost Productivity/K30 .19
Reputation/wj-.213 Reputation Outcome-.639
-1 -0.75 -0.5 -0.25 0 0.25 0.5 0.75 1
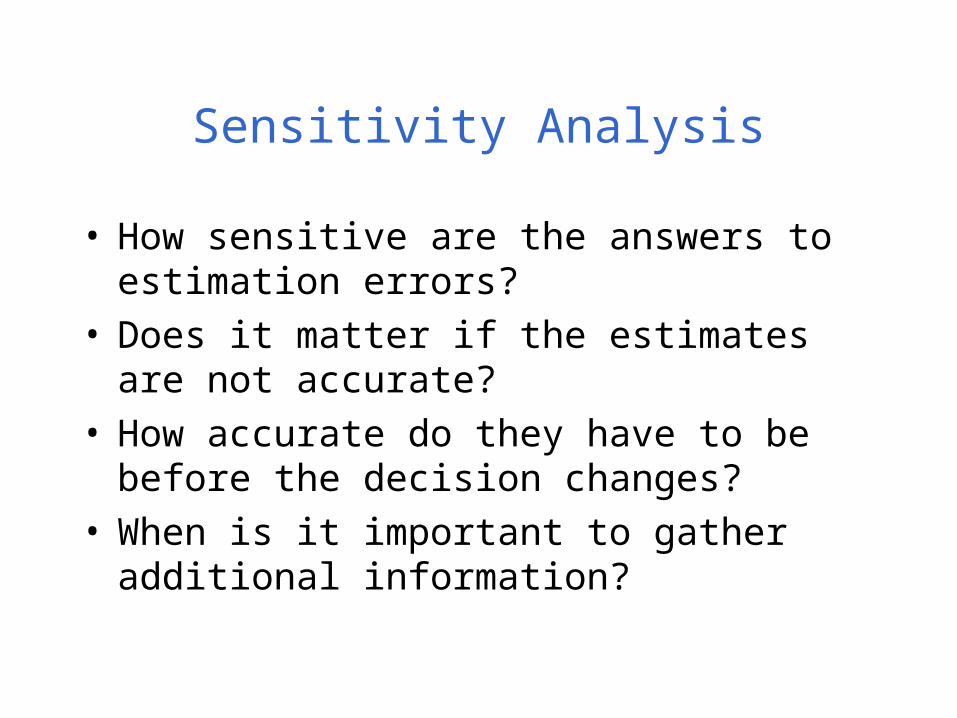
Sensitivity Analysis
• How sensitive are the answers to estimation errors?
• Does it matter if the estimates are not accurate?
• How accurate do they have to be before the decision changes?
• When is it important to gather additional information?
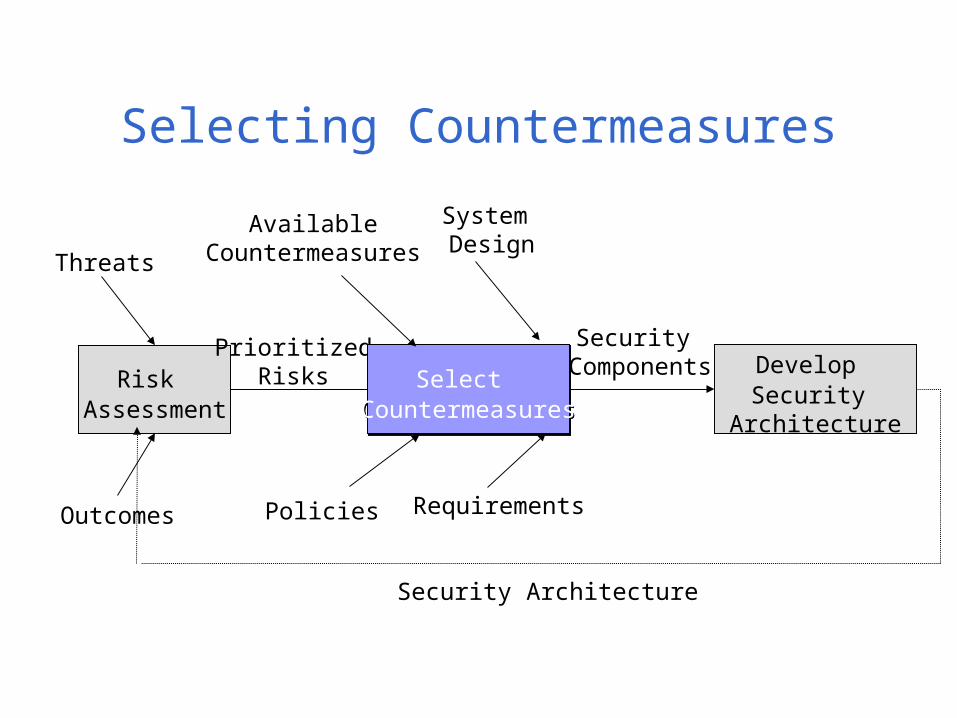
Selecting Countermeasures
Risk Assessment
Outcomes
Threats
PrioritizedRisks Select
CountermeasuresSelect
Countermeasures
System Design
Policies Requirements
AvailableCountermeasures
Security Components Develop
Security Architecture
Security Architecture
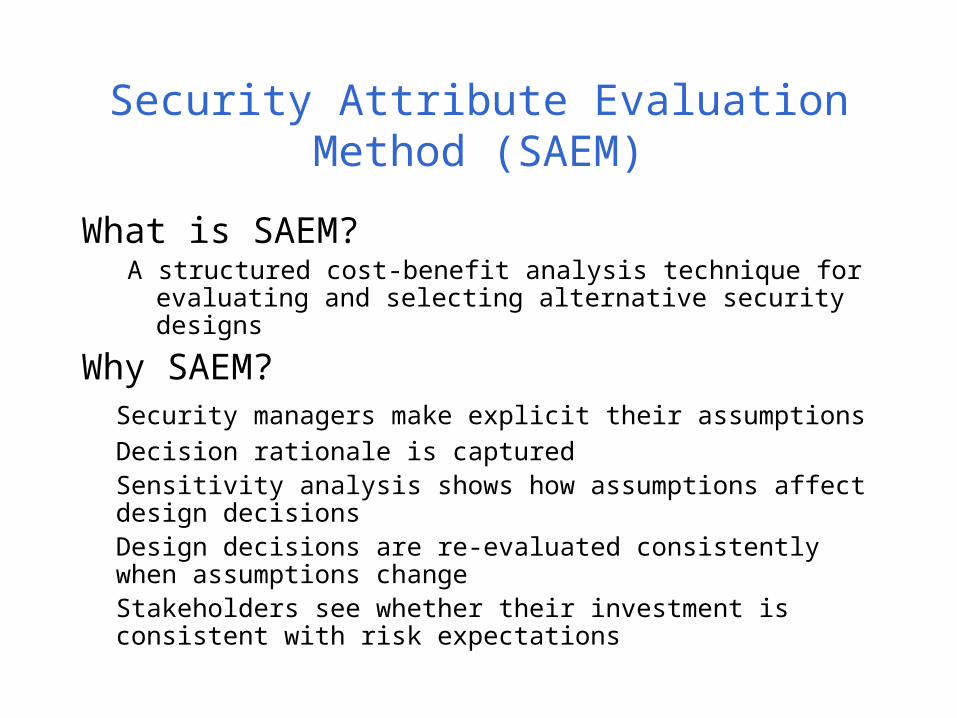
Security Attribute Evaluation Method (SAEM)
What is SAEM?A structured cost-benefit analysis technique for
evaluating and selecting alternative security designs
Why SAEM?Security managers make explicit their assumptionsDecision rationale is capturedSensitivity analysis shows how assumptions affect design decisionsDesign decisions are re-evaluated consistently when assumptions changeStakeholders see whether their investment is consistent with risk expectations

SAEM Process
• Evaluation Method1. Assess security technology benefits2. Evaluate security technology benefits3. Assess coverage4. Analyze Costs
Select Countermeasures
Select Countermeasures
System Design
Policies Requirements
AvailableCountermeasures
Security ComponentsPrioritized
Risks
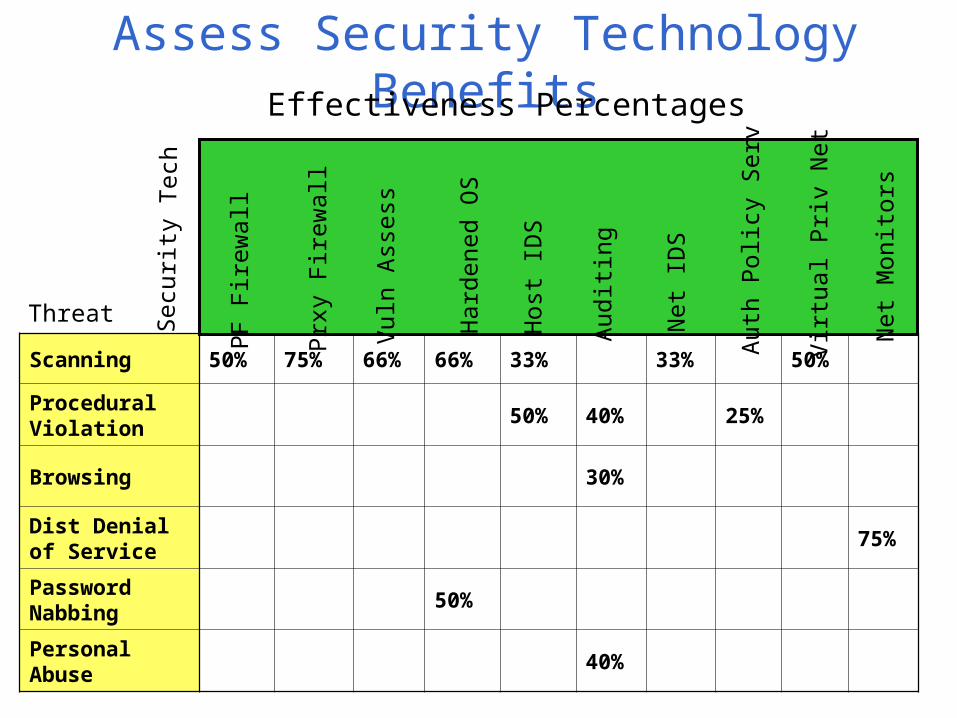
Assess Security Technology Benefits
Scanning 50% 75% 66% 66% 33% 33%50%
Procedural Violation
50% 40%25%
Browsing 30%
Dist Denial of Service
75%
Password Nabbing
50%
Personal Abuse
40%
Effectiveness Percentages
Threat Secu
rity
Tech
PF
Fire
wall
Prx
y F
irew
all
Net
IDS
Audit
ing
Host
ID
S
Vuln
Ass
ess
Hard
ened O
S
Auth
Polic
y S
erv
Vir
tual Pri
v N
et
Net
Monit
ors
Evaluate Security Technology Benefits
Scanning (886)
443 223 301 301 594 594 443
Procedural Violation (367)
183 220 274
Browsing (226)
158
Dist Denial of Service (26.12)
6.6
Password Nabbing (.62)
.31
Personal Abuse (.13)
.08
Threat Secu
rity
Tech
PF
Fire
wall
Prx
y F
irew
all
Net
IDS
Audit
ing
Host
ID
S
Vuln
Ass
ess
Hard
ened O
S
Auth
Polic
y S
erv
Vir
tual Pri
v N
et
Net
Monit
ors
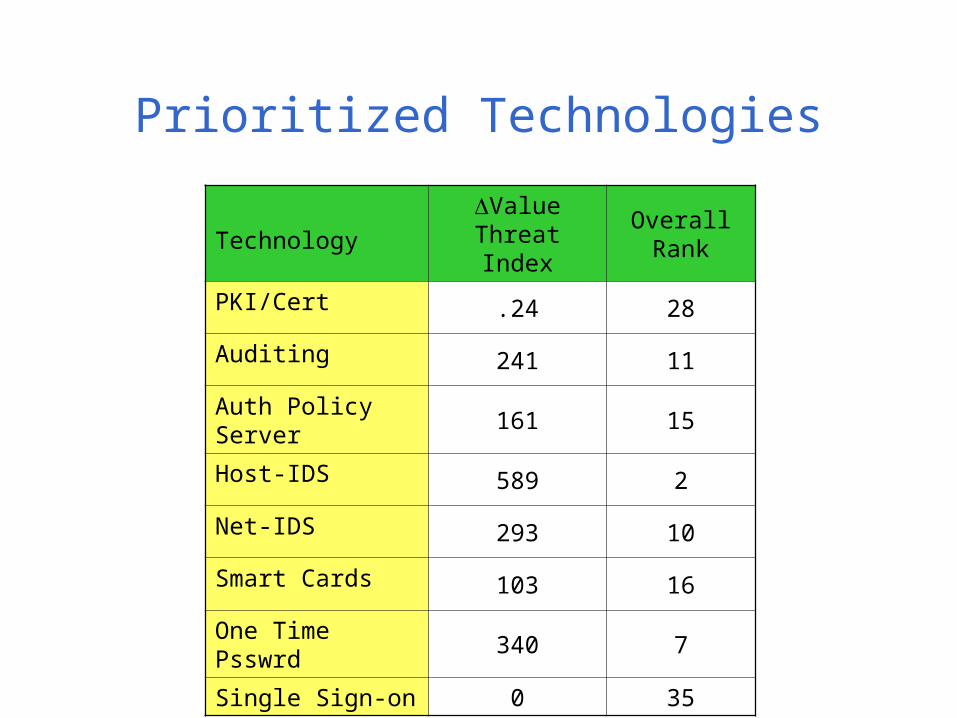
Prioritized Technologies
Technology
Value Threat Index
Overall Rank
PKI/Cert .24 28
Auditing 241 11
Auth Policy Server
161 15
Host-IDS 589 2
Net-IDS 293 10
Smart Cards 103 16
One Time Psswrd
340 7
Single Sign-on 0 35
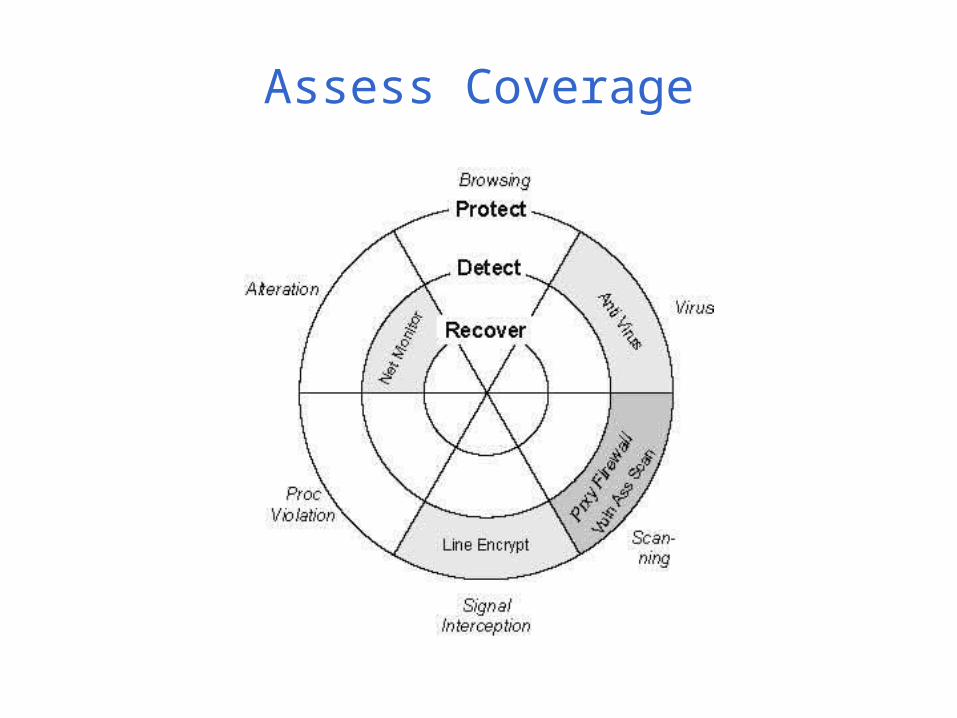
Assess Coverage
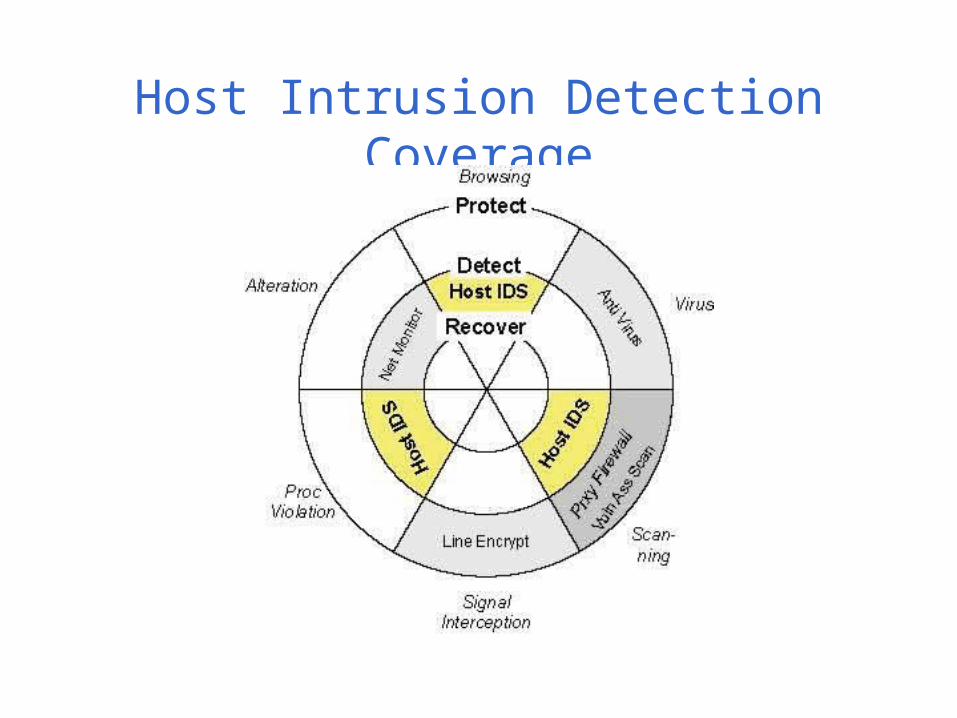
Host Intrusion Detection Coverage
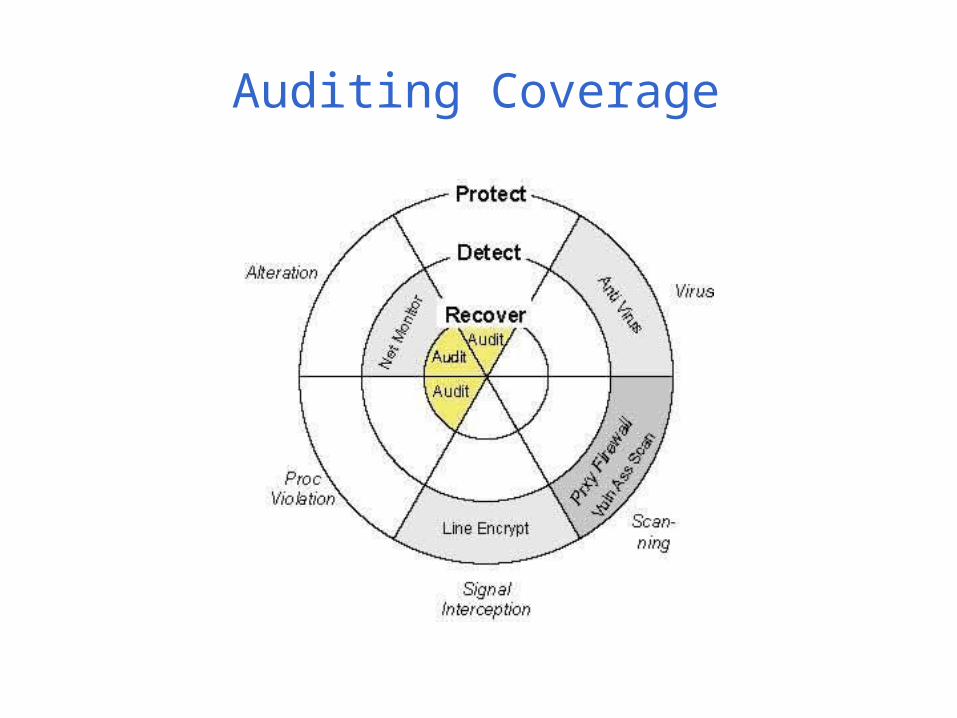
Auditing Coverage

Analyze Costs
0
589
$0
Host IDS
Single Sign-on
Smart Cards
Net IDS Auditing
PKI Cert$20,000
Auth Policy Server
Th
reat
Ind
ex
Purchase Cost
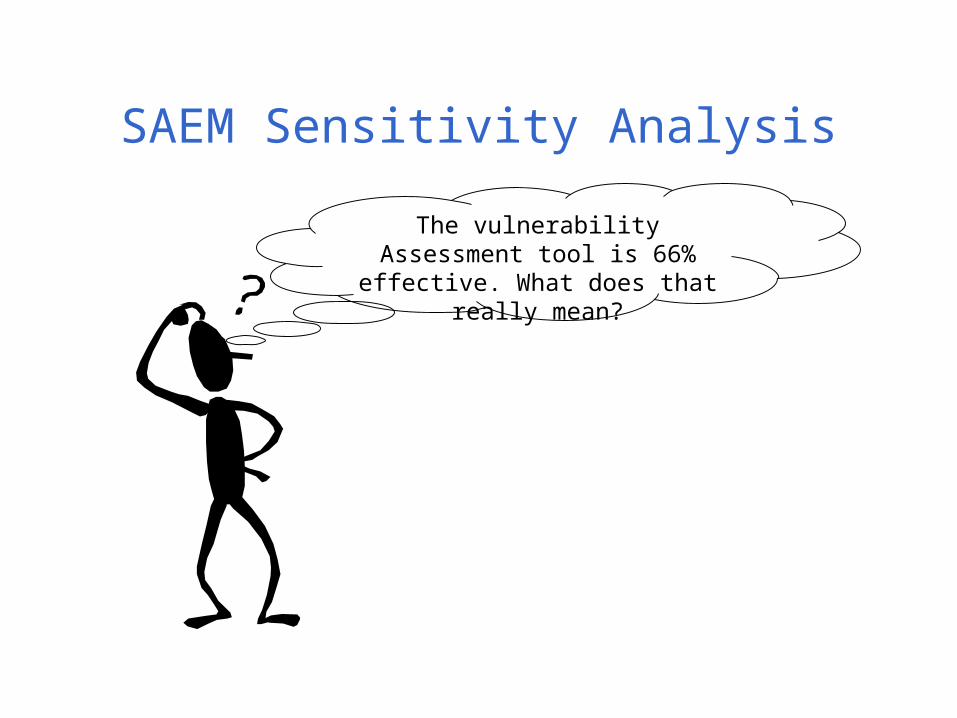
SAEM Sensitivity Analysis
The vulnerability Assessment tool is 66% effective. What
does that really mean?
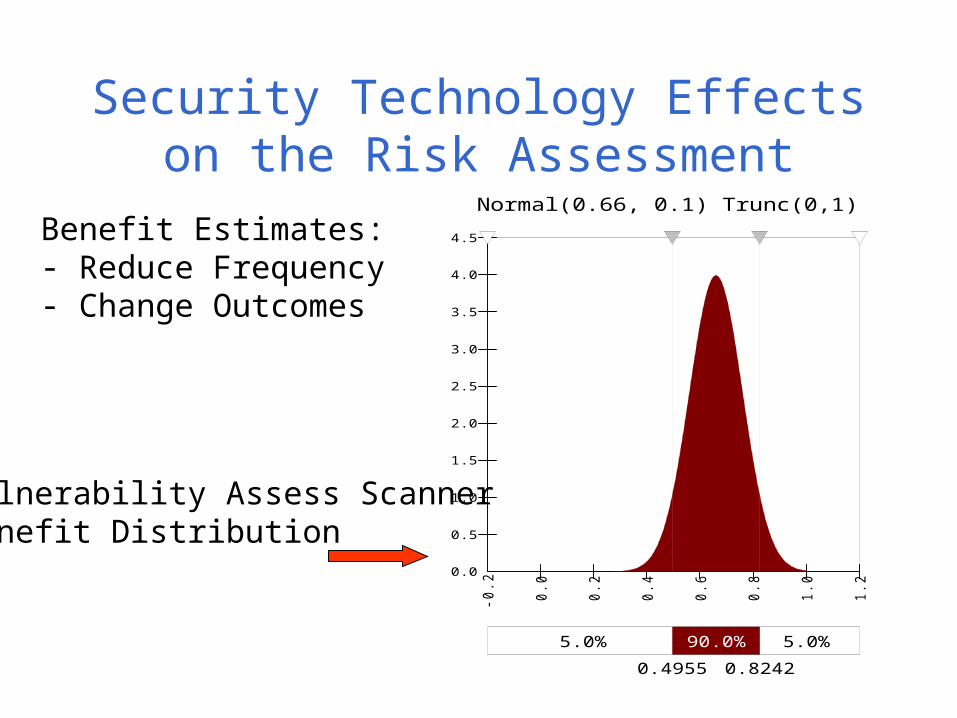
Security Technology Effects on the Risk Assessment
Normal(0.66, 0.1) Trunc(0,1)
0.0
0.5
1.0
1.5
2.0
2.5
3.0
3.5
4.0
4.5
-0.2
0.0
0.2
0.4
0.6
0.8
1.0
1.2
5.0% 5.0%90.0%0.4955 0.8242
Benefit Estimates:- Reduce Frequency- Change Outcomes
Vulnerability Assess ScannerBenefit Distribution
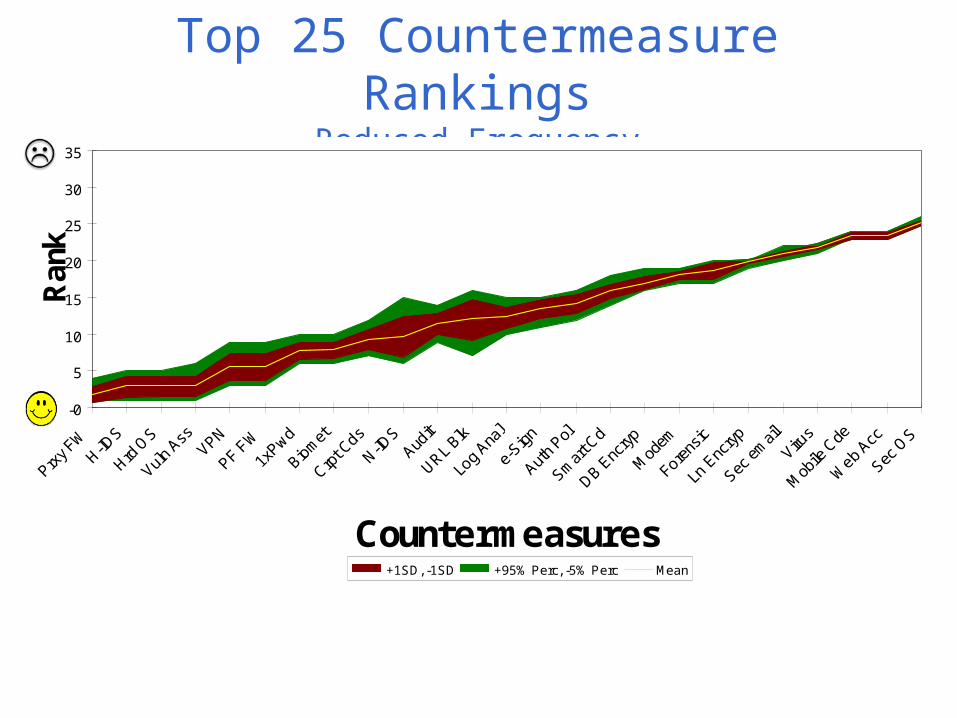
Top 25 Countermeasure Rankings
Reduced Frequency
-0
5
10
15
20
25
30
35
Countermeasures
Ran
k
+1SD, -1SD +95% Perc, -5% Perc Mean
0
5
10
15
20
25
30
35
PKI / Cert Auditing Auth Policy
Servers
H-I DS N-I DS One Time
password
Smart Cards
Technology
Rank
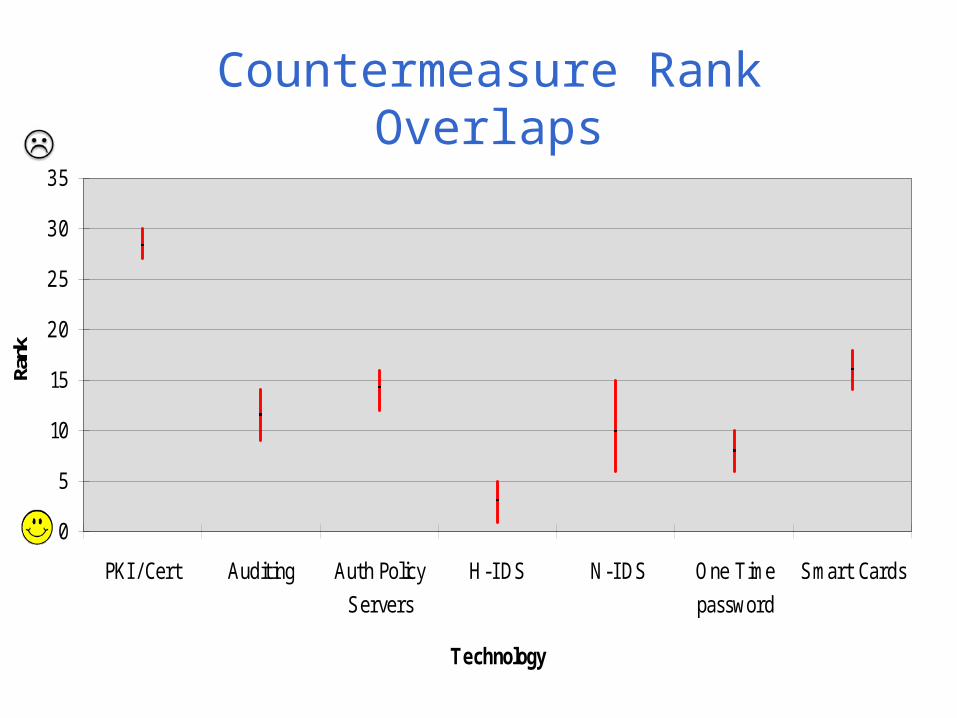
Countermeasure Rank Overlaps
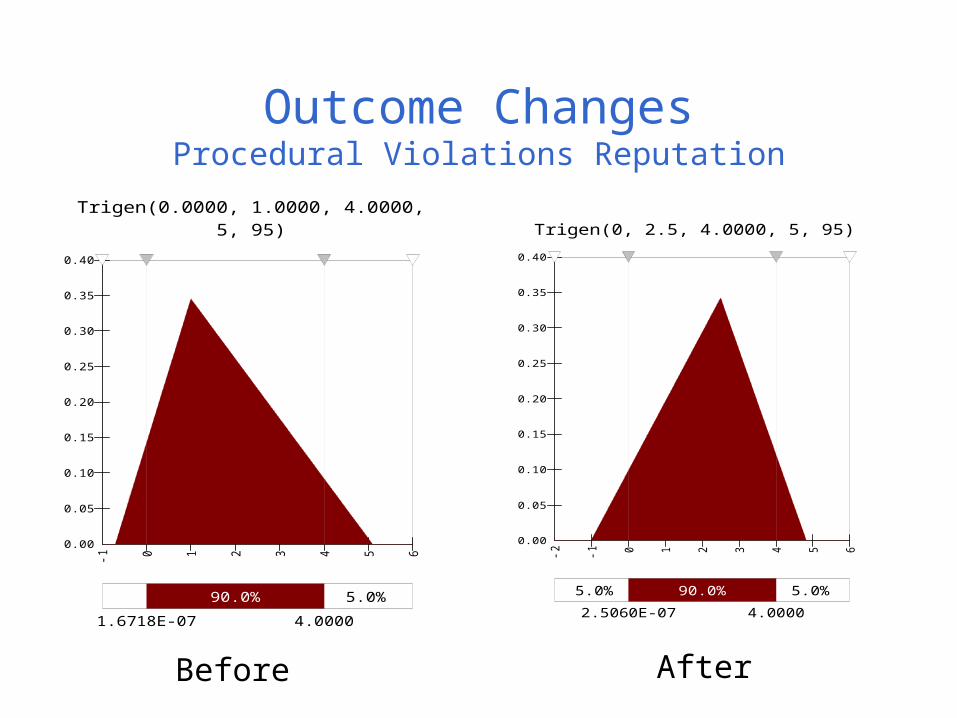
Outcome ChangesProcedural Violations Reputation
Trigen(0.0000, 1.0000, 4.0000,5, 95)
0.00
0.05
0.10
0.15
0.20
0.25
0.30
0.35
0.40
-1 0 1 2 3 4 5 6
5.0%90.0%
1.6718E-07 4.0000
Trigen(0, 2.5, 4.0000, 5, 95)
0.00
0.05
0.10
0.15
0.20
0.25
0.30
0.35
0.40
-2 -1 0 1 2 3 4 5 6
5.0% 5.0%90.0%
2.5060E-07 4.0000
Before After
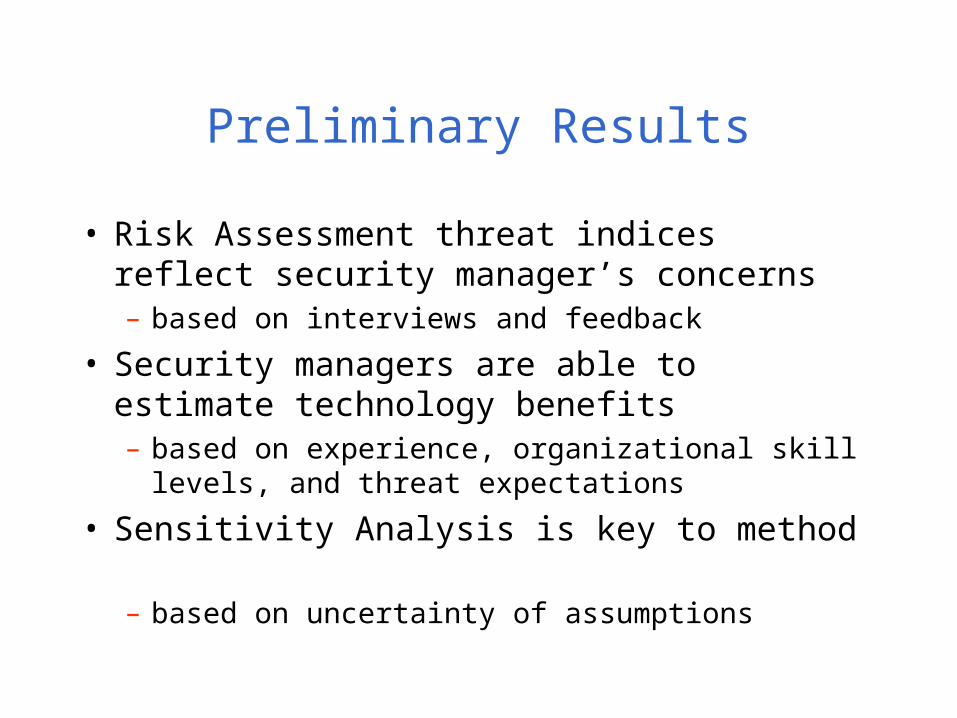
Preliminary Results
• Risk Assessment threat indices reflect security manager’s concerns– based on interviews and feedback
• Security managers are able to estimate technology benefits – based on experience, organizational skill
levels, and threat expectations
• Sensitivity Analysis is key to method– based on uncertainty of assumptions


