u Sediment Characteristics of Small Streams in Southern Wisconsin 1 054. 50 SH/WTA KM MAY 6 1963 GEOLOGICAL SURVEY WATER-SUPPLY PAPER 1669-B Prepared in cooperation with the Wiscon- sin Conservation Department through the Wisconsin Committee on Water Pollution
Transcript
uSediment Characteristics of Small Streams inSouthern Wisconsin 1 054. 50 SH/WTA KM
MAY 6 1963
GEOLOGICAL SURVEY WATER-SUPPLY PAPER 1669-B
Prepared in cooperation with the Wiscon sin Conservation Department through the Wisconsin Committee on Water Pollution
Sediment Characteristics of Small Streams in Southern Wisconsin 1954-59
By CHARLES R. COLLIER
CONTRIBUTIONS TO THE HYDROLOGY OF THE UNITED STATES
GEOLOGICAL SURVEY WATER-SUPPLY PAPER 1669-B
Prepared in cooperation with the Wiscon- sin Conservation Department through the Wisconsin Committee on Heater Pollution
"JNITED STATES GOVERNMENT PRINTING OFFICE, WASHINGTON : 1963
UNITED STATES DEPARTMENT OF THE INTERIOR
STEWART L. UDALL, Secretary
GEOLOGICAL SURVEY
Thomas B. Nolan, Director
For sale by the Superintendent of Documents, U.S. Government Printing Office Washington 25, D.C.
CONTENTS
PageAbstract__ ______________________________________________________ BlIntroduction._ ____________________________________________________ 1Definition of terms_______________________________________________ 3Collection and analysis of data______________________________________ 4Precipitation, 1954-59__ _ _ ________________________________________ 6Black Earth Creek_______________________________________________ 6
Mount Vernon Creek_______________________________________-_-_____ 15Runoff__________________________________________________ 16Sediment discharge__________________________________________ 16
Page FIGURE 1. Map of Wisconsin._____________________________________ B2
2. Black Earth Creek at the riffle____-_________.____________ 93. Monthly suspended-sediment yield, Black Earth Creek____ 104. Suspended-sediment transport curve on a storm event basis,
Black Earth Creek______________________________ 125. Cumulative sediment load versus direct runoff during warm
and cold seasons, Black Earth Creek____________________ 146. Particle-size gradation of suspended sediment, Black Earth
Creek___________________________________ 157. Mount Vernon Creek downstream from the bridge________ 168. Suspended-sediment transport curve on a storm event basis,
Mount Vernon Creek _________________________________ 199. Cumulative sediment load versus storm runoff, Mount Vernon
Creek_______________________________________________ 2110. Particle-size gradation of suspended sediment, Mount Vernon
Creek__ ____________________________________ 2111. Suspended-sediment transport curve on a storm event basis,
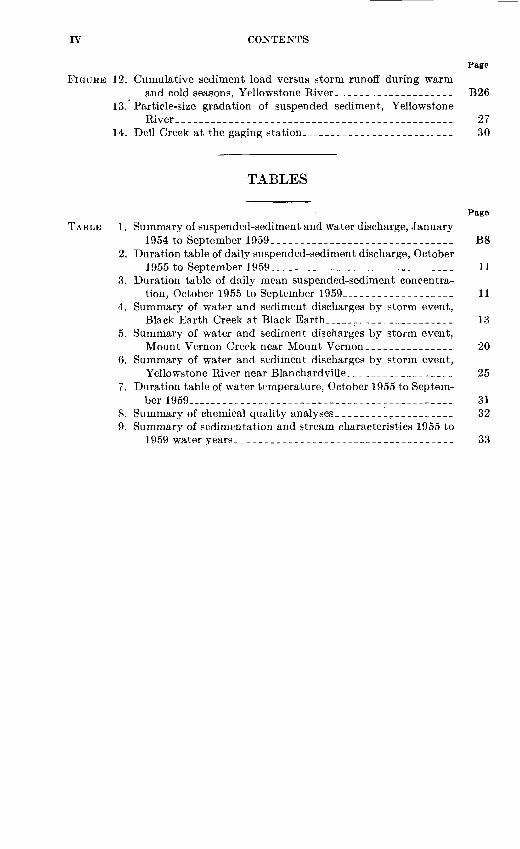
Page FIGUKE 12. Cumulative sediment load versus storm runoff during warm
and cold seasons, Yellowstone River ____________________ B2613. Particle-size gradation of suspended sediment, Yellowstone
River_______________________________________________ 2714. Dell Creek at the gaging station__________________________ 30
TABLES
Page TABLE 1. Summary of suspended-sediment and water discharge, January
1954 to September 1959_____________________________ B82. Duration table of daily suspended-sediment discharge, October
1955 to September 1959.____________________________ 113. Duration table of daily mean suspended-sediment concentra
tion, October 1955 to September 1959_________________ 114. Summary of water and sediment discharges by storm event,
Black Earth Creek at Black Earth____________________ 135. Summary of water and sediment discharges by storm event,
Mount Vernon Creek near Mount Vernon_______________ 206. Summary of water and sediment discharges by storm event,
Yellowstone River near Blanchardville__________________ 257. Duration table of water temperature, October 1955 to Septem
ber 1959____-_-____--_------_----__-_-_____________ 318. Summary of chemical quality analyses ____________________ 329. Summary of sedimentation and stream characteristics 1955 to
1959 water years _____________________________________ 33
CONTRIBUTIONS TO THE HYDROLOGY OF THE UNITED STATES
SEDIMENT CHARACTERISTICS OF SMALL STREAMS IN SOUTHERN WISCONSIN, 1954-59
By CHARLES R. COLLIER
ABSTRACT
The results of investigations of the sediment and water discharge characteris tics of Black Earth Creek, Mount Vernon Creek, and Yellowstone River from 1954 to 1959 and Dell Creek for 1958 and 1959 indicate large differences in annual runoff and sediment yields.
The suspended-sediment discharge of Black Earth Creek averaged 3,260 tons per year or 71 tons per square mile; the annual yields ranged from 27 to 102 tons per square mile. The annual suspended-sediment yield of Mount Vernon Creek ranged from 48 to 171 tons per square mile and averaged 96 tons per square mile. The maximum daily discharge was 1,120 tons on April 1, 1960, during a storm which produced 67 percent of the suspended load for that water year and exceeded the discharge for the preceding 3 years. The sediment discharge of the Yellowstone River averaged 6,870 tons per year or 236 tons per square mile. The maximum daily sediment discharge, 3,750 tons on April 1, 1959, occurred during a 14-day period of high flow during which the sediment discharge was 15,480 tons. In 1958 and 1959, Dell Creek had suspended-sediment yields of 4.7 and 26 tons per square mile of drainage area.
The suspended sediment transported by Black Earth and Mount Vernon Creeks is about two-thirds clay and one-third silt. For Yellowstone River the particle-size distribution of the suspended sediment ranged from three-fourths clay and one-fourth silt during periods of low sediment discharge to one-third clay and two-thirds silt during high sediment discharges. For Dell Creek nearly all of the suspended sediment is clay, but the bed load is sand.
The mean sediment concentration of storm runoff averaged two to three times more in the summer than in the winter. No significant changes with time occurred in the relation between storm runoff and sediment yield.
INTRODUCTION
The investigations of sedimentation and water discharge character istics of three small basins in Wisconsin began in 1954. In 1957, a fourth basin was included in the program. Part of the investigations were designed to define the sediment and water discharge rates of the streams and to measure the changes in these characteristics due to a watershed improvement program. Two basins are under investigation as a part of reservoir sedimentation studies. The measurement of the
Bl
B2 CONTRIBUTIONS TO THE HYDROLOGY OF THE UNITED STATES
amount and characteristics of the sediment entering the reservoirs is used, in conjunction with reservoir surveys by the Wisconsin Conserva tion Department, to define the trap efficiency and rate of sedimentation in the reservoirs.
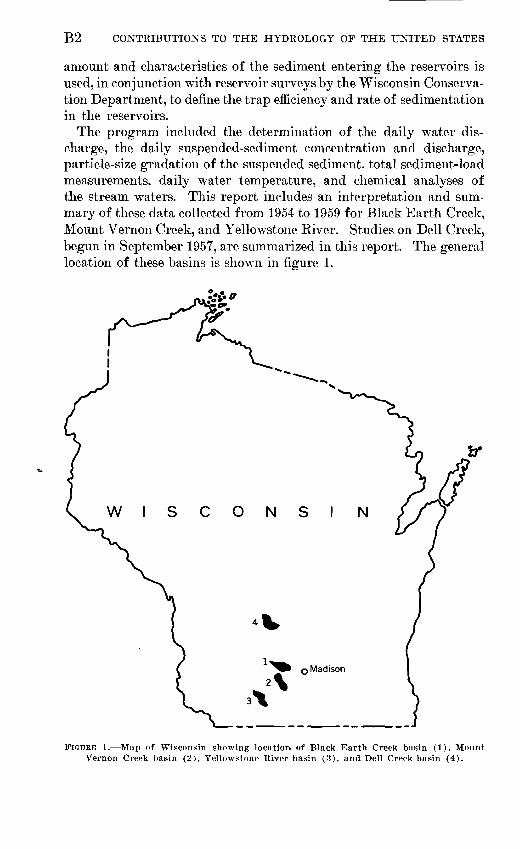
The program included the determination of the daily water dis charge, the daily suspended-sediment concentration and discharge, particle-size gradation of the suspended sediment, total sediment-load measurements, daily water temperature, and chemical analyses of the stream waters. This report includes an interpretation and sum mary of these data collected from 1954 to 1959 for Black Earth Creek, Mount Vernon Creek, and Yellowstone River. Studies on Dell Creek, begun in September 1957, are summarized in this report. The general location of these basins is shown in figure 1.
W I S C O N S I N
O Madison
FIGURE 1. Map of Wisconsin showing location of Black Earth Creek basin (1), Mount Vernon Creek basin (2), Yellowstone River basin (3), and Dell Creek basin (4).
SEDIMENT CHARACTERISTICS OF STREAMS B3
The investigations are being made by the U.S. Geological Survey in cooperation with the Wisconsin Conservation Department, L. P. Voigt, director, through the Wisconsin Committee on Water Pollu tion, T. F. Wisniewski, director. The sediment investigations were under the immediate direction of G. W. Whetstone, district chemist, Columbus, Ohio. Mr. F. T. Schaefer, succeeded by Mr, K. B. Young, district engineer, U.S. Geological Survey, Madison, Wis., and staff, supplied the water-discharge records and assisted in the operation of the sediment stations. Discussions on the geology of the basins were supplied by C. L. R. Holt, Jr., district geologist, U.S. Geological Sur vey, Madison, Wis. The investigations could not have been made without the assistance and cooperation in the collection of the sedi ment samples of the local residents: Mr. Turk at Black Earth Creek, Mr. O'Conner and Mr. Austin at Mount Vernon Creek, Mr. Moen and Mr. Steiner at Yellowstone River, and Mr. MacFaiiane at Dell Creek.
DEFINITION OF TERMS
Sediment is the fragmental material transported by, suspended in, or deposited by water.
Suspended sediment or suspended load is that sediment trans ported by being held in suspension by the upward components of turbulent currents or by colloidal suspension.
Bedload is that sediment transported along and remaining mainly in contact with the streambed. The portion of the total load trans ported by each process depends upon the availability and particle size of the sediment, the bed material, and streamflow conditions such as roughness of the streambed, slope, and velocity of the water.
The particle size of the sediment is referred to by the followingclassifications:Clay, less than 0.004 millimeter (mm) diameter.Silt, 0.004 to 0.062 mm diameter.Sand, 0.062 to 2.0 mm diameter.Gravel, 2.0 to 64.0 mm diameter.This classification is that recommended by the American GeophysicalUnion Subcommittee on Sediment Terminology (Lane and others,1947, p. 937).Cubic foot per second (cfs) is the rate of discharge of a stream
whose channel is 1 square foot in cross-sectional area and whose average velocity is 1 foot per second.
Cubic foot per second-day (cfs-day) is the volume of water repre sented by a flow of 1 cubic foot per second for 24 hours.
B4 CONTRIBUTIONS TO THE HYDROLOGY OF THE UNITED STATES
Inches of runoff is the depth to which the drainage area would becovered if the total water discharge for a given time period wasevenly distributed over the area.
Acre-foot is the volume of water required to cover 1 acre to a depthof 1 foot and is equivalent to 43,560 cubic feet.
Base flow is the sustained or fair-weather runoff composed largelyof ground-water effluent.
Direct runoff or storm runoff is the water entering the streamchannels promptly after rainfall or snowmelt. It is composedmostly of overland flow, but also includes storm seepage fromshallow perched ground water.
COLLECTION AND ANALYSIS OF DATA
The suspended-sediment discharges were determined by defining two variables, the water discharge and the concentration of the sus pended sediment in the water. A water-stage recorder was installed at each station to provide a continuous record of the stage (height) of the water. The river stage was then converted to water discharge by defining, with water-discharge measurements, the stage-discharge relation. Representative samples of the water-sediment mixture were obtained by using depth-integrating samplers, designated US D-43, US D-49, and US DH-48. These samples were collected once a day by resident observers when the streamflow was uniform and changes in the sediment concentration were gradual. The observers collected as many as 13 samples per day during periods of storm runoff to adequately define the rapidly changing concentration.
The samples were analyzed for concentration by a process of decan- tation, filtration, drying, and weighing. The concentration of each sample, computed in parts per million (ppm), is used as a guide to construct a continuous concentration curve. This curve and the water- discharge record are used to calculate the daily mean concentration and daily suspended-sediment discharge.
Certain samples were analyzed for particle-size distribution of the sediment. These samples were selected so that a wide range of water discharge, sediment discharge, and concentration would be repre sented. The particle-size gradations, in percent by dry weight, were determined by the sieve and bottom-withdrawal method of analysis. The sand fractions were defined by wet sieving. Silt and clay frac tions were determined, as sedimentation diameters, by the bottom- withdrawal method of analysis in a settling medium of distilled water with a chemical dispersing agent. The resulting particle-size distri bution approximates that of the primary particle sizes. A few samples were divided, a portion was analyzed in a settling medium of
SEDIMENT CHARACTERISTICS OF STREAMS B5
native stream water, and flocculation of the particles was allowed. Results of these analyses more nearly approach the size distribution that existed in the stream at the time the samples were collected.
Duration curves were developed for daily suspended-sediment dis charge, daily mean concentration, and water temperature to show the percent of time the various temperatures and rates of sediment dis charge existed. The data are presented by duration tables (tables 2,3. and 7), which were prepared from the duration curves. The maxi mum and minimum values are also given in the tables. The complete water years 1955 to 1959 were used rather than the entire available record so that each month and season would be equally represented.
A better understanding of the sediment yield of a basin may be obtained by a study of individual storm events. The total water and sediment discharges were listed for each storm period during which the sediment concentrations were adequately defined. The water discharge due to storm runoff was determined by subtracting from the total water discharge that portion of the flow estimated from hydrographs to be base flow. Similarly, the sediment which would have been carried without the storm occurring was estimated and sub tracted from the total suspended-sediment discharge. This load by base flow was in each case small, and omission of this step would not have significantly affected the results.
Suspended-sediment transport curves were developed from the storm-runoff data. These curves show for each station the average rate of sediment discharge for a given water discharge. The sediment discharge was plotted against the storm runoff as shown in figures4. 8, and 11. The points within each of several ranges of water dis charge were averaged and the sediment transport curves drawn through those averages.
An evaluation of the time trend of the sediment yield was made from the storm runoff data for each basin. The sediment discharges due to storm runoff were added cumulatively in chronological order and plotted against a similar cumulation of storm runoff. A cumula tive curve was then drawn through the points (figs. 5, 9,12). Changes in the slope of the curve, which indicate a change in the proportionality between the sediment yield and storm runoff, were then tested for sig nificance by an analysis of covariance. For Black Earth Creek and Yellowstone River, it was necessary to develop separate curves for the warm and cold seasons.
No routine method is available for the continuous determination of the bedload or total sediment load of a stream. Some individual computations of total load were made using formulas based on lab oratory and small stream studies. Of the many formulas available,
669889 O 63 2
B6 CONTRIBUTIONS TO THE HYDROLOGY OF THE UNITED STATES
the Meyer-Peter and Muller formula for computing bedload was found to be the most applicable for the streams in this study. These determinations require simultaneous measurement of the water dis charge, collection of suspended-sediment samples, and the collection of samples of the streambed material.
PRECIPITATION, 1954-59
The amount, form, and intensity of precipitation are among the primary factors affecting the water and sediment yield of a basin. Fortunately, a large variation of annual precipitation occurred during the investigations so that the flow and sediment data represent a wide range of conditions.
The precipitation record at the U.S. Weather Bureau station in Madison, about 23 miles east of Black Earth, provides a comparison between the annual precipitation experienced and the long-term mean (U.S. Weather Bureau, 1954-1960). At Madison the annual precipi tation averaged 30.71 inches for the past 91 years. From the 1954 to the 1959 water year the precipitation averaged 29.26 inches, only about 11/2 inches less than the long-term average, although there was a varia tion of more than 17 inches in the annual totals. The precipitation and departure from the long-term mean for each year are:
Sediment and water-discharge studies were undertaken in the Black Earth Creek basin in February 1954. The sediment sampling equip ment and recording gaging station for water discharge were con structed on Black Earth Creek, 0.7 mile east of Black Earth, Dane County. The drainage area of Black Earth Creek above this station is 45.9 square miles.
The Black Earth Creek basin, area 1 in figure 1, is in the Central Lowland province of the Interior Plains. The stream flows in a westerly direction through a valley averaging about half a mile in width. On either side of the valley, steep hills provide a relief of about 200 feet. The eastern or headwaters part of the basin is in the
SEDIMENT CHARACTERISTICS OF STREAMS B7
glaciated area where glacial till covers the highlands and outwash sediments partly fill the valley. The western part of the basin is in the Driftless Area, where the bedrock is at or near the surface, the high lands are covered by a thin blanket of loess, and the valley is partly filled with sand and gravel. Sandstone of Cambrian Age underlies the sediments in the valley and is exposed in many places along the valley slopes. Dolomite of the Prairie du Chien group of Ordovician Age overlies the sandstone and forms the highland and the north ridge of the basin. St. Peter sandstone and dolomite of the Platteville forma tion successively overlie the Prairie du Chien group and form the south ridge of the basin. A more detailed discussion of the Black Earth Creek basin and its water yield is given by Cline (1963).
RUNOFF
The runoff of Black Earth Creek varied by 3.38 inches per year during this study (table 1). The lowest annual runoff was 6.10 inches for the 1958 water year, a year which had a precipitation deficiency of about 10 inches. High runoff in 1959 resulted from the high precipi tation that year, nearly 8 inches above normal. However, high runoff in the 1955 water year occurred when precipitation was about 5l/2 inches below normal. Base flow was generally greater in 1955 and was a major factor in the high annual runoff.
Peak flows that exceeded 200 cfs (cubic feet per second) resulted from 19 storms during the 5% years of record. Three of the storms produced peak discharges of more than 1,000 cfs with the maximum, 1,750 cfs, on July 3, 1954. Minimum annual flows ranged from 4.8 cfs on November 29, 1958, to 16 cfs on September 19, 1955.
SEDIMENT DISCHARGE/
In the vicinity of the gaging station, the channel of Black Earth Creek has a series of pools and riffles. In the pools the stream bed consists mainly of clay and silt. Much of this sediment is probably moved as suspended load during high water discharge and redeposited after the peak flows. The riffles consist of sands and gravels which are more resistant to movement.
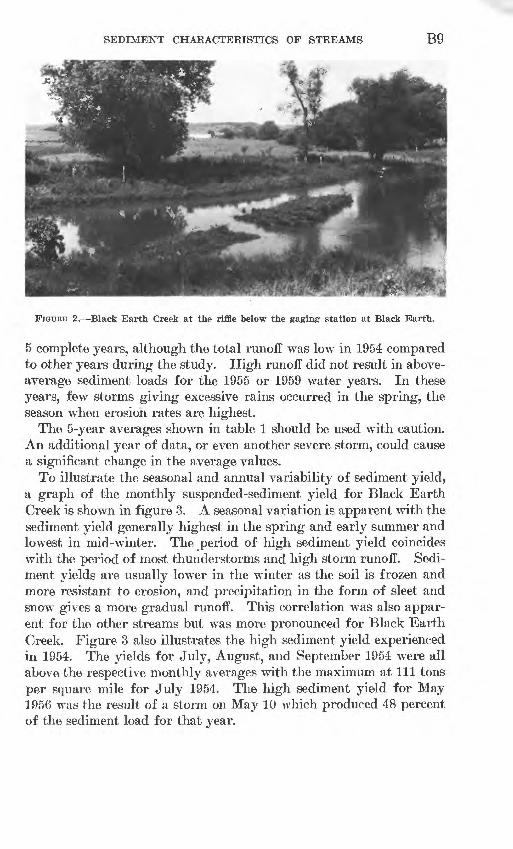
The sediment samples were usually collected at a riffle about 75 feet downstream from the gaging station (fig. 2). A cableway installed across the pool at the gage was used for sampling during medium and high water discharges. Higher stream velocities and greater turbu lence in the riffle section cause the sediment in transport to be sus pended, and as such, measured as suspended load. Two total load
B8 CONTRIBUTIONS TO THE HYDROLOGY OF THE UNITED STATES
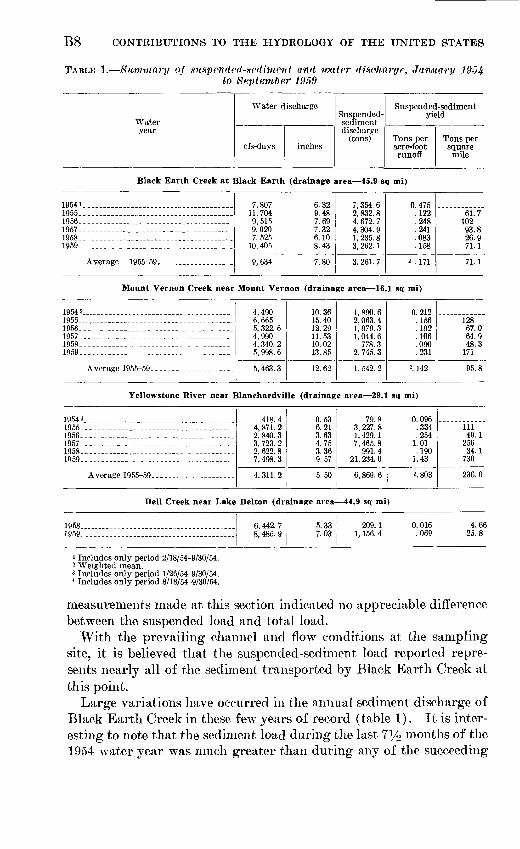
TABLE 1. Summary of suspended-sediment and water discharge, January 1954to September 1959
Water year
Water discharge
cfs-days inches
Suspended- sediment discharge
(tons)
Suspended-sediment yield
Tons per acre-foot runoff
Tons per square mile
Black Earth Creek at Black Earth (drainage area 45.9 sq mi)
1 Includes only period 2/18/54-9/30/54.2 Weighted mean.3 Includes only period 1/26/54-9/30/54.4 Includes only period 8/18/54-9/30/54.
measurements made at this section indicated no appreciable difference between the suspended load and total load.
With the prevailing channel and flow conditions at the sampling site, it is believed that the suspended-sediment load reported repre sents nearly all of the sediment transported by Black Earth Creek at this point.
Large variations have occurred in the annual sediment discharge of Black Earth Creek in these few years of record (table 1). It is inter esting to note that the sediment load during the last 7!/o months of the 1954 water year was much greater than during any of the succeeding
SEDIMENT CHARACTERISTICS OF STREAMS B9
FIGURE 2. Black Earth Creek at the riffle below the gaging station at Black Earth.
5 complete years, although the total runoff was low in 1954 compared to other years during the study. High runoff did not result in above- average sediment loads for the 1955 or 1959 water years. In these years, few storms giving excessive rains occurred in the spring, the season when erosion rates are highest.
The 5-year averages shown in table 1 should be used with caution. An additional year of data, or even another severe storm, could cause a significant change in the average values.
To illustrate the seasonal and annual variability of sediment yield, a graph of the monthly suspended-sediment yield for Black Earth Creek is shown in figure 3. A seasonal variation is apparent with the sediment yield generally highest in the spring and early summer and lowest in mid-winter. The period of high sediment yield coincides with the period of most thunderstorms and high storm runoff. Sedi ment yields are usually lower in the winter as the soil is frozen and more resistant to erosion, and precipitation in the form of sleet and snow gives a more gradual runoff. This correlation was also appar ent for the other streams but was more pronounced for Black Earth Creek. Figure 3 also illustrates the high sediment yield experienced in 1954. The yields for July, August, and September 1954 were all above the respective monthly averages with the maximum at 111 tons per square mile for July 1954. The high sediment yield for May 1956 was the result of a storm on May 10 which produced 48 percent of the sediment load for that year.
BIO CONTRIBUTIONS TO THE HYDROLOGY OF THE UNITED STATES
IUU
100
80
60
40
UJ
iuj 20cc
c?
2] 10CL
co 8zoK 6Z
O 4 _J HUJ
t-
UJi «UJCOQ
SPENDE
3 U.o CO
0.6
0.4
0.2
0.1
l i
._
-
_ 1
<j_
A
\
C-
>s
_ t
_l
-
L
1
L
X k
\i '
)«s
i
( C
]
i
[
1
,\
)
]
(
1
^i i
i i
qL
1
t
\/
A
4
[
1
1 )
N
<
A
C
(i.
i 1 b
^
4
y
s\
> L
k <
]
> 1.
]
\
N
i
^
1
1
EXPLANATION
a1954 1957
0 A1955 1958
A 1956 1959
XAverage
1 1
i i
t
>
i
,
1
[i v, iI <TI '1 i
A-
1
]f s.
)
>
k ck.
j
A.
)
s\
i
1
k
1 l
i i
_
_
-
_
4
\ /
I
(
A
\
/ v
C]
> 2i I:0 il-
5A A
-
k1 1
JAN FEB MAR APR MAY JUNE JULY AUG SEPT OCT NOV DEC
FIGURE 3. Monthly suspended-sediment yield, Black Earth Creek at Black Earth, March1954 to September 1959.
The high sediment discharges carried on only a few days provide a major part of the annual load. The duration table of daily sus pended-sediment discharge for Black Earth Creek (table 2) shows that 5.8 tons or more was transported on only 10 percent of the days and 150 tons or more was transported on only 1 percent of the days. The daily discharge exceeded 1,000 tons on 3 days, 2 of which were in
SEDIMENT CHARACTERISTICS OF STREAMS Bll
TABLE 2. Duration table of daily suspended-sediment discharge, October 1955 toSeptember 1959
Station
Black Earth Creek at Black Earth..... _ . _____ . ...
Mount Vernon Creek near
Yellowstone River near
Dell Creek near Lake Delton 2.
Percent of time daily suspended-sediment discharge indicated, in tons per day, was equaled or exceeded
Maximum
1 3, 960
1,120
3,750 512
1
150
66
580 26
2
61
31
100 15
5
13
7.2
6.3 4.2
10
5.8
2.8
1.8 1.1
25
2.6
1.5
.7
.5
50
1.4
.9
.3
.3
75
0.8
.6
.2
.2
90
0.5
.4
.1
99
0.2
.2
""I
Minimum
<0. 05
< .05
< .05 < .05
1 Occurred July 3, 1954.2 October 1957 to September 1959.
the 5-year period included in the duration table. The maximum daily discharge was 3,960 tons on July 3, 1954. The daily sediment discharges shown in table 2 for Black Earth Creek are generally higher than those for the other streams. This is not due to a higher rate of erosion but to the fact that Black Earth Creek has the largest drainage area to contribute sediment to the stream.
The suspended-sediment concentrations of Black Earth Creek com pare closely with the other streams investigated. (See table 3.) The
TABLE 3. Duration table of daily mean suspended-sediment concentration, October 1955 to September 1959
Station
Percent of time daily mean suspended-sediment concentration indicated, in parts per million, was equaled or exceeded
Black Earth Creek at Black Earth.. ___________
Mount Vernon Creek near
Yellowstone River near
Dell Creek near Lake Delton 2.
Maximum
2,010
2,120438
1
40,5
330
770140
2
?W
225
37577
5
102
10833
10
6K
67
.5818
25
4?
4?
3310
50
24
27
196
75
14
18
114
90
9
13
63
99
3
7
22
Minimum
1
1
11
1 Occurred April 7, 1954.* October 1957 to September 1959.
large increase again occurs between the 10 percent and 1 percent in crements. Daily mean concentrations in excess of 1,000 ppm occurred on only 6 days, 5 of which were in the 1955-1959 period of the dura tion table. The maximum daily mean concentration, 2,010 ppm, oc curred May 13, 1956. The instantaneous concentration reached 4,440 ppm on that day, the highest measured for the period of record.
Twenty-seven storm periods were selected from the Black Earth Creek record for a more detailed inspection of the rates of sedimenta tion. The data are given in table 4. These days include 70 percent of the total suspended-sediment discharge, but only 15 percent of the
B12 CONTRIBUTIONS TO THE HYDROLOGY OF THE UNITED STATES
total water discharge. Storm runoff included 69 percent of the sus pended sediment and 10 percent of the total water discharge.
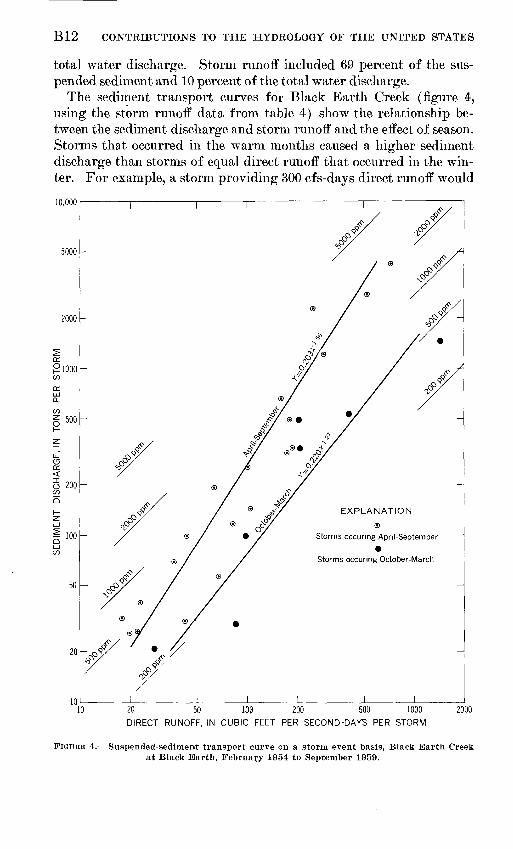
The sediment transport curves for Black Earth Creek (figure 4:, using the storm runoff data from table 4) show the relationship be tween the sediment discharge and storm runoff and the effect of season. Storms that occurred in the warm months caused a higher sediment discharge than storms of equal direct runoff that occurred in the win ter. For example, a storm providing 300 cfs-days direct runoff would
10,000
5000 -
20 50 100 200 500 1000 2000
DIRECT RUNOFF, IN CUBIC FEET PER SECOND-DAYS PER STORM
FIGURE 4. Suspended-sediment transport curve on a storm event basis, Black Earth Creek at Black Earth, February 1954 to September 1959.
SEDIMENT CHARACTERISTICS OF STREAMS B13
likely cause a sediment discharge of 1,500 tons in the summer compared to 310 tons in the winter. Notice that the mean concentration exceeded 1,000 ppm for 7 storms, all of which occurred in the warm months, and was less than 500 ppm for 5 of the 7 winter storms. Both curves show that as the storm runoff increases, the sediment discharge increases at an even greater rate.
TABLE 4. Summary of water and sediment discharges ~by storm event, Black Earth Creek at Black Earth
Storm period
1954
May 1-3... ___ .. __________ ..28-29............. ................
July a-5. . ............................6-8...... ......... ...............
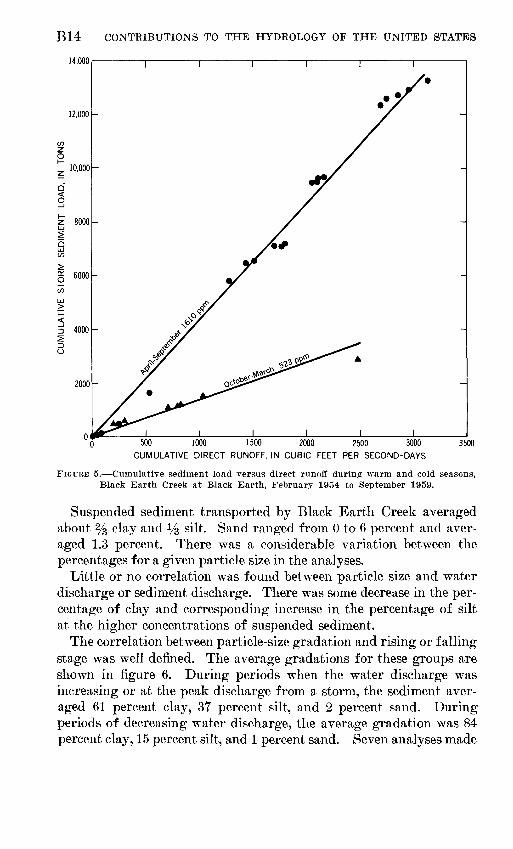
An evaluation of the time-trend of sediment yield of Black Earth Creek indicated no significant change in the sediment load in relation to the direct runoff during the period of record. The seasonal effect on sediment yield was considered in the time-trend study resulting in the two curves of cumulative sediment discharge, figure 5. Al though some minor changes in slope occurred from point to point, no changes were significant at the 5 percent level. Therefore, each curve was drawn as a straight line through the mean of the points. These curves also illustrate the seasonal variation of sediment concentration. The summer storms produce a mean concentration of 1,610 ppm, com pared to 523 ppm for the winter storms.
669889 O 63-
B14 CONTRIBUTIONS TO THE HYDROLOGY OF THE UNITED STATES
14,000
500 1000 1500 2000 2500 3000 CUMULATIVE DIRECT RUNOFF, IN CUBIC FEET PER SECOND-DAYS
3500
FIGURE 5. Cumulative sediment load versus direct runoff during warm and cold seasons, Black Earth Creek at Black Earth, February 1954 to September 1959.
Suspended sediment transported by Black Earth Creek averaged about % clay and !/s silt. Sand ranged from 0 to 6 percent and aver aged 1.3 percent. There was a considerable variation between the percentages for a given particle size in the analyses.
Little or no correlation was found between particle size and water discharge or sediment discharge. There was some decrease in the per centage of clay and corresponding increase in the percentage of silt at the higher concentrations of suspended sediment.
The correlation between particle-size gradation and rising or falling stage was well defined. The average gradations for these groups are shown in figure 6. During periods when the water discharge was increasing or at the peak discharge from a storm, the sediment aver aged 61 percent clay, 37 percent silt, and 2 percent sand. During periods of decreasing water discharge, the average gradation was 84 percent clay, 15 percent silt, and 1 percent sand. Seven analyses made
SEDIMENT CHARACTERISTICS OF STREAMS B15
EXPLANATION-«. .»
Falling stage, 20 analyses
Rising or peak stage, 21 analyses
S 3
DIAMETER. IN MILLIMETERS
FIGURE 6. Particle-size gradation of suspended sediment, Black Earth Creek at Black Earth, February 1954 to September 1959.
using native stream water as the settling medium gave an average of 21 percent less clay and 21 percent more silt compared to the gradations defined under dispersed conditions.
MOUNT VERNON CREEK
The Mount Vernon Creek basin, area 2 in figure 1, was selected for study to provide information useful in the evaluation of the Black Earth Creek watershed improvement program. The measurement of water discharge and suspended sediment began in January 1954. A sediment sampler was installed on the State Highway 92 bridge over Mount Vernon Creek, 2.5 miles southeast of Mount Vernon, Dane County. The water-stage recorder was located 400 feet downstream from the bridge. At the gaging station, Mount Vernon Creek has a drainage area of 16.1 square miles.
The basin is in the Driftless Area of the Interior Plains. The stream flows in a southwesterly direction through a valley averaging less than one-fourth mile in width. The slopes are not as steep nor the terrain as rugged as in the Black Earth Creek basin. The highlands in the Mount Vernon Creek basin are covered by a thin blanket of loess overlain by a silt loam, and the valley is partly filled with sand, gravel, and colluvium. Dolomite of the Prairie du Chien group underlies the sediments in the valley. St. Peter sandstone overlies the dolomite and is exposed in many places along the valley slopes. Dolomite of the Platteville, Decorah, and Galena formations overlies the St. Peter sandstone and forms the ridges.
B16 CONTRIBUTIONS TO THE HYDROLOGY OF THE UNITED STATES
RUNOFF
Mount Vernon Creek carries more water for the size of drainage area than the other streams, as shown in the summary in table 1. The 5-year average annual runoff was 12.62 inches, 62 percent more than the average for Black Earth Creek and 129 percent more than for Yel- lowstone River.
Yearly changes in the flow of Mount Vernon Creek are similar to the changes of Black Earth Creek. The 1955 and 1959 wTater years had the highest runoff. The 1958 water year had the least rainfall and lowest runoff.
Peak discharges in excess of 100 cf s were produced by 21 storms in the period of record. The highest peak flow wTas 940 cfs on April 1, 1959. The minimum flowT also occurred in 1959 7.1 cfs on January 31.
SEDIMENT DISCHARGE
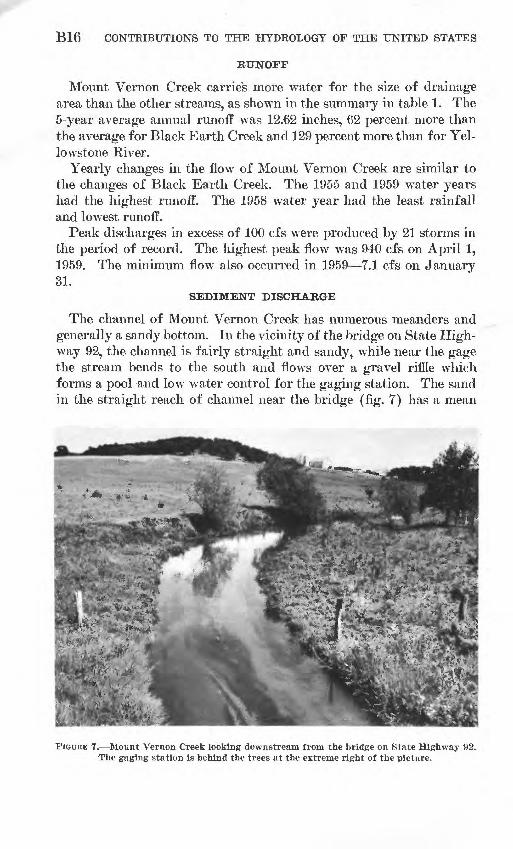
The channel of Mount Vernon Creek has numerous meanders and generally a sandy bottom. In the vicinity of the bridge on State High way 92, the channel is fairly straight and sandy, while near the gage the stream bends to the south and flows over a gravel riffle which forms a pool and IOWT water control for the gaging station. The sand in the straight reach of channel near the bridge (fig. 7) has a mean
FIGURE 7. Mount Vernon Creek looking downstream from the bridge on State Highway 92. The gaging station is behind the trees at the extreme right of the picture.
SEDIMENT CHARACTERISTICS OF STREAMS B17
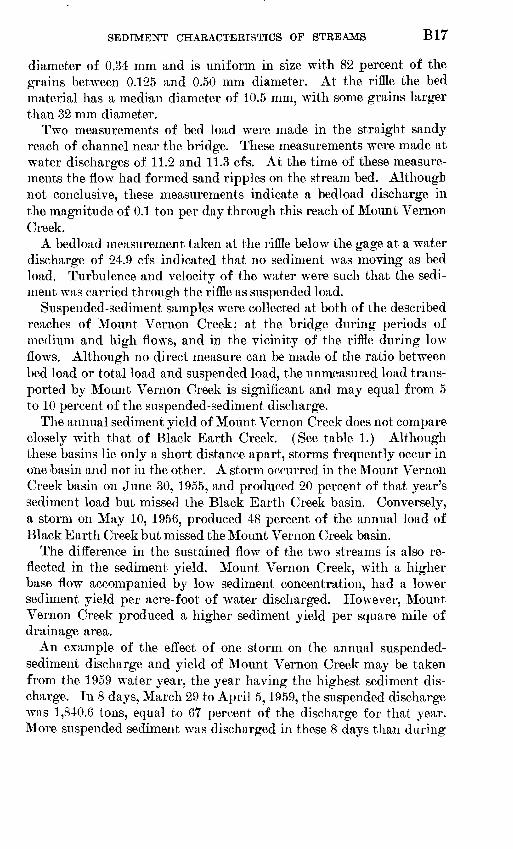
diameter of 0.34 mm and is uniform in size with 82 percent of the grains between 0.125 and 0.50 mm diameter. At the riffle the bed material has a median diameter of 10.5 mm, with some grains larger than 32 mm diameter.
Two measurements of bed load were made in the straight sandy reach of channel near the bridge. These measurements were made at water discharges of 11.2 and 11.3 cfs. At the time of these measure ments the flow had formed sand ripples on the stream bed. Although not conclusive, these measurements indicate a bedload discharge in the magnitude of 0.1 ton per day through this reach of Mount Vernon Creek.
A bedload measurement taken at the riffle below the gage at a water discharge of 24.9 cfs indicated that no sediment was moving as bed load. Turbulence and velocity of the water were such that the sedi ment was carried through the riffle as suspended load.
Suspended-sediment samples were collected at both of the described reaches of Mount Vernon Creek; at the bridge during periods of medium and high flows, and in the vicinity of the riffle during low flows. Although no direct measure can be made of the ratio between bed load or total load and suspended load, the unmeasured load trans ported by Mount Vernon Creek is significant and may equal from 5 to 10 percent of the suspended-sediment discharge.
The annual sediment yield of Mount Vernon Creek does not compare closely with that of Black Earth Creek. (See table 1.) Although these basins lie only a short distance apart, storms frequently occur in one basin and not in the other. A storm occurred in the Mount Vernon Creek basin on June 30, 1955, and produced 20 percent of that year's sediment load but missed the Black Earth Creek basin. Conversely, a storm on May 10, 1956, produced 48 percent of the annual load of Black Earth Creek but missed the Mount Vernon Creek basin.
The difference in the sustained flow of the two streams is also re flected in the sediment yield. Mount Vernon Creek, with a higher base flow accompanied by low sediment concentration, had a lower sediment yield per acre-foot of water discharged. However, Mount Vernon Creek produced a higher sediment yield per square mile of drainage area.
An example of the effect of one storm on the annual suspended- sediment discharge and yield of Mount Vernon Creek may be taken from the 1959 water year, the year having the highest sediment dis charge. In 8 days, March 29 to April 5,1959, the suspended discharge was 1,840.6 tons, equal to 67 percent of the discharge for that year. More suspended sediment was discharged in these 8 days than during
B18 CONTRIBUTIONS TO THE HYDROLOGY OF THE UNITED STATES
the entire 1956 and 1957 water years, and more than twice the dis charge for the 1958 water year. The two highest daily sediment discharges were during this period, 510 tons on March 31 and 1,120 tons on April 1,1959.
A duration table of daily suspended-sediment discharge for Mount Vernon Creek is included in table 2. Daily discharges of 66 tons or more occurred only 1 percent of the time. The discharge exceeded 100 tons on 12 days during the 5 years, 1955-59, and on 4 days in 1954.
A similar compilation for daily mean concentration for Mount Vernon Creek is shown in table 3. There were fewer days of high sedi ment concentration at Mount Vernon Creek than at Black Earth Creek or Yellowstone River. Mount Vernon Creek had a daily mean concen tration of more than 460 ppm for only 12 days in the period of record, 8 of which were during the period used for table 3. The daily mean concentration exceeded 1,000 ppm once, on April 7, 1954, with 2,010 ppm. The instantaneous concentration reached 6,080 ppm on that day and was the maximum measured at Mount Veroon Creek.
The sediment yie'ds produced by 30 storms in the Mount Vernon Creek basin were examined and tabulated in table 5. These 30 periods include 64 percent o. : the suspended sediment and only 14 percent of the total water discharge during the period of record. These per centages are slightly reduced for storm runoff, with 62 percent of the sediment and 9 percent of the water discharge included.
Sediment transport curves for Mount Vernon Creek (fig. 8) show the effect of water discharge and season on the sediment loads. As for Black Earth Creek, an increase in the storm runoff is accom panied by an even greater increase in sediment load, particularly during the summer months. However, the increase in load is not as great for Mount Vernon Creek, as the slopes of the curves, indicated by the exponents 1.49 and 1.09, are less than the corresponding slopes for Black Earth Creek. The season of the year in which a storm occurs affects the sediment load of Mount Vernon Creek. However, this effect is not large, as the points for the summer and winter storms are mingled in figure 8. In the time-trend study, it was not necessary to group the storms by season.
SEDIMENT CHARACTERISTICS OF STREAMS B19
2000
1000
500
200
100
EXPLANATION
® April-September
October-March
5 10 20 50 100 200 500 DIRECT RUNOFF, IN CUBIC FEET PER SECOND-DAYS PER STORM
1000
FIGURE 8. -Suspended-sediment transport curve on a storm event basis, Mount Vernon Creek near Mount Vernon, January 1954 to September 1959.
The time-trend study of sediment loads of Mount Vernon Creek indicates that no significant change has occurred in the ratio of sedi ment loads to storm runoff. The cumulative curve in figure 9 was shifted upward on the Y axis by the unusually high sediment loads during the first storm period, April 6-9, 1954. The points for the other 29 storms then fell in a relatively straight line. The mean con centration of these storms, 696 ppm, is less than half the mean concen tration for Black Earth Creek for storm runoff in the warm months, but somewhat higher than for the cold months.
The suspended sediment from Mount Vernon Creek had an average gradation of 57 percent clay, 39 percent silt, and 4 percent sand. The particle-size gradations during rising or peak stage and falling stage are shown in figure 10. During rising or peak stage the sediment was coarser, averaging 47 percent clay and 49 percent silt. During falling
B20 CONTRIBUTIONS TO THE HYDROLOGY OF THE UNITED STATES
TABLE 5. Summary of water and sediment discharges by storm event, Mount Vernon Creek near Mount Vernon,
1969 Mar. 29-Apr. 5 ... .................. - 1,046
5048211781
161349333
121
210121
7103
1234365
116
51107
514125052
1912122
852
553.676.621.244.179.0
43872.6
246.788.4
272.7371.723
224
28136.2
100.2135
110.6182.512.914.920.0
115185.1
17
34724.531.1
1,840. 6
54468154170
42960
23377
201
262356
20214
2773297
131
107176
111314
110177
14
3312129
1,790
33.84.22.932
2.554.35
26.63.73
14.54.78
12.5
16.322.11.24
13.3
17.21.996.028.14
10.9.683.807.870
6.8311.0
.870
20.61.301.80
111
stages the distribution was 71 percent clay and 26 percent silt. Little change occurred in the percentage of sand. These averages indicate a coarser material than that transported by Black Earth Creek. Three analyses of the suspended sediment from Mount Vernon Creek, made using native stream water as the settling medium, showed a 24 percent decrease in the percentage of clay and an equal increase in the percent age of silt from the gradations defined under dispersed conditions.
PE
RC
EN
T B
Y
WE
IGH
T O
F P
AR
TIC
LES
FI
NE
R
TH
AN
IN
DIC
ATE
D
SIZ
E
CLA
SS
0.001
°
B22 CONTRIBUTIONS TO THE HYDROLOGY OF THE UNITED STATES
YEKLOWSTONE RIVER
An investigation of the sedimentation of the Yellowstone River basin, area 3 in figure 1, was designed to measure the sediment char acteristics and yield of the watershed above the reservoir and the amount of sediment entering the reservoir. The data are available to use in conjunction with reservoir surveys to determine the efficiency of the reservoir to trap the incoming sediment. In August 1954, a station was installed to measure sediment and water discharge just above the backwater of Yellowstone Lake, 1 miles southeast of Blanchardville and about 9 miles upstream from the mouth. The drainage area at this site is 29.1 square miles.
The Yellowstone River flows south from its headwaters in Iowa County into Lafayette County and then southeastward to join the Pecatonica River near Argyle. The valleys are narrow in the northern part of the basin and widen to as much as half a mile in the southern part. Rugged topography and steep slopes are more prevalent than in the Black Earth and Mount Vernon Creek basins. The highlands are covered by a blanket of loess and the valley is partly filled with colluvium, sand, and gravel. St. Peter sandstone underlies the sedi ment in the valley and is exposed in many places along the valley slopes. Dolomite of the Platteville, Decorah, and Galena formations overlies the St. Peter sandstone and forms the ridges.
RUNOFF
The Yellowstone River has a lower average annual runoff than Black Earth or Mount Vernon Creeks. In 1956 and 1958 the annual runoff of the Yellowstone River was less than 4 inches, or approxi mately half of the runoff for Black Earth Creek. (See table 1.) A long period of high flow occurred in March 1959 and provided 4.07 inches of the 9.57 inches of runoff that year. Although the annual runoff of Yellowstone River is comparatively lo\v, the more rugged topography and steep slopes in the basin provide for the more rapid runoff of precipitation and comparatively high peak water discharges. Peak instantaneous discharges in excess of 500 cfs occurred 14 times in the 5-year record. The highest peak flow was 2,000 cfs on April 1, 1959. The lowest flow each year ranged from 1.6 to 3.0 cfs.
SEDIMENT DISCHARGE
The channel of the Yellowstone River in the vicinity of the gaging station has a series of pools and riffles. A large riffle below the gaging station provides a natural control and pool for the gage. This riffle is composed of sands, gravels, and cobbles, which are not easily trans ported by the river. The streambed in the pool section is covered with
SEDIMENT CHARACTERISTICS OF STREAMS B23
a 1- to 2-foot layer of clay and silt during long periods of low water discharge. This material is subject to movement during storm run off; the material present being resuspended and moved out of the section during high flow and replaced by similar material some time after the peak flow.
Suspended-sediment samples were collected in the riffle section during low water discharge, and at the bridge below the gage or from a cableway spanning the pool section at the gage during periods of medium and high water discharge. Under these conditions nearly all of the sediment transported through this reach of the Yellowstone River is suspended load and only a comparatively small amount transported as unmeasured bed load. The following discussion deals with the suspended sediment.
The Yellowstone River, with less runoff, transported several times more sediment than the other three streams investigated. (See table 1.) Table 1 shows the wide yearly variation in the sediment dis charge of the Yellowstone River. High sediment discharges for 1957 and 1959 occurred during two relatively short periods. In 4 days, January 10-13, 1957, the suspended-sediment discharge was 5,240 tons, which accounted for 70 percent of the discharge for that year and exceeded the totals for 1955 and 1956. In 14 days, March 20 to April 2, 1959, 15,480 tons of sediment was transported, which exceeded the total for the preceding 4 years. On April 1, 1959, the discharge was 3,750 tons, which is the maximum for 1 day in the period of record. The maximum daily mean concentration, 2,120 ppm, occurred March 24, 1959. An instantaneous concentration of 9,040 ppm was measured and it is likely that 10,000 ppm was reached that day. A daily mean concentration of 2,100 ppm was estimated for June 24 and 26, 1959.
Duration tables of daily sediment discharge and daily mean con centration, tables 2 and 3, show that for most days the Yellowstone River had a lower sediment discharge and lower concentration than Black Earth or Mount Vernon Creeks. However, in the 1- and 2-percent columns, the Yellowstone River exceeds the other streams. It was during this small percentage of time that the high concentra tions and most of the sediment discharge occurred.
A further inspection was made of the sediment production during 23 storm periods in the Yellowstone River basin. These periods include 36 percent of the water discharge (31 percent by storm runoff) and 70 percent of the sediment load for the 5 years. The data are tabulated in table 6.
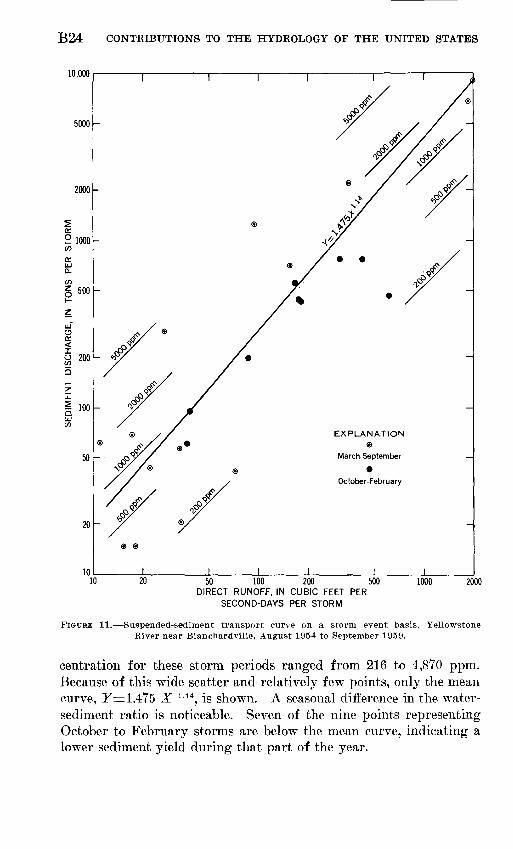
The Yellowstone River has a large variation in sediment load for a given storm runoff, as shown in figure 11. The mean sediment con-
B24 CONTRIBUTIONS TO THE HYDROLOGY OF THE UNITED STATES
10,000
5000 -
50 100 200 500 DIRECT RUNOFF, IN CUBIC FEET PER
SECOND-DAYS PER STORM
2000
FIGURE 11.- -Suspended-sediment transport curve on a storm event basis, Yellowstone River near Blanchardville, August 1954 to September 1959.
centration for these storm periods ranged from 216 to 4,870 ppm. Because of this wide scatter and relatively few points, only the mean curve, y=1.475 X x - 14 , is shown. A seasonal difference in the water- sediment ratio is noticeable. Seven of the nine points representing October to February storms are below the mean curve, indicating a lower sediment yield during that part of the year.
SEDIMENT CHARACTERISTICS OF STREAMS B25
TABLE 6. Summary of water and, sediment discharges by storm event, Yellowstone River near Blanchardvilte
The seasonal difference is illustrated in the plot of the cumulative storm runoff versus sediment load, figure 12. The mean concentra tion of the 14 storms that occurred from March to September was 1,670 ppm, whereas the 9 storms in October to February had a mean concentration of 643 ppm.
The points in figure 12 scatter more from the mean curves than do those in the cumulative plots for Black Earth and Mount Vernon Creeks. This again illustrates the greater variation in'the sediment yield of Yellowstone River. Notice that in the March to September group the several points between 300 and 600 cfs-days are at a slope similar to the winter curve, whereas the 2 points at over 2,000 cfs-days in the winter group have a slope comparable with that of the summer mean curve. These variations are due to factors other than season that also affect the sediment-runoff ratio. Many of these variations and the scatter of points may be reduced by further delineation and adjustments using parameters such as intensity and duration of rain fall, rate of runoff, location of a storm within the basin, and the ante cedent soil-moisture conditions.
B26 CONTRIBUTIONS TO THE HYDROLOGY OF THE UNITED STATES
24,000
20,000
16,000
12,000
8000
4000
1000 2000 3000 4000CUMULATIVE STORM RUNOFF, IN CUBIC FEET
PER SECOND-DAYS
5000
FIGURE 12. Cumulative sediment load versus storm runoff during warm and cold seasons, Yellowstone River near Blanchardville, August 1954 to September 1959.
There is no indication of a change in the sediment load-runoff relationship with time for the Yellowstone River. The cumulative curve in figure 12 for October to February does have a significant break at 744 cfs-days as a result of the runoff during February 19-22, 1955. Previous to this storm, the air temperatures were below zero for several days, according to the U.S. Weather Bureau records for Madison and Lancaster, east and west of the Yellowstone River basin, respectively. There was a general snow cover in the area. Five inches of snow on the ground was reported at Lancaster before this
SEDIMENT CHARACTERISTICS OF STREAMS B27
period and 2 inches after, whereas Madison had 2 inches before and a trace after this period (U.S. Weather Bureau, 1955). The sediment concentration and loads for February 19-22, 1955, were unusually low for the amount of runoff as a result of the snow melt and frozen ground. Similar conditions prevailed for February 23-26, 1958, with two exceptions: (a) there was less snow on the ground before that period and none after, and (b) air temperatures were over 50°F dur ing the runoff, about 10 degrees warmer than in 1955 (U.S. Weather Bureau, 1958). This period also had a lower than average sediment load for the amount of runoff, as indicated by the location of the point at 2,004 cfs-days in figure 12, winter curve. These curves also illus trate the higher sediment yield of Yellowstone Kiver. The average concentrations for the Yellowstone River curves exceed the averages for the corresponding curves for Black Earth and Mount Vernon Creeks.
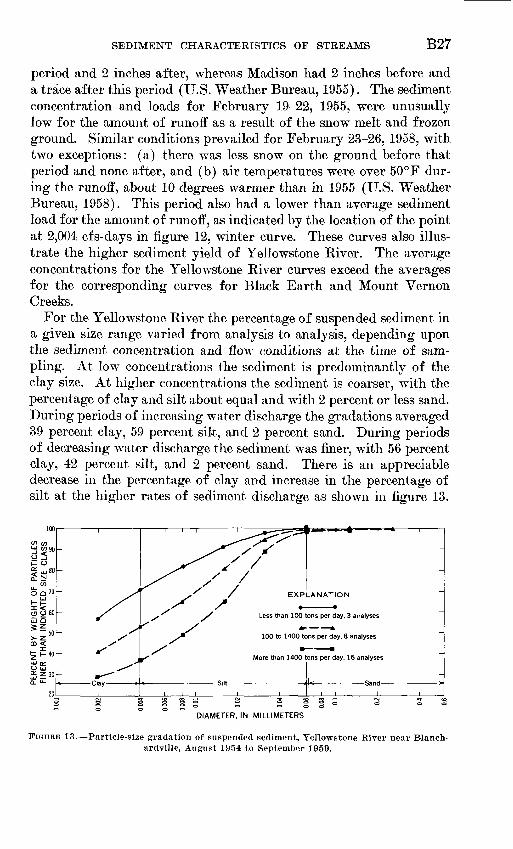
For the Yellowstone River the percentage of suspended sediment in a given size range varied from analysis to analysis, depending upon the sediment concentration and flow conditions at the time of sam pling. At low concentrations the sediment is predominantly of the clay size. At higher concentrations the sediment is coarser, with the percentage of clay and silt about equal and with 2 percent or less sand. During periods of increasing water discharge the gradations averaged 39 percent clay, 59 percent silt, and 2 percent sand. During periods of decreasing water discharge the sediment was finer, with 56 percent clay, 42 percent silt, and 2 percent sand. There is an appreciable decrease in the percentage of clay and increase in the percentage of silt at the higher rates of sediment discharge as shown in figure 13.
EXPLANATION
Less than 100 tons per day, 3 analyses
100 to 1400 tons per day, 8 analyses
More than 1400 tons per day, 16 analyses
8 S
DIAMETER, IN MILLIMETERS
FIGURE 13. Particle-size gradation of suspended sediment, Yellowstone River near Blanch- ardville, August 1954 to September 1959.
B28 CONTRIBUTIONS TO THE HYDROLOGY OF THE UNITED STATES
For sediment discharge of less than 100 tons per day, the particle-size gradation averaged 72 percent clay and 28 percent silt; whereas for sediment discharges exceeding 1,400 tons per day, the clay averaged only 37 percent and silt increased to 61 percent. The percentage of sand varied from 0.3 percent for low sediment discharges to 2 percent for high discharges. Eight analyses made using native stream water as the settling medium showed from 12 to 23 percent less clay and an equal increase in the percentage of silt compared to the same samples analyzed in the dispersed condition.
The particle-size distributions in figure 13 were used to compute the amount of clay, silt, and sand entering Yellowstone Lake from mid-August 1954 through September 1959. The basic records of sedi ment load for each day were inspected, and the tonnages transported at each of the three ranges of sediment discharge were totaled. The sediment discharge for many of the days was divided between 2 or 3 of the ranges. For example, on March 30, 1959, the daily load was 1,190 tons of which 20 tons were transported at a rate of less than 100 tons per day, 229 tons transported at the 100- to 1,400-ton rate, and 941 tons at a rate of more than 1,400 tons per day. By this summation, 34,428 tons of sediment entered Yellowstone Lake during the period of record. Included was 14,418 tons of clay, 19,397 tone of silt, and 613 tons of sand. Clay comprised 41.9 percent, silt 56.3 percent, and sand only 1.8 percent of the total. An estimate of the density and volume occupied by the sediment in the reservoir was made from this size distribution.
The density of sediment deposits in a reservoir is affected to a large extent by the particle-size distribution of the sediment, the age of the deposit, and by the location of the deposit in regard to reservoir opera tion. The density of clay and silt deposits is less when continuously submerged than when alternately submerged and exposed by changing reservoir levels. Consolidation of the sediment, particularly the finer material, occurs over a period of time. The effects of these and other factors on the density of sediment deposits are discussed by Lane and Koelzer in Eeport No. 9 (1943) and in their commentry to Eeport No. 9 (1959).
An estimate of the reservoir volume lost owing to sediment entering Yellowstone Lake was made assuming that all of the sediment was trapped and using the size distribution of 41.9 percent clay, 56.3 percent silt, and 1.8 percent sand computed above. By assuming that the average age of the deposits was 2.5 years and that the deposits were continuously submerged, these percentages by weight were con verted to percentages by volume. This resulted in an average specific weight of 50 pounds per cubic foot, computed by the Lane and Koelzer
SEDIMENT CHARACTERISTICS OF STREAMS B29
method. At this specific weight, the 34,400 tons of sediment which entered Yellowstone Lake would occupy a volume of 31.6 acre-feet and cause an average annual loss in reservoir capacity of 6.3 acre-feet.
Although these figures are not precise owing to the wide variation of density of reservoir deposits and to the unknown quantity of sedi ment which passed through the lake, they give an indication of the magnitude of the sedimentation rates to be expected at Yellowstone Lake.
DELL CREEK
Sediment investigations at Dell Creek are a part of a sedimentation study of Mirror Lake and Lake Delton. In September 1957, a sedi ment and water discharge gaging station was installed on Dell Creek above the backwater of Mirror Lake. The station is 6 miles southeast of the village of Lake Delton, Sauk County, and 7 miles upstream from the mouth. The basin is indicated as area 4 in figure 1. The drainage area is 44.9 square miles at the gage. A sufficient length of record has not yet been obtained to adequately define the average runoff and sediment yield nor the extremes or trends of Dell Creek.
Dell Creek flows generally southeastward from its headwaters in southcentral Juneau County into northeastern Sauk County. The stream bends to the east a short distance above the gaging station and then flows northeastward into Mirror Lake and Lake Delton, empty ing into the Wisconsin River near Lake Delton. Dell Creek drains the southern extreme of the Central Sand Plains. The terrain is rolling to hilly and the valleys are shallow. The blanket of sandy loams and sands covering the basin is underlain by sandstones of Cambrian Age.
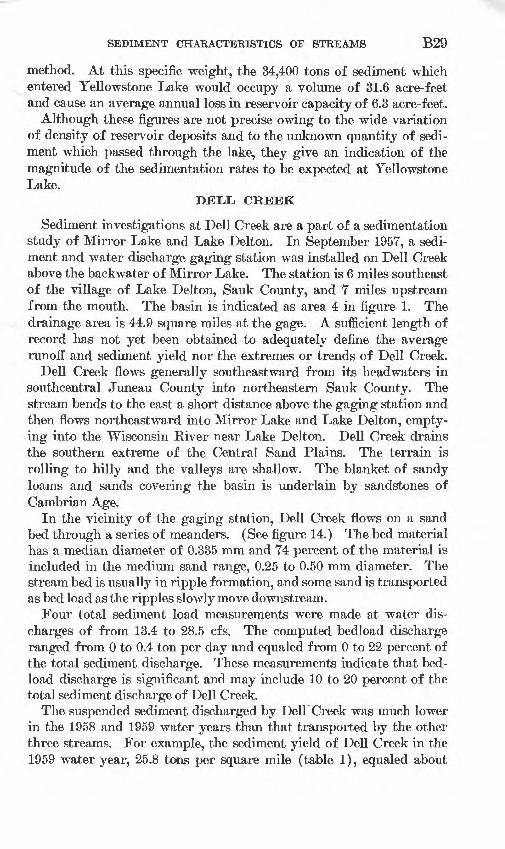
In the vicinity of the gaging station, Dell Creek flows on a sand bed through a series of meanders. (See figure 14.) The bed material has a median diameter of 0.335 mm and 74 percent of the material is included in the medium sand range, 0.25 to 0.50 mm diameter. The stream bed is usually in ripple formation, and some sand is transported as bed load as the ripples slowly move downstream.
Four total sediment load measurements were made at water dis charges of from 13.4 to 28.5 cfs. The computed bedload discharge ranged from 0 to 0.4 ton per day and equaled from 0 to 22 percent of the total sediment discharge. These measurements indicate that bed- load discharge is significant and may include 10 to 20 percent of the total sediment discharge of Dell Creek.
The suspended sediment discharged by Dell Creek was much lower in the 1958 and 1959 water years than that transported by the other three streams. For example, the sediment yield of Dell Creek in the 1959 water year, 25.8 tons per square mile (table 1), equaled about
B30 CONTRIBUTIONS TO THE HYDROLOGY OF THE UNITED STATES
FIGURE 14. Dell Creek at the gaging station near Lake Delton,
one-third of the sediment yield of Black Earth Creek that year. The difference was even greater for the 1958 water year when the yield of Dell Creek was only one-fifth that of Black Earth Creek. The dura tion tables of daily sediment discharge and concentration (tables 2 and 3, respectively) also show that Dell Creek carried less suspended sediment than the other streams.
The suspended load of Dell Creek also differs from the other streams in particle-size gradation. Three analyses with the dispersing medium showed the Dell Creek suspended sediment to be 92 percent clay, 6 percent silt, and 2 percent sand, whereas the particle-size gradations for the other streams were more equally divided between clay and silt. Only one particle-size analysis was made using native stream water as the settling medium. The particle-size distribution obtained by this analysis was the same as that obtained from the portion of the sample analyzed in the dispersing medium.
SEDIMENT CHARACTERISTICS OF STREAMS
WATER TEMPERATURE
B31
Water temperature observations were made once a day at each sta tion using field thermometers accurate to plus or minus about 0.5°F. Temperature records for the complete water years were used to develop duration curves from which table 7 was made.
TABLE 7. Duration table of water temperature, October 1955 to September 1959
Station
Mount Vernon Creek near Mount
Yellowstone River near Blanchardville _
Percent of time water was at or less than temperature indicated
32°F
4.9
4.1 9.6
20
40°F
29
28 35 41
50°F
50
48 47 59
60°F
71
71 60 90
70 OF
95
97 79
100
80°F
100
100 96
Maximum temper
ature (°F)
78
76 89 69
i October 1957 to September 1959.
The temperature duration tables for Black Earth and Mount Vernon Creeks are very similar (table 7). The water temperatures ranged from freezing point to the upper seventies, with about equal percent ages of time at or less than each temperature. The Yellowstone River had the greatest range in water temperature and exceeded 80 °F occasionally in the summer months. During the 1-958 and 1959 water years generally cooler temperatures prevailed at Dell Creek; the freez ing point occurred 20 percent of the time and summer temperatures remained in the 60° to 69° F range.
CHEMICAL QUALITY
The chemical character of the water has an important effect, along with flow conditions, water temperature, and type of material, on the flocculation of the sediment in suspension. The determination of some properties and chemical constituents of the stream waters has been made in connection with the particle-size analyses of the sus pended sediment. The results of the analyses are shown in table 8. These analyses represent only medium to high water discharges, no chemical analyses having been made for the streams at low flow.
B32 CONTRIBUTIONS TO THE HYDROLOGY OF THE UNITED STATES
The wide range of annual precipitation resulted in large differences in the annual runoff and sediment yield of Black Earth Creek, Mount Vernon Creek, and Yellowstone Eiver. Annual precipitation ranged from 20.89 to 38.35 inches at Madison in the 1954 to 1959 water years. For this period, the average was 29.26 inches, which nearly equaled the long-term average of 30.71 inches. The year of highest sediment yield did not always occur during the year of highest runoff. Soil conditions and the form, intensity, and duration of precipitation had a marked effect on the sediment discharge of a stream from a given storm. Higher sediment yields in the warm months resulted from intense rainfall from thunderstorms which cause high storm runoff. Lower sediment yields resulted from gradual runoff from snowmelt over erosion-resistant frozen soil.
Widely different sediment and streamflow characteristics of the four small basins are shown by the data in table 9. The figures for average runoff and average sediment yield should be used with caution in
SEDIMENT CHARACTERISTICS OF STREAMS B33
predicting future yields. They are based on too short a period to be valid for long-term predictions.
TABLE 9. Summary of segmentation and stream characteristics, 1955 to 1959water years
Location
Black Earth Creek at Black Earth.........................
Mount Vernon Creek near Mount Vernon ________
Yellowstone River near Blanch-
Drainage area
(sq mi)
45.9
16.1
29.1 44.9
Average annual runoff
(inches)
7.80
12.62
5.50
Annual suspended-
sediment yield (tons per sq mi)
Avg
71.1
95.8
236
Min
27
48
34 4.7
Max
102
171
730 25.8
Average composition of
sediment (percent)
Clay
72
57
42 92
Silt
27
39
56 6
Sand
1
4
2 2
Nearly all the sediment is included in the suspended-sediment dis charges shown for Black Earth Creek and Yellowstone Eiver. On the other hand, bedload may constitute an additional 5 to 10 percent of the sediment discharge of Mount Yernon Creek and 10 to 20 per cent of the total sediment discharge of Dell Creek.
The mean suspended-sediment concentrations of storm runoff were significantly lower in the summer than in the winter. For Black Earth Creek the concentration seldom exceeded 500 ppm in the winter, but frequently exceeded 1,000 ppm in the summer; for the Yellow- stone Eiver the mean concentration of the winter storm runoff aver aged 643 ppm and that of the summer storm runoff averaged 1,670 ppm. The suspended-sediment concentration of summer and winter storm runoff of Mount Yernon Creek was of the same order of magni tude and averaged 696 ppm for 30 storms.
The Yellowstone Eiver basin, with large areas of loess, rugged topography, and steep slopes, had the highest sediment yield. The Mount Yernon Creek basin is second in rank and has primarily loess and silt loam soils. However, the terrain is not as rugged as in the Yellowstone or Black Earth basins. The Black Earth Creek basin, with loess deposits only in the western part and glacial till in the eastern part, ranks third in order of sediment yield. The Dell Creek basin with its sandy loams and sands has a much lower sediment yield than the other three basins. The streams transporting the largest percentage of silt also had the highest average annual sediment yield. Therefore, a possible relationship is indicated between the sediment yield and the availability of silt-size material, or conditions favoring its movement.
B34 CONTRIBUTIONS TO THE HYDROLOGY OP THE UNITED STATES
REFERENCES CITED
Cline, D.R., 1968, Hydrology of upper Black Earth Creek basin, Wisconsin, with a section on Surface Water, by Busby, M. W: U.S. Geol. Survey Water- Supply Paper 1669-C (in press).
Lane, E. W., and others, 1947, Report of the subcommittee on sediment terminol ogy : Am. Geophys. Union Trans., v. 28, no. 6, p. 936-938.
Lane, E. W., and Koelzer, V. A., 1943, A study of methods used in measurements and analysis of sediment loads in streams, Report No. 9, Density of sedi ments deposited in reservoirs : Federal Inter-Agency River Basin Committee, Subcommittee on Sedimentation, U.S. Army, Corps of Engineers, St. Paul, MinB., 60 p.
1959, Commentary to Report No. 9: Federal Inter-Agency Sedimentation Project, Minneapolis, Minn., 3 p.
U.S. Weather Bureau, 1954-60, Climatological data Wisconsin, Annual Sum maries ; Asheville, N.C.: 1953, v. 58, no. 13, p. 183; 1954, v. 59, no. 13, p. 195; 1955, v. 60, no. 13, p. 193; 1956, v. 61, no. 13, p. 197; 1957, v. 62, no. 13, p. 195; 1958, V. 63, no. 13, p. 196; 1959, v. 64, no. 13, p. 198.
1955, Climatological data Wisconsin, February 1955: Asheville, N.C., V. 60, no. 2, p. 25, 28.
1958, Climatological data Wisconsin, February 1958: Asheville, N.C.,V. 63, no. 2, p. 23, 26.