International Journal of Emerging Technology and Advanced Engineering Website: www.ijetae.com (ISSN 2250-2459, ISO 9001:2008 Certified Journal, Volume 2, Issue 12, December 2012) 34 Sedimentation Evaluation at Water Intake Gate of Grati PLTGU Jetty Blockade Dwi Priyantoro 1 , Aniek Masrevaniah 2 , Seto Sugianto Sugianto Prabowo Rahardjo 3 1,2 Department of Water Resources, Faculty of Engineering, University of Brawijaya, Malang of Indonesia 2 Master Program of Water Resources, University of Brawijaya, Malang of Indonesia Abstract- Jetty for water intake channel of PLTGU (Air and Gas Electrical Power) basically was designed as a construction which would minimize the problem of sedimentation. There was very much sedimentation at Grati PLTGU. The aim of this study was to evaluate sedimentation problem jetty water intake channel of Grati PLTGU and to find the dimension of jetty construction with sediment degree was lower than the existing construction. Location of study was at Pasuruan, East Java of Indonesia. It was hoped to get dimension of jetty construction which had low sediment level compared to existing construction. Evaluation of water intake channel used the software of SMS 10.1.8. Based on the evaluation of wave and stream, there were 2 designs of jetty modification as follow: 1) Modification of Jetty-I: it was straight upright designed or with angle of 45 0 to the direction of east-north, jetty in the right side was lengthened until 178 m with diameter of curve was 150 m, jetty in the left side followed the projection of jetty length in the right side due to the angle of 45 0 ; 2) Modification of jetty-II: it followed the design of jetty-I but jetty in the right side was placed at the distance of 20 m from breaking wave. Keywords- jetty, sedimentation, water intake channel I. INTRODUCTION Sedimentation occurred usually from soil erosion in at catchment area. The sedimentation level of severity was depending on the type of soil, topography, rainfall intensity, and vegetation cover. From an economics perspective reservoir were assets that provided services across a period of time. While sedimentation reduced the storage volume, it also reduced the benefits that could be derived from services provided by the reservoir over time and ultimately shortened its economics life [1]. The quantitative understanding of hydrodynamic and sediment transport on intertidal mudflats were important for the management of estuaries and environmental protection [2]. The sediment transport and hydrodynamics on the mudflats were influenced by processes with a range of times scales due to freshwater discharge, tides, and wind waves their interactions [3]. Nowadays, jetty was more used as coastal safety at industry that used sea water for their need. Beside as breaking wave utilization, jetty was also used for water intake channel as water channel in the direction to industry. Therefore, the design had to be free of sedimentation. There were many jetty constructions at Indonesia that was used as water intake channel of industry. One of them was Grati PLTGU (Air and Gas Electrical Power), Pasuruan of Indonesia. Planning of jetty which was used for water intake channel of PLTG was basically designed as construction that would minimize the problem of sedimentation. There was so much sedimentation at water intake channel of Grati PLTGU. It could be seen at the activity of operation and maintenance that was sediment dredging in intake direction of Grati PLTGU. Based on the problem as above, it was suspected that the sedimentation at water intake channel of Grati PLTGU was caused by inaccuracy in design. This design was related to the length, width, and located angle of construction to the direction of coming wave. Hence, it was necessary to accurately evaluate and improve fitted to existing condition. To know the quantity of sediment due to the new design of jetty construction, it was needed accurate modelling to detect the effect of design change of jetty construction. Nowadays, updated software modelling was SMS 10.1.8 (Surface Water Modelling System) which could be simulated occurred sedimentation due to construction design after changes. II. MATERIALS AND METHODS This research was as literature study. Data used in this study were collected from PT Indonesia Power Unit Bisnis Pembangkitan (UBP, Indonesian Power Unit of Generation Business). Location was at Perak-Grati, Wates Village, Lekok District, Pasuruan Regency, and East Java of Indonesia. The PLTGU was located at about 30 km from Pasuruan City and it was included Perak PLTU (Air Electrical Power) at Surabaya and Grati PLTGU (Air and Gas Electrical Power). Perak PLTU and Grati PLTGU had a distance of ± 90 km to each other; total of installed capacity for both of them was 864.08 MW Jetty was a construction which was straight upright at coast and located at both sides of estuary. This construction was functioned for decreasing the groove shallowing of the both sides by coastal sediment. The usage of river estuary as sailing groove and sedimentation at estuary could disturb the coastal traffic.
Transcript
International Journal of Emerging Technology and Advanced Engineering
Website: www.ijetae.com (ISSN 2250-2459, ISO 9001:2008 Certified Journal, Volume 2, Issue 12, December 2012)
34
Sedimentation Evaluation at Water Intake Gate of Grati
PLTGU Jetty Blockade Dwi Priyantoro
1, Aniek Masrevaniah
2, Seto Sugianto Sugianto Prabowo Rahardjo
3
1,2Department of Water Resources, Faculty of Engineering, University of Brawijaya, Malang of Indonesia
2Master Program of Water Resources, University of Brawijaya, Malang of Indonesia
Abstract- Jetty for water intake channel of PLTGU (Air
and Gas Electrical Power) basically was designed as a
construction which would minimize the problem of
sedimentation. There was very much sedimentation at Grati
PLTGU. The aim of this study was to evaluate
sedimentation problem jetty water intake channel of Grati
PLTGU and to find the dimension of jetty construction with
sediment degree was lower than the existing construction.
Location of study was at Pasuruan, East Java of Indonesia.
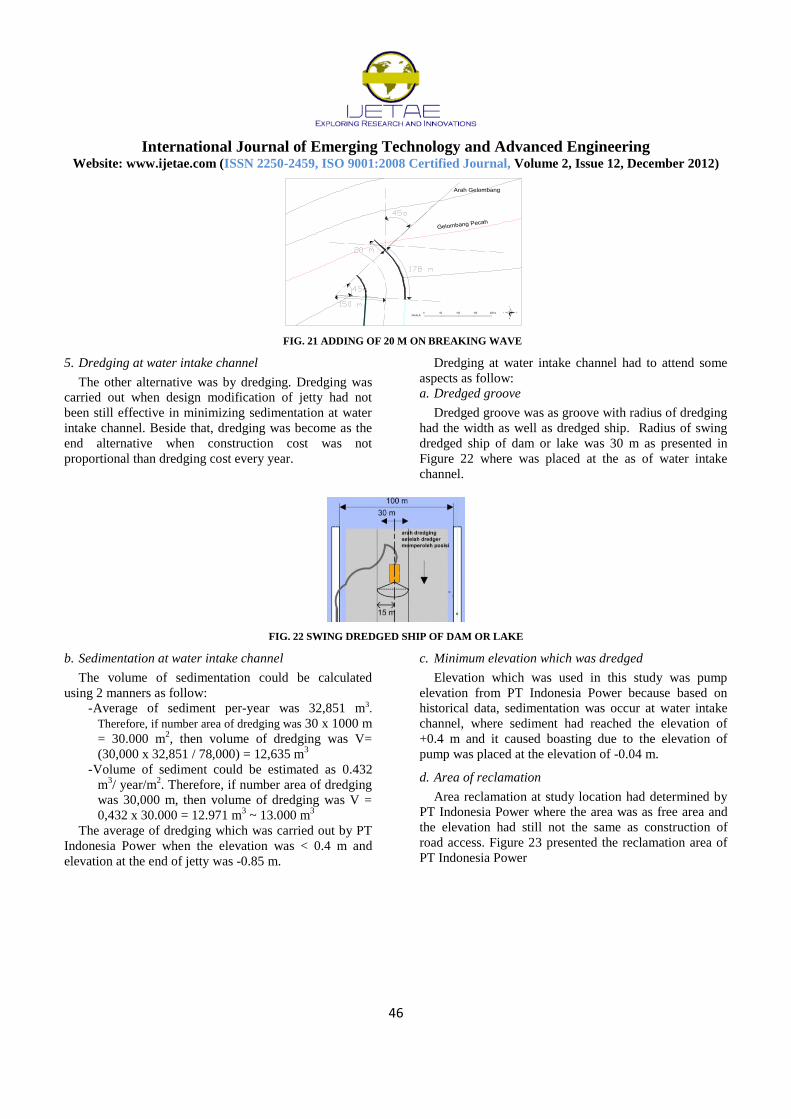
It was hoped to get dimension of jetty construction which
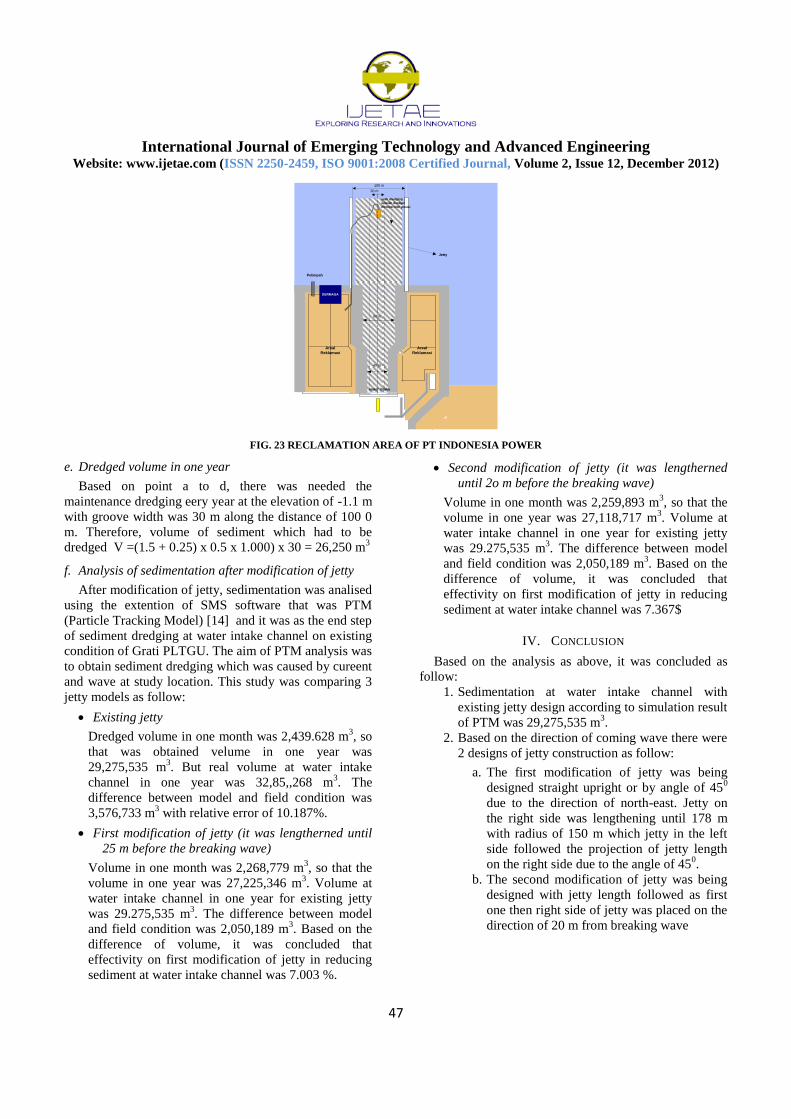
had low sediment level compared to existing construction.
Evaluation of water intake channel used the software of
SMS 10.1.8. Based on the evaluation of wave and stream,
there were 2 designs of jetty modification as follow: 1)
Modification of Jetty-I: it was straight upright designed or
with angle of 450 to the direction of east-north, jetty in the
right side was lengthened until 178 m with diameter of
curve was 150 m, jetty in the left side followed the
projection of jetty length in the right side due to the angle of
450; 2) Modification of jetty-II: it followed the design of
jetty-I but jetty in the right side was placed at the distance
of 20 m from breaking wave.
Keywords- jetty, sedimentation, water intake channel
I. INTRODUCTION
Sedimentation occurred usually from soil erosion in at
catchment area. The sedimentation level of severity was
depending on the type of soil, topography, rainfall
intensity, and vegetation cover. From an economics
perspective reservoir were assets that provided services
across a period of time. While sedimentation reduced the
storage volume, it also reduced the benefits that could be
derived from services provided by the reservoir over time
and ultimately shortened its economics life [1]. The
quantitative understanding of hydrodynamic and
sediment transport on intertidal mudflats were important
for the management of estuaries and environmental
protection [2]. The sediment transport and
hydrodynamics on the mudflats were influenced by
processes with a range of times scales due to freshwater
discharge, tides, and wind waves their interactions [3].
Nowadays, jetty was more used as coastal safety at
industry that used sea water for their need. Beside as
breaking wave utilization, jetty was also used for water
intake channel as water channel in the direction to
industry.
Therefore, the design had to be free of sedimentation.
There were many jetty constructions at Indonesia that
was used as water intake channel of industry. One of
them was Grati PLTGU (Air and Gas Electrical Power),
Pasuruan of Indonesia. Planning of jetty which was used
for water intake channel of PLTG was basically designed
as construction that would minimize the problem of
sedimentation. There was so much sedimentation at water
intake channel of Grati PLTGU. It could be seen at the
activity of operation and maintenance that was sediment
dredging in intake direction of Grati PLTGU.
Based on the problem as above, it was suspected that
the sedimentation at water intake channel of Grati
PLTGU was caused by inaccuracy in design. This design
was related to the length, width, and located angle of
construction to the direction of coming wave. Hence, it
was necessary to accurately evaluate and improve fitted
to existing condition. To know the quantity of sediment
due to the new design of jetty construction, it was needed
accurate modelling to detect the effect of design change
of jetty construction. Nowadays, updated software
modelling was SMS 10.1.8 (Surface Water Modelling
System) which could be simulated occurred
sedimentation due to construction design after changes.
II. MATERIALS AND METHODS
This research was as literature study. Data used in this
study were collected from PT Indonesia Power Unit
Bisnis Pembangkitan (UBP, Indonesian Power Unit of
Generation Business). Location was at Perak-Grati,
Wates Village, Lekok District, Pasuruan Regency, and
East Java of Indonesia. The PLTGU was located at about
30 km from Pasuruan City and it was included Perak
PLTU (Air Electrical Power) at Surabaya and Grati
PLTGU (Air and Gas Electrical Power). Perak PLTU and
Grati PLTGU had a distance of ± 90 km to each other;
total of installed capacity for both of them was 864.08
MW
Jetty was a construction which was straight upright at
coast and located at both sides of estuary. This
construction was functioned for decreasing the groove
shallowing of the both sides by coastal sediment. The
usage of river estuary as sailing groove and
sedimentation at estuary could disturb the coastal traffic.
International Journal of Emerging Technology and Advanced Engineering
Website: www.ijetae.com (ISSN 2250-2459, ISO 9001:2008 Certified Journal, Volume 2, Issue 12, December 2012)
35
To accommodate this need, jetty had to be long until
the edge was outside of breaking wave [4][5]. Sediment
transport of coast was held due to long jetty and sailing
line at wave condition was not broken so that was
possible for the ship bewitch to estuary of the river. Jetty
could also be used to prevent the shallowing at estuary
due to flood control. Rivers which emptied into sandy
coast with big enough of wave often went through
estuary closing by sandy sediment. Because of the
influence of wave and wind, sandy sediment was formed
at estuary. Sediment transport along the coast was also
very influenced to the sediment forming. Sand that went
through in front of estuary would be pushed enter to
estuary by wave and then it was precipitated. The very
big sediment could cause river estuary was closed [6].
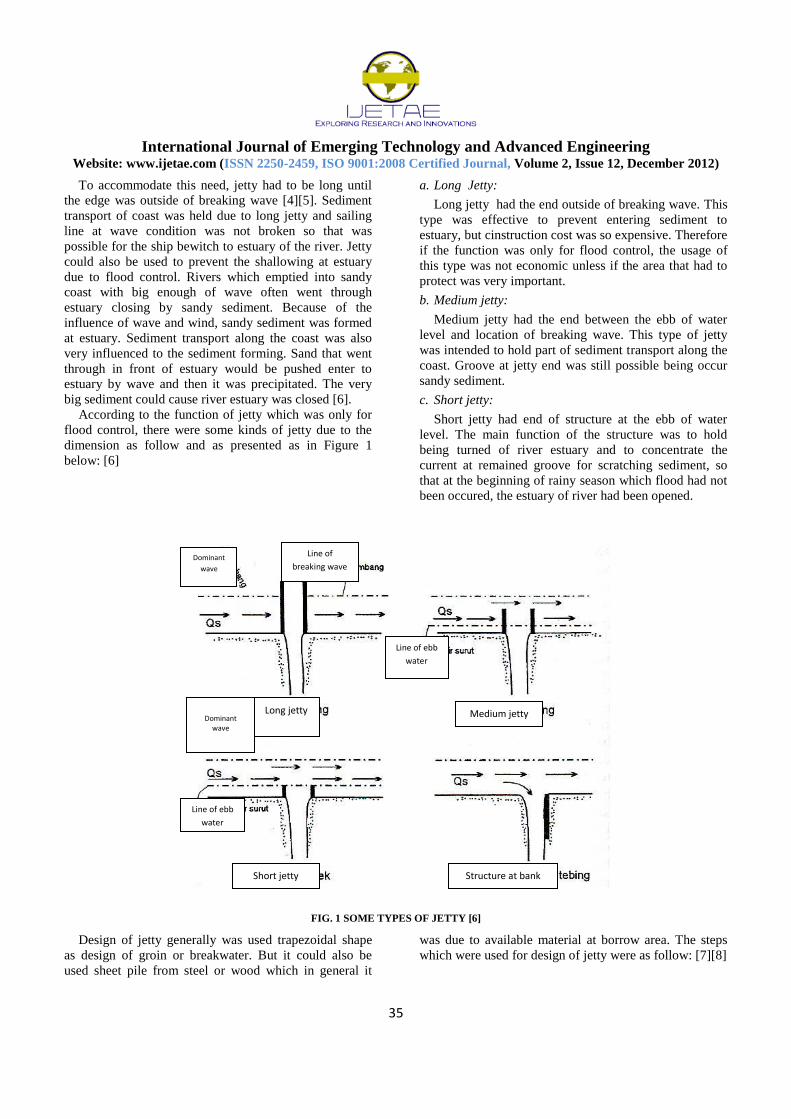
According to the function of jetty which was only for
flood control, there were some kinds of jetty due to the
dimension as follow and as presented as in Figure 1
below: [6]
a. Long Jetty:
Long jetty had the end outside of breaking wave. This
type was effective to prevent entering sediment to
estuary, but cinstruction cost was so expensive. Therefore
if the function was only for flood control, the usage of
this type was not economic unless if the area that had to
protect was very important.
b. Medium jetty:
Medium jetty had the end between the ebb of water
level and location of breaking wave. This type of jetty
was intended to hold part of sediment transport along the
coast. Groove at jetty end was still possible being occur
sandy sediment.
c. Short jetty:
Short jetty had end of structure at the ebb of water
level. The main function of the structure was to hold
being turned of river estuary and to concentrate the
current at remained groove for scratching sediment, so
that at the beginning of rainy season which flood had not
been occured, the estuary of river had been opened.
FIG. 1 SOME TYPES OF JETTY [6]
Design of jetty generally was used trapezoidal shape
as design of groin or breakwater. But it could also be
used sheet pile from steel or wood which in general it
was due to available material at borrow area. The steps
which were used for design of jetty were as follow: [7][8]
Long jetty
Dominant
wave
Line of
breaking wave
Dominant
wave
Medium jetty
Line of ebb
water
Short jetty
Line of ebb
water
Structure at bank
International Journal of Emerging Technology and Advanced Engineering
Website: www.ijetae.com (ISSN 2250-2459, ISO 9001:2008 Certified Journal, Volume 2, Issue 12, December 2012)
36
1. To analize generation of wave for determining
height and period of wave based on corrected of
wind tension factor.
2. To analyze length of fetch from topography map.
3. To analyze rose wave which gave interpretation of
wave data frequency according to the direction
group and classification of wave height in
precentage of wave number.
4. To analize data of yearly significant wave using the
method of JONSWAP
5. To analyze design wave for determining wave
height with certain return period.
6. To analyze SMS model of ADCIRC
7. To analize refraction and breaking of wave using
model of CMS-WAVE and ST-WAVE
8. To control the height of Run Up
9. Modification pattern of jetty
10. To calculate sediment using model of PTM.
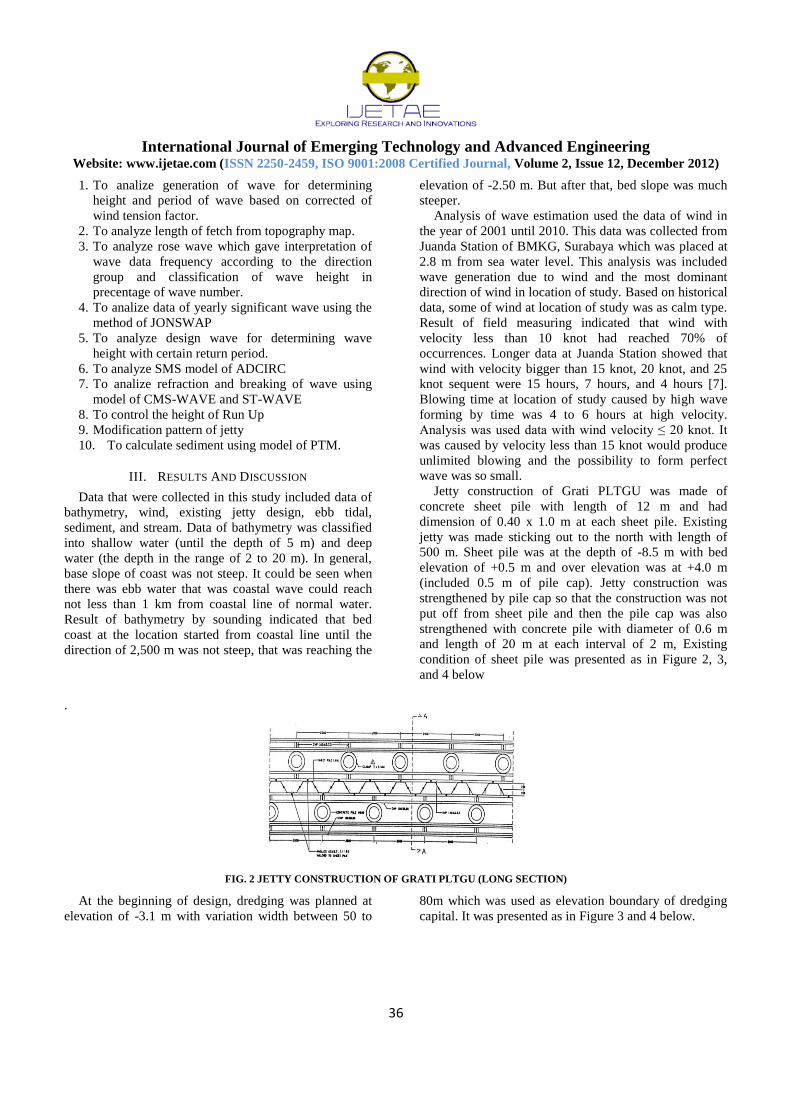
III. RESULTS AND DISCUSSION
Data that were collected in this study included data of


![Intake-Form.docx · Web viewPROJECT INTAKE FORM [PIF] Email the completed Project Intake Form to intake@vinecrestinvestments.com. as an editable MS Word attachment. Be sure to complete](https://static.documents.pub/doc/80x56/5e08269ea6d01c1aa7038e88/intake-formdocx-web-viewproject-intake-form-pif-email-the-completed-project.jpg)


