+ All Categories
Home > Documents > Sedimentation in Small Dams-3

Sedimentation in Small Dams-3

Date post: 30-Nov-2015
Category:
Upload: muazeemk
View: 42 times
Download: 3 times
Share this document with a friend
Description:
Sediments in Small Dams
92
Sedimentation in small dams Development of a catchment characterisation and sediment yield prediction procedure P Lawrence A Lo Cascio Dr P Goldsmith C L Abbott Report OD TN 120 Rev 0.0 January 2004
Transcript

Sedimentation in small damsDevelopment of a catchment characterisation andsediment yield prediction procedure

P Lawrence A Lo CascioDr P GoldsmithC L Abbott

Report OD TN 120Rev 0.0January 2004

Sedimentation in small damsDevelopment of a catchment characterisation and sediment yield prediction procedure

OD TN 120 ii Rev 0.0

����

Document Information

Project Uptake of Tools for Mitigating Sedimentation

Report title Sedimentation in small dams – Development of a catchmentcharacterisation and sediment yield prediction procedure

Client DFIDClient Representative Mr. M EdwardsProject No. DFID Project R7391 HR Project MDS0533Report No. OD TN 120Doc. ref. OD TN 120 - Catchment characterisation.docProject Manager P LawrenceProject Sponsor J Skutsch

Document HistoryDate Revision Prepared Approved Authorised Notes14/01/04 0.0

ContractThis report is an output of the Department for International Development’s (DFID)Knowledge and Research contract R 7391, Uptake of tools for mitigating sedimentation,carried out by HR Wallingford Ltd. The HR Wallingford job No. was MDS 0533. Theviews expressed are not necessarily those of DFID.

DFID KAR project details are:

Theme: W5 Improved availability of water for sustainable food production andrural development

Project title Uptake of tools for mitigating sedimentationProject number R 7391Start date 31 August 1999End Date 31 March 2003

Prepared

Approved

Authorised

© HR Wallingford Limited

This report is a contribution to research generally and it would be imprudent for third parties to rely on it inspecific applications without first checking its suitability. Various sections of this report rely on data supplied by ordrawn from third party sources. HR Wallingford accepts no liability for loss or damage suffered by the client orthird parties as a result of errors or inaccuracies in such third party data. HR Wallingford will only acceptresponsibility for the use of its material in specific projects where it has been engaged to advise upon a specificcommission and given the opportunity to express a view on the reliability of the material for the particularapplications.

Sedimentation in small damsDevelopment of a catchment characterisation and sediment yield prediction procedure

OD TN 120 iii Rev 0.0

����

Executive Summary

Sedimentation in small dams

Development of a catchment characterisation and sediment yield procedure

P LawrenceA Lo CascioDr P GoldsmithC L Abbott

Report OD TN 120January 2004

NGO’s and Government Agencies have constructed thousands of small dams in semi-aridregions of East and Southern Africa to provide water for livestock and small-scale irrigation.The effective life of many of these dams is reduced by excessive siltation – some small damssilt up after only a few years. This issue is poorly covered in the many small dam designmanuals that are available, which mostly focus on civil engineering design and constructionaspects. While a capability to estimate future siltation is needed to ensure that dams are sizedcorrectly, and are not constructed in catchments with very high sediment yields, littleguidance is available to small dam planners and designers.

The British Government’s Department for International Development commissioned HRWallingford to develop guidelines presenting appropriate methods for predicting, and wherepossible reducing, siltation rates in small communal dams in semi-arid zones in Eastern andSouthern Africa. Small dam designers must be able to use these methods; they typically needto carry out assessments rapidly using limited local data, and may not have software skills oraccess to computers.

The report describes the development of a method for predicting small dam catchmentsediment yields. The objective was to develop a simple procedure which would distinguishbetween dams that will silt up rapidly from dams that will have a sedimentation lifetime well inexcess of twenty years.

The report describes:

a) Surveys of small dams located in Tanzania and Zimbabwe, to quantify small damcatchment sediment yields (chapter 2).

b) The development and testing of a rapid qualitative catchment characterisation procedure(chapter 3).

c) The development of an approximate predictive relationship using the results of a) and b)above to provide a means of predicting sediment yields from small dam catchments(chapter 4).

Sedimentation in small damsDevelopment of a catchment characterisation and sediment yield prediction procedure

OD TN 120 iv Rev 0.0

����

Executive Summary continued

Surveys of seventeen small dams in Zimbabwe and Tanzania showed annual sedimentationrates ranging between 50 % and 0.5 %, which translate to approximate sedimentationlifetimes ranging between two and two hundred years. The median sedimentation rate was2.6 %/year, giving a sedimentation lifetime for a “typical ” small dam of approximatelythirty-eight years. Of course the useful life of a “typical ” small dam would be far shorterthan thirty-eight years, due to the proportionately larger evaporative losses that occur assiltation reduces water depths, resulting in an increasingly larger proportion of the storedwater being lost to evaporation. In the guidelines a siltation life of forty years is taken as theminimum sedimentation lifetime required to ensure that useful quantities of water can bestored and abstracted over the twenty-year economic life usually assumed for small damstudies. About 15% of the surveyed dams were, or will be, completely filled with sedimentwithin twenty years of construction.

Sediment yields derived from small dam surveys range between 120 t/km2/y and 3400t/km2/y, a wide enough range to provide the data needed to calibrate the sediment yieldrelationship.

Requirements for data and computational modelling skills rule out the use of moresophisticated methods to predict sediment yields, and a simple regional sediment yieldpredictor was chosen for this application. Sediment yields are estimated by carrying out arapid catchment characterisation procedure, to score qualitative factors describing soil type,crop cover, and signs of erosion. These are included with quantitative information on slopes,rainfall and catchment area in a simple predictive function calibrated using measuredcatchment sediment yields. The text descriptions used to assign qualitative catchmentparameters into one of four classes, and the numerical weighting used in the scoring system,incorporate the extensive combined knowledge and experience of the teams that developedthe procedure.

Characterisation involves completing a checklist during a field visit. Assessments are basedon information collected from interviewing local residents, and observations made whilewalking a number of randomly chosen transects across the catchment. It is possible to carryout an assessment in a typical small dam catchment within a day’s work. Assessments arebest carried out at the end of the main dry season, when vegetation cover is at its lowest, andthe soils most prone to erosion.

Catchment factors were selected for inclusion in the predictive relationship on the basis oftheir correlation with the measured sediment yields, they are:

• Signs of active soil erosion (SASE);• Soil type and drainage (STD);• Vegetation conditions over the whole catchment (VC);• Catchment slope (Slope).

When combined, these factors are taken as a proxy for erosion hazard. This is converted to asediment yield by including two additional factors to account for sediment delivery effects, thecatchment area (Area), and the mean annual rainfall (MAR).

The predictive equation is:

SY = 0.0194 Area –0.2 MAR0.7 Slope 0.3 SASE 1.2 STD 0.7 VC 0.5

Sedimentation in small damsDevelopment of a catchment characterisation and sediment yield prediction procedure

OD TN 120 v Rev 0.0

����

Executive Summary continued

Regression analysis was used to derive the constant and exponents in the equation, which has acorrelation coefficient of 0.95 and a standard error of 198. In this case 88% of the predictedannual sediment yields are within the “half to twice” range when compared with observedyields. Although the comparison is for data used in the derivation of the equation, and not anindependent data set, this is an encouraging result given the large uncertainties involved inmeasuring catchment sediment yields, and compares well with the performance of empiricalpredictors based entirely on quantitative factors developed in the past for use in much largercatchments. The wide range of sediment yields predicted by the equation are similar to the rangein observed sediment yields in East and Southern Africa compiled for the study, a result thatprovides further support for the utility of the method.

Sedimentation in small damsDevelopment of a catchment characterisation and sediment yield prediction procedure

OD TN 120 vi Rev 0.0

����

Sedimentation in small damsDevelopment of a catchment characterisation and sediment yield prediction procedure

OD TN 120 vii Rev 0.0

����

ContentsTitle page iDocument Information iiExecutive Summary iiiContents vii

1. Background ...................................................................................................................... 11.1 Introduction ......................................................................................................... 11.2 Sediment yields in East and Southern Africa ...................................................... 2

2. Small dam sedimentation rates and catchment sediment yields....................................... 42.1 Dam sedimentation surveys ................................................................................. 42.2 Sedimentation Rates and Catchment Sediment Yields........................................ 5

3. Catchment characterisation .............................................................................................. 83.1 Review of methods for predicting soil erosion and sediment yield..................... 83.2 Development of the Catchment Characterisation Procedure ............................... 93.3 Carrying out a catchment characterisation........................................................... 93.4 Application of the catchment characterisation procedure to the catchments in

Zimbabwe and Tanzania.................................................................................... 10

4. A regional small catchment sediment yield predictor .................................................... 114.1 Development of the predictive function ............................................................ 114.2 Application to different regions......................................................................... 13

5. Summary of principle conclusions ................................................................................. 145.1 Small dam sedimentation rates and catchment sediment yields ........................ 145.2 Catchment characterisation procedure............................................................... 145.3 Regional small catchment sediment yield predictor .......................................... 15

6. Acknowledgements ........................................................................................................ 16

7. References ...................................................................................................................... 177.1 Sources of sediment yield data for East and Southern Africa ........................... 177.2 Small dam design references ............................................................................. 177.3 General references ............................................................................................. 18

TablesTable 1 Distribution of median sediment yields by world region (from Lawrence and

Dickinson (1995)) ...................................................................................................... 2Table 2 Summary of dam sedimentation rates and catchment sediment yields...................... 6

FiguresFigure 1 Sediment Yield Data for East and Southern Africa ................................................... 3Figure 2 Location of surveyed dams in Zimbabwe.................................................................. 4Figure 3 Location of surveyed dams in Tanzania .................................................................... 5Figure 4 Small dam siltation rates............................................................................................ 7Figure 5 Observed and predicted sediment yields.................................................................. 12

Sedimentation in small damsDevelopment of a catchment characterisation and sediment yield prediction procedure

OD TN 120 viii Rev 0.0

����

Contents continued

AnnexesAnnex 1 Dam sedimentation rates and catchment sediment yieldsAnnex 2 Details of dam surveysAnnex 2a CARE Dams Survey Cross-sectionsAnnex 2b Kiteto Dams Survey ResultsAnnex 3 Catchment Characterisation

Sedimentation in small damsDevelopment of a catchment characterisation and sediment yield prediction procedure

OD TN 120 1 Rev 0.0

����

1. Background1.1 INTRODUCTION

There are strong links between the availability of water for agriculture and livestockproduction, and incomes of the rural poor (HR Wallingford, 2003a). One means ofincreasing the resilience of the rural poor to the shocks produced by rainfallvariations, particularly droughts, is to store water in small dams to irrigate crops andwater cattle. NGO’s and Government Agencies have constructed thousands of smalldams in semi-arid regions of East and Southern Africa, but the useful life of many ofthese dams is reduced by excessive siltation - some small dams silt up after only afew years. This issue is poorly covered in the many small dam design manuals thatare available, which mostly focus on civil engineering design and constructionaspects1. Procedures for assessing the viability and sustainability of small dams aremostly covered in a very rudimentary way, or ignored.

A capability to estimate future siltation rates in small dams is essential to ensure that:

• Dams are sized correctly;

• Dams are not constructed in catchments with excessively large sediment yields;

• Catchments where the rapid introduction of soil and water conservationmeasures will be essential if a reasonable dam life is to be obtained are identifiedearly enough for conservation activities to have a significant impact on damsiltation.

The British Government’s Department for International Development (DFID)commissioned HR Wallingford to develop guidelines presenting appropriate methodsfor predicting, and where possible reducing, siltation rates in small communal damsin semi-arid zones in Eastern and Southern Africa. Small dam designers must be ableto use these methods; they typically need to carry out assessments rapidly usinglimited local data, and may not have software skills or computers.

The series of reports describing the outputs from the project are listed below:

Report Title Report NumberGuidelines for predicting and minimising sedimentation in small dams OD 152

Sedimentation in small dams – impacts on the incomes of poor ruralcommunities

OD TN 118

Sedimentation in small dams – hydrology and drawdown computations OD TN 119

Sedimentation in small dams – development of catchmentcharacterisation and sediment yield prediction procedures

OD TN 120

Sedimentation in small dams – the potential for catchmentconservation, check dams and sediment bypassing to reduce damsiltation rates

OD TN 121

1 The design manuals reviewed as part of this study are listed in chapter 7.

Sedimentation in small damsDevelopment of a catchment characterisation and sediment yield prediction procedure

OD TN 120 2 Rev 0.0

����

Sedimentation rates in dams are controlled by two parameters. The first, theproportion of the annual runoff from the dam catchment that is stored, is to someextent under the control of the designer through the selection of the dam height andstorage capacity. The second is the sediment yield from the dam catchment, which isdetermined by soil erosion rates, and the sediment transport processes that controlthe delivery of eroded sediment via the fluvial system to the dam. This has to beestimated if future sedimentation rates in a dam are to be predicted. This reportdescribes the development of a simple regional sediment yield prediction methodthat is used in the guidelines to predict the sediment yields from the catchments ofexisting or proposed small dams. It is based on a rapid qualitative catchmentcharacterisation procedure that was developed with the assistance of projectcollaborators listed in Chapter 6.

The activities supporting the development of the sediment yield predictor included:

a) Surveys of small dams located in Tanzania and Zimbabwe, to quantify damsedimentation rates and catchment sediment yields, as described in chapter 2.

b) Developing and testing a rapid qualitative catchment characterisation procedure,as described in chapter 3.

c) Developing an approximate predictive relationship using the results of a) and b),to provide a means of predicting sediment yields from small dam catchments, asdescribed in chapter 4.

1.2 SEDIMENT YIELDS IN EAST AND SOUTHERN AFRICACatchments in Africa have a median sediment yield a little larger than the globalaverage, as illustrated in table 1.

Table 1 Distribution of median sediment yields by world region (from Lawrence andDickinson (1995))

Region Median annual sedimentyield t/km2

North America and Europe 52South America 178Africa 299Asia 391Oceania 770World 252

Lowest sediment yields are associated with the developed regions of North Americaand Europe, while Asia has larger than average yields. The highest yields are foundin Oceania, a region with many small steep catchments in geologically unstablezones.

An expanded data set describing sediment yields for East and Southern Africa wascompiled for this study from the references listed in chapter 7. These are plotted infigure 1, which indicates that annual sediment yields may vary over three orders ofmagnitude, from less than 5 t/km2 to more than 5000 t/km2. The mean annualsediment yield is 490 t/km2, while the median yield is 208 t/km2. (The median yield

Sedimentation in small damsDevelopment of a catchment characterisation and sediment yield prediction procedure

OD TN 120 3 Rev 0.0

����

from this data set is lower than that for “Africa” shown in table 1, as the latterincludes data from North Africa where some extremely high sediment yields areobserved.)

1

10

100

1000

10000

1 10 100 1000 10000 100000 1000000

Catchment Area (km2)

Sedi

men

t Yie

ld (T

/km

2 /yr) South Africa

KenyaLesothoEthiopiaEritreaTanzaniaZimbabwe

Figure 1 Sediment Yield Data for East and Southern Africa

Most of the data in figure 1 are for catchments with areas that are several orders ofmagnitude larger than the catchment areas of typical small dams. In general, sedimentyields expressed on a per unit area basis tend to increase with reducing catchment area,and many of the existing data are not directly applicable to small dam studies withoutadjustment to reflect the effects of catchment size. However for a typical small dam theobserved range of sediment yields translates to approximate dam sedimentation lifetimes ranging from hundreds of years to only one or two years. This is of course what isobserved – some small dams constructed in the 1940’s and 1950’s are still functioning,while others have silted up within a few years following construction.

The procedure described later has to be capable of predicting this very wide range ofobserved sediment yields. On the other hand, precise predictions, even if these werepossible given the low accuracy of available methods for predicting soil erosion andsediment transport, are not essential. Quite a large tolerance on predicted yields will beacceptable, provided the prediction procedure allows dams that will have a very shortlifetime to be identified rapidly at the design stage of projects. The objective is todevelop a simple procedure, with minimal data requirements, that will distinguish damsthat will silt up rapidly from dams that will have a sedimentation lifetime of forty yearsor longer2.

2 A sedimentation lifetime of forty years is adopted in the guidelines as the minimum required if the damis to provide useful water yields at the end of the twenty year economic life usually assumed in small damprojects.

Sedimentation in small damsDevelopment of a catchment characterisation and sediment yield prediction procedure

OD TN 120 4 Rev 0.0

����

2. Small dam sedimentation rates and catchmentsediment yields

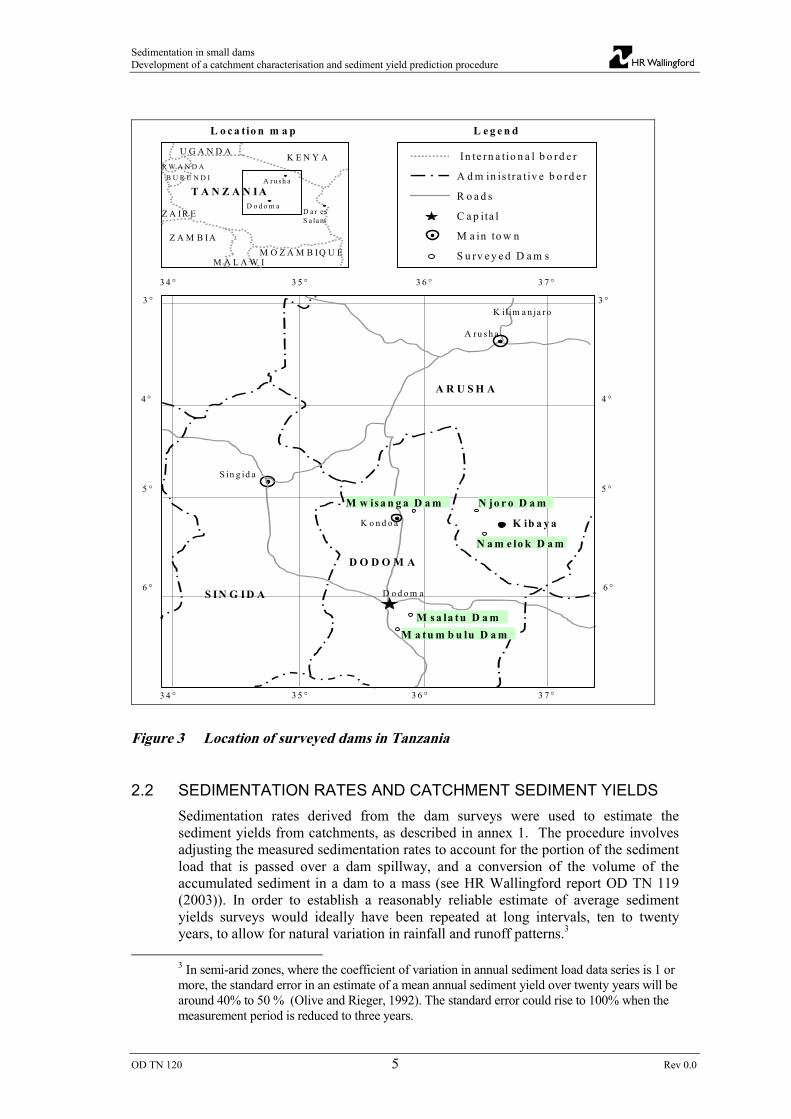
2.1 DAM SEDIMENTATION SURVEYSIn order to determine sedimentation rates hydrographic surveys were carried out attwelve small dams in Zimbabwe, and two small dams in Tanzania. As most of thesedams were surveyed annually over three wet seasons a total of thirty-eight surveys werecarried out by the project. Information on sedimentation rates at three further dams inTanzania, reported by Christiansson (1981) and Edvinsson (2001), were also utilised.The survey methods adopted at each dam are described in annex 1. Dam survey resultsare presented in detail in annex 2. The locations of the surveyed dams are shown infigures 2 and 3.

Figure 2 Location of surveyed dams in Zimbabwe

International border

Administrative border

Roads

Capital

Main town

Surveyed Dams

LegendLocation map

Chivu

Zvishavane

Masvingo

Gweru

Mutare

MASVINGO

MIDLANDS

MANICALAND

30° 32°31°

20°

19°

21°

30° 32°31°19°

20°

21°

Dove Dam

Chengwe Dam

Gari Dam

Jechera Dam

Murambi Dam

Mutangi DamNymai Dam

Chihava Dam

Tinogona Dam

Ngondo DamTakavarasha Dam

SOUTH AFRICA

MOZAMBIQUE

BOTSWANA

ZAMBIA

Harare

Masvingo

ZIMBABWE

Sekenende Dam

Sedimentation in small damsDevelopment of a catchment characterisation and sediment yield prediction procedure

OD TN 120 5 Rev 0.0

����

In te rn a t io n a l b o rd e r

A d m in is tra t iv e b o rd e r

R o a d s

C a p ita l

M a in to w n

S u rv e y e d D a m s

L e g e n d

5 °

6 °

4 °

3 5 ° 3 6 ° 3 7 °

5 °

6 °

4 °

3 5 ° 3 6 ° 3 7 °3 4 °

3 4 °

3 ° 3 °

D O D O M A

S IN G ID A

A R U S H A

D o d o m a

S in g id a

A ru s h a

K ilim a n ja ro

N jo r o D a m

N a m e lo k D a m

M a tu m b u lu D a mM s a la tu D a m

K ib a y a

L o c a tio n m a p

D o d o m a

A ru s h a

D a r e sS a la m

K E N Y AR W A N D A

U G A N D A

T A N Z A N IAB U R U N D I

Z A M B IA

Z A IR E

M O Z A M B IQ U EM A L A W I

K o n d o a

M w is a n g a D a m

Figure 3 Location of surveyed dams in Tanzania

2.2 SEDIMENTATION RATES AND CATCHMENT SEDIMENT YIELDSSedimentation rates derived from the dam surveys were used to estimate thesediment yields from catchments, as described in annex 1. The procedure involvesadjusting the measured sedimentation rates to account for the portion of the sedimentload that is passed over a dam spillway, and a conversion of the volume of theaccumulated sediment in a dam to a mass (see HR Wallingford report OD TN 119(2003)). In order to establish a reasonably reliable estimate of average sedimentyields surveys would ideally have been repeated at long intervals, ten to twentyyears, to allow for natural variation in rainfall and runoff patterns.3

3 In semi-arid zones, where the coefficient of variation in annual sediment load data series is 1 ormore, the standard error in an estimate of a mean annual sediment yield over twenty years will bearound 40% to 50 % (Olive and Rieger, 1992). The standard error could rise to 100% when themeasurement period is reduced to three years.

Sedimentation in small damsDevelopment of a catchment characterisation and sediment yield prediction procedure

OD TN 120 6 Rev 0.0

����

In this study in most cases sediment accumulations were measured over three wet seasons4,and thus may not be very representative of the long-term means. The measured damsedimentation rates, and estimated catchment sediment yields are listed in table 2.

Table 2 Summary of dam sedimentation rates and catchment sediment yields

Dam Periodsedimentationmonitored(years)

Dam – meanannualsedimentationrate (%)

Catchmentsediment yield(t/km2/year)

Dam capacity/inflow ratio

Chengwe 3 2.61 269 0.11Sekenende 3 3.05 123 0.04Gari 3 1.17 126 0.34Mutangi 3 2.11 406 0.31Nyimai 3 3.22 212 0.07Tinogona 3 2.53 858 0.56Jechera 3 1.71 203 0.07Murambi 3 1.17 370 0.28Dove 15 2.95 152 0.05Chihava 11 8.22 1823 0.30Ngondo 22 4.50 657 0.16Takavarasha 2 50.0 330 0.005Namelok 47 0.47 122 0.39Njoro 25 1.25 157 0.18Msalatu 27 1.15 736 0.80Mwisanga 14 4.00 3392 0.47Matumbulu 12 2.60 588 0.45

Annual sedimentation rates ranged between 0.5 % and 50 %, which translate toapproximate dam sedimentation lifetimes ranging between two and two hundredyears. The largest annual sedimentation rate (50%) occurred in the Takavarasha damin Zimbabwe, which is a small dam located in a very large catchment. In this case thesediment yield from the dam catchment is not particularly large, and the excessivelyrapid sedimentation rate is attributed to the gross mismatch between the damcapacity and the annual inflow. The capacity inflow ratio is only 0.005, i.e. the damcould store only 0.5 % of the mean annual runoff, but will have trapped a largepercentage of the annual sediment inflow.

The median annual siltation rate, excluding the result for Takavarasha, is 2.6 % peryear, giving a sedimentation lifetime for an “average” small dam of approximatelythirty-eight years. The useful life of the “average” dam would of course be far lessthan thirty-eight years, due to the proportionately larger evaporative losses that occurin the later years as siltation reduces the dam depth, and an increasingly largerproportion of the stored water is lost to evaporation. Evaporative losses are large insmall dams, which typically have average water depths of only a few metres, and arelocated in regions where the evaporation rates range between one and two metres per

4 The maximum period that could be accommodated within DFID’s project funding cycle.

Sedimentation in small damsDevelopment of a catchment characterisation and sediment yield prediction procedure

OD TN 120 7 Rev 0.0

����

year. When a dam is heavily silted most of the stored water will be evaporated unlessit is abstracted very early in the dry season.

Only 46% of surveyed dams will have a sedimentation life of forty years or longer.Forty years is the minimum sedimentation lifetime adopted in the guidelines toensure that useful quantities of water can be stored and abstracted at the end of thetwenty year economic life usually assumed for small dam studies. About 15 % of thesurveyed dams were, or will be, filled with sediment in less than twenty yearsfollowing construction.

The surveyed small dam siltation rates are compared with data from larger dams inZimbabwe (Bake, 1986), and average siltation rates for dams in the USA (White,2001) in Figure 4.

0.0

1.0

2.0

3.0

4.0

5.0

6.0

7.0

8.0

9.0

10.0

1 10 100 1000 10000 100000 1000000 10000000

Dam Capacity (1000 m3)

Ave

rage

ann

ual

Loss

of S

tora

ge %

Zimbabwe Dams, data reported by Bake 1986

Zimbabwe Small Dams

Average, 1105 US Dams

Tanzania Small Dams

Figure 4 Small dam siltation rates

The figure indicates that the trend (observed in American dams) for increasingsedimentation rates as dam capacities reduce is also apparent in the data collected forsmall dams by this study and the larger dams in Zimbabwe. This is attributed tosediment delivery effects, which result in decreasing sediment yields in largercatchments, and the increased erosion and sediment transport associated with thesteeper slopes that tend to characterise smaller catchments. Small dams areconstructed on small rivers draining small catchments, and thus tend to silt up muchmore rapidly than major dams located on the main stem of large rivers. Small damsalso usually have smaller ratios of storage capacity to annual inflow than large dams,and this also has a major impact on siltation rates.

Sediment yields derived from the dam surveys range between 120 t/km2/y and 3400t/km2/y. This is a smaller range than that observed in the larger data set presented inFigure 1, but covers a wide enough range of sediment yields to provide the dataneeded to develop the sediment yield predictor described later.

Sedimentation in small damsDevelopment of a catchment characterisation and sediment yield prediction procedure

OD TN 120 8 Rev 0.0

����

3. Catchment characterisation3.1 REVIEW OF METHODS FOR PREDICTING SOIL EROSION AND

SEDIMENT YIELDAerial photographs can be used to make qualitative, or with calibration, quantitativeassessments of soil erosion rates. Most countries of Southern Africa have nationalcoverage of high quality aerial photographs. This has enabled a large number of regionalstudies to be carried out (Goldsmith, 2000). However using aerial photographs to assesssoil erosion can be both subjective and time consuming, and there is no guarantee thatair photographs are routinely available for use by junior Government Officers, NGOs orconsultants. Methods based on the analysis of aerial photographs were thus ruled out forthis application.

The most widely used empirical equation for the prediction of soil erosion is theUniversal Soil Loss Equation (USLE) (Wischmeier, 1965), which estimates erosionrates by multiplying factors including rainfall intensity, soil erodibility, slope length andpercentage, ground cover, and the presence (or absence) of soil conservation structures.The Soil Loss Estimation Model for Southern Africa (SLEMSA), which was originallydeveloped in Zimbabwe, uses similar parameters (Elwell, 1978). While these equationswere developed to predict long-term average rates of soil loss from fields subject tocommercial crop rotations, and only predict sheet and rill erosion, they and their lateradaptations are often used in distributed models applied to catchments.

A number of other methods are used to predict soil erosion rates, and by applying more-or-less sophisticated sediment routing techniques, sediment yields at catchment outlets.Useful reviews are presented in Hudson (1995), Morgan (1995) and Schmidt (2000).Methods range from complex distributed process-based models with substantial datarequirements, semi-empirical lumped models (often based on the application of theUniversal Soil Loss Equation or its later adaptations) and simple empirical predictors.Requirements for data and computational modelling skills rule out all but the last ofthese approaches for the current application.

This is not necessarily a disadvantage as simple empirical models can be moresuccessful at predicting soil erosion and sediment yield than more complex models(Morgan, 1995). An early example of a successful application of this approach topredicting sediment yields from large catchments (>5000 km2) is described in Jansenand Painter (1974), who predicted sediment yields from empirical functions includingcatchment area, slope, altitude, rainfall, runoff, temperature, plus factors indicatingvegetation cover and proneness to erosion. Milliman and Syvitski (1992) successfullycorrelated sediment yields with catchment area and topographic factors using seventopographic categories.

Hudson (1995) describes the use of a factorial scoring system to rank erosion hazard,and the same approach is adopted here, with “calibration” to estimate sediment yields.Factorial scoring classification systems are subjective, but they can represent factors thatcannot easily be quantified on the ground without expensive and time consuming fieldmeasurements.

Sedimentation in small damsDevelopment of a catchment characterisation and sediment yield prediction procedure

OD TN 120 9 Rev 0.0

����

3.2 DEVELOPMENT OF THE CATCHMENT CHARACTERISATIONPROCEDUREThe following factors were identified for consideration in a preliminary catchmentcharacterisation procedure (Goldsmith 2000):

• Catchment relief;• Soil type and drainage;• Vegetation conditions over the whole catchment;• Signs of active soil erosion;• Vegetation conditions along water courses;• Surface water storage in catchment (trapping sediment);• Village population density.

The factors can all be assessed during a rapid catchment appraisal. Four classes wereidentified for each characteristic: extreme, high, normal and low, with a numerical valueassigned to each class. There is clearly an element of double or even triple counting inthe factors listed above. Most will for example contribute to “signs of active erosion”.The significance of the individual factors was evaluated during the development of thepredictive equation, when the last three factors listed above were discarded.

The scoring system, described in more detail in annex 3, was developed jointly withcollaborators in Zimbabwe and Tanzania. The text descriptions used to assign factorsinto classes, and the numerical weighting used in the scoring system, incorporate theextensive combined knowledge and experience of the teams that developed theprocedure.

3.3 CARRYING OUT A CATCHMENT CHARACTERISATIONCharacterisation is carried out by completing a checklist, shown in appendix 3, during arapid field appraisal. The only essential field tools required are:

• A 1: 50 000 topographic map covering the catchment area.• A compass.

Other useful (but not essential) items are:

• An up-to-date aerial photograph of the catchment (at a scale of about 1:25 000).• Hand held GPS (global positioning satellite) equipment.

Assessments are based on information collected partly from interviewing peopleresident in the catchment, and observations made while walking a number of randomlychosen transects across the catchment. The direction and siting of transects are selectedafter careful study of a 1:50 000 topographic map. They may follow footpaths andtracks where they cross the catchment (running down from the upper slopes down to thewatercourses and up the other side). Where there are no suitable footpaths, transects arewalked following a bearing. It is particularly important to walk along random sectionsof the main watercourses to examine the condition of the riverbanks and riverbeds.

Ideally a local informant who knows the location and direction of the footpaths willaccompany the person(s) making the assessment. They can be important sources ofinformation on the past land use and land conditions within the catchment.

Sedimentation in small damsDevelopment of a catchment characterisation and sediment yield prediction procedure

OD TN 120 10 Rev 0.0

����

It is possible to assess catchment characteristics at a rate of about 1.5 km2/hour, and tofinish a typical small dam catchment within a day’s work. If there are roads andmotorable tracks across the catchment, these may be used to speed up the work rate, butto avoid missing key characteristics some transects must be walked. Assessments arebest carried out at the end of the main dry season, when the vegetation cover is at itslowest, with the soils bare or almost bare. It is under these conditions that soils are mostprone to erosion during intensive storms in the early part of the rainy season, storms thatusually generate a large part of the sediment runoff from catchments.

3.4 APPLICATION OF THE CATCHMENT CHARACTERISATIONPROCEDURE TO THE CATCHMENTS IN ZIMBABWE AND TANZANIAField testing of the characterisation procedure was carried out in the catchments of thedams that were surveyed in Zimbabwe and Tanzania. Results of the catchment scoringexercises are listed in annex 3. To provide additional information for the development ofthe predictive equation three additional catchments of dams in Tanzania, Msalatu,Matumbulu and Mwisanga were characterised “on paper” using the descriptions of thecatchment conditions reported in Christiansson (1981) and Edvinsson (2001).

Sedimentation in small damsDevelopment of a catchment characterisation and sediment yield prediction procedure

OD TN 120 11 Rev 0.0

����

4. A regional small catchment sediment yieldpredictorThe final stage in the development of the sediment yield predictor was to correlate themeasured sediment yields derived from the dam surveys with the catchmentcharacterisation scores. It should be borne in mind that the catchment characterisationrepresents a “snapshot” of conditions in the catchments on a single day, whereas thedam surveys measured sediment yields over three years or much longer periods, whencatchment conditions may have changed due to climatic variations or man’s activities.The high standard error associated with sediment yield measurements collected over ashort period was mentioned in chapter 1. In light of these, and some other potentiallylarge sources of error, we expect a large scatter in correlations linking sediment yieldswith catchment factors.

4.1 DEVELOPMENT OF THE PREDICTIVE FUNCTIONEach of the catchment factors derived from catchment characterisation was investigatedto determine the degree of correlation with measured sediment yields, using multiplelinear regression with log transformed variables to fit power relationships. For thisexercise the qualitative factor for relief was replaced with a measured catchment slope.This is defined as the gradient of the main stem river from the catchment boundary tothe dam, and this could be determined relatively simply from 1:50 000 maps, which areneeded to carry out a characterisation.

The factors selected for inclusion in the predictive relationship are:

• Signs of active soil erosion (SASE);• Soil type and drainage (STD);• Vegetation conditions over the whole catchment (VC);• Catchment slope (Slope).

These factors when combined in an index are taken as a proxy for erosion hazard. Thiswas “converted” to a sediment yield by including two additional factors. These are thecatchment area and the rainfall. A number of methods of estimating sediment deliveryratios from catchment characteristics are described in the literature, see for exampleWalling (1983). In the simplest the delivery ratio is assumed to be a function ofcatchment area only:

SDR = k Area –n (1)

Where:SDR = Sediment Delivery RatioArea = Catchment Area (km2)n and k are constants

Abernethy (1987) compared ten published methods for predicting sediment deliveryratio by adjusting the constants in equation 1 above, and transposing the variousauthors’ published relationships to parallel positions, through a common point (SDR = 1for catchment area = 1 km2). This yielded a mean value for n of -0.2. An Area -0.2

relationship was adopted as the delivery factor included in the predictive equation.

Sedimentation in small damsDevelopment of a catchment characterisation and sediment yield prediction procedure

OD TN 120 12 Rev 0.0

����

The second additional factor is annual rainfall. In semi-arid zones significant runoffevents are usually triggered by intense convective rainfall, and annual rainfall totals areapproximately proportional to the number of storms that occur. The number of eventsthat erode sediment, and then transport it to a catchment outlet, are thus broadlycorrelated with annual rainfall. In “wetter” semi-arid catchments, there will be morerunoff events, and more sediment transported to the catchment outlet.

The predictive equation, with some rounding of coefficients, is:

SY = 0.0194 Area –0.2 MAP0.7 Slope 0.3 SASE 1.2 STD 0.7 VC 0.5 (2)

r2 = 0.95

SE = 198

Where:

SY = Sediment yield (t/km2/year)

Area = Catchment area (km2)

MAP = Mean annual precipitation (mm)

Slope = River slope from the catchment boundary to the dam

SASE = Signs of active soil erosion (Score from catchment characterisation)

STD = Soil type and drainage (Score from catchment characterisation)

VC = Vegetation condition (Score from catchment characterisation)

In Figure 5 observed sediment yields are compared with predicted sediment yields,calculated using equation 2.

Observed Yield = Predicted yield R2 = 0.95

10

100

1000

10000

10 100 1000 10000

Predicted sediment yield T/km2/year

Obs

erve

d se

dim

ent y

ield

T/k

m2/

year

Figure 5 Observed and predicted sediment yields

The correlation coefficient is strongly influenced by the two data points with the highestsediment yields. A relationship fitted to a reduced data set, with the points for the two

Sedimentation in small damsDevelopment of a catchment characterisation and sediment yield prediction procedure

OD TN 120 13 Rev 0.0

����

largest sediment yields removed, reduces the r2 to 0.54, but still predicts sediment yieldsonly 12% lower than equation 2 above.

The predictive ability of equation 2 can also be assessed by quantifying the proportionof the data for which the ratio of observed to predicted sediment yields lies within thehalf to twice range often used for assessing the performance of sediment transportfunctions. This is typically 60% or 70% for the best performing functions, see forexample Reid et al. (1996). This is a rigorous test as the factors and processescontrolling sediment detachment and transport through a fluvial system to a catchmentoutlet are more numerous and more complex than those controlling the transport of bedmaterial sediments in steady flows in rivers or laboratory channels. In this case 88% ofthe predictions fall within the half to twice range. Although the comparison is for dataused to derive the equation, and not an independent data set, this is an encouragingresult given the large uncertainties involved in measuring sediment yields andcharacterising catchments.

A further test is to check that the developed equation reproduces the very wide range ofobserved catchment yields in the region. The sediment yield predicted with minimumscores for the catchment characterisation factors, a (large) catchment area of 20 km2, a(low) slope of 0.001 and a (low) mean annual rainfall of 400 mm, is 9 t/km2/y. A yieldof 8600 t/km2/y is predicted with maximum values for the catchment characterisationfactors, a (small) catchment area of 1.0 km2, a (large) slope of 0.1 and a (large) meanannual rainfall of 1000 mm. This range is similar to the range in observed sedimentyields in East and Southern Africa presented in figure 1, a result that provides furthersupport for the utility of the method.

4.2 APPLICATION TO DIFFERENT REGIONSThe prediction function was developed using data from semi-arid zones in Zimbabweand Northern Tanzania. The applicability of the function outside these zones and similarregions should be checked by users before it is applied. The catchments of small damswhere estimates of siltation rates have been obtained from simple hydrographic surveys,or where siltation rates can be estimated from the initial volumes of older dams thathave silted up, should be characterised. Observed and predicted sediment yields derivedusing the methods described in annex 1 can then be compared, and if necessary a“correction” factor can then be applied to the sediment yields derived using equation 2.As a large scatter is expected correction factors should be based on as manycomparisons as possible, spanning a wide range of catchment characteristics. It issuggested that an absolute minimum of five comparisons is used to determine correctionfactors.

Sedimentation in small damsDevelopment of a catchment characterisation and sediment yield prediction procedure

OD TN 120 14 Rev 0.0

����

5. Summary of principal conclusions5.1 SMALL DAM SEDIMENTATION RATES AND CATCHMENT SEDIMENT

YIELDS

• Surveys of seventeen small dams in Zimbabwe and Tanzania show annual sedimentationrates ranging between 50 % and 0.5 %.

• Excluding one dam with an abnormally large sedimentation rate, the mediansedimentation rate was 2.6 % per year, giving a sedimentation lifetime for an “average”small dam of approximately thirty-eight years. The useful life of the “average” damwould of course be far less than thirty-eight years, due to the proportionately largerevaporative losses that occur in the later years as siltation reduces the dam depth, and anincreasingly larger proportion of the stored water is lost to evaporation.

• Only 46% of surveyed dams will have a siltation life of forty years or longer. Fortyyears could be taken as the minimum sedimentation lifetime required to ensure thatuseful quantities of water can be stored and abstracted over the twenty year economiclife usually assumed for small dam studies. About 15 % of the surveyed dams would becompletely filled with sediment after twenty years.

• The trend observed in American data of increasing annual sedimentation rates as damcapacities reduce, is also apparent in the data collected for small dams by this study andfor larger dams in Zimbabwe. This is attributed to sediment delivery effects, whichresult in decreasing sediment yields in larger catchments and the effects of the steeperslopes that tend to characterise small catchments.

• Sediment yields derived from small dam surveys range between 120 t/km2/y and 3400t/km2/y, a wide enough range to provide the data needed to calibrate the sediment yieldpredictor.

5.2 CATCHMENT CHARACTERISATION PROCEDURE• A simple regional sediment yield predictor was selected for use in this application. The

method is based on a rapid catchment characterisation procedure to score factorsdescribing soil type, crop cover, and signs of erosion.

• The catchment factor scoring system was developed jointly with collaborators inZimbabwe and Tanzania. The descriptors are used to assign parameters into one of fourclasses, and the numerical weightings used in the scoring system incorporate theextensive combined knowledge and experience of the teams that developed theprocedure.

• Characterisation is carried out by completing a checklist during a field visit.Assessments are based on information collected from interviewing people resident in thecatchment, and observations made while walking a number of randomly chosentransects across the catchment. It is possible to assess catchment characteristics in atypical small dam catchment within a day’s work. Assessments are carried out at the endof the main dry season, when vegetation cover is at its lowest, with the soils bare oralmost bare.

Sedimentation in small damsDevelopment of a catchment characterisation and sediment yield prediction procedure

OD TN 120 15 Rev 0.0

����

5.3 REGIONAL SMALL CATCHMENT SEDIMENT YIELD PREDICTOR

• The catchment factors selected for inclusion in the predictive relationship, on thebasis of correlation with the measured sediment yields, are:

♦ Signs of active soil erosion (SASE);♦ Soil type and drainage (STD);♦ Vegetation conditions over the whole catchment (VC);♦ Catchment slope (Slope).

• When combined these factors are taken as a proxy for erosion hazard. This was“converted” to a sediment yield by including two additional factors to account forsediment delivery effects. These are the catchment area (Area) and the mean annualprecipitation (MAP).

• Regression analysis was used to derive the constant and exponents of a predictiveequation, which is:

SY = 0.0194 Area –0.2 MAP0.7 Slope 0.3 SASE 1.2 STD 0.7 VC 0.5

r2 = 0.95SE = 198

• The relatively high correlation coefficient is strongly influenced by the two datapoints with the largest sediment yields. A relationship fitted to a reduced data set,with the points for the two largest sediment yields removed, reduces r2 to 0.54, butstill predicts sediment yields only 12% lower than the equation above.

• 88% of the predictions fall within the half to twice range often used to assess theperformance of sediment transport functions. Although the comparison is for dataused in the derivation of the equation, and not an independent data set, this is anencouraging result.

• Sediment yields predicted by the equation range between 9 t/km2/y and 8600 t/km2/y.This is similar to the range in observed sediment yields in East and Southern Africashown in figure 1, a result that provides further support for the utility of the method.

• The prediction function was developed using data from semi-arid zones inZimbabwe and Northern Tanzania. The applicability of the function outside of theseand similar regions should be verified by users before it is applied.

Sedimentation in small damsDevelopment of a catchment characterisation and sediment yield prediction procedure

OD TN 120 16 Rev 0.0

����

6. AcknowledgementsThe writers wish to acknowledge the enormous contribution made to this study bycollaborators in Zimbabwe and Tanzania. In Zimbabwe these included staff andofficials from the Harare and Masvingo offices of CARE and Agritex. Most of the smalldam surveys in Zimbabwe were carried out by Hart Frost Consultants, Harare, withsupport and assistance from CARE. Silsoe Research Institute UK also provided adviceand socio-economic data.

In Tanzania principal collaborators were KINNAPA in Kibaya, and the Engineers fromthe regional water office in Arusha. Small dam surveys in Tanzania were carried out byWEGS Consultants, Arusha, with KINNAPA’s assistance and facilitation.

Assistance and encouragement in setting up and carrying out the study was receivedfrom the DFID office in Harare, and officials of the Irrigation Department of theMinistry of Agriculture in Tanzania.

Sedimentation in small damsDevelopment of a catchment characterisation and sediment yield prediction procedure

OD TN 120 17 Rev 0.0

����

7. References7.1 SOURCES OF SEDIMENT YIELD DATA FOR EAST AND SOUTHERN

AFRICAChristiansson C. 1981. Soil Erosion and Sedimentation in Semi Arid Tanzania.Scandinavian Institute of African Studies, Uppsala and Department of Physical Geography,University of Stockholm. Uppsala, 1981.

FAO. World River Sediment Yields. (Data assembled by HR Wallingford for FAO in1995.) (http://www.fao.org/ag/agl/aglw/sediment/default.asp)

Interconsult. 1985. Report “ Soil and Water Conservation” Regional Master Plan forRural water Supply and Sanitation. Ministry of Energy and Water Resources andDevelopment. Interconsult-AS. Harare, Zimbabwe, 1985.

Ministry of Water Resources, Asmara, Eritrea. 1998. Sector Study on National WaterResources and Irrigation Potential. Annex – Sedimentation studies.

Rooseboom A. Sediment Transport in Rivers and Reservoirs – A South AfricanPerspective. Report to the Water Research Commission by Sigma Beta ConsultingEngineers.WRC Report No 297/1/92.

Wall-Bake. 1986. Siltation and soil erosion survey in Zimbabwe. IAHS publication 159.

7.2 SMALL DAM DESIGN REFERENCESAgritex. 1994. Irrigation Manual. Second edition. 1994. UNDP/FAO/AGRITEXproject ZIM/91/005.

Bullock A. 1993. Hydrological procedures for the design of small dams in Botswana.United Nations Development Programme, BOT/86/010-UNO/BOT/003/CDF.

CIRIA. 1996. Small embankment reservoirs. CIRIA Report 161, 1996, ISBN 0 86017461 1.

FAO. 2001. Small dams and weirs in earth and gabion materials. agl/misc/32/2001,Food and Agriculture Organisation of the United Nations, Land and Water DevelopmentDivision, Rome, 2001.

Fowler J P. 1977. The design and construction of small earth dams. AppropriateTechnology Vol.3 No.4.

Guerra L C, Watson P G and Bhuiyan S I. 1988. “Small Farm Reservoirs.” Technology:Vol. X No. 6/1988.

HR Wallingford. 2003. Guidelines for the technical appraisal of CARE dam sites. HRWallingford/Report EX 4766.

Kabell T C. 1984. “Sediment storage requirements for reservoirs.” Challenges inAfrican Hydrology and Water Resources (Proceedings of Harare Symposium, July1984). IAHS Publication 144.

Sedimentation in small damsDevelopment of a catchment characterisation and sediment yield prediction procedure

OD TN 120 18 Rev 0.0

����

Mitchell T B. 1987. The yield from irrigation dams of low storage ratio. Journal andproceedings Zimbabwe Institution of Engineers, pp 627-630.

MOWD (Ministry Of Water Development), Kenya. 1992. Guidelines for the design,construction and rehabilitation of small dams and pans in Kenya, 1992. Nairobi,Ministry of Water Development.

Nelson K D. 1991. Design and construction of small earth dams. Inkata press, Australia.ISBN 0 909605 34 3.

PEMconsult. 1999. Hydrological design of small earth dams in Malawi, 1999. Vol. 1and2 – Guidelines for flood assessment and estimation of reservoir yield for smallungauged catchments. Danida support to small scale irrigation pilot activities in uplanddambo wetlands (Ministry of Foreign Affairs and Ministry of Agriculture andIrrigation).

Sahu R K. 1999. Technical Bulletin: Small farm reservoirs. Indian Council ofAgricultural Research, New Delhi, India.

Smout I K and Shaw R J. 1996. “Technical Brief No.48: Small Earth Dams”.Waterlines: Journal of Appropriate Technologies for Water Supply and Sanitation,14(4), 1996, pp 15-18, ISSN 0262 8104.

Stephens T. 1991. Handbook on small dams and weirs. Cranfield press.

Sur H S, Bhardwaj A and Jindal P K. 1999. “Some hydrological parameters for thedesign and operation of small earthen dams in the lower Shiwaliks of northern India.”Agricultural Water Management Vol. 42, Issue 1, (1999). pp111-121

Thornton J. 2000. Source Book of alternative technologies for freshwater augmentationin Africa. Cap. 1.1.13. United Nations Environment Programme.

USAID. 1982. Designing small dams. Technical note No. RWS. 1.D.5. USAID Waterfor the world.

Watermeyer J M. 1989. Small earth dams and weirs – Implementation manual.Agricultural and Rural Development Authority, Zimbabwe and GTZ.

ZFU and Agritex. 1998. A Guide for Farmers on Good Land Husbandry. A series of 15booklets on land husbandry edited by Silsoe Research Institute, UK. Belmont Press,Masvingo, Zimbabwe

7.3 GENERAL REFERENCESAbernethy C L. 1987. Soil Erosion and sediment yield, a review of sediment data fromrivers and reservoirs. Unpublished report for FAO.

Brune G M. 1953. “Trap efficiency of reservoirs.” Trans. American Geophysical Union,Vol 34 No3 Washington DC, pp 407-418.

CARE, Zimbabwe. 2000. An impact assessment of CARE’s small dams rehabilitationprojects.

Christiansson C. 1981. Soil erosion and Sedimentation in Semi-arid Tanzania. Studies of

Sedimentation in small damsDevelopment of a catchment characterisation and sediment yield prediction procedure

OD TN 120 19 Rev 0.0

����

Environmental Change and Ecological Imbalance. Scandinavian Institute of AfricanStudies, Uppsala (PhD thesis). 208pp.

Edvinsson J. 2001. Sedimentation in Mwisanga reservoir, Kondoa district, centralTanzania – A study based on field observations, photo-grammetry and GIS-analysis.

FAO. 1993. Field measurement of soil erosion and run off. Prepared by N Hudson, FAOsoils bulletin 68, FAO Rome Italy.

Goldsmith P. 2000. Review note on soil erosion assessment. (Unpublished projectworking paper.)

Hudson N. 1995. Soil Conservation. 3rd Edition, Batsford, London.

Hudson N W. 1987. Soil and water conservation in semi-arid areas. Chap. 6. FAOLand and Water Development Division, Food and Agriculture Organization of theUnited Nations Rome.

Interconsult. 1985. Report “ Soil and Water Conservation” Regional Master Plan forRural Water Supply and Sanitation. Ministry of Energy and Water Resources andDevelopment. Interconsult AS. Harare, Zimbabwe, 1985.

Jansen J M L and Painter R B. 1974. “Predicting sediment yield from climate andtopography.” Journal of Hydrology, 21: 371 – 380.

Lawrence P. 1996. Guidelines on field measurement procedures for quantifyingcatchment sediment yields. HR Wallingford, report OD TN 77.

Lawrence P. 2003. Sedimentation in small dams – impacts on the incomes of poor ruralcommunities. HR Wallingford, report OD TN 118.

Lawrence P and Dickinson A. 1995. Soil erosion and sediment yield a review ofsediment data from rivers and reservoirs. (Report prepared under FAO writers’contract.)

Milliman J D and Syvitski J P M. 1992. “Geomorphic/Tectonic Control of sedimentDischarge to the Ocean: The importance of Small Mountainous Rivers.” Journal ofGeology, Volume 100 pp. 525-544.

Morgan R P C. 1995. Soil Erosion and Conservation. 2nd edition, Longmans, Harlow.

Mutswanga C. 1995. Sediment in Zimbabwean dam projects. WEDC, LoughboroughUniversity of Technology UK.

Olive L J and Rieger W A. 1992. Stream suspended sediment transport monitoring –why, how and what is being measured? IAHS Pub. 210 pp.245-253.

Reid L M and Dunne T. 1996. Rapid evaluation of sediment budgets. GeoEcologypaperback, ISBN 3-923881-39-5.

Schmidt J (Ed.). 2000. Soil Erosion: Application of Physically Based Models. SpringerVerlag, Berlin, 2000. ISBN 3-540- 66764-4).

Walling D E. 1983a. “The sediment delivery problem.” Journal of Hydrology, 65(1983),

Sedimentation in small damsDevelopment of a catchment characterisation and sediment yield prediction procedure

OD TN 120 20 Rev 0.0

����

pp 209-237.

White R. 2001. Evacuation of sediment from reservoirs. Thomas Telford. London, UK.

Wischmeier W H. 1965. Predicting Rainfall Erosion East of the Rocky Mountains. USDept. of Agriculture Handbook No. 282.

Zirebwa J. 2000. DPhil progress report, CARE small dams project.

Sedimentation in small damsDevelopment of a catchment characterisation and sediment yield prediction procedure

OD TN 120 Rev 0.0

����

Annexes

Sedimentation in small damsDevelopment of a catchment characterisation and sediment yield prediction procedure

OD TN 120 Rev 0.0

����

Sedimentation in small damsDevelopment of a catchment characterisation and sediment yield prediction procedure

OD TN 120 Rev 0.0

����

Annex 1 Dam sedimentation rates and catchmentsediment yields
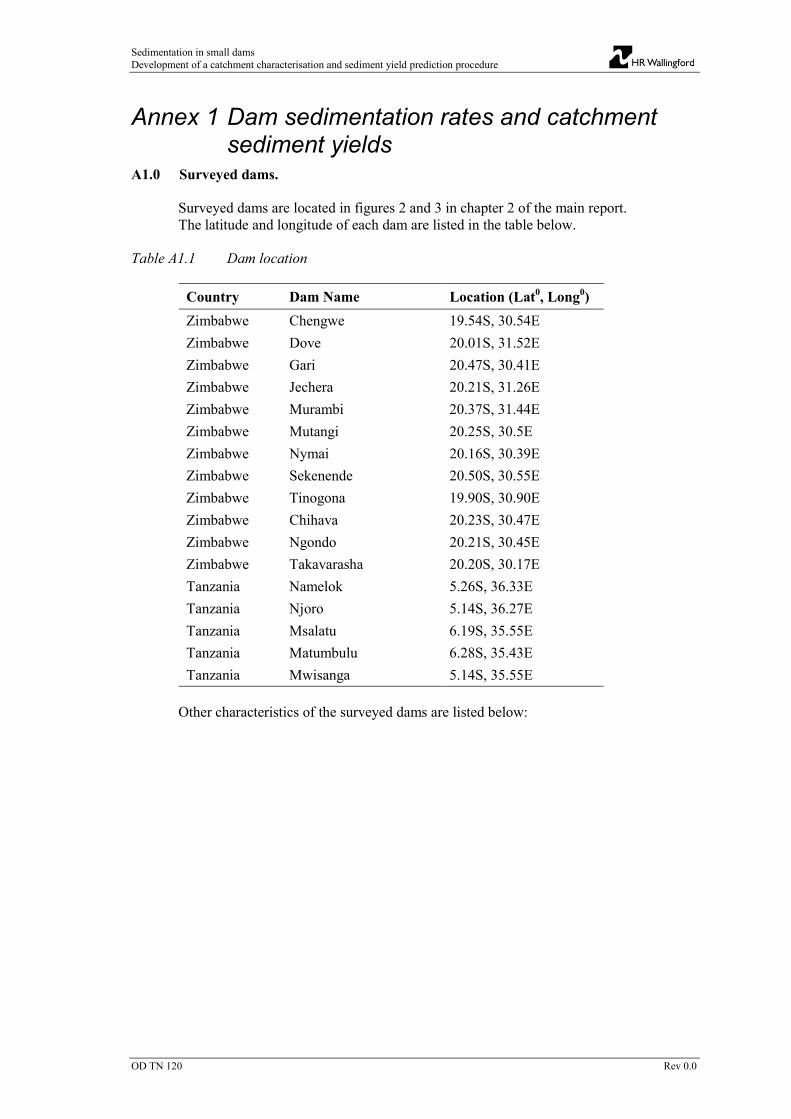
A1.0 Surveyed dams.

Surveyed dams are located in figures 2 and 3 in chapter 2 of the main report.The latitude and longitude of each dam are listed in the table below.

Table A1.1 Dam location

Country Dam Name Location (Lat0, Long0)Zimbabwe Chengwe 19.54S, 30.54EZimbabwe Dove 20.01S, 31.52EZimbabwe Gari 20.47S, 30.41EZimbabwe Jechera 20.21S, 31.26EZimbabwe Murambi 20.37S, 31.44EZimbabwe Mutangi 20.25S, 30.5EZimbabwe Nymai 20.16S, 30.39EZimbabwe Sekenende 20.50S, 30.55EZimbabwe Tinogona 19.90S, 30.90EZimbabwe Chihava 20.23S, 30.47EZimbabwe Ngondo 20.21S, 30.45EZimbabwe Takavarasha 20.20S, 30.17ETanzania Namelok 5.26S, 36.33ETanzania Njoro 5.14S, 36.27ETanzania Msalatu 6.19S, 35.55ETanzania Matumbulu 6.28S, 35.43ETanzania Mwisanga 5.14S, 35.55E

Other characteristics of the surveyed dams are listed below:

Sedimentation in small damsDevelopment of a catchment characterisation and sediment yield prediction procedure

OD TN 120 Rev 0.0

����

Table A1.2 Dams’ baseline data

Dam Name Yearconstructed

Initial Capacity(m3) (3)

Estimated Capacity:Inflow Ratio

CatchmentArea (km2)

Chengwe 1994 13388 0.11 1.60Dove 1956 24594 0.04 55.1Gari 1992 64656 0.34 3.50Jechera 1958 112490 0.31 17.0Murambi 1964 53135 0.07 1.65Mutangi 1945 162210 0.56 6.62Nymai 1993 116640 0.07 10.5Sekenende 1981 45947 0.28 9.05Tinogona 1993 170000 0.05 5.30Chihava 1991 54000 0.30 2.76Ngondo 1940 90000 0.16 8.75Takavarasha 1985 200000 0.00 541Namelok 194 794070 0.39 40.0Njoro 1976 245000 0.18 27.0Msalatu (1) 1944 420000 0.80 8.51Matumbulu (1) 1962 333000 0.45 18.0Mwisanga (2) 1986 1260000 0.47 18.0

Note 1 Data from Christiansson (1981)Note 2 Data from Edvinsson (2001)Note 3 At the start of the period over which sediment accumulations were measured

A1.1 Zimbabwe dam surveys

Nine dams that had been or were in the process of being rehabilitated under CARE’sDFID funded communal dam rehabilitation project were selected for dam surveys andcatchment characterisation.5 Baseline surveys were carried out in 1999 and thereafterannually to determine annual sediment accumulations. The first two surveys werecarried out by CARE, following the methods established with HR Wallingford’ssurveyor. The remaining two surveys were commissioned to a local consultant (HARTFROST) who carried out the surveys with assistance from CARE.

Each survey was carried out by measuring cross-sections along a series of range lines.This involved setting out permanent beacons located at, or just above, the full supplylevel around the periphery of each reservoir. The position and level of the beacons wereestablished in an initial survey, then cross-sections along the range lines were measuredusing a combination of conventional survey methods and sounding from a smallinflatable boat. A local datum level of 100.00 m at the spillway crest level was adoptedat each dam. In some cases, where construction was still in progress, the final spillway

5 The same dams and catchments had already been selected as lead dams to represent a cross-section ofdam types, catchment areas, agro-ecological region, land use, and socio-economic conditions for aUniversity of Zimbabwe Phd study of dam sedimentation funded by CARE, Zirebwa (2000). This studyremains to be completed.

Sedimentation in small damsDevelopment of a catchment characterisation and sediment yield prediction procedure

OD TN 120 Rev 0.0

����

level had to be estimated when the local datum was established, so was not exactly atEL 100.00.

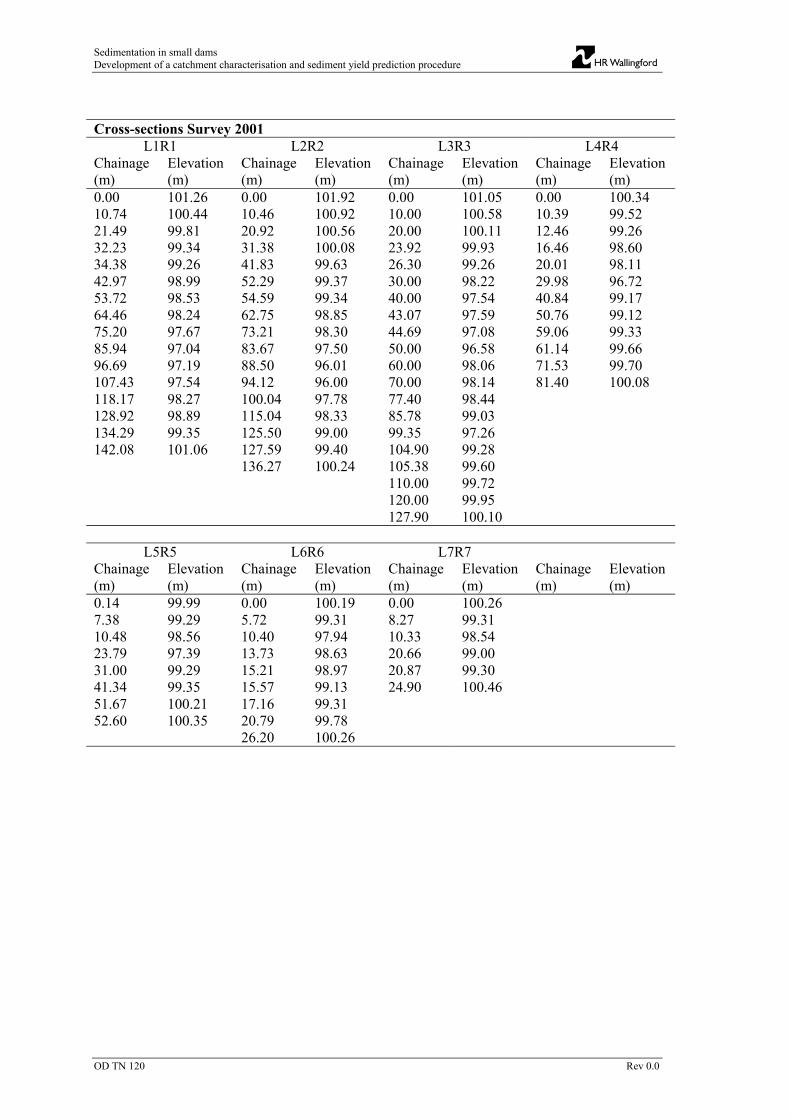
The measured cross-sections of the surveyed dams are listed in Annex 2a.

The measured cross-sections were used to estimate the dam volume storage at the timeof each survey and hence annual siltation rates. Reservoir volumes were determinedusing the stage width modification method, which exploits the close relationshipbetween stage width and stage area curves. This method makes better use of sparseinput data from range line surveys in calculating reservoir volumes than competingmethods. The method is available as an option in HR Wallingford’s RESSASS software.The software computes the storage volume for a range of water levels at the time of pre-impoundment and first or later surveys, and estimates the volume of sediment depositsfrom the differences in water volumes. The results are shown below.

Table A1.3(a) Siltation rates at CARE dams

Dam Volume (m3) Siltation rate (%)Dam Name

1999 2000 2001 2002 99-00 00-01 01-02 Annual

AverageChengwe 13388 13307 12690 12340 0.61 4.64 2.76 2.61Gari 64656 63880 63875 62395 1.20 0.01 2.32 1.17Jechera 116640 112208 111410 110670 3.80 0.71 0.66 1.71Murambi 45947 44797 44567 44341 2.50 0.51 0.51 1.17Mutangi 112490 111150 107880 105370 1.19 2.94 2.33 2.11Nyimai 53135 51647 49936 48006 2.80 3.31 3.86 3.22Sekenende 24594 24200 23561 22344 1.60 2.64 5.17 3.05Tinogona 162210 - 157430 149890 0.00 2.95 4.79 2.53

Table A1.3(b) Siltation rates at CARE dams

DamName

Original DamVolume (m3)

Year Dam Volume(m3)

Year Annual Averagesiltation rate (%)

Dove 170000 1984 94800 1999 2.95

The average siltation rate for Dove was estimated from data derived from anInterconsult survey of 1984 and the HR Wallingford/Care survey of 1999. This result isthe most reliable long-term estimate for a siltation rate in the CARE dams.

Surveys were also carried out at three other heavily silted dams that were not part ofthe CARE project, which excludes dams with a history of rapid siltation from therehabilitation programme. In this case after attempts at coring to estimate the depthof sediment accumulations had failed due to de-watering problems, and difficultiescaused by flood flows resulting from early rains, siltation rates were derived usingRESSASS and a 2002 survey with estimates of the original capacity. The results areshown in table A1.4

Sedimentation in small damsDevelopment of a catchment characterisation and sediment yield prediction procedure

OD TN 120 Rev 0.0

����

Table A1.4 Siltation rates at other Zimbabwe dams

Dam Name Original DamVolume (m3)

Year Dam Volume(m3)

Year Annual Averagesiltation rate (%)

Chihava 54000 1991 5200 2002 8.22Ngondo 90000 1940 0 1962 4.5

Takavarasha 200000 1985 0 1987 50.0

A1.3 Siltation rates at Tanzania dams

Two dams in Tanzania were surveyed by the project. A full range line survey wascarried out at Namelok in 2001, and the sediment volume derived using RESSASS froma survey carried out shortly after the dam was constructed with the 2001 survey. AtNjoro a pre-construction survey was not available, and sediment volumes wereestimated from coring in the bed of the empty reservoir. The results were adjusted toaccount for some coarser sediment deposits located at the head of the dam, outside thearea where coring took place. Results are shown in table A1.5 below.

Table A1.5 Siltation rates of Tanzania dams

Dam Name Original DamVolume (m3)

Year Dam Volume(m3)

Year Annual Averagesiltation rate (%)

Namelok 794070 1954 620360 2001 0.47Njoro 245000 1976 168690 2001 1.25

Data on dam capacity changes, reported by Christiansson (1981) and Edvinsson (2001),were used to extend the data set for Tanzania. Three of the dams described in the papershad reasonably small catchment areas, and catchment conditions reported in enoughdetail to allow a “paper” catchment characterisation exercise to be attempted. Surveymethods are described in detail in the original papers. The results are shown in tableA1.6 below.

Table A1.6 Siltation rates of other dams in Tanzania

Dam Name Original DamVolume (m3)

Year Dam Volume(m3)

Year Annual Meansiltation rate (%)

Msalatu 420000 1944 290000 1971 1.2Mwisanga 1260000 1986 505000 2001 4.0Matumbulu 333000 1962 228500 1974 2.6

A1.4 Catchment sediment yields

In order to convert sedimentation rates to catchment sediment yields it is necessary toaccount for the sediment trapping efficiency of the dams. This was estimated using theBrune (1953) relationship, relating trapping efficiency to a dam capacity/inflow ratio. It isalso necessary to select an appropriate value for the density of the settled sediments. Onthe basis of the densities of sediment deposits in Zimbabwean dams reported byInterconsult (1985), a density of 1.3 t/m3 was adopted for “old” sediment deposits,(consolidated over more than 20 years). For fresher, less consolidated sediment depositslower values were used depending on the age of the consolidated sediments. A value of

Sedimentation in small damsDevelopment of a catchment characterisation and sediment yield prediction procedure

OD TN 120 Rev 0.0

����

1.1 t/m3 was adopted for the newly deposited sediments in the CARE dams surveyedover three years.

Catchment mean annual sediment yields were computed from:

Sediment yield (t/km2/y) =

Annual sedimentation rate (m3/y) * Sediment Density (t/m3)Catchment Area (km2) * trap efficiency

The results are shown in table A1.7.

Table A1.7 Catchment sediment yields

Dam Name CatchmentArea (km2)

Annualsiltationrate (m3)

Assumedsedimentdensity(t/m3)

Capacity/

inflow ratioTrappingEfficiency

Sedimentyield(t/km2/year)

Chengwe 1.60 349 1.1 0.11 0.89 269Sekenende 9.05 750 1.1 0.04 0.74 123Gari 3.50 391 1.1 0.34 0.98 126Mutangi 6.62 2373 1.1 0.31 0.97 406Nyimai 10.5 1710 1.1 0.07 0.84 212Tinogona 5.30 4107 1.1 0.56 0.99 858Jechera 17.00 2615 1.1 0.07 0.84 203Murambi 1.65 535 1.1 0.28 0.97 370Dove 55.1 5013 1.3 0.05 0.78 152Chihava 2.76 4436 1.2 0.30 0.97 1823Ngondo 8.75 4091 1.3 0.16 0.93 657Takavarasha 541.0 100000 1.1 0.02 0.63 330Namelok 40.0 3696 1.3 0.39 0.98 122Njoro 27.0 3052 1.3 0.18 0.94 157Msalatu 8.51 4815 1.3 0.80 0.99 736Mwisanga 18.0 50333 1.2 0.47 0.99 3392Matumbulu 18.0 8708 1.2 0.45 0.99 588

Sedimentation in small damsDevelopment of a catchment characterisation and sediment yield prediction procedure

OD TN 120 Rev 0.0

����

Sedimentation in small damsDevelopment of a catchment characterisation and sediment yield prediction procedure

OD TN 120 Rev 0.0

����

Annex 2 Details of dam surveys

Annex 2a CARE Dams Survey Cross-sectionsName: ChengweLocation: Masvingo (Zimbabwe)Full Supply Water Level: 99.42 m

Location of survey beacons

Left bank point Right bank pointSectionName East (m) North (m) Elevation (m) East (m) North (m) Elevation (m)'DAM 0.00 0.00 99.42 0.00 96.70 99.42'L1R1' 7.30 19.90 100.00 11.10 122.40 99.81'L2R2' 27.70 31.40 100.47 22.30 120.60 99.70'L3R3' 55.50 24.00 99.55 33.30 117.60 100.25'L4R4' 78.50 39.70 99.39 55.30 108.50 100.17'L5R5' 98.00 41.00 100.23 73.10 95.00 99.92'L6R6' 111.00 37.00 101.36 99.80 93.20 102.38'L7R7' 149.00 22.00 99.70 154.00 104.00 100.23'L8R8' 200.00 -1.00 100.46 229.00 55.00 100.08'UPST' 231.50 44.00 99.42 231.50 44.00 99.42

Note: - Elevation refers to local datum of 99.42 m at the spillway.- Location refers to the left bank of the dam (0, 0).

Sedimentation in small damsDevelopment of a catchment characterisation and sediment yield prediction procedure

OD TN 120 Rev 0.0

����

Cross-sections Survey 1999L1R1 L2R2 L3R3 L4R4Chainage(m)

Elevation(m)

Chainage(m)

Elevation(m)

Chainage(m)

Elevation(m)

Chainage(m)

Elevation(m)

0.00 100.00 0.00 100.47 0.00 99.55 0.00 99.3951.00 98.31 5.50 99.21 13.50 98.68 8.20 99.0170.90 98.31 12.50 98.68 26.10 98.31 20.50 98.2974.00 98.44 22.75 98.00 31.49 98.07 25.83 97.8475.90 98.32 29.20 98.30 36.87 97.89 31.15 97.6176.45 98.16 34.54 98.11 42.26 97.81 36.48 97.6181.90 97.41 39.88 97.91 47.45 97.78 41.81 97.6387.35 97.36 45.22 97.75 53.04 97.56 47.14 97.7792.81 97.26 50.56 97.62 58.42 97.43 52.46 97.9098.26 97.61 55.90 97.66 63.81 97.33 57.79 98.12102.60 98.31 61.24 97.42 69.20 97.43 61.70 98.29103.50 99.81 66.57 97.34 74.58 97.41 71.70 100.17

71.91 97.03 79.97 97.4877.25 97.12 85.36 97.4882.59 97.25 90.75 97.9886.50 98.31 92.90 98.3189.70 99.70 95.50 100.25

L5R5 L6R6 L7R7 L8R8Chainage(m)

Elevation(m)

Chainage(m)

Elevation(m)

Chainage(m)

Elevation(m)

Chainage(m)

Elevation(m)

0.00 100.23 0.00 101.36 0.00 99.70 0.00 100.468.10 98.29 3.40 100.48 10.00 98.98 20.60 99.0513.54 98.08 7.30 98.70 20.00 99.00 22.40 98.7318.99 97.99 9.90 98.37 24.00 98.72 30.00 98.7324.43 97.84 10.70 98.32 39.50 98.49 32.00 98.2529.88 97.86 16.20 98.29 65.50 99.40 41.00 98.2535.30 97.84 21.40 98.30 80.60 100.23 54.90 99.6740.76 97.74 26.70 98.31 61.40 100.0844.40 97.80 31.30 98.1746.40 97.90 37.20 98.1351.00 98.32 42.50 98.0458.70 99.92 47.90 98.10

51.90 98.3757.00 102.38

Sedimentation in small damsDevelopment of a catchment characterisation and sediment yield prediction procedure

OD TN 120 Rev 0.0

����

Cross-sections Survey 2000L1R1 L2R2 L3R3 L4R4Chainage(m)

Elevation(m)

Chainage(m)

Elevation(m)

Chainage(m)

Elevation(m)

Chainage(m)

Elevation(m)

0.00 100.00 0.00 100.47 0.00 99.55 0.00 99.4038.90 98.68 12.50 98.68 13.50 98.68 13.50 98.6843.90 98.43 22.75 98.03 23.82 98.34 23.62 98.0648.90 98.28 33.00 98.07 34.14 97.95 33.74 97.6953.90 98.31 43.25 97.78 44.46 97.78 43.86 97.6858.90 98.18 55.50 97.54 54.78 97.58 53.98 98.0163.90 98.15 63.75 97.36 65.10 97.43 63.90 98.5868.90 98.10 74.00 97.09 75.42 97.43 64.10 98.6873.90 98.43 84.25 98.03 85.74 97.60 71.70 100.1878.90 97.71 87.20 98.68 93.10 98.6883.90 97.50 89.40 99.70 95.60 100.2888.90 97.3293.90 97.4298.90 98.3899.50 98.68103.50 99.81

L5R5 L6R6 L7R7 L8R8Chainage(m)

Elevation(m)

Chainage(m)

Elevation(m)

Chainage(m)

Elevation(m)

Chainage(m)

Elevation(m)

0.00 100.23 0.00 101.29 0.00 99.70 0.00 100.466.00 98.68 6.80 98.68 24.80 98.68 11.60 98.6816.87 98.00 16.98 98.25 35.09 98.56 28.95 98.4227.74 97.86 27.16 98.29 45.38 97.98 46.30 97.9838.61 97.78 37.34 98.09 47.00 98.68 47.00 98.6849.48 98.13 47.52 98.08 80.70 100.22 61.50 100.0854.92 98.54 52.61 98.3557.00 98.68 56.50 102.3963.40 99.92

Sedimentation in small damsDevelopment of a catchment characterisation and sediment yield prediction procedure

OD TN 120 Rev 0.0

����

Cross-sections Survey 2001L1R1 L2R2 L3R3 L4R4Chainage(m)

Elevation(m)

Chainage(m)

Elevation(m)

Chainage(m)

Elevation(m)

Chainage(m)

Elevation(m)

0.00 100.00 0.00 100.46 0.00 99.55 0.00 99.4010.00 99.61 10.00 99.00 10.00 98.93 10.00 98.8720.00 99.28 11.60 98.81 13.30 98.72 13.00 98.7230.00 99.27 20.00 98.11 20.00 98.44 20.00 98.2239.00 98.81 30.00 98.22 30.00 97.99 30.00 97.6240.00 98.67 40.00 97.87 40.00 97.82 40.00 97.5950.00 98.23 50.59 97.59 50.00 97.58 50.00 97.8560.00 98.21 60.00 97.46 60.00 97.30 60.00 98.3470.00 98.27 70.00 97.01 70.00 97.42 62.00 98.7270.90 98.31 80.00 97.13 80.00 97.4774.00 98.44 89.70 99.70 84.00 98.4775.90 98.32 84.30 98.8176.45 98.16 95.60 100.2880.00 97.7890.00 97.02100.00 98.03103.5 99.81

L5R5 L6R6 L7R7 L8R8Chainage(m)

Elevation(m)

Chainage(m)

Elevation(m)

Chainage(m)

Elevation(m)

Chainage(m)

Elevation(m)

0.00 100.23 0.00 101.36 0.00 99.70 0.00 100.466.00 98.81 7.20 98.81 10.00 98.98 10.00 99.8610.00 98.20 10.00 98.28 20.00 99.04 20.00 99.1020.00 97.92 20.00 98.24 24.00 98.72 30.00 98.7930.00 97.84 30.00 98.11 30.00 98.71 40.00 98.7040.00 97.71 40.00 97.97 40.00 98.56 50.00 99.2050.00 98.02 50.00 98.31 46.60 98.72 61.20 100.0852.30 98.68 51.00 98.81 50.00 98.8856.54 99.91 57.30 102.39 60.00 99.27

70.00 99.7980.65 100.22

Sedimentation in small damsDevelopment of a catchment characterisation and sediment yield prediction procedure

OD TN 120 Rev 0.0

����

Cross-sections Survey 2002L1R1 L2R2 L3R3 L4R4Chainage(m)

Elevation(m)

Chainage(m)

Elevation(m)

Chainage(m)

Elevation(m)

Chainage(m)

Elevation(m)

0 100 0 100.47 0 99.55 0 99.411.5 99.52 4 99.54 14.07 98.74 9.56 98.9922.4 99.28 12 98.78 23.72 98.47 19.83 98.3829.5 99.26 18.2 98.25 31.67 98.04 28.47 97.8142 98.65 24.6 98.01 45.24 97.84 38.23 97.6849.5 98.38 29.5 98.29 53.58 97.6 50.07 97.8258.3 98.31 40 97.96 57.3 97.54 62.17 98.5870.2 98.2 47 97.74 66.75 97.45 70.71 10075.6 98.45 60 97.52 76.7 97.4478.5 97.69 68.3 97.53 86.45 97.5186 97.51 74 97.14 93.59 98.691.5 97.32 83.6 97.51 96.2 100.2697.1 97.52 87 98.68102.6 98.46 89.4 99.7

L5R5 L6R6 L7R7 L8R8Chainage(m)

Elevation(m)

Chainage(m)

Elevation(m)

Chainage(m)

Elevation(m)

Chainage(m)

Elevation(m)

0 100.23 0 101.29 0 99.7 0 100.468.4 98.24 10 98.41 10.82 99.02 12.06 99.6322.45 98.01 19 98.32 17.87 99.12 19.65 99.4631.48 98.05 29.5 98.25 25.53 98.76 31.65 99.1541.53 97.88 42.5 98.04 32.17 98.74 34.65 98.5747.89 98.2 51.81 98.35 37.93 98.53 40.76 98.4852.92 98.74 56.31 102.38 50.5 98.86 50.03 99.2558.65 99.93 68.53 99.56 58.09 99.89

80.78 100.24 61.28 100.09

Sedimentation in small damsDevelopment of a catchment characterisation and sediment yield prediction procedure

OD TN 120 Rev 0.0

����

Name: DoveLocation: Bikita (Zimbabwe)Full Supply Water Level: 100m (1999), 100.83 (2001)Note: the reservoir wasn’t surveyed in the year 2000

Location of survey beacons

Left bank point Right bank pointSectionName East (m) North (m) Elevation (m) East (m) North (m) Elevation (m)'DAM 0.00 0.00 100.00 0.00 253.00 100.00'L1R1' 31.50 -28.98 101.39 14.93 254.43 102.06'L2R2' 73.80 -10.16 101.61 42.34 249.98 101.33'L3R3' 102.00 -45.36 102.69 115.82 215.90 101.25'L4R4' 126.01 -51.54 101.95 173.44 188.05 101.42'L5R5' 151.68 -96.92 103.36 236.61 141.25 101.20'L6R6' 192.56 -165.69 102.82 311.51 104.00 101.27'L7R7' 244.53 -214.73 101.45 368.31 -0.80 102.09'UPST' 343.94 -191.88 100.00 343.94 -191.88 100.00

Note:Elevation refers to local datum of 100.00 m at the spillway.Location refers to the left bank of the dam (0, 0).

Sedimentation in small damsDevelopment of a catchment characterisation and sediment yield prediction procedure

OD TN 120 Rev 0.0

����

Cross-sections Survey 1999L1R1 L2R2 L3R3 L4R4

Chainage(m)

Elevation(m)

Chainage(m)

Elevation(m)

Chainage(m)

Elevation(m)

Chainage(m)

Elevation(m)

0.00 101.39 0.00 101.61 0.00 102.69 0.00 101.9520.20 100.70 3.60 101.38 8.40 101.29 12.70 101.2338.20 100.02 9.60 100.72 14.10 101.56 41.20 99.7839.20 99.78 18.60 100.61 19.40 101.58 51.10 99.0050.10 98.97 34.50 99.78 31.90 100.99 61.00 98.1561.10 98.69 54.70 98.85 56.70 99.78 71.00 97.6072.00 98.62 64.70 98.46 66.70 98.99 80.90 97.6183.00 98.49 74.80 98.07 76.80 98.42 90.80 97.7693.90 98.39 84.90 97.60 86.80 97.71 100.70 97.91104.90 98.16 95.00 97.52 96.90 97.56 110.70 98.18115.80 97.75 105.10 97.53 106.90 97.62 120.60 98.51126.80 97.40 115.10 97.57 117.00 97.73 130.50 98.67137.70 97.42 125.20 97.74 127.00 97.85 140.40 98.65148.70 97.69 135.30 98.00 137.10 97.95 150.30 98.68159.60 97.80 145.40 98.03 147.10 98.07 160.30 98.73170.60 97.89 155.50 97.96 157.20 98.32 170.20 98.85181.50 98.27 165.50 98.18 167.20 98.40 180.10 98.99192.50 98.68 175.60 98.38 177.30 98.56 190.00 99.36203.40 98.87 185.70 98.62 187.30 98.67 207.10 99.78214.40 99.26 195.80 98.98 197.40 98.97 236.80 100.97236.30 99.12 228.40 99.78 207.40 99.61 244.20 101.42255.20 99.78 246.90 100.39 224.00 99.78273.50 101.03 262.00 101.33 248.80 100.68283.50 102.06 261.60 101.25

L5R5 L6R6 L7R7Chainage(m)

Elevation(m)

Chainage(m)

Elevation(m)

Chainage(m)

Elevation(m)

0.00 103.36 0.00 102.82 0.00 101.4521.20 102.21 10.30 102.27 21.30 100.5243.10 100.73 41.50 100.88 35.10 100.2355.90 99.78 83.20 99.78 49.70 99.9866.80 98.98 108.10 98.98 71.30 99.7877.70 98.47 113.10 98.95 92.70 98.9788.70 98.12 123.10 98.73 130.20 98.9799.60 97.88 133.00 98.53 135.60 98.90110.50 97.72 143.00 98.43 146.30 98.88121.40 97.62 153.00 98.32 157.00 98.84132.30 97.81 162.90 98.23 167.70 98.82143.20 98.36 172.90 98.21 173.10 98.97154.20 98.88 182.90 98.20 178.40 99.28165.10 98.91 192.80 98.10 195.80 99.78176.00 98.92 202.80 97.94 223.70 100.90186.90 99.04 212.80 97.81 247.20 102.09197.80 99.07 222.70 97.60208.70 98.76 232.70 99.06219.70 99.11 242.70 99.06235.70 99.78 252.60 99.11252.90 101.20 266.20 99.78

294.80 101.27

Sedimentation in small damsDevelopment of a catchment characterisation and sediment yield prediction procedure

OD TN 120 Rev 0.0

����

Cross-sections Survey 2001L1R1 L2R2 L3R3 L4R4

Chainage(m)

Elevation(m)

Chainage(m)

Elevation(m)

Chainage(m)

Elevation(m)

Chainage(m)

Elevation(m)

0.00 101.39 0.00 101.61 0.00 102.69 0.00 101.9610.71 101.01 9.87 100.44 10.47 101.22 9.63 101.3121.43 100.73 10.97 100.36 20.95 101.57 18.29 100.8022.50 100.72 21.94 99.99 31.42 101.01 19.25 100.8232.14 100.18 32.91 99.37 34.04 100.84 28.88 100.7353.56 98.91 43.87 99.00 41.89 100.37 38.51 99.9164.28 98.82 54.84 98.64 73.31 98.99 48.13 98.8474.99 98.52 65.81 98.24 83.79 97.64 57.76 97.9585.70 98.45 76.78 97.24 94.26 96.96 67.39 97.4996.42 98.33 87.75 97.24 104.73 96.85 77.01 97.47107.13 98.07 98.72 97.40 115.21 97.43 86.64 97.56117.84 97.52 109.69 97.64 125.68 97.51 96.27 97.75128.55 97.31 120.65 97.62 136.15 97.65 105.89 98.07139.27 97.38 131.62 97.89 146.62 97.60 115.52 98.31149.98 97.58 142.59 97.96 157.10 97.88 125.15 98.59160.69 97.72 153.56 97.89 167.57 98.02 134.77 98.63171.40 97.84 164.53 98.04 178.04 98.15 144.40 98.57182.12 98.16 175.50 98.29 188.52 98.37 154.03 98.61192.83 98.16 186.47 98.49 198.99 98.46 163.65 98.70203.54 98.79 197.43 98.97 209.46 98.64 173.28 98.85214.26 99.26 208.40 99.19 219.94 99.20 182.91 99.12224.97 99.13 219.37 99.29 230.04 100.16 192.53 99.66235.68 99.01 230.34 99.67 240.88 100.16 211.79 100.26246.40 99.42 241.31 100.07 251.36 100.50 231.04 100.76257.11 99.89 252.28 100.53 256.59 100.84 233.16 100.81267.07 100.72 257.21 100.84 261.62 101.25 244.23 101.39267.82 100.73 262.04 101.34278.53 101.62283.89 102.06

Sedimentation in small damsDevelopment of a catchment characterisation and sediment yield prediction procedure

OD TN 120 Rev 0.0

����

Cross-sections Survey 2001 continuedL5R5 L6R6 L7R7

Chainage(m)

Elevation(m)

Chainage(m)

Elevation(m)

Chainage(m)

Elevation(m)

0.00 103.37 0.00 102.82 0.00 101.4510.15 102.85 10.36 102.29 21.30 100.5220.30 102.20 20.71 101.73 35.10 100.2330.45 101.63 31.07 101.33 49.70 99.9840.60 100.86 41.43 100.90 71.30 99.7841.21 100.85 43.29 100.84 92.70 98.9750.76 100.24 51.78 100.61 130.20 98.9760.91 99.41 103.57 98.97 135.60 98.9071.06 98.79 119.10 98.77 146.30 98.8881.21 98.29 129.46 98.54 157.00 98.8491.36 97.97 139.82 98.36 167.70 98.82101.51 97.74 150.17 98.27 173.10 98.97111.66 97.59 160.53 98.35 178.40 99.28121.81 97.59 170.88 98.14 195.80 99.78131.96 97.84 181.24 98.15 223.70 100.90142.11 98.37 191.60 98.05 247.20 102.09152.26 98.89 201.95 97.97162.41 98.98 212.31 97.75172.57 98.91 222.67 97.47182.72 98.99 233.02 98.04192.87 99.14 243.38 99.14203.02 99.00 253.74 98.96213.17 99.01 264.09 99.36223.32 99.44 274.45 100.11233.47 100.20 284.81 100.57243.62 100.49 289.05 100.84247.73 100.82 294.75 101.25252.86 101.17

Sedimentation in small damsDevelopment of a catchment characterisation and sediment yield prediction procedure

OD TN 120 Rev 0.0

����

Name: GariLocation: Chivi (Zimbabwe)Full Supply Water Level: 100m

Location of survey beacons

Left bank point Right bank pointSectionName East (m) North (m) Elevation (m) East (m) North (m) Elevation (m)'DAM 0.00 0.00 100.00 0.00 59.50 100.00'L1R1' 8.70 -12.60 101.62 8.10 59.20 100.96'L2R2' 34.70 -51.50 101.26 29.60 64.60 100.45'L3R3' 60.80 -83.10 101.01 59.30 70.50 100.25'L4R3' 126.00 -93.50 100.44 59.30 70.50 100.25'L5R3' 175.70 -41.40 100.00 59.30 70.50 100.25'L6R4' 187.30 38.60 100.25 96.10 129.80 100.28'L7R5' 192.00 59.70 100.27 166.40 199.90 100.45'UPST' 206.70 92.10 100.00 206.70 92.10 100.00

Note:Elevation refers to local datum of 100.00 m at the spillway.Location refers to the left bank of the dam (0, 0).

Sedimentation in small damsDevelopment of a catchment characterisation and sediment yield prediction procedure

OD TN 120 Rev 0.0

����

Cross-sections Survey 1999L1R1 L2R2 L3R3 L4R3

Chainage(m)

Elevation(m)

Chainage(m)

Elevation(m)

Chainage(m)

Elevation(m)

Chainage(m)

Elevation(m)

0.00 101.62 0.00 101.26 0.00 101.01 0.00 100.4411.20 99.13 9.00 99.13 11.17 99.13 9.70 99.9322.20 94.08 19.26 97.60 21.99 98.29 10.70 99.8132.20 94.65 29.52 96.77 32.82 97.53 29.70 98.8542.20 96.61 39.78 96.25 43.64 97.16 40.42 97.3352.20 97.89 50.04 95.02 54.47 96.76 51.15 97.7961.20 99.13 60.30 94.74 65.29 96.69 61.87 97.7772.40 100.96 70.56 96.25 76.12 95.54 72.60 97.44

80.82 97.63 86.94 95.39 83.32 96.9991.08 96.87 97.72 95.14 94.05 96.48101.34 97.68 108.59 95.93 104.77 96.02110.65 99.13 119.42 96.10 115.50 96.43116.20 100.45 141.08 98.52 126.22 95.40

147.78 99.13 136.94 95.46153.60 100.25 158.38 96.80

172.69 99.13177.00 100.25

L5R3 L6R4 L7R5Chainage(m)

Elevation(m)

Chainage(m)

Elevation(m)

Chainage(m)

Elevation(m)

0.00 100.00 0.00 100.25 0.00 100.2742.21 99.13 31.00 99.13 30.80 99.1352.85 98.71 41.58 98.81 41.38 98.5663.48 98.43 52.17 97.77 51.96 98.5474.12 97.85 62.75 97.26 62.54 98.9184.76 97.23 73.33 97.18 73.12 98.9395.39 97.29 83.92 97.81 83.70 98.62106.03 97.34 94.50 98.02 94.28 98.73116.67 96.43 105.09 98.39 104.86 98.59127.30 96.14 115.67 99.04 115.44 99.13137.94 96.71 117.50 99.13 145.44 100.45148.57 98.28 129.10 100.28155.81 99.13161.50 100.25

Sedimentation in small damsDevelopment of a catchment characterisation and sediment yield prediction procedure

OD TN 120 Rev 0.0

����

Cross-sections Survey 2000L1R1 L2R2 L3R3 L4R3

Chainage(m)

Elevation(m)

Chainage(m)

Elevation(m)

Chainage(m)

Elevation(m)

Chainage(m)

Elevation(m)

0.00 101.63 0.00 101.26 0.00 101.01 0.00 100.4412.70 99.45 5.90 99.45 7.20 99.45 20.50 99.4522.81 94.71 16.60 97.68 17.57 98.39 31.09 98.8232.92 94.94 27.30 96.97 27.94 97.83 41.68 97.7743.03 96.96 38.00 96.50 38.31 97.36 52.27 97.9053.14 98.19 48.70 95.81 48.68 96.87 62.86 97.8063.00 99.45 59.40 95.05 59.05 96.85 73.45 97.3171.80 100.97 70.10 96.07 69.42 96.23 84.04 96.97

80.80 97.25 79.79 95.92 94.63 96.2291.50 96.93 90.16 95.85 105.22 96.65102.20 97.40 100.53 95.24 115.81 96.35112.90 99.15 110.90 96.59 126.40 96.08114.20 99.45 121.27 95.93 136.99 95.89116.20 100.46 131.64 97.66 147.58 96.74

142.01 98.77 158.17 97.05148.00 99.45 168.76 98.90152.80 100.25 172.70 99.45

176.50 100.24

L5R3 L6R4 L7R5Chainage(m)

Elevation(m)

Chainage(m)

Elevation(m)

Chainage(m)

Elevation(m)

0.00 99.95 0.00 100.25 0.00 100.2726.60 99.45 24.70 99.45 0.30 99.4537.29 99.08 35.23 97.77 13.23 99.0947.98 98.74 45.76 98.22 26.16 98.4458.67 98.44 51.09 97.80 39.09 98.5169.36 98.02 66.82 97.09 52.02 98.8480.05 97.39 77.36 97.52 64.95 98.8990.74 96.55 87.89 97.94 77.88 98.56101.43 97.94 98.42 97.75 90.81 98.66112.12 96.91 108.95 98.64 103.74 98.54122.81 95.53 119.27 99.45 116.67 99.40133.50 96.25 129.00 100.26 117.20 99.45144.19 97.80 143.00 100.46154.88 99.24 145.03 100.46156.60 99.45161.60 100.24

Sedimentation in small damsDevelopment of a catchment characterisation and sediment yield prediction procedure

OD TN 120 Rev 0.0

����

Cross-sections Survey 2001L1R1 L2R2 L3R3 L4R3

Chainage(m)

Elevation(m)

Chainage(m)

Elevation(m)

Chainage(m)

Elevation(m)

Chainage(m)

Elevation(m)

0.00 101.63 0.00 101.26 0.00 101.01 0.00 100.4411.00 99.20 8.82 99.20 9.12 99.20 10.19 99.8522.37 94.20 12.11 98.70 10.73 99.01 20.38 99.3232.63 94.70 21.99 97.55 21.46 98.27 22.01 99.2041.78 96.50 31.87 96.60 32.19 97.55 30.57 98.7552.60 97.90 41.75 96.28 42.92 97.24 44.01 97.7561.91 99.19 51.63 94.90 53.65 96.75 54.20 97.8862.49 99.34 61.51 94.80 64.38 96.74 64.39 97.8572.36 100.96 71.39 96.25 75.11 95.71 74.58 97.45

81.27 98.07 85.84 95.60 84.77 97.0791.15 96.85 96.57 95.68 94.96 96.70101.03 97.84 107.30 95.40 105.15 96.53103.30 99.20 118.03 96.48 116.73 96.30116.20 100.46 128.76 98.08 127.38 95.20

139.49 98.08 135.72 95.40145.93 99.19 145.91 96.07150.22 99.79 156.10 96.61153.61 100.25 166.29 98.10

173.01 99.19177.04 100.24

L5R3 L6R4 L7R5Chainage(m)

Elevation(m)

Chainage(m)

Elevation(m)

Chainage(m)

Elevation(m)

0.00 99.95 0.00 100.26 0.00 100.2710.28 99.74 6.90 100.10 11.07 100.0020.56 99.57 16.45 99.73 22.14 99.4430.84 99.32 25.81 99.27 32.88 99.2035.98 99.20 26.00 99.24 33.21 99.1541.12 99.12 35.55 98.52 41.26 98.5351.40 98.70 45.10 97.82 52.33 98.6061.68 98.37 54.65 97.37 63.40 98.9571.96 97.84 73.75 97.17 74.44 98.9585.07 97.17 83.30 97.87 83.65 98.6595.35 97.25 95.50 98.07 95.10 98.84105.63 97.45 105.05 98.47 104.66 98.65115.91 96.85 114.60 98.97 112.00 99.20126.19 96.08 117.94 99.27 120.26 99.71136.47 96.30 128.98 100.28 131.33 99.83146.75 97.85 145.20 100.46157.03 99.20161.46 100.24

Sedimentation in small damsDevelopment of a catchment characterisation and sediment yield prediction procedure

OD TN 120 Rev 0.0

����

Cross-sections Survey 2002L1R1 L2R2 L3R3 L4R3

Chainage(m)

Elevation(m)

Chainage(m)

Elevation(m)

Chainage(m)

Elevation(m)

Chainage(m)

Elevation(m)

0.13 101.66 0.2 101.19 0.53 100.9 -0.46 100.4411.07 99.21 9.1 99.08 11.39 99.12 8.54 99.8318.12 96.18 25.23 97.56 28.24 97.8 17.54 99.6720.89 94.48 30.23 96.76 33.24 97.54 26.54 99.1925.89 94.8 35.23 96.52 38.24 97.38 42.19 97.8230.89 94.87 40.23 96.39 43.24 97.16 46.39 97.5735.89 95.4 45.23 95.72 48.24 96.96 51.39 97.6740.89 96.54 50.23 95.2 53.24 96.78 56.39 97.8245.89 97.52 55.23 95.07 58.24 96.81 61.39 97.7950.39 97.8 60.23 94.95 63.24 96.73 66.39 97.7371.29 100.78 65.23 95.24 68.24 96.31 71.39 97.62

70.23 96.14 73.24 95.77 76.39 97.475.23 96.54 78.24 95.77 81.39 97.1380.23 97.3 83.24 95.65 86.39 96.9990.23 96.82 88.24 95.89 91.39 96.8295.23 97.13 93.24 95.65 96.39 96.57110.52 99.13 98.24 95.26 101.39 96.1116.11 100.35 103.24 95.83 106.39 95.99

108.24 96.31 111.39 96.55113.24 96.46 116.39 96.7118.24 96.46 121.39 96.22122.12 96.36 126.39 95.96128.24 96.93 131.39 96144.91 98.96 136.39 95.67153.73 100.25 141.39 95.67

146.39 96.27151.39 96.7156.39 96.8158.15 96.81164.04 97.82177.46 100.25

Sedimentation in small damsDevelopment of a catchment characterisation and sediment yield prediction procedure

OD TN 120 Rev 0.0

����

Cross-sections Survey 2002 continuedL5R3 L6R4 L7R5

Chainage(m)

Elevation(m)

Chainage(m)

Elevation(m)

Chainage(m)

Elevation(m)

0 99.95 0 100.26 0 100.249 99.8 3.31 100.13 0.88 100.1918 99.63 8.82 100.02 5.77 100.0627 99.4 14.33 99.86 10.65 100.0836 99.17 19.85 99.64 15.54 99.754 98.63 25.36 99.33 20.43 99.563 98.41 31.86 99.1 25.32 99.3873.6 97.82 42.34 98.76 30.2 99.1375.9 97.79 45.53 98.38 35.09 98.7680.9 97.37 51.71 97.82 39.98 98.685.9 96.74 52.92 97.75 44.87 98.5490.9 96.53 58.44 97.48 49.75 98.5795.9 97.65 63.95 97.3 54.64 98.63100.9 97.78 69.46 97.19 59.53 98.84105.9 97.27 74.97 97.75 64.41 98.95110.9 96.98 81.04 97.82 69.3 98.95115.9 96.41 84.9 97.92 74.19 98.87120.9 96.34 90.41 98.03 79.08 98.72125.9 96.25 95.92 98.11 83.96 98.63130.9 96.35 101.44 98.3 88.85 98.68135.9 96.77 106.95 98.56 93.74 98.77140.9 97.44 112.46 98.89 98.62 98.69143.2 97.82 117.97 99.34 103.51 98.63161.5 100.25 123.49 99.79 108.4 98.94

129 100.28 118.17 99.45123.06 99.67127.95 99.74130.95 99.78135.83 100145.26 100.46

Sedimentation in small damsDevelopment of a catchment characterisation and sediment yield prediction procedure

OD TN 120 Rev 0.0

����

Name: MurambiLocation: Zaka (Zimbabwe)Full Supply Water Level: 100m

Location of survey beacons

Left bank point Right bank pointSectionName East (m) North (m) Elevation (m) East (m) North (m) Elevation (m)'DAM 0 0 100.00 0 186.00 100.00'L1R1' 12.81 -7.80 99.90 24.14 179.47 100.18'L2R2' 45.78 -8.70 100.25 45.93 175.88 100.34'L3R3' 85.80 -5.80 100.37 88.81 150.17 100.64'L4R4' 133.28 1.24 100.18 120.66 147.09 100.92'L5R5' 162.98 6.77 100.18 163.90 141.44 100.46'L6R6' 201.34 -9.20 100.43 203.27 139.10 100.33'L7R7' 259.00 79.34 100.12 263.67 143.40 100.08'UPST' 320.82 116.62 100.00 0 0 100.00

Note:Elevation refers to local datum of 100.00 m at the spillway.Location refers to the left bank of the dam (0, 0).

Sedimentation in small damsDevelopment of a catchment characterisation and sediment yield prediction procedure

OD TN 120 Rev 0.0

����

Cross-sections Survey 1999L1R1 L2R2 L3R3 L4R4

Chainage(m)

Elevation(m)

Chainage(m)

Elevation(m)

Chainage(m)

Elevation(m)

Chainage(m)

Elevation(m)

0.00 99.90 0.00 100.25 0.00 100.37 0.00 100.1313.40 98.79 19.40 98.79 24.10 98.79 26.20 98.7923.86 98.08 29.98 98.33 35.58 98.31 36.69 98.3534.31 97.71 40.57 97.74 45.06 97.87 47.18 98.0644.77 97.51 51.15 97.00 55.54 97.43 57.66 98.0155.23 97.01 61.74 97.04 66.02 97.34 68.15 97.7265.68 97.04 72.32 97.27 76.50 97.24 78.64 97.5876.14 97.25 82.90 97.22 86.98 97.69 89.13 98.0986.60 97.54 93.49 97.71 97.46 98.64 99.62 98.7197.05 97.87 104.07 98.05 99.60 98.79 101.40 98.79107.51 98.10 114.66 98.49 155.00 100.64 146.20 100.88117.97 98.30 123.40 98.79128.43 98.46 184.40 100.34138.88 98.79139.30 98.79188.80 100.15

L5R5 L6R6 L7R7Chainage(m)

Elevation(m)

Chainage(m)

Elevation(m)

Chainage(m)

Elevation(m)

0.00 100.18 0.00 100.43 0.00 100.1221.90 99.32 10.47 99.74 24.80 99.3025.87 99.07 60.73 99.50 29.72 99.0036.32 98.85 81.40 98.79 40.99 98.7146.20 98.79 92.03 98.31 46.70 99.3056.72 98.44 102.67 98.15 63.90 100.0867.24 98.09 113.30 98.7977.76 97.86 147.40 100.3388.28 98.1098.80 98.79134.20 100.46

Sedimentation in small damsDevelopment of a catchment characterisation and sediment yield prediction procedure

OD TN 120 Rev 0.0

����

Cross-sections Survey 2000L1R1 L2R2 L3R3 L4R4

Chainage(m)

Elevation(m)

Chainage(m)

Elevation(m)

Chainage(m)

Elevation(m)

Chainage(m)

Elevation(m)

0.00 99.90 0.00 100.25 0.00 100.37 0.00 100.139.50 99.32 28.00 99.32 28.00 99.32 15.50 99.3219.08 99.27 35.50 98.80 30.60 99.19 20.10 98.8230.26 98.33 45.42 98.37 40.28 98.70 30.52 98.8040.64 97.96 55.34 97.90 49.96 98.24 40.94 98.2751.02 97.63 65.26 97.32 59.64 97.85 51.36 97.9461.40 97.15 75.18 97.12 69.32 97.49 61.78 97.7871.78 97.13 85.10 97.12 79.00 97.37 72.20 97.4982.16 97.18 95.02 97.40 88.68 97.30 82.62 97.4692.54 97.54 104.94 97.78 98.36 97.99 93.04 98.23102.92 97.71 114.86 98.03 108.04 98.74 103.46 98.82113.30 98.02 124.78 98.47 110.10 99.32 114.10 99.32123.68 98.20 134.70 98.78 155.50 100.64 146.50 100.88134.06 98.38 144.62 99.32144.44 98.63 192.00 100.34154.82 99.04155.20 99.32

L5R5 L6R6 L7R7Chainage(m)

Elevation(m)

Chainage(m)

Elevation(m)

Chainage(m)

Elevation(m)

0.00 100.18 0.00 100.43 0.00 100.12221.90 99.32 67.90 99.32 24.80 99.3225.87 99.07 69.00 99.27 26.08 99.1536.32 98.85 79.00 98.65 31.15 98.9946.77 98.75 89.00 98.29 36.22 98.8457.22 98.40 99.00 98.23 41.29 98.7867.67 98.08 109.00 98.82 46.70 99.3278.12 97.86 119.00 99.32 64.00 100.0888.57 98.24 148.00 100.3399.02 98.81109.50 99.32112.60 100.46

Sedimentation in small damsDevelopment of a catchment characterisation and sediment yield prediction procedure

OD TN 120 Rev 0.0

����

Cross-sections Survey 2001L1R1 L2R2 L3R3 L4R4

Chainage(m)

Elevation(m)

Chainage(m)

Elevation(m)

Chainage(m)

Elevation(m)

Chainage(m)

Elevation(m)

0.00 99.90 0.00 100.25 0.00 100.37 0.00 100.1814.59 99.21 10.25 99.37 10.20 99.55 10.25 99.6216.97 99.04 15.37 99.04 19.04 99.04 20.50 99.1424.93 98.26 20.50 98.76 20.41 98.97 30.76 98.7635.27 97.89 30.75 98.31 30.61 98.50 41.01 98.2945.62 97.56 40.99 97.74 40.81 98.04 51.26 98.0855.96 97.08 51.24 97.17 51.01 97.63 61.51 97.9966.30 97.07 61.49 97.09 60.09 97.43 78.56 97.6676.64 97.26 71.74 97.10 70.29 97.32 82.02 97.7786.98 97.38 81.99 97.25 80.49 97.41 92.27 98.3697.32 97.72 92.24 97.71 90.69 98.24 102.52 98.91107.66 97.98 102.49 97.99 100.9 98.88 108.02 99.13118.00 98.23 112.74 98.47 104.33 99.03 112.77 99.35128.34 98.40 122.99 98.75 111.10 99.38 123.03 99.79138.68 98.62 127.08 99.03 121.30 99.72 133.28 100.25148.59 99.03 133.23 99.26 131.51 100.03 143.53 100.77149.03 99.04 143.48 99.57 141.71 100.28 146.40 100.92159.37 99.31 153.73 99.78 151.91 100.52169.71 99.67 163.98 100.11 154.87 100.64180.05 99.83 174.23 100.20186.14 100.08 184.48 100.30189.04 100.18 184.58 100.34

L5R5 L6R6 L7R7Chainage(m)

Elevation(m)

Chainage(m)

Elevation(m)

Chainage(m)

Elevation(m)

0.00 100.18 0.00 100.43 0.00 100.1210.29 99.74 10.28 99.74 10.25 99.9820.59 99.41 20.56 99.73 20.50 99.6627.49 99.03 30.83 99.72 29.72 99.0330.88 98.80 41.11 99.70 30.74 99.0141.17 98.81 51.39 99.66 40.99 98.7851.47 98.64 61.67 99.54 42.01 99.0361.76 98.24 71.94 99.27 51.24 99.6277.02 97.86 77.08 99.03 61.48 99.7882.35 97.91 82.22 98.77 64.23 100.0892.64 98.41 92.50 98.30102.93 98.95 102.78 98.19105.15 99.13 113.06 98.75113.23 99.39 119.22 99.03123.52 99.88 123.33 99.23133.82 100.33 133.61 99.58134.66 100.46 143.89 100.06

147.40 100.33

Sedimentation in small damsDevelopment of a catchment characterisation and sediment yield prediction procedure

OD TN 120 Rev 0.0

����

Cross-sections Survey 2002L1R1 L2R2 L3R3 L4R4

Chainage(m)

Elevation(m)

Chainage(m)

Elevation(m)

Chainage(m)

Elevation(m)

Chainage(m)

Elevation(m)

0 99.9 0 100.25 0 100.37 -0.38 100.169 99.37 1.8 100.06 5.6 100.01 2.62 100.0114.1 98.76 6.9 99.58 10.7 99.48 7.62 99.7219.3 98.35 12 99.29 15.8 99.17 12.72 99.524.4 98.13 17.1 98.95 20.9 98.94 17.82 99.1829.5 97.85 22.2 98.68 26 98.71 22.92 98.9634.7 97.85 27.3 98.47 31.1 98.5 28.02 98.7839.8 97.68 32.4 98.21 36.2 98.68 33.12 98.644.9 97.48 37.5 97.87 41.3 97.49 38.22 98.3650 97.2 42.6 97.62 46.4 97.84 43.22 98.1355.2 97.17 47.7 97.48 51.5 97.68 48.32 98.0660.3 97.05 52.8 97.19 56.6 97.44 53.42 97.9865.4 97.16 57.9 97.19 61.7 97.44 58.52 98.0170.5 97.24 63 97.15 66.8 97.42 63.62 97.9275.7 97.3 68 97.15 71.9 97.38 68.72 97.7579.86 97.37 73.1 97.19 77.1 97.23 73.82 97.6485.9 97.53 78.2 97.18 82.2 97.47 78.92 97.6491 97.64 83.3 97.35 87.3 97.75 83.92 97.896.2 97.8 88.4 97.55 92.4 98.26 89.02 98.14101.3 97.93 93.5 97.74 97.5 98.64 94.12 98.47106.4 98.1 98.6 97.86 102.6 98.91 99.22 98.74111.5 98.2 103.7 98 107.7 99.13 104.32 98.96116.7 98.33 108.8 98.26 112.8 99.4 109.42 99.15121.8 98.36 113.9 98.5 117.9 99.56 114.52 99.39126.9 98.48 119 98.6 123 99.71 119.52 99.6132.1 98.58 124.1 98.84 128.1 99.85 124.62 99.84135.78 98.7 129.2 99.16 133.2 100.08 129.72 100.12142.3 98.88 134.3 99.34 138.3 100.22 134.82 100.35147.4 99.08 139.4 99.62 143.4 100.3 139.92 100.58152.6 99.23 144.4 99.64 153.7 100.51 145.02 100.81157.7 99.43 149.5 99.65 156 100.65 146.02 100.93162.8 99.53 154.6 99.92167.9 99.65 159.7 99.98173.1 99.69 164.8 100.1176.31 99.83 169.9 100.06181.88 99.94 175 100.15187.6 100.16 180.1 100.19

184.6 100.35

Sedimentation in small damsDevelopment of a catchment characterisation and sediment yield prediction procedure

OD TN 120 Rev 0.0

����

Cross-sections Survey 2002 continuedL5R5 L6R6 L7R7

Chainage(m)

Elevation(m)

Chainage(m)

Elevation(m)

Chainage(m)

Elevation(m)

-0.33 100.22 0 100.43 0 100.124.77 99.97 4.5 100.13 5.1 100.19.77 99.82 9.6 99.76 10.1 99.9914.87 99.68 14.7 99.7 15.2 99.8619.97 99.48 19.8 99.7 20.3 99.6725.07 99.21 24.9 99.65 25.3 99.2930.07 98.92 30 99.71 30.4 99.0335.17 98.91 35.1 99.75 35.5 98.8740.27 98.92 40.2 99.74 40.5 98.7745.37 98.85 45.3 99.71 46.26 99.2850.37 98.69 50.4 99.69 51.53 99.5455.47 98.53 55.5 99.61 55.2 99.6860.57 98.33 60.6 99.55 57.99 99.8165.67 98.2 65.7 99.47 64.2 100.0870.67 98.01 70.8 99.3275.77 97.88 75.9 99.1380.87 97.86 81 98.8785.97 98.06 86.1 98.5790.97 98.38 91.3 98.3896.07 98.67 96.4 98.31101.17 98.91 101.5 98.24106.27 99.13 106.6 98.38111.27 99.35 111.7 98.69116.37 99.51 116.8 98.96121.47 99.79 121.9 99.17126.47 100.02 127 99.35131.57 100.28 132.1 99.59134.37 100.48 137.2 99.75

142.3 99.99147.4 100.19148.3 100.34

Sedimentation in small damsDevelopment of a catchment characterisation and sediment yield prediction procedure

OD TN 120 Rev 0.0

����

Name: MutangiLocation: Chivi (Zimbabwe)Full Supply Water Level: 99.83m

Location of survey beacons

Left bank point Right bank pointSectionName East (m) North (m) Elevation (m) East (m) North (m) Elevation (m)'DAM 0.00 0.00 99.83 0.00 51.30 99.83'L1R1' 27.10 -8.50 101.18 60.90 85.10 100.34'L2R2' 59.50 -20.50 101.28 86.80 110.30 100.10'L3R3' 113.10 -39.80 101.09 115.40 144.50 100.45'L4R4' 241.40 -87.00 101.22 152.70 142.10 100.13'L5R5' 333.20 -31.60 100.06 248.70 197.80 100.15'L6R5' 409.50 47.40 99.93 248.70 197.80 100.15'L6R6' 409.50 47.40 99.93 451.50 234.20 100.22'L7R6' 491.50 68.20 100.50 451.50 234.20 100.23'UPST' 500.00 151.00 99.83 500.00 151.00 99.83

Note:Elevation refers to local datum of 99.83 m at the spillway.Location refers to the left bank of the dam (0, 0).

Sedimentation in small damsDevelopment of a catchment characterisation and sediment yield prediction procedure

OD TN 120 Rev 0.0

����

Cross-sections Survey 1999L1R1 L2R2 L3R3 L4R4

Chainage(m)

Elevation(m)

Chainage(m)

Elevation(m)

Chainage(m)

Elevation(m)

Chainage(m)

Elevation(m)

0.00 101.18 0.00 101.28 0.00 101.09 0.00 101.220.63 100.93 0.85 100.99 0.75 100.90 1.64 100.845.70 98.93 5.20 98.93 4.40 98.93 6.20 98.9316.24 98.59 8.17 98.64 10.41 97.75 27.14 97.4826.78 98.59 10.15 98.35 20.83 97.53 48.07 97.3337.33 98.67 15.75 98.32 26.36 97.74 69.01 97.2747.87 98.73 26.29 98.35 48.33 98.17 89.94 97.3258.41 98.93 36.83 98.35 70.29 98.28 110.88 97.2599.91 100.34 47.38 98.36 92.26 98.44 131.81 97.46

57.92 98.42 114.22 98.85 152.75 97.6468.47 98.53 116.80 98.93 173.69 98.1879.01 98.76 146.50 99.39 194.62 98.5387.30 98.93 168.97 99.70 206.00 98.93112.20 99.38 185.00 100.45 225.70 99.81124.56 99.66 246.50 100.13133.60 100.10

L5R5 L6R5 L6R6 L7R6Chainage(m)

Elevation(m)

Chainage(m)

Elevation(m)

Chainage(m)

Elevation(m)

Chainage(m)

Elevation(m)

0.00 100.06 0.00 99.93 0.00 99.93 0.00 100.5010.70 99.47 1.80 99.74 15.45 99.55 27.00 99.8413.20 99.14 16.30 99.26 31.04 99.23 46.60 99.6516.80 98.93 31.50 98.93 46.63 99.06 62.80 99.9237.89 98.44 52.96 98.39 62.30 98.97 122.30 99.1858.98 98.03 63.69 98.24 92.60 99.37 141.30 99.5580.07 97.65 74.42 98.20 120.30 99.08 150.30 99.21101.16 97.66 95.88 98.17 133.10 99.42 170.00 100.23122.25 97.80 117.34 98.24 146.20 99.06143.34 97.95 138.80 98.09 162.10 99.42164.43 98.25 160.26 98.18 170.30 99.21185.51 98.40 181.72 98.48 190.90 100.22206.60 98.76 202.60 98.93216.20 98.93 225.00 100.15226.60 99.19244.80 100.15

Sedimentation in small damsDevelopment of a catchment characterisation and sediment yield prediction procedure

OD TN 120 Rev 0.0

����

Cross-sections Survey 2000L1R1 L2R2 L3R3 L4R4

Chainage(m)

Elevation(m)

Chainage(m)

Elevation(m)

Chainage(m)

Elevation(m)

Chainage(m)

Elevation(m)

0.00 101.17 0.00 101.26 0.00 101.09 0.00 101.224.10 99.19 4.00 99.19 4.30 99.19 3.50 99.199.64 98.62 7.77 98.52 11.22 97.67 12.04 98.1421.80 98.54 13.08 98.33 21.71 97.65 22.45 97.6733.96 98.64 23.69 98.35 32.20 97.99 32.87 97.4646.12 98.65 34.31 98.34 42.69 98.18 43.28 97.4458.28 98.78 44.92 98.36 53.18 98.24 53.70 97.4570.44 98.99 55.54 98.40 63.68 98.30 64.11 97.4682.59 99.19 66.15 98.52 74.16 98.35 74.52 97.4599.30 100.34 76.77 98.70 84.65 98.46 84.94 97.44

87.38 98.94 95.13 98.55 95.35 97.4498.00 99.19 105.62 98.80 105.77 97.42132.90 100.10 116.11 99.03 116.18 97.44

126.60 99.19 126.59 97.51185.70 100.48 137.01 97.66

147.42 97.68157.84 97.85168.25 98.03178.66 98.29189.08 98.43199.49 98.73209.91 99.19244.70 100.16

L5R5 L6R5 L6R6 L7R6Chainage(m)

Elevation(m)

Chainage(m)

Elevation(m)

Chainage(m)

Elevation(m)

Chainage(m)

Elevation(m)

0.00 100.06 0.00 99.93 0.00 99.93 0.00 100.5012.50 99.19 16.30 99.19 62.30 98.97 25.10 99.9923.21 98.84 26.72 99.08 92.60 99.37 52.00 99.9033.92 98.59 37.44 98.79 120.30 99.08 76.30 100.0244.63 98.69 48.16 98.54 133.10 99.42 100.50 99.2155.34 98.21 58.88 98.34 146.20 99.06 127.80 99.7166.05 98.03 69.60 98.25 162.10 99.42 152.10 99.5176.76 98.01 80.32 98.23 170.30 99.21 170.80 100.1987.47 97.72 91.04 98.34 190.90 100.2298.18 97.80 101.76 98.27108.89 97.78 112.48 98.29119.60 97.95 123.20 98.21130.31 97.98 133.92 98.19141.02 98.00 144.64 98.14151.73 98.06 155.36 98.19162.44 98.23 166.08 98.28173.15 98.32 176.80 98.44183.86 98.39 187.52 98.60194.57 98.52 198.24 98.85205.28 98.69 204.00 99.19215.99 98.94 222.10 100.20226.60 99.19245.80 100.18

Sedimentation in small damsDevelopment of a catchment characterisation and sediment yield prediction procedure

OD TN 120 Rev 0.0

����

Cross-sections Survey 2001L1R1 L2R2 L3R3 L4R4

Chainage(m)

Elevation(m)

Chainage(m)

Elevation(m)

Chainage(m)

Elevation(m)

Chainage(m)

Elevation(m)

0.00 101.17 0.00 101.26 0.00 101.09 0.00 101.226.50 98.89 6.18 98.87 5.21 98.88 13.73 98.8810.00 98.58 10.29 98.33 10.41 97.75 27.45 97.9920.00 98.56 20.59 98.23 20.83 97.56 41.19 97.3430.00 98.63 30.88 98.38 31.24 97.93 54.90 97.2440.00 98.68 41.18 98.30 41.65 98.05 68.62 97.2948.10 98.92 51.47 98.38 52.06 98.13 82.35 97.3450.00 99.07 61.77 98.45 62.48 98.23 96.07 97.2460.00 99.25 72.06 98.58 72.89 98.33 109.80 97.1470.00 99.46 82.35 98.79 83.30 98.41 123.52 97.2981.20 100.12 85.44 98.87 93.72 98.50 137.25 97.4999.50 100.34 92.65 99.06 104.13 98.74 150.97 97.94

102.94 99.25 110.38 98.88 164.70 98.19113.24 99.39 114.54 98.99 178.42 98.29123.53 99.59 124.96 99.17 192.14 98.59133.62 100.10 135.37 99.31 203.12 98.88

145.78 99.35 205.87 99.38156.19 99.49 219.59 99.72166.61 99.61 233.32 99.55177.02 99.99 245.67 100.13184.31 100.48

L5R5 L6R5 L6R6 L7R6Chainage(m)

Elevation(m)

Chainage(m)

Elevation(m)

Chainage(m)

Elevation(m)

Chainage(m)

Elevation(m)

0.00 100.06 0.00 99.93 0.00 99.93 0.47 100.5010.11 99.56 16.30 99.19 18.47 99.48 16.86 100.1012.64 99.06 26.72 99.08 29.38 99.25 27.11 99.8515.42 99.00 37.44 98.79 40.29 99.11 37.36 99.9125.28 98.75 48.16 98.54 51.20 99.02 47.61 99.7237.92 98.45 58.88 98.34 62.11 98.97 57.86 99.8750.56 98.18 69.60 98.25 73.02 99.13 68.11 99.8263.20 98.05 80.32 98.23 83.93 99.31 78.36 99.6475.84 97.75 91.04 98.34 94.84 99.40 88.61 99.5988.48 97.61 101.76 98.27 98.19 99.32 98.86 99.82101.13 97.75 112.48 98.29 109.10 99.20 109.11 99.61113.77 97.90 123.20 98.21 120.01 99.25 119.36 99.62126.41 97.90 133.92 98.19 130.92 99.41 123.00 99.50139.05 97.90 144.64 98.14 141.83 99.51 133.25 99.41151.73 98.06 155.36 98.19 152.74 99.31 143.50 99.50162.44 98.23 166.08 98.28 163.65 99.41 153.75 99.45173.15 98.32 176.80 98.44 174.56 99.41 164.00 99.79183.86 98.39 187.52 98.60 182.64 99.79 170.28 100.22194.57 98.52 198.24 98.85 190.99 100.22205.28 98.69 204.00 99.19215.99 98.94 225.05 100.17226.60 99.19245.80 100.18

Sedimentation in small damsDevelopment of a catchment characterisation and sediment yield prediction procedure

OD TN 120 Rev 0.0

����

Cross-sections Survey 2002L1R1 L2R2 L3R3 L4R4

Chainage(m)

Elevation(m)

Chainage(m)

Elevation(m)

Chainage(m)

Elevation(m)

Chainage(m)

Elevation(m)

0 101.18 0 101.28 0 101.09 0 101.225 99.21 5 99.14 5.1 98.83 5.1 99.3510 98.66 10 98.42 10.2 97.82 10.2 98.4414.9 98.63 15 98.34 15.3 97.72 15.3 98.1719.9 98.63 20 98.22 20.4 97.73 20.4 97.9524.9 98.63 24.9 98.32 25.5 97.9 25.5 97.7229.9 98.66 29.9 98.39 30.6 98.06 30.6 97.5834.8 98.64 34.9 98.34 35.7 98.17 35.7 97.5539.8 98.59 39.9 98.39 40.8 98.22 40.8 97.5544.8 98.72 44.9 98.4 45.9 98.26 45.9 97.5549.8 98.76 49.9 98.45 51 98.27 51 97.5554.7 98.87 54.9 98.4 56.1 98.21 56.1 97.5559.7 98.99 59.9 98.46 61.2 98.32 61.2 97.5664.7 99.07 64.9 98.53 66.3 98.28 66.3 97.5669.7 99.11 69.8 98.59 71.4 98.34 71.4 97.5374.6 99.27 74.8 98.66 76.5 98.42 76.5 97.5279.6 99.25 79.8 98.79 81.6 98.46 81.6 97.5684.6 99.3 84.8 98.89 86.7 98.44 86.7 97.5989.6 99.65 89.8 99.01 91.8 98.51 91.8 97.5899.5 100.35 94.8 99.12 96.9 98.61 96.9 97.54

99.8 99.21 102 98.73 102 97.54104.8 99.31 107.1 98.85 107 97.52109.8 99.37 112.2 98.98 112.1 97.45114.7 99.43 117.3 99.08 117.2 97.46119.7 99.49 122.4 99.14 122.3 97.51129.7 99.77 127.5 99.22 127.4 97.62133.6 100.1 132.6 99.31 132.5 97.65

137.7 99.35 137.6 97.73142.7 99.4 142.7 97.75147.8 99.4 147.8 97.76152.9 99.5 152.9 97.79163.1 99.54 158 97.9168.2 99.66 163.1 97.95173.3 99.96 168.2 98.09178.4 100.06 173.3 98.22184.3 100.48 178.4 98.33

183.5 98.39188.6 98.45193.7 98.55198.8 98.71203.9 98.93209 99.12214.1 99.32219.2 99.53224.3 99.7229.4 99.87234.5 99.97239.6 100.04244.7 100.12245.7 100.06

Sedimentation in small damsDevelopment of a catchment characterisation and sediment yield prediction procedure

OD TN 120 Rev 0.0

����

Cross-sections Survey 2002 continuedL5R5 L6R5 L6R6 L7R6

Chainage(m)

Elevation(m)

Chainage(m)

Elevation(m)

Chainage(m)

Elevation(m)

Chainage(m)

Elevation(m)

0 100.07 0 99.93 0 99.93 0 100.53.3 99.97 5.1 99.57 5 99.65 11.61 100.228.5 99.49 10.2 99.43 10 99.49 16.61 100.116.75 98.99 15.3 99.31 15 99.32 21.71 99.9321.95 98.87 20.4 99.19 20 99.24 26.71 99.8627.25 98.78 25.5 99.06 25 99.22 31.71 99.7532.45 98.7 30.6 98.96 30 99.19 36.71 99.9337.75 98.55 35.7 98.84 35 99.12 41.71 99.8842.95 98.46 40.8 98.74 40 99.08 46.71 99.7648.25 98.3 45.9 98.61 45 99.05 56.81 99.7253.55 98.26 50.9 98.5 50 99.01 61.81 99.9458.75 98.1 56 98.39 55 98.97 66.81 99.8364.05 97.88 61.1 98.22 60 98.97 71.81 99.8269.25 97.93 66.2 98.24 65 99.03 76.81 99.6874.55 98.03 71.3 98.24 70 99.1 80.3 99.5679.75 97.78 76.4 98.21 75 99.22 85.3 99.6785.05 97.78 81.5 98.24 80 99.27 88.88 99.9790.35 97.85 86.6 98.29 85 99.27 93.88 99.8995.55 97.86 91.7 98.32 90 99.38 98.98 99.92100.85 97.87 96.8 98.27 95 99.41 103.98 99.88106.05 97.92 101.9 98.3 100 99.34 108.98 99.71111.35 97.96 107 98.28 105 99.3 113.98 99.65116.55 98.01 112.1 98.27 110 99.24 118.98 99.62121.85 98.03 117.2 98.28 115 99.19 123.98 99.43127.05 98.03 122.3 98.23 120 99.23 129.08 99.39132.35 98.05 127.4 98.14 125 99.32 134.08 99.47137.65 98.06 132.5 98.18 130 99.41 139.08 99.53142.85 98.1 137.6 98.14 135 99.42 144.08 99.5148.15 98.13 142.7 98.17 140 99.53 149.08 99.36153.35 98.17 147.8 98.19 145 99.51 154.08 99.51158.65 98.31 152.8 98.23 150 99.35 159.18 99.67163.85 98.38 157.9 98.24 155 99.32 164.18 99.83169.15 98.41 163 98.31 160 99.47 169.66 100.21174.35 98.49 168.1 98.38 165 99.44179.65 98.51 173.2 98.44 170 99.3184.95 98.55 178.3 98.52 175 99.4190.15 98.65 183.4 98.64 180 99.59195.45 98.71 193.6 98.86 185 99.77205.95 98.9 198.7 98.98 190 100.02211.15 99.04 203.8 99.15 191.5 100.17221.65 99.29 224.33 100.12226.95 99.4232.25 99.54245.09 100.17

Sedimentation in small damsDevelopment of a catchment characterisation and sediment yield prediction procedure

OD TN 120 Rev 0.0

����

Name: NymaiLocation: Chivi (Zimbabwe)Full Supply Water Level: 100.13m (1999) and 98.75m (2001)

Location of survey beacons

Left bank point Right bank pointSectionName East (m) North (m) Elevation (m) East (m) North (m) Elevation (m)'DAM 0.00 0.00 100.13 97.70 0.00 100.13'L1R1' -14.10 22.70 100.10 97.00 6.80 100.08'L2R2' -20.60 56.90 100.29 99.50 24.70 99.97'L3R3' -4.70 103.30 99.83 97.50 63.10 99.75'L4R4' -17.10 151.40 100.23 80.10 130.40 99.80'L5R5' 62.60 259.90 99.95 103.00 174.80 99.60'L6R6' 125.60 295.50 100.97 154.20 247.30 100.12'L7R6' 125.60 295.50 99.61 150.20 298.40 99.43'UPST' 137.00 300.00 100.13 137.00 300.00 100.13

Note:Elevation refers to local datum of 100.13 m at the spillway for the 1999 and 2000 survey and adatum of 98.75 m for the survey 2001.Location refers to the left bank of the dam (0, 0).

Sedimentation in small damsDevelopment of a catchment characterisation and sediment yield prediction procedure

OD TN 120 Rev 0.0

����

Cross-sections Survey 1999L1R1 L2R2 L3R3 L4R4

Chainage(m)

Elevation(m)

Chainage(m)

Elevation(m)

Chainage(m)

Elevation(m)

Chainage(m)

Elevation(m)

0.00 100.10 0.00 100.29 -10.00 100.42 0.00 100.231.40 99.48 6.10 99.58 0.00 99.83 10.10 99.856.00 98.41 13.40 98.41 24.00 98.41 28.30 98.4116.00 95.80 23.90 96.23 34.00 96.03 37.50 97.5626.00 92.29 34.40 92.42 44.00 93.87 46.70 96.8136.00 91.97 44.90 93.69 54.00 93.23 55.80 96.1446.00 92.63 55.50 94.24 64.00 93.19 65.00 95.5356.00 94.11 66.00 95.35 74.00 93.64 74.20 94.6566.00 95.77 76.50 96.07 85.62 96.35 83.40 94.3176.00 96.89 87.00 96.92 94.00 96.47 97.40 98.4186.00 97.80 97.50 97.89 102.00 98.41 99.44 99.8392.10 98.41 105.00 98.41 107.20 99.6696.20 98.96 124.40 99.99 110.00 99.74108.60 100.09 125.30 99.97

L5R5 L6R6 L7R6Chainage(m)

Elevation(m)

Chainage(m)

Elevation(m)

Chainage(m)

Elevation(m)

-10.00 100.72 0.00 100.97 -10.00 100.600.00 99.95 11.60 99.90 0.00 99.5911.90 99.04 21.90 98.40 5.40 99.0517.60 98.41 26.40 97.81 8.50 98.4027.60 97.09 30.90 97.52 10.40 99.0937.60 96.11 34.90 97.99 11.70 98.4147.60 95.32 43.50 98.41 11.90 98.1357.60 96.13 58.10 99.43 16.70 98.1367.60 97.39 65.18 99.66 17.10 98.4175.70 98.41 68.10 100.13 19.90 99.3293.60 99.61 24.50 99.43

54.50 100.17

Sedimentation in small damsDevelopment of a catchment characterisation and sediment yield prediction procedure

OD TN 120 Rev 0.0

����

Cross-sections Survey 2000L1R1 L2R2 L3R3 L4R4

Chainage(m)

Elevation(m)

Chainage(m)

Elevation(m)

Chainage(m)

Elevation(m)

Chainage(m)

Elevation(m)

0.00 100.10 0.00 100.29 0.00 99.83 0.00 100.233.90 99.57 15.00 99.57 4.00 99.57 10.70 99.5714.33 97.27 25.43 98.23 14.43 99.14 21.01 98.7024.26 93.98 35.86 94.77 24.86 98.16 31.32 98.1435.19 93.20 46.29 92.53 35.29 95.56 41.63 97.4645.62 93.20 56.72 93.59 45.72 93.82 51.94 96.5556.05 93.87 67.15 94.36 56.15 93.21 62.25 95.9466.48 94.81 77.58 95.68 66.58 93.21 72.56 95.3376.91 96.32 88.01 97.27 77.01 93.65 82.87 94.2187.34 97.27 98.44 97.17 87.44 96.55 93.18 97.5297.77 98.47 108.87 98.00 97.87 97.30 97.50 99.57108.20 99.53 119.30 98.62 107.00 99.57 98.80 99.81108.70 99.57 120.90 99.57 110.00 99.74112.90 100.08 125.30 99.97

L5R5 L6R6 L7R6Chainage(m)

Elevation(m)

Chainage(m)

Elevation(m)

Chainage(m)

Elevation(m)

Chainage(m)

Elevation(m)

0.00 99.95 0.00 100.97 -0.40 99.574.50 99.57 13.90 99.57 0.00 99.6014.68 98.23 26.72 98.87 4.09 99.1724.86 97.49 39.54 98.20 8.19 99.1935.04 96.54 58.40 99.43 12.28 99.3745.22 95.44 65.18 99.11 16.38 99.3055.40 95.84 71.60 99.57 20.47 99.4765.58 97.19 24.57 99.2575.76 98.50 24.60 99.4385.94 99.07 27.70 99.5793.10 99.5793.15 99.60

Sedimentation in small damsDevelopment of a catchment characterisation and sediment yield prediction procedure

OD TN 120 Rev 0.0

����

Cross-sections Survey 2001L1R1 L2R2 L3R3 L4R4

Chainage(m)

Elevation(m)

Chainage(m)

Elevation(m)

Chainage(m)

Elevation(m)

Chainage(m)

Elevation(m)

0.00 100.10 0.00 100.29 0.00 99.83 0.00 100.234.86 98.75 10.99 99.13 10.00 99.43 10.00 99.676.36 98.40 14.29 98.74 20.00 98.77 20.00 98.7816.33 95.75 21.99 98.00 30.00 97.45 30.00 98.1926.31 92.40 34.60 92.55 36.00 95.58 40.00 97.4136.28 92.22 43.97 93.00 40.00 94.68 50.00 96.6846.26 92.65 54.97 94.00 50.00 93.83 60.00 96.0856.24 94.27 65.96 94.75 60.00 93.38 70.00 95.6074.24 96.70 76.96 96.40 64.48 93.20 72.00 94.8986.16 97.72 87.95 97.35 80.00 94.70 80.00 94.3996.14 98.77 98.94 98.11 90.00 95.58 84.20 94.54106.12 99.92 109.94 98.76 100.00 98.20 99.44 99.80108.61 100.08 120.93 99.62 109.80 99.42

124.34 99.97 109.82 99.75

L5R5 L6R6 L7R6Chainage(m)

Elevation(m)

Chainage(m)

Elevation(m)

Chainage(m)

Elevation(m)

Chainage(m)

Elevation(m)

0.00 99.95 0.00 100.97 0.00 99.6110.00 99.12 13.90 99.57 5.00 99.4620.00 98.10 26.72 98.86 10.00 98.8130.00 96.78 39.54 98.19 15.00 98.0840.00 96.43 58.40 99.43 20.00 99.4250.00 95.92 65.18 99.66 24.77 99.4360.00 96.81 68.01 100.1270.00 97.8880.00 98.9590.00 99.4394.20 99.60

Sedimentation in small damsDevelopment of a catchment characterisation and sediment yield prediction procedure

OD TN 120 Rev 0.0

����

Cross-sections Survey 2002L1R1 L2R2 L3R3 L4R4

Chainage(m)

Elevation(m)

Chainage(m)

Elevation(m)

Chainage(m)

Elevation(m)

Chainage(m)

Elevation(m)

0 100.1 0 100.29 0 99.83 0 100.230.88 99.6 13 98.78 20.3 98.77 22.9 98.663.97 98.87 24.4 97.3 30.2 97.3 36.4 97.776.87 98.23 25 97 34.2 95.71 42.02 97.311.17 97.3 29.4 93.08 35.1 94.47 43.55 97.1611.77 97.24 34.4 92.64 39.9 94.1 47.35 96.7116.87 95.93 39.5 93.05 44.8 93.82 52.55 96.422.17 94.11 44.5 93.58 49.7 93.5 57.65 96.1527.57 92.66 49.5 94.08 54.5 93.43 62.85 95.9332.87 92.35 54.6 94.33 59.4 93.42 68.05 95.6938.27 92.38 59.6 94.68 64.3 93.46 73.15 95.3643.57 93.01 64.6 95.21 69.2 93.72 78.35 94.7448.97 93.81 69.7 95.74 74 94.21 83.55 94.2754.27 94.32 74.7 96.02 78.9 96.64 88.65 94.9159.67 94.78 79.8 96.41 83.8 96.8 90.85 97.364.97 95.62 84.8 96.79 88.6 96.42 95.97 98.7470.37 96.3 89.8 97.3 89.8 97.3 99.17 99.8375.67 96.72 103 98.26 101.6 98.5181.07 97.14 111.7 98.67 109.8 99.6682.77 97.3 124.4 99.9992.87 98.65107.47 100.08

L5R5 L6R6 L7R6Chainage(m)

Elevation(m)

Chainage(m)

Elevation(m)

Chainage(m)

Elevation(m)

0 99.95 0 100.97 0 99.6115.3 98.67 22.3 98.58 5 99.4627.8 97.3 42.35 98.42 10 98.8129.6 96.96 47.85 98.9 15 98.0833.1 96.56 58.15 99.46 20 99.4238.4 96.68 24.77 99.4343.7 96.1648.9 96.0354.2 96.259.5 96.8464.8 97.1666.9 97.377.7 98.6794.2 99.61

Sedimentation in small damsDevelopment of a catchment characterisation and sediment yield prediction procedure

OD TN 120 Rev 0.0

����

Name: SekenendeLocation: Masvingo (Zimbabwe)Full Supply Water Level: 100.00m

Location of survey beacons

Left bank point Right bank pointSectionName East (m) North (m) Elevation (m) East (m) North (m) Elevation (m)'DAM 0.00 0.00 100.00 0.00 148.00 100.00'L1R1' 9.00 0.10 101.26 8.00 141.80 101.06'L2R2' 28.80 -1.40 101.92 38.90 134.50 100.24'L3R3' 66.10 23.10 101.05 84.80 149.70 100.10'L4R4' 92.60 28.80 100.34 126.20 103.20 100.08'L5R5' 139.30 14.30 99.99 175.60 52.40 100.35'L6R6' 190.70 -10.30 100.19 195.90 15.40 100.26'L7R7' 224.70 -24.90 100.26 232.00 -1.00 100.46'UPST' 252.10 -16.60 100.00 252.10 -16.60 100.00

Note:Elevation refers to local datum of 100.00 m at the spillway.Location refers to the left bank of the dam (0, 0).

Sedimentation in small damsDevelopment of a catchment characterisation and sediment yield prediction procedure

OD TN 120 Rev 0.0

����

Cross-sections Survey 1999L1R1 L2R2 L3R3 L4R4

Chainage(m)

Elevation(m)

Chainage(m)

Elevation(m)

Chainage(m)

Elevation(m)

Chainage(m)

Elevation(m)

0.00 101.28 0.00 101.89 0.00 101.07 0.00 100.3621.00 99.83 20.60 100.54 24.00 99.92 13.80 99.1140.20 98.96 57.60 99.11 27.40 99.11 19.10 98.1545.20 98.86 62.03 98.74 32.70 98.09 24.40 97.9650.20 98.64 67.37 98.05 38.00 97.61 29.70 96.7255.20 98.45 72.70 98.14 43.20 97.56 35.00 97.4460.30 98.30 78.03 97.86 48.50 96.24 41.10 99.1965.30 98.04 83.37 97.46 53.80 97.01 45.60 98.9470.30 97.84 88.70 95.84 59.10 97.83 55.60 99.1175.30 97.52 94.03 95.76 64.30 98.09 64.10 99.5580.30 97.08 99.37 97.75 69.60 98.19 81.64 100.0885.30 97.09 104.70 97.90 74.90 98.3590.30 96.81 110.03 97.95 80.20 98.6095.30 97.17 115.37 98.11 85.50 98.97100.40 97.28 120.70 98.31 90.70 98.54105.40 97.41 126.03 98.64 99.00 97.30110.40 97.62 128.70 99.11 101.30 98.31115.40 98.09 129.30 99.69 104.10 99.11120.40 98.30 136.10 100.16 105.70 99.59125.40 98.76 127.30 100.10130.40 99.10131.60 99.11137.20 99.93142.20 101.07

L5R5 L6R6 L7R7Chainage(m)

Elevation(m)

Chainage(m)

Elevation(m)

Chainage(m)

Elevation(m)

0.00 99.99 0.00 100.19 0.00 100.261.50 99.86 6.00 99.11 6.70 99.1111.85 98.53 9.80 97.86 9.00 98.5323.80 97.35 11.70 97.88 11.40 98.2528.70 97.95 13.60 98.26 13.70 98.4230.10 99.11 15.50 99.11 16.00 98.7236.00 99.58 26.20 100.26 18.40 98.8242.90 99.55 20.70 98.6152.80 100.36 21.40 99.11

24.90 100.46

Sedimentation in small damsDevelopment of a catchment characterisation and sediment yield prediction procedure

OD TN 120 Rev 0.0

����

Cross-sections Survey 2000L1R1 L2R2 L3R3 L4R4

Chainage(m)

Elevation(m)

Chainage(m)

Elevation(m)

Chainage(m)

Elevation(m)

Chainage(m)

Elevation(m)

0.00 101.27 0.00 101.89 0.00 101.06 0.00 100.3519.50 99.86 34.70 99.86 25.00 99.86 6.50 99.8630.05 99.41 45.11 99.33 35.41 97.86 16.87 98.8240.59 98.96 55.52 99.03 45.82 96.60 27.24 97.9351.14 98.36 65.93 98.51 56.23 97.36 37.61 98.3661.68 98.11 76.34 97.86 66.64 98.10 47.98 99.1072.23 97.64 86.75 96.06 77.05 98.36 58.35 99.0682.78 97.13 97.16 97.26 87.46 98.86 68.72 99.7693.33 96.80 107.57 97.86 97.87 97.26 79.09 99.81103.87 97.35 117.98 98.06 108.28 99.83 79.90 99.86114.42 97.82 128.39 99.64 111.60 99.86 81.40 100.08124.97 98.66 129.80 99.86 126.60 100.10135.51 99.29 134.50 100.17138.10 99.86141.20 101.07

L5R5 L6R6 L7R7Chainage(m)

Elevation(m)

Chainage(m)

Elevation(m)

Chainage(m)

Elevation(m)

Chainage(m)

Elevation(m)

0.00 99.99 0.00 100.20 0.00 100.271.50 99.86 3.60 99.86 3.70 99.8611.85 98.53 8.48 98.18 8.93 98.7822.20 97.39 13.36 98.19 14.16 98.5632.55 99.63 18.24 99.59 19.39 98.8342.90 99.57 21.60 99.86 23.60 99.8644.90 99.86 26.20 100.26 24.90 100.4652.50 100.36

Sedimentation in small damsDevelopment of a catchment characterisation and sediment yield prediction procedure

OD TN 120 Rev 0.0

����

Cross-sections Survey 2001L1R1 L2R2 L3R3 L4R4

Chainage(m)

Elevation(m)

Chainage(m)

Elevation(m)

Chainage(m)

Elevation(m)

Chainage(m)

Elevation(m)

0.00 101.26 0.00 101.92 0.00 101.05 0.00 100.3410.74 100.44 10.46 100.92 10.00 100.58 10.39 99.5221.49 99.81 20.92 100.56 20.00 100.11 12.46 99.2632.23 99.34 31.38 100.08 23.92 99.93 16.46 98.6034.38 99.26 41.83 99.63 26.30 99.26 20.01 98.1142.97 98.99 52.29 99.37 30.00 98.22 29.98 96.7253.72 98.53 54.59 99.34 40.00 97.54 40.84 99.1764.46 98.24 62.75 98.85 43.07 97.59 50.76 99.1275.20 97.67 73.21 98.30 44.69 97.08 59.06 99.3385.94 97.04 83.67 97.50 50.00 96.58 61.14 99.6696.69 97.19 88.50 96.01 60.00 98.06 71.53 99.70107.43 97.54 94.12 96.00 70.00 98.14 81.40 100.08118.17 98.27 100.04 97.78 77.40 98.44128.92 98.89 115.04 98.33 85.78 99.03134.29 99.35 125.50 99.00 99.35 97.26142.08 101.06 127.59 99.40 104.90 99.28

136.27 100.24 105.38 99.60110.00 99.72120.00 99.95127.90 100.10

L5R5 L6R6 L7R7Chainage(m)

Elevation(m)

Chainage(m)

Elevation(m)

Chainage(m)

Elevation(m)

Chainage(m)

Elevation(m)

0.14 99.99 0.00 100.19 0.00 100.267.38 99.29 5.72 99.31 8.27 99.3110.48 98.56 10.40 97.94 10.33 98.5423.79 97.39 13.73 98.63 20.66 99.0031.00 99.29 15.21 98.97 20.87 99.3041.34 99.35 15.57 99.13 24.90 100.4651.67 100.21 17.16 99.3152.60 100.35 20.79 99.78

26.20 100.26

Sedimentation in small damsDevelopment of a catchment characterisation and sediment yield prediction procedure

OD TN 120 Rev 0.0

����

Cross-sections Survey 2002L1R1 L2R2 L3R3 L4R4

Chainage(m)

Elevation(m)

Chainage(m)

Elevation(m)

Chainage(m)

Elevation(m)

Chainage(m)

Elevation(m)

18.14 100 39.59 100 0 101.08 2.83 10020.24 99.85 44.59 99.7 23.92 99.91 5.23 99.8525.24 99.62 49.59 99.6 28.69 98.9 10.23 99.5130.24 99.5 54.59 99.41 33.69 97.95 15.23 98.8135.24 99.28 59.59 99.21 38.69 97.46 20.23 98.0140.24 99.13 64.59 98.95 43.69 97.77 25.23 97.8745.24 98.93 69.59 98.45 48.69 96.52 30.23 96.8350.24 98.68 74.59 98.08 53.69 97.14 35.23 98.6755.24 98.49 79.59 97.55 58.69 98.05 40.23 99.1860.24 98.3 84.59 97.61 63.69 98.23 45.23 99.0865.24 98.08 89.59 96.51 68.69 98.25 50.23 99.1370.24 97.93 94.59 95.8 73.69 98.39 55.23 99.1775.24 97.48 99.59 97.91 78.69 98.67 60.23 99.680.24 97.08 104.59 97.91 85.96 99.04 65.23 99.7885.24 97.13 109.59 98.03 90.96 98.78 70.23 99.6890.24 96.89 114.59 98.2 98.88 97.3 75.23 99.895.24 97.22 119.59 98.46 100.96 98.33 78.03 100100.24 97.34 124.59 98.98 105.96 99.6105.24 97.49 128.79 100 110.96 99.75110.24 97.7 127.32 100.09115.24 98.1120.24 98.62125.24 98.78130.24 99.02135.24 99.79135.84 100

L5R5 L6R6 L7R7Chainage(m)

Elevation(m)

Chainage(m)

Elevation(m)

Chainage(m)

Elevation(m)

0 100 0.21 100.16 0 100.265 99.58 3.93 99.7 3.51 99.8110 98.81 6.36 98.98 8.51 98.8715 98.38 8.93 98.09 13.51 98.7320 97.69 13.93 98.45 18.51 99.2325 97.8 18.93 99.66 23.37 100.0429.43 98.5 24.8 100.4429.58 99.0936.42 99.6642.83 99.5347.03 100.14

Sedimentation in small damsDevelopment of a catchment characterisation and sediment yield prediction procedure

OD TN 120 Rev 0.0

����

Name: TinogonaLocation: Mwenezi (Zimbabwe)Full Supply Water Level: 100.00m

Location of survey beacons

Left bank point Right bank pointSectionName East (m) North (m) Elevation (m) East (m) North (m) Elevation

(m)'DAM' 0.00 0.00 100.00 0.00 222.00 100.00'L1R1' 12.13 -3.02 100.39 23.68 225.76 100.43'L2R2' 29.53 -21.11 100.15 66.98 208.51 100.29'TR_R' 0.00 0.00 100.00 0.00 0.00 100.00'L2R3' 29.53 -21.11 100.15 147.04 128.54 100.25'L3R4' 55.26 -32.09 99.93 192.45 56.81 100.79'L4R5' 82.60 -69.82 100.19 209.48 14.16 99.90'L5R6' 122.48 -132.70 99.87 223.91 -38.93 100.00'L6R7' 169.83 -187.49 99.67 267.85 -112.40 99.74'L6R8' 169.83 -187.49 99.67 267.20 -213.40 99.80'UPST' 109.33 -363.69 100.00 0.00 0.00 100.00'R3R2' 147.04 128.54 100.26 66.98 208.51 100.29'UPST' 350.00 200.00 100.1 350.00 200.00 100.00

Note:Elevation refers to local datum of 100.00 m at the spillway.Location refers to the left bank of the dam (0, 0).

Sedimentation in small damsDevelopment of a catchment characterisation and sediment yield prediction procedure

OD TN 120 Rev 0.0

����

Cross-sections Survey 1999L1R1 L2R2 L2R3 L3R4

Chainage(m)

Elevation(m)

Chainage(m)

Elevation(m)

Chainage(m)

Elevation(m)

Chainage(m)

Elevation(m)

0.00 100.40 0.00 100.15 0.00 100.15 0.00 99.937.60 100.48 63.00 97.83 19.50 99.34 13.10 99.8214.20 99.74 73.10 97.31 47.50 97.83 36.40 97.8382.70 98.27 83.20 95.44 57.75 97.33 46.69 97.22114.70 97.83 93.30 95.44 68.00 96.66 56.97 96.65124.67 97.22 103.40 95.86 78.25 95.75 67.26 96.13134.63 96.69 113.50 96.59 88.50 96.83 77.55 97.48144.60 96.25 123.59 96.53 98.75 96.63 87.83 97.59154.56 94.94 133.69 95.83 109.00 96.76 98.12 97.67164.53 95.18 143.79 95.78 119.25 96.80 108.20 97.83174.49 95.28 153.89 96.00 129.50 96.75 130.54 98.37184.46 95.83 163.99 95.62 139.75 97.16 140.58 98.75194.42 97.48 174.09 95.82 150.00 97.51 160.66 99.76200.70 97.83 184.19 95.01 160.25 97.82 163.50 100.79217.60 98.68 194.29 95.31 160.50 97.83220.70 100.43 204.39 97.25 190.50 100.25

209.00 97.83224.90 100.29

L4R5 L5R6 L6R7 L6R8Chainage(m)

Elevation(m)

Chainage(m)

Elevation(m)

Chainage(m)

Elevation(m)

Chainage(m)

Elevation(m)

0.00 100.20 0.00 99.87 0.00 99.67 0.00 99.6723.60 98.85 34.60 98.27 22.60 99.17 25.80 99.3338.60 97.83 43.80 97.83 34.90 98.97 48.20 98.8344.30 96.96 49.09 97.28 56.00 98.32 56.80 98.2449.99 96.11 54.38 96.84 76.10 98.25 59.70 97.8355.69 96.14 59.66 96.54 76.60 97.83 64.00 97.8361.38 97.05 64.95 97.27 80.10 96.93 71.80 98.4267.08 97.36 70.24 97.46 90.60 97.83 96.20 99.3172.78 97.46 75.53 97.60 93.60 98.19 100.50 99.8278.47 97.63 80.82 97.77 112.70 99.3484.17 97.72 81.80 97.83 124.60 99.7789.87 97.81 89.80 98.2193.10 97.83 108.80 98.81135.60 99.16 137.80 100.02153.10 99.90

Sedimentation in small damsDevelopment of a catchment characterisation and sediment yield prediction procedure

OD TN 120 Rev 0.0

����

Cross-sections Survey 1999 continuedR3R2

Chainage(m)

Elevation(m)

0.00 100.2610.00 98.9632.40 97.8342.84 96.5848.06 96.3458.50 95.7063.71 95.7174.15 95.7484.59 96.3395.03 97.25102.00 97.83105.80 98.46110.50 100.29

Cross-sections Survey 2000L1R1 L2R2 L2R3 L3R4

Chainage(m)

Elevation(m)

Chainage(m)

Elevation(m)

Chainage(m)

Elevation(m)

Chainage(m)

Elevation(m)

0.00 100.39 0.00 100.15 0.00 100.15 0.00 99.9328.50 99.19 24.00 99.19 23.00 99.19 11.98 99.8638.67 99.14 34.29 98.90 33.73 98.58 20.50 99.1948.84 98.80 44.58 98.87 44.46 98.09 30.86 98.2459.01 98.71 54.87 98.94 55.19 97.27 41.22 97.5469.18 98.71 65.16 98.09 65.92 96.67 51.58 96.8179.35 98.30 75.45 98.30 76.65 95.85 61.94 95.9989.52 98.23 85.74 95.84 87.38 96.83 72.30 97.2699.69 98.11 96.03 97.09 98.11 96.63 82.66 97.50109.86 98.03 106.32 97.07 108.84 96.52 93.02 97.59120.03 97.29 116.61 96.70 114.12 96.78 103.38 97.70130.20 97.07 126.90 96.58 124.85 96.68 113.74 97.88140.37 96.42 137.19 95.91 135.58 96.95 124.10 98.22150.54 96.03 147.48 95.91 146.31 97.24 134.46 98.54160.71 95.14 157.77 96.32 157.04 97.64 144.82 99.05170.88 95.29 168.06 95.49 167.77 98.29 148.00 99.19181.05 95.39 174.78 96.43 174.55 99.19 163.50 100.79191.22 96.49 180.60 94.99 190.00 100.25201.39 97.54 190.89 95.49211.56 98.36 201.18 97.08220.40 99.19 211.47 97.99221.07 100.43 219.96 99.19

224.96 100.29

Sedimentation in small damsDevelopment of a catchment characterisation and sediment yield prediction procedure

OD TN 120 Rev 0.0

����

Cross-sections Survey 2000L4R5 L5R6 L6R7 L6R8

Chainage(m)

Elevation(m)

Chainage(m)

Elevation(m)

Chainage(m)

Elevation(m)

Chainage(m)

Elevation(m)

0.00 100.19 0.00 99.87 0.00 99.67 0.00 99.6722.40 99.19 12.60 99.19 20.30 99.19 36.50 99.1932.77 98.42 23.12 98.71 30.94 98.98 46.94 98.9145.17 96.78 33.64 98.29 41.58 98.83 57.38 98.5353.51 96.44 44.16 97.82 52.22 98.38 67.82 98.0663.88 97.30 54.68 96.96 62.86 98.32 78.26 98.6474.25 97.52 65.20 97.14 73.50 98.20 88.70 99.0284.62 97.71 75.72 97.56 84.14 97.44 95.50 99.1994.99 97.85 86.24 97.99 94.78 98.35 102.00 99.80105.36 98.08 96.76 98.38 105.42 99.08115.73 98.35 107.28 98.60 108.00 99.19126.10 98.56 117.80 99.08 124.00 99.74136.47 98.99 120.90 99.19139.40 99.19 137.60 100.00153.00 99.90

R3R2Chainage(m)

Elevation(m)

0.00 100.2612.80 99.1913.33 98.5423.96 98.0834.59 97.2845.22 96.1955.85 94.8966.48 95.4577.11 95.5987.74 96.3598.37 97.36107.71 99.19110.44 100.29

Sedimentation in small damsDevelopment of a catchment characterisation and sediment yield prediction procedure

OD TN 120 Rev 0.0

����

Cross-sections Survey 2001L1R1 L2R2 L2R3 L3R4

Chainage(m)

Elevation(m)

Chainage(m)

Elevation(m)

Chainage(m)

Elevation(m)

Chainage(m)

Elevation(m)

0.00 100.39 0.00 100.15 0.00 100.15 0.00 99.9310.38 100.18 10.60 99.88 9.89 99.78 10.04 99.9220.76 99.40 21.20 99.40 19.79 99.43 20.08 99.2331.14 99.06 31.80 98.96 28.99 98.95 22.69 98.9441.52 99.07 33.07 98.95 29.68 98.89 30.12 98.0445.98 98.95 42.46 98.85 39.58 98.34 40.16 97.4751.98 98.75 53.00 99.02 49.47 97.54 50.21 97.1662.28 98.69 63.59 98.59 59.37 96.75 60.25 96.0772.65 98.62 74.19 98.57 69.26 96.57 70.29 95.9383.03 98.24 84.79 97.77 79.16 95.79 80.33 97.4193.41 98.29 95.39 97.39 89.05 96.74 90.37 97.52103.79 98.21 105.99 97.38 98.95 96.70 100.41 97.62114.17 97.88 116.59 97.04 108.84 96.69 110.45 97.81124.55 97.17 127.19 96.64 118.74 96.41 120.98 98.04134.93 96.72 137.79 96.04 138.53 96.73 130.54 98.37145.31 96.19 148.39 95.64 148.42 97.24 140.58 98.75155.69 95.56 158.99 95.89 158.32 97.49 143.79 98.94166.07 94.84 169.59 95.36 168.21 97.95 150.62 99.32176.45 95.21 180.18 95.47 178.11 98.95 160.66 99.76186.83 95.45 190.78 94.63 188.00 100.05 163.47 100.79197.21 97.08 201.38 95.64 190.28 100.25207.58 97.89 211.98 97.24217.96 98.82 222.58 98.24218.90 98.93 226.29 98.93221.07 100.43 232.65 100.29

L4R5 L5R6 L6R7 L6R8Chainage(m)

Elevation(m)

Chainage(m)

Elevation(m)

Chainage(m)

Elevation(m)

Chainage(m)

Elevation(m)

0.00 100.19 0.00 99.87 0.00 99.67 0.00 99.6710.39 99.65 10.80 99.28 10.33 99.37 10.28 99.4520.77 99.04 18.68 98.87 20.67 99.24 20.57 99.3922.74 98.93 21.60 98.90 31.00 98.98 30.85 99.2831.16 98.27 32.40 98.36 35.75 98.91 41.13 99.0541.54 97.55 43.20 97.95 41.33 98.66 46.27 98.9051.93 95.93 54.00 97.11 51.67 98.38 51.41 98.7262.31 97.11 64.80 97.32 62.00 98.39 61.70 97.8172.70 97.49 75.60 97.60 72.33 98.34 71.98 98.4883.09 97.71 86.40 98.06 82.66 97.48 82.26 98.9093.47 97.85 97.20 98.34 93.00 98.23 92.54 99.14103.86 98.13 108.00 98.75 102.30 98.91 100.77 99.80114.24 98.32 111.02 98.87 103.33 98.99124.63 98.62 118.80 99.11 113.66 99.47131.17 98.93 129.60 99.51 123.48 99.74135.01 99.09 138.13 100.00145.40 99.57152.15 99.90

Sedimentation in small damsDevelopment of a catchment characterisation and sediment yield prediction procedure

OD TN 120 Rev 0.0

����

Cross-sections Survey 2001 continuedR3R2

Chainage(m)

Elevation(m)

0.00 100.2610.09 99.9910.89 98.9320.17 98.3130.26 97.8940.34 96.8650.43 96.0060.51 95.5170.60 95.6180.68 95.9190.77 96.86100.86 97.79105.90 98.94113.16 100.29

Cross-sections Survey 2002L1R1 L2R2 L2R3 L3R4

Chainage(m)

Elevation(m)

Chainage(m)

Elevation(m)

Chainage(m)

Elevation(m)

Chainage(m)

Elevation(m)

0 100.39 0 100.15 0 100.15 0 99.9320 99.41 20 99.42 20 99.33 20 99.2940 99.1 39.82 98.93 40 98.42 32 98.2360 98.73 64.92 98.31 45.3 98.23 35.7 97.9280 98.33 70.8 98.14 48.1 97.83 40.7 97.63100 98.13 81.59 96.8 53.1 97.56 45.7 97.28108 98.23 86.59 96.67 58.1 97.37 50.7 96.95111.4 97.98 91.59 97.55 63.1 96.86 55.7 96.78116.4 97.7 96.59 97.69 68.1 96.77 60.7 96.15121.4 97.35 101.59 97.41 73.1 96.57 65.7 96.06126.4 97.17 106.59 97.27 78.1 95.84 70.7 97.23131.4 97.62 111.59 97.04 83.1 96.59 75.7 97.43136.4 96.68 116.59 96.85 88.1 96.9 80.7 97.55141.4 96.43 121.59 96.74 93.1 96.84 85.7 97.59146.4 96.15 126.59 96.56 98.1 96.78 90.7 97.62151.4 95.84 131.59 96.16 103.1 96.83 95.7 97.68156.4 94.98 136.59 96.06 108.1 96.8 100.7 97.72161.4 94.98 141.59 95.93 113.1 96.84 105.7 97.82166.4 95.3 146.59 95.97 118.1 96.87 110.7 97.93171.4 95.36 151.59 95.9 123.1 96.58 115.7 98.08176.4 95.36 156.59 95.75 128.1 96.85 120.7 98.15181.4 95.45 161.59 95.6 133.1 96.88 124.1 98.23186.4 96.01 166.59 95.58 138.1 97.17 163.5 99.96191.4 96.99 171.59 96.01 143.1 97.24196.4 97.42 176.59 95.62 148.1 97.88201.4 97.8 181.59 98.26 153.1 98.26206.4 98.16 186.59 98.5 158.1 98.5207.1 98.23 191.59 98.6 163.1 98.6229.1 100.47 196.59 98.84 166.9 99.71

Sedimentation in small damsDevelopment of a catchment characterisation and sediment yield prediction procedure

OD TN 120 Rev 0.0

����

Cross-sections Survey 2002 continuedL1R1 L2R2 L2R3 L3R4

Chainage(m)

Elevation(m)

Chainage(m)

Elevation(m)

Chainage(m)

Elevation(m)

Chainage(m)

Elevation(m)

201.59 99.16 190.3 100.26206.59 99.34216.59 99.62263.99 100.29

L4R5 L5R6 L6R7 L6R8Chainage(m)

Elevation(m)

Chainage(m)

Elevation(m)

Chainage(m)

Elevation(m)

Chainage(m)

Elevation(m)

0 100.19 0 99.87 0 99.67 0 99.6710.39 99.65 20 98.83 20 99.21 10 99.4620.77 99.04 36.4 98.23 40 98.73 20 99.422.74 98.93 41.4 98 64.8 98.23 30 99.331.16 98.27 46.4 97.74 66.1 98 40 99.0841.54 97.55 51.4 97.2 71.1 97.76 50 98.8151.93 95.93 59.38 96.56 76.1 97.38 55 98.6462.31 97.11 61.4 96.85 81.1 97.54 60 97.9172.7 97.49 66.4 97.39 86.1 97.95 65 98.0283.09 97.71 71.4 97.58 88.3 98.23 70 98.3693.47 97.85 76.4 97.69 123.5 99.76 80 98.81103.86 98.13 81.4 97.87 90 99.02114.24 98.32 86.4 98.13 100.8 99.82124.63 98.62 88.9 98.23131.17 98.93 138.1 100.02135.01 99.09145.4 99.57152.15 99.9

R3R2Chainage(m)

Elevation(m)

0 100.2619 98.2320.8 97.9425.8 97.5730.8 97.1235.8 96.5740.8 96.1845.8 95.9250.8 95.8455.8 95.7960.8 95.7865.8 95.6370.8 96.1175.8 96.4980.8 96.8485.8 97.4890.8 97.8595.8 98.1598.8 98.23113.2 100.26

Sedimentation in small damsDevelopment of a catchment characterisation and sediment yield prediction procedure

OD TN 120 Rev 0.0

����

Annex 2b Kiteto Dams Survey ResultsName: NamelokLocation: Kiteto (Tanzania)Full Supply Water Level: 1488.50 masl

Location of survey beacons

Left bank point Right bank pointSectionName East (m) North (m) Elevation (m) East (m) North (m) Elevation (m)'DAM 229020 9399465 1448.50 228950 9399100 1448.50'LcRc' 229000 9399462 1448.50 228915 9399085 1448.50'LdRd' 228935 9399559 1448.50 228899 9399080 1448.50'LeRe' 228878 9399590 1448.50 228868 9399100 1448.50'LfRf' 228782 9399510 1448.50 228809 9399140 1448.50'LhRh' 228629 9399460 1448.50 228722 9399170 1448.50'LjRj' 228500 9399440 1448.50 228640 9399180 1448.50'LlRl' 228394 9399405 1448.50 228515 9399180 1448.50'LoRo' 228292 9399347 1448.50 228364 9399150 1448.50'LpRp' 228225 9399268 1448.50 228311 9399150 1448.50'UPST' 228220 9399205 1448.50 228220 9399205 1448.50

Note: Elevation refers to sea level.Location refers to UTM grid zone 37.

Sedimentation in small damsDevelopment of a catchment characterisation and sediment yield prediction procedure

OD TN 120 Rev 0.0

����

Cross-sections Survey 1954LcRc LdRd LeRe LfRf

Chainage(m)

Elevation(m)

Chainage(m)

Elevation(m)

Chainage(m)

Elevation(m)

Chainage(m)

Elevation(m)

36.00 1484.50 36.00 1486.30 6.00 1486.00 28.00 1487.0043.00 1484.90 38.00 1486.00 28.00 1484.90 35.00 1486.8066.00 1483.70 63.00 1484.30 58.00 1483.00 69.00 1485.0096.00 1482.00 96.00 1482.20 82.00 1481.90 91.00 1483.20116.00 1480.80 123.00 1480.90 105.00 1481.30 142.00 1481.80140.00 1480.20 163.00 1480.40 160.00 1481.20 178.00 1481.80190.00 1480.30 210.00 1481.20 184.00 1481.70 234.00 1482.80236.00 1481.80 236.00 1482.00 220.00 1482.30 272.00 1483.90290.00 1483.50 276.00 1482.90 286.00 1484.40 318.00 1485.70346.00 1485.50 316.00 1483.90 340.00 1485.70384.00 1486.80 350.00 1485.00 370.00 1486.80

392.00 1486.20416.00 1486.80

LhRh LjRj LlRl LoRoChainage(m)

Elevation(m)

Chainage(m)

Elevation(m)

Chainage(m)

Elevation(m)

Chainage(m)

Elevation(m)

28.00 1486.80 12.00 1486.90 12.00 1487.70 28.00 1488.2040.00 1486.00 33.00 1486.10 40.00 1486.10 37.50 1487.8064.00 1484.50 59.00 1484.80 59.00 1485.40 53.00 1487.2091.00 1483.30 85.00 1483.70 91.00 1484.70 73.00 1486.50124.00 1482.80 114.00 1483.60 134.00 1484.60 96.00 1485.90158.00 1482.90 152.00 1483.60 165.00 1484.80 145.00 1486.30214.00 1484.20 202.00 1484.70 209.00 1485.90 194.00 1486.80254.00 1485.80 229.00 1485.80 210.00 1487.50268.00 1486.30

LpRpChainage(m)

Elevation(m)

36.00 1488.0065.00 1487.2072.00 1487.2080.00 1487.10100.00 1487.10111.00 1487.20127.00 1487.30147.00 1487.50201.00 1488.20

Sedimentation in small damsDevelopment of a catchment characterisation and sediment yield prediction procedure

OD TN 120 Rev 0.0

����

Cross-sections Survey 2001LcRc LdRd LeRe LfRf

Chainage(m)

Elevation(m)

Chainage(m)

Elevation(m)

Chainage(m)

Elevation(m)

Chainage(m)

Elevation(m)

0.00 1488.50 0.00 1488.50 0.00 1488.50 0.00 1488.5020.00 1488.00 20.00 1488.00 16.00 1488.00 12.00 1488.0036.00 1487.24 36.00 1486.94 28.00 1485.23 28.00 1487.3643.00 1486.76 38.00 1486.76 58.00 1483.47 35.00 1486.7766.00 1485.42 63.00 1485.07 82.00 1482.81 69.00 1485.0296.00 1484.16 96.00 1483.30 105.00 1482.52 91.00 1483.87116.00 1484.46 123.00 1482.41 160.00 1482.51 142.00 1482.76140.00 1484.06 163.00 1482.21 184.00 1482.29 178.00 1482.76190.00 1485.14 210.00 1482.41 220.00 1482.69 234.00 1483.93236.00 1485.24 236.00 1482.41 286.00 1484.29 272.00 1484.77290.00 1485.08 276.00 1482.76 340.00 1486.06 318.00 1486.76346.00 1485.58 316.00 1483.22 370.00 1486.75 350.00 1488.00384.00 1486.73 350.00 1483.51 418.00 1488.00 366.00 1488.50435.00 1488.50 392.00 1485.07 446.00 1488.50

416.00 1486.71432.00 1488.50

LhRh LjRj LlRl LoRoChainage(m)

Elevation(m)

Chainage(m)

Elevation(m)

Chainage(m)

Elevation(m)

Chainage(m)

Elevation(m)

0.00 1488.50 0.00 1488.50 0.00 1488.50 0.00 1488.5012.00 1488.00 12.00 1488.03 12.00 1488.33 16.00 1488.0028.00 1487.38 33.00 1486.85 40.00 1486.82 28.00 1487.2240.00 1486.79 59.00 1485.51 59.00 1486.18 37.50 1486.7964.00 1485.49 85.00 1484.56 91.00 1485.43 53.00 1486.4491.00 1484.23 114.00 1484.56 134.00 1485.38 73.00 1486.75124.00 1483.61 152.00 1484.45 165.00 1485.75 96.00 1487.20158.00 1483.97 202.00 1485.94 209.00 1486.84 145.00 1487.33214.00 1484.73 229.00 1486.87 237.00 1488.00 194.00 1488.02254.00 1486.16 257.00 1488.00 253.00 1488.50 210.00 1488.82268.00 1486.75 277.00 1488.50292.00 1488.00304.00 1488.50

LpRpChainage(m)

Elevation(m)

0.00 1488.5036.00 1487.9265.00 1487.3472.00 1486.7680.00 1487.09100.00 1487.54111.00 1487.24127.00 1487.69147.00 1488.27201.00 1488.90

Sedimentation in small damsDevelopment of a catchment characterisation and sediment yield prediction procedure

OD TN 120 Rev 0.0

����

Name: NjoroLocation: Kiteto (Tanzania)Full Supply Water Level: 1501.14 masl

Location of survey beacons

Left bank point Right bank pointSectionName East (m) North (m) Elevation (m) East (m) North (m) Elevation (m)'DAM 217550 9421350 1501.14 217618 9421613 1501.14'LbRb' 217560 9421328 1501.24 217641 9421615 1501.14'LgRg' 217560 9421328 1502.13 217725 9421568 1501.14'LiRi' 217588 9421310 1501.14 217750 9421535 1501.14'LkRk' 217625 9421288 1501.16 217775 9421502 1501.14

'LmRm' 217663 9421273 1501.70 217818 9421493 1501.14'LoRo' 217690 9421245 1501.14 217817 9421421 1501.14'LqRq' 217725 9421229 1501.19 217840 9421386 1501.14'LsRs' 217768 9421215 1501.31 217866 9421361 1501.53'UPST' 217945 9421198 1501.14 217945 9421198 1501.14

Note:Elevation refers to sea level.Location refers to UTM grid zone 37.

Sedimentation in small damsDevelopment of a catchment characterisation and sediment yield prediction procedure

OD TN 120 Rev 0.0

����

Cross-sections Survey 1976LbRb LgRg LiRi LkRk

Chainage(m)

Elevation(m)

Chainage(m)

Elevation(m)

Chainage(m)

Elevation(m)

Chainage(m)

Elevation(m)

0.00 1501.24 0.00 1502.13 0.00 1501.14 0.00 1501.1620.00 1499.91 20.00 1499.88 94.00 1495.37 80.00 1496.7240.00 1498.58 40.00 1498.32 104.00 1495.25 90.00 1496.15110.00 1495.38 80.00 1496.01 114.00 1494.75 100.00 1495.66120.00 1495.26 90.00 1495.59 124.00 1494.74 110.00 1495.83130.00 1494.42 100.00 1495.20 134.00 1495.25 225.00 1501.14140.00 1493.70 110.00 1494.78 144.00 1495.84150.00 1493.89 120.00 1493.81 214.00 1500.25160.00 1494.31 130.00 1493.91 229.00 1501.14170.00 1494.68 140.00 1493.95180.00 1495.88 150.00 1494.82190.00 1496.32 160.00 1495.56280.00 1501.14 170.00 1496.45

240.00 1501.14

LmRm LoRo LqRq LsRsChainage(m)

Elevation(m)

Chainage(m)

Elevation(m)

Chainage(m)

Elevation(m)

Chainage(m)

Elevation(m)

0.00 1501.70 0.00 1501.14 0.00 1501.19 0.00 1501.3165.00 1497.15 2.00 1500.99 10.00 1500.48 26.00 1499.4475.00 1496.79 22.00 1499.74 30.00 1499.05 31.00 1498.8485.00 1497.48 34.00 1498.26 36.00 1498.61 33.00 1499.0595.00 1497.28 42.00 1497.97 45.00 1498.77 57.00 1499.17105.00 1497.25 52.00 1498.20 69.00 1499.34 80.00 1499.91115.00 1497.23 112.00 1498.93 84.00 1499.63 106.00 1500.26120.00 1497.32 132.00 1499.31 108.00 1499.69 133.00 1500.63135.00 1498.01 152.00 1499.74 143.00 1500.12 163.00 1501.53155.00 1498.52 172.00 1500.06 163.00 1500.76175.00 1499.55 192.00 1501.00 175.00 1501.14195.00 1501.05 194.00 1501.14215.00 1500.38230.00 1501.14

Sedimentation in small damsDevelopment of a catchment characterisation and sediment yield prediction procedure

OD TN 120 Rev 0.0

����

Cross-sections Survey 2001LbRb LgRg LiRi LkRk

Chainage(m)

Elevation(m)

Chainage(m)

Elevation(m)

Chainage(m)

Elevation(m)

Chainage(m)

Elevation(m)

0.00 1501.24 0.00 1502.13 0.00 1501.14 0.00 1501.1620.00 1499.91 20.00 1499.88 4.00 1500.96 20.00 1500.1640.00 1498.58 40.00 1498.32 24.00 1500.04 40.00 1499.1460.00 1497.86 60.00 1497.31 44.00 1499.16 60.00 1498.0480.00 1497.31 80.00 1496.51 64.00 1497.69 80.00 1497.22100.00 1496.92 90.00 1496.39 84.00 1496.73 90.00 1497.15120.00 1496.66 100.00 1496.45 88.00 1496.52 100.00 1496.96140.00 1496.66 110.00 1496.41 94.00 1496.37 110.00 1497.03160.00 1497.16 120.00 1496.41 104.00 1496.55 120.00 1497.19180.00 1497.92 130.00 1496.41 114.00 1496.55 130.00 1497.40200.00 1498.29 140.00 1496.39 124.00 1496.54 150.00 1498.24220.00 1498.79 150.00 1496.42 134.00 1496.55 170.00 1499.07240.00 1499.35 160.00 1496.36 144.00 1496.44 190.00 1499.95260.00 1500.11 170.00 1496.53 148.00 1496.51 210.00 1500.68280.00 1501.14 180.00 1497.08 154.00 1496.84 225.00 1501.14

200.00 1498.43 174.00 1498.11240.00 1501.14 194.00 1499.40

214.00 1500.25229.00 1501.14

LmRm LoRo LqRq LsRsChainage(m)

Elevation(m)

Chainage(m)

Elevation(m)

Chainage(m)

Elevation(m)

Chainage(m)

Elevation(m)

0.00 1501.70 0.00 1501.14 0.00 1501.19 0.00 1501.3115.00 1500.65 2.00 1500.99 10.00 1500.48 26.00 1499.4435.00 1499.38 22.00 1499.74 30.00 1499.05 31.00 1498.8455.00 1497.90 34.00 1498.26 36.00 1498.61 33.00 1499.0565.00 1497.85 42.00 1498.27 45.00 1498.77 57.00 1499.1775.00 1497.59 52.00 1498.50 69.00 1499.34 80.00 1499.9179.00 1497.83 62.00 1498.76 84.00 1499.63 106.00 1500.2685.00 1497.98 72.00 1499.08 108.00 1499.69 133.00 1500.6395.00 1497.78 92.00 1499.22 143.00 1500.12 163.00 1501.53105.00 1497.75 112.00 1498.93 163.00 1500.76115.00 1497.73 132.00 1499.31 175.00 1501.14120.00 1497.82 152.00 1499.74135.00 1498.51 172.00 1500.06155.00 1499.02 192.00 1501.00175.00 1499.55 194.00 1501.14195.00 1501.05215.00 1500.38230.00 1501.14

Sedimentation in small damsDevelopment of a catchment characterisation and sediment yield prediction procedure

OD TN 120 Rev 0.0

����

Annex 3 Catchment CharacterisationA3.1 Introduction

As part of the procedure to estimate sediment yields, a catchment characterisationprocedure was developed for small dam sites, appropriate for application in SouthernAfrica. The system was developed with collaborators in Masvingo Province,Zimbabwe, and on the Masai Steppe in Tanzania. It allows an assessment of theerosion hazard in a catchment, based on a visual inspection.

A3.2 Catchment Characterisation

The ability to carry out a qualitative assessment of the erosion status of a catchmentusing visual indicators can provide a powerful assessment tool. Advantages of theapproach include:

It is based on readily observable features;

It is straight-forward and simple to apply by non-specialist staff;

It does not require specialist skills or equipment;

It requires minimal time and resource input – a typical catchment can be characterisedin a day.

However there are some disadvantages. Results from a catchment characterisationprocedure provide an assessment of the erosion status of a catchment at a specifictime. Catchment conditions vary over time, and the results cannot in theory be used topredict either past or future rates of soil erosion. Soil erosion rates tend to vary inresponse to climatic variations and changes in land use. For example an assessmentmay be carried out following a series of wet years when vegetation will be betterestablished and erosion rates are smaller than the long-term average. Conversely aftera series of dry years the catchment may be badly degraded from overgrazing and soilerosion rates will be much larger than the long-term average. It is thus necessary to beaware of temporal variations in conditions, and bear these in mind whilst carrying outassessments.

Initially the assessments were based on evaluating the seven key catchmentcharacteristics listed in table A3.1. Four classes were identified for each characteristic:extreme, high, normal and low, with a text description and numerical value assigned toeach class. When a catchment falls between two classes, or needs to be split into twoor more representative areas due to distinct changes in topography or land use,intermediate values are assigned. These are derived by weighting each factor by theproportion of the catchment area that they represent.

All the catchments included in the study were characterised using the form shown intable A3.1. It was realised that there is an element of double counting in the factorslisted in the table. Most will for example contribute to “signs of active erosion”. Thesignificance of individual factors was evaluated later during the development of thepredictive equation, when measured sediment yields were available. This resulted insome factors being discarded and others being replaced with quantitative informationthat could be readily obtained from 1:50000 mapping.

The qualitative factors adopted for the final form of the characterisation procedure are:

Sedimentation in small damsDevelopment of a catchment characterisation and sediment yield prediction procedure

OD TN 120 Rev 0.0

����

Soil Type and Surface Drainage (STD)Although the assessment is carried out at the driest time of the year, surface infiltrationcan be gauged by noting soil surface texture (coarse, medium or fine) together withinformation from local farmers on whether there is extensive ponding on the soilsurface after heavy rains.

Vegetation Cover over the Whole Catchment (VC)The extent of annual cropping and the nature and quality of the grassland and anywoodland/forests in the catchment should be assessed separately. For example,although less than 20% of a catchment may be cultivated with annual crops givingexcellent cover, at the same time less than 30% may be under good grass or protectedforest cover giving only fair cover.

Signs of Active Soil Erosion (SASE)Obvious signs of active erosion should be recorded, particularly the presence orabsence of actively eroding gullies (dongas) draining directly into the dam and/orwatercourses, and/or active undercutting of riverbanks along main watercourses.

The qualitative factor for relief in table A3.1 was replaced with the slope of the mainstem river form the catchment boundary to the location of the dam. This is derivedfrom a map and is not evaluated during the catchment scoring exercise. None of theother factors provided significant correlations with observed sediment yields, and theirinclusion in the equation described in chapter 4 did not improve its predictive ability.They were thus not included in the recommended version of the characterisationprocedure, which is summarised in table A3.2. The scoring system for erosion statuswas revised during the calibration described in chapter 4 so that: Low = 5, Normal; =10, High = 20, Extreme = 40.

The results of the catchment characterisations and the quantitative factors used in thedevelopment of the sediment yield predictor are listed in table A3.3.

Sedimentation in small damsDevelopment of a catchment characterisation and sediment yield prediction procedure

OD TN 120 Rev 0.0

����

Table A.3.1 Preliminary catchment characterisation form

Dam Site: Date:

Observer:

Factor Extreme High Normal LowRelief Steep: average

slope >30%40 Hilly (10-30%),

hills cover >50% ofcatchment

30 Rolling (5-10%),hills cover <50% ofcatchment

20 Relatively flatland(0-5%)

10

Soil Type &Drainage

No effective soilcover; eitherrock or thinshallow soils

40 Poorly drainedcompacted soils;much ponding onsoil surface afterheavy rains

30 Moderately welldrainedmedium-texturedsoils; some pondingon soil surface afterheavy rain

20 Well drainedcoarse-textured soils;little pondingon soil surfaceafter heavyrain

10

Fair cover:>50% of catchmentis cultivated withannual crops;

15 Good cover:20-50% of catchmentis cultivated withannual crops;

10 Excellentcover:<20% ofcatchment iscultivated withannual crops;

5VegetationConditionover WholeCatchment

Little effectiveplant cover,ground bare orvery sparsecover over 80%of catchment

40

<30% of catchmentis under good grasscover or protectedforest cover

15 30-60% of catchmentis under goodgrassland orprotected forestcover

10 >60% ofcatchment isunderwell-maintained grasslandand/orprotectedforest cover

5

Signs ofActive SoilErosion

Many activelyeroding gullies(dongas)draining directlyinto dam and/orwatercourses;activeundercutting ofriverbanks alongmainwatercourses

80 Some activelyeroding gullies(dongas) drainingdirectly into damand/orwatercourses;moderateundercutting ofriverbanks alongmain watercourses

60 Few actively erodinggullies (dongas)draining directly intodam and/orwatercourses; littleundercutting ofriverbanks alongmain watercourses

20 No activelyeroding gullies(dongas)drainingdirectly intodam and/orwatercourses;noundercuttingof riverbanksalong mainwatercourses

0

Poor grasslandalong riverbank

15 Moderately wellprotected grasslandalong riverbank

10 Well protectedgrasslandalongriverbank

5VegetationConditionAlongWatercourses

Bare soil; verylittle vegetationcover

40

Very few or notrees alongriverbank

15 Some trees alongriverbank

10 Many treesalongriverbank

5

SurfaceWaterStorage inCatchment(trappingsediment)

Negligible; nopools inwatercourses,no marshes ordambos (vleis)

40 Low; few pools inwatercourses, fewmarshes or dambos(vleis)

30 Medium; some poolsin watercourses,some marshes ordambos (vleis)

20 High;extensivepools inwatercourses,extensivemarshes ordambos (vleis)

10

VillagePopulationDensity

Denselypopulated

40 Moderately denselypopulated

30 Normal/averagepopulation density

20 Sparselypopulated

10

Sedimentation in small damsDevelopment of a catchment characterisation and sediment yield prediction procedure

OD TN 120 Rev 0.0

����

Table A.3.2 Revised catchment characterisation form

Dam Site: Date:

Observer:

Factor Extreme High Normal LowSoilType &Drainage

Noeffectivesoil cover;either rockor thinshallowsoils

40 Poorly drainedcompactedsoils; muchponding on soilsurface afterheavy rains

30 Moderatelywell drainedmedium-textured soils;some pondingon soilsurface afterheavy rain

20 Well drainedcoarse-texturedsoils;little ponding onsoil surface afterheavy rain

10

Fair cover:>50% ofcatchment iscultivated withannual crops;

15 Good cover:20-50% ofcatchment iscultivatedwith annualcrops;

10 Excellent cover:<20% ofcatchment iscultivated withannual crops;

5VegetationCondition overWholeCatchment

Littleeffectiveplant cover,groundbare orvery sparsecover over80% ofcatchment

40

<30% ofcatchment isunder goodgrass cover orprotected forestcover

15 30-60% ofcatchment isunder goodgrassland orprotectedforest cover

10 >60% ofcatchment is underwell-maintainedgrassland and/orprotected forestcover

5

Signs ofActiveSoilErosion

Manyactivelyerodinggullies(dongas)drainingdirectlyinto damand/orwatercourses; activeundercutting ofriverbanksalong mainwatercourses

40 Some activelyeroding gullies(dongas)drainingdirectly intodam and/orwatercourses;moderateundercutting ofriverbanksalong mainwatercourses

20 Few activelyerodinggullies(dongas)drainingdirectly intodam and/orwatercourses;littleundercuttingof riverbanksalong mainwatercourses

10 No activelyeroding gullies(dongas) drainingdirectly into damand/orwatercourses; noundercutting ofriverbanks alongmain watercourses

5

Sedimentation in small damsDevelopment of a catchment characterisation and sediment yield prediction procedure

OD TN 120 Rev 0.0

����

Table A3.3 Catchment characterisations of study sites in Zimbabwe and Tanzania

Catchmentname

Area

km2

MeanAnnualRainfall

mm

Slope Erosionstatus

Score 1

Soil typeand

drainageScore

Veg.Cover

Score

ObservedSediment

yield(t/km2/y)

Chengwe 1.6 655 0.017 5 20 20 269Murambi 1.7 747 0.016 10 20 30 370Chihava 2 2.8 614 0.091 40 20 20 1823Gari 3.5 568 0.051 10 20 30 243Tinogona 5.3 568 0.013 20 20 30 858Mutangi 6.6 568 0.011 20 30 25 406Msalatu 8.5 600 0.030 29 20 20 736Ngondo 8.8 614 0.093 20 20 30 657Sekenende 9.1 655 0.013 5 20 20 123Nyimai 10.5 630 0.017 10 20 20 212Jechera 17.0 747 0.012 20 20 30 154Matumbulu 18.0 500 0.013 23 20 25 588Njoro 27.0 550 0.006 10 24 23.7 157Namelok 40.0 550 0.006 9 21.3 10 122Dove 55.1 625 0.018 15 20 31.25 152Takavarasha 541.0 650 0.009 33 20 27.7 330Mwisanga 18.0 891 0.090 38 30 35 3392

Notes:1 The scores for this factor were converted from the original scoring system to a revised ranking basedon a geometric progression: low = 5, Normal; = 10, High = 20, Extreme = 40 during the calibrationexercise described in chapter 4.2 In this catchment, erosion and sedimentation rates appear to have been much higher in the past thanwhen the characterisation was carried out. Much of the agricultural land has now been abandoned, andleft to grazing. At the same time the stocking density appears also to have declined. Many of thepreviously actively eroding gullies have largely stabilised either naturally or by placing brushwood andstones within the gullies. Scores from the original characterisation were adjusted to reflect this.

Sedimentation in small damsDevelopment of a catchment characterisation and sediment yield prediction procedure

OD TN 120 Rev 0.0

����


Recommended