46
Scenario Report 2040 Network Development Plan 2040 Electrical Energy Grid Version 1.0 - 2nd February 2018
Scenario Report 2040 Network Development Plan 2040
Electrical Energy Grid
Version 1.0 - 2nd February 2018

Asset Management Grid Planning and Calculation Mike Delbrassinne Creos Luxembourg S.A. T +(352) 2624-1 2, rue Thomas Edison F +(352) 2624-5100 L-1445 Strassen [email protected] Postal adress: creos.net L-2084 Luxembourg RC Luxembourg B 4513 / TVA LU 10320554

1
Table of contents
Foreword page 2
Political framework and considerations page 3
Retrospective page 4
Retrospective of the electricity demand and sectorial breakdown page 4
Retrospective of the peak power demand page 8
Approach for the future electricity demand and the related peak power
projections page 10
Forecast of the future electricity need and peak power demand (p.1) page 13
Ordinary load page 13
Extraordinary loads page 16
Transportation operated by electricity / E-mobility page 16
Data Centres with high energy needs page 23
Forecast of the future electricity need and peak power demand (p.2) page 28
Ordinary & Extraordinary loads page 28
Electrical energy generation and renewables energies page 30
Projection curves page 39
Summary and Recommendations page 43

2
Foreword
The aim of all transmission and distribution system operator is to operate, maintain and
develop an efficient electricity distribution system, in order to secure the customer’s
availability of power.
The planning of a sustainable, future-proof electrical infrastructure becomes more and more
challenging due to the uncertainties of future economic, social and environmental
developments.
In addition to higher electrical energy consumptions, the electrical grids of tomorrow will
strongly be influenced by the desired decarbonisation process in the European Union. In
order to stay in line with the EU-targets of a reduction of greenhouse gas emissions, an
expansion of the use of renewable energies, and an improvement of the energy efficiency,
the electrical grids must be adapted consequently. The transition to a post-carbon society
will bring huge changes in the economic/industry, mobility/transport and domestic sectors,
and will have a direct influence on the electrical energy needs.
The transformation of Luxembourg’s economy and society has already begun. The heavy
industry is on the decline, making way for a smaller, specialized, energy-efficient industry
and a shift occurs towards services like logistics, e-commerce and electronic data storage
and management. Heating and mobility will experience strong shifts towards electrification.
Construction regulations for energy efficient buildings are in place and have to be applied,
and the sales of electric vehicles or plug-in hybrid vehicles are rising.
The current trend is that the increase of the electricity consumption will happen more faster
than the shift towards a much higher percentage of electricity generation from renewable
energy sources, thus intensifying the need for a strong electrical transport and distribution
grid.
The growing digitalization in our society will impact the energy grids of tomorrow. The
evolution of the electrical energy grids, which have to fulfil consumption needs and
decentralized generation demands, will strongly be influenced by the political and regulatory
framework and the according incentive programs.
Considering the most recent developments together with the appearance of new projects,
and in order to prepare for coming needs, we prepared new forecasts for the future electrical
peak power demand of Luxembourg.
This report provides our outlook on a possible future peak power demand on the electrical
high voltage grid of Creos Luxembourg as seen today.

3
Political framework and considerations
In addition to the economic development, European and national environmental objectives
may be significant for the projection of the electricity needs.
In accordance with the resolutions of the climate conference in Paris in 2015 and in
agreement with the EU energy targets for 2030 (European Council on 23th and 24th of
October 2014), the following goals are provided:
commitment to continue reducing greenhouse gas emissions, setting a reduction
target of 40% by 2030 relative to 1990 levels
a renewable energy target of at least 27% of energy consumption
an improved energy efficiency of at least 27%
The European Council noted the fundamental importance of a fully functioning and
connected internal energy market, and therefore supports all measures in order to ensure
the achievement of a minimum target of 10% of existing electricity interconnections, no later
than 2020, with the objective of arriving at a 15% target by 2030.
According to the EU 2011 White paper ‘Roadmap to a Single European Transport Area’, the
transport sector has to contribute to the EU climate engagements by reaching a target of
60% emission reduction until 2050. To reach this target, the following goals have been set:
50% less ‘conventionally-fuelled’ cars in urban transport by 2030
achieve essentially CO2-free city logistics in major urban centres by 2030
complete phase out of ‘conventionally-fuelled’ cars in cities by 2050
shift of 30% of the road freight to rail or waterborne transport by 2030
shift of 50% of the road freight to rail or waterborne transport by 2050
The future form of the individual inland and cross-border mobility and of the public transport
will therefore influence the electrical energy needs of this sector decisively.
Recently, a strategy study, under the supervision of Jeremy Rifkin, has been elaborated by
cross-disciplinary working groups with the goal to achieve the transition of the current society
model of the Grand-Duchy of Luxembourg to a more sustainable, smart society, with an
optimized resource and energy efficiency, and with a switch to renewable energies and e-
mobility.
Renovations in the building sector could possibly imply more electricity needs. Fossil fuel
sources used for heating could be replaced by heat pumps and / or direct water heating. Low
energy houses or passive buildings could decrease or negate that effect. Positive energy
buildings could generate their needs locally with solar systems and inject the surplus of
electricity in the low-voltage grid at the disposal of others. Consumers could become more
and more ‘producer – consumers’, prosumers. The Rifkin study foresees a possible
future share between 50 and 70 percent of domestic electricity self-generation from
renewable energy sources in Luxembourg by the year 2050.

4
Retrospective
Retrospective of the electricity demand and sectorial breakdown
The total electricity consumption and the per capita demand of the Grand-Duchy of
Luxembourg have decreased from 2010 to 2015, with only a slight increase during last year.
Referring to this, the most recent available data from Statec has been considered:
Electricity tot. Lux. 2010 2011 2012 2013 2014 2015 2016
GWh (losses incl.) 6714 6633 6375 6328 6302 6319 6522
Per capita (kWh/cap) 13373 12946 12145 11783 11464 11224 11319
Source: Statec & ILR
Source: Statec & Creos Luxembourg
This reduced consumption in 2010 to 2015 was the result of energy saving measures
throughout the industry, a decline of this sector and a weaker economic activity, though
there has been a slight recovery in 2016. An overall increasing energy efficiency can be
discerned in the decreasing consumption figures per capita.
Source: Statec & ILR
0
1000
2000
3000
4000
5000
6000
7000
2010 2011 2012 2013 2014 2015 2016
Total electricity demand [GWh]
Creos not Creos
5000
7500
10000
12500
15000
2010 2011 2012 2013 2014 2015 2016
per capita [kWh/capita]
0
500
1000
1500
2000
2500
3000
3500
4000
2010 2011 2012 2013 2014 2015 2016
Electricity demand per sector / Industry [GWh]
Industry

5
0
200
400
600
800
1000
1200
1400
1600
1800
2000
2010 2011 2012 2013 2014 2015 2016
Electricity demand per sector / Industry [GWh]
Industry Not-Creos Industry Creos
decline due to economic crisis
The decrease of the electricity demand of the metal industry, which is not connected to the
Creos grid, was more pronounced as that of the lighter, mixed industry connected to the
Creos grid. The demand of the tertiary sector was quite stable and that of the households
mostly rose during the past few years.
Source: Statec & ILR * not included: el. transport, agriculture & losses
0
200
400
600
800
1000
1200
2010 2011 2012 2013 2014 2015 2016
Electricity demand per sector / Residential [GWh]
Residential
0
500
1000
1500
2000
2500
2010 2011 2012 2013 2014 2015 2016
Electricity demand per sector / Tertiary [GWh]
Tertiary
recovery

6
Source: Statec & ILR
The general trend towards a higher growth of the residential sector can easily be identified
when you look at the relative numbers in the sectoral breakdown. The tertiary sector will
surely grow too, but more moderately. The industry share is decreasing accordingly, but
stays the biggest component of the total electricity need of Luxembourg.
2,0%
52,4% 29,2%
2,3%
13,5%
0,5%
Sectorial breakdown of the electricity consumption 2016
Losses Industry Tertiary Transport (el) Residential Agriculture
1,8%
54,0% 29,7%
1,8%
12,1% 0,6%
Sectorial breakdown of the electricity consumption 2010
Losses Industry Tertiary Transport (el) Residential Agriculture

7
In total, during the last few years, thlight decrease of the demand of the industry sector
connected to the Creos grid has been compensated by the growth of the demand by the
residential and the tertiary sector.
Looking at the years 2010-2015, you could conclude that the total demand of electricity is
stagnating or only slightly increasing.
Source: Creos Luxembourg
However, by enlarging the period of review, the steady growth of the total electricity demand
becomes more apparent.
Source: Creos Luxembourg
This shows that, long-term projections can have temporary opposite trends, which could be
misleading. Only a long-term review of a projection can really confirm the assumptions
made.
4.877 4.888 4.853 4.857 4.833 4.919 5.048
0
1000
2000
3000
4000
5000
6000
2010 2011 2012 2013 2014 2015 2016
Electricity demand on Creos grid (GWh)
0
1000
2000
3000
4000
5000
6000
2006 2007 2008 2009 2010 2011 2012 2013 2014 2015 2016
Electricity demand on Creos grid (GWh)

8
Retrospective of the peak power demand
The most important value for the grid development is the peak power demand. It has risen
constantly during the last four years and has made a disquieting leap in 2017, which was
mostly caused by a temporary switch of a part of the Sotel load on the Creos grid:
Source: Creos Luxembourg
The detailed decomposition of the peak power can be interesting for further grid analysis, as
shown here:
Source: Creos Luxembourg
763 770
778 772 774
786
795
829
700
750
800
850
2010 2011 2012 2013 2014 2015 2016 2017
Peak power demand on Creos grid (MW) 2010 - 2017 (so far)
26,4
%
43,4
%
27,9
%
2,3%
N/A
0
100
200
300
400
500
600
700
800
900
2010 2011 2012 2013 2014 2015 2016 2017
Detail of peak power on Creos grid (MW) 2010 - 2017 (so far)
0,4kV share during peak 20kV share during peak 65kV share during peak 220kV share during peak

9
At the moment of greatest power demand, 2.3 percent of the power was needed for 220kV
customers, 27.9 percent for 65kV customers, 43.4 percent for 20kV customers and 26.4
percent for the remaining low-voltage distribution.
Approximately, the 65kV grid stands for the supply of the industries, the 20kV grid for bigger
office buildings, commerce and service companies and the low-voltage distribution for the
supply of the households and smaller businesses.
During the highest power demand in 2016, 84 percent of it had to be imported and
16 percent were generated on national territory. During the peak demand in the beginning of
2017, only 13 percent were generated inland and 87 percent had to be imported.
As can be seen, the generation during the peak power demand is diminishing.
Further details will be covered in the chapter ‘Electrical energy generation and renewables
energies’.
81%
84%
87%
19%
16%
13%
0
100
200
300
400
500
600
700
800
900
2010 2011 2012 2013 2014 2015 2016 2017
Import & generation during peak demand (MW) 2010 - 2017 (so far)
import (MW) generation during peak (MW)
10
Approach for the future electricity demand and
the related peak power projections
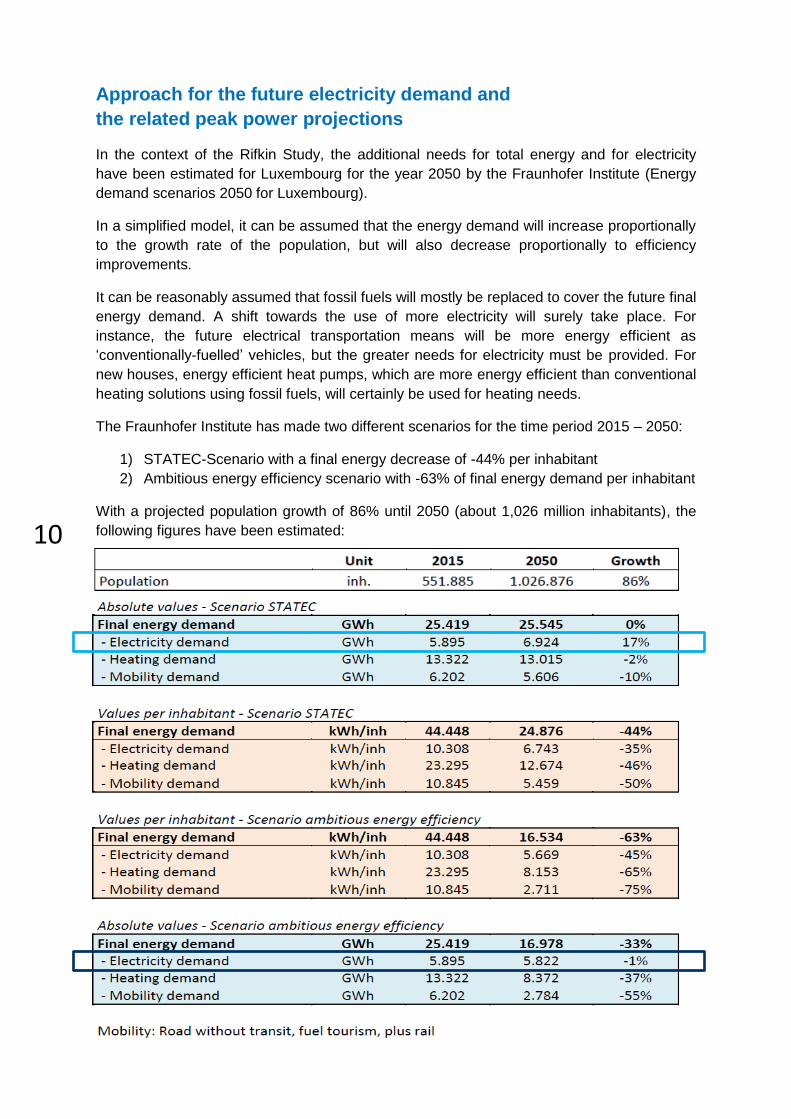
In the context of the Rifkin Study, the additional needs for total energy and for electricity
have been estimated for Luxembourg for the year 2050 by the Fraunhofer Institute (Energy
demand scenarios 2050 for Luxembourg).
In a simplified model, it can be assumed that the energy demand will increase proportionally
to the growth rate of the population, but will also decrease proportionally to efficiency
improvements.
It can be reasonably assumed that fossil fuels will mostly be replaced to cover the future final
energy demand. A shift towards the use of more electricity will surely take place. For
instance, the future electrical transportation means will be more energy efficient as
‘conventionally-fuelled’ vehicles, but the greater needs for electricity must be provided. For
new houses, energy efficient heat pumps, which are more energy efficient than conventional
heating solutions using fossil fuels, will certainly be used for heating needs.
The Fraunhofer Institute has made two different scenarios for the time period 2015 – 2050:
1) STATEC-Scenario with a final energy decrease of -44% per inhabitant
2) Ambitious energy efficiency scenario with -63% of final energy demand per inhabitant
With a projected population growth of 86% until 2050 (about 1,026 million inhabitants), the
following figures have been estimated:

11
Especially the following absolute and relative values have been calculated:
Source: Energy Demand Scenarios 2050 for Luxembourg, Fraunhofer ISE

12
Source: Energy Demand Scenarios 2050 for Luxembourg, Fraunhofer ISE
There is a slight difference between the values of the electric energy demand as found in the
Fraunhofer study and the historical values given by the Statec. We trust that the numbers
given by Statec are more accurate as the absolute values of the Fraunhofer study.
Nonetheless, this has no influence on the key statements and the relative values of this
study.
Comparing the trends of the specific sectors, the suppositions of the Fraunhofer ISE,
concerning the relative growth of the electrical energy demand of the sectors, can be
confirmed by the historical values.

13
Forecast of the future electricity need and peak power demand (p.1)
Ordinary load
In accordance with the estimation of the Fraunhofer ISE ‘Energy demand scenarios 2050 for
Luxembourg’, the electric energy need is supposed to rise up to 17% till the year 2050 (till
the year 2040, about 12%). That can be viewed as the ordinary load.
For the year 2040, the following future energy variations can be calculated for the different
sectors:
Increase of electrical energy need
2015 - 2050 2015 - 2040
Residential 60% 43%
Tertiary 40% 28%
Industry -8% -5,7%
Total 17% 12%
Source: Energy Demand Scenarios 2050 for Luxembourg, Fraunhofer ISE
We suppose that the growth of the industry, tertiary and residential sectors will not happen
linearly. A certain saturation might occur at the end of the projection period.
Source: Creos Luxembourg
800
1000
1200
1400
1600
1800
2000
2200
2400
2600
2800
Pro
jecte
d e
lectr
ical
en
erg
y (
GW
h)
Increase of electricity need per sector (GWh)
Tertiary Residential Industry Creos
+ 28%
- 5,7%
+ 43%

14
Voltage level Locality Adress Name of partner or project power requested n° project Comments
65kV Niederkorn Z.I. Hahneboesch /7,5MVA phase 1
32MVA final phase
/ /
65kV Sanem Z.I. Gadderscheier / +10MVA / /
65kV Bettembourg Z.I. Wolser / 12MVA / /
65kV Potaschbierg Z.I. Op der Ahlkërrech / +4MVA / /
65kV ou 20kV Sanem Z.I. Gadderscheier /5MVA phase 1
8MVA phase 2
/ /
20kV Riedgen Z.I. Riedgen / Eurohub / 8MVA / /
20kV Riedgen Z.I. Riedgen /
4,5MVA phase 1
9MVA phase 2
13,5MVA phase 3
/ /
20kV Mertert Rte de Wasserbillig / 6MVA / /
20kV Diekirch Z.I. Fridhaff /
4MVA phase 1
6MVA phase 2
8MVA phase 3
/ /
Subtotal61MVA short term
97MVA long term
List of projects and demands with high electrical energy needs
Industry
The total inland electricity demand is expected to rise up to 12 percent until 2040.
Furthermore, transportation means using electricity and all extraordinary loads must also be
added. In detail, the electricity demand of the residential sector is predicted to rise by 43%,
of the tertiary sector by 28% and the electricity demand of the industry is expected to fall by
5,7%.
Residential sector
The increased demand in the residential sector will come from the direct growth of the
population. New buildings will be more energy efficient, so that a lot less thermal energy per
inhabitant will be necessary, and the additional electric energy demand will be cushioned.
The increased energy efficiency of future electric devices should also help to reduce the
electricity needs per inhabitant.
Tertiary sector
The growth in the service sector will come from the additional workplaces. Here, new
administrative buildings will also be more energy efficient, so that a lot less thermal energy
per inhabitant will be necessary, and the additional electric energy demand will be reduced.
Industry sector
As already mentioned, a transformation of the current European industry form will surely
occur. Existing heavy industries tend to be replaced by smaller, more specialized industries
with a high know-how and lesser energy hunger. This could lead to a reduction of the
electrical energy consumption of this sector. New investments in this field guarantee,
throughout a targeted cost efficiency and environmental protection reasons, a more sparing
and sustainable use of energy resources.
The expert group of the Fraunhofer Institute made the assumption that the future energy
need of the industry sector will decrease by several percent. In order to stay competitive,
future industries will surely be more energy efficient than in the past.
Nonetheless, during the past year, a lot of grid connection requests for several new industry
facilities have reached us, as can be seen in the table below. This may bring quite
opposite growth results.
Source: Creos Luxembourg

15
0
1000
2000
3000
4000
5000
6000
70002000
2001
2002
2003
2004
2005
2006
2007
2008
2009
2010
2011
2012
2013
2014
2015
2016
2017
2018
2019
2020
2021
2022
2023
2024
2025
2026
2027
2028
2029
2030
2031
2032
2033
2034
2035
2036
2037
2038
2039
2040
Pro
jecte
d e
lectr
ical
en
erg
y (
GW
h)
Projection of the future electrical energy need (GWh) (without e-mobility or data centres)
Residential Tertiary Industry Losses total el. energy
+ 12%
0
500
1000
1500
2000
2500
2000
2001
2002
2003
2004
2005
2006
2007
2008
2009
2010
2011
2012
2013
2014
2015
2016
2017
2018
2019
2020
2021
2022
2023
2024
2025
2026
2027
2028
2029
2030
2031
2032
2033
2034
2035
2036
2037
2038
2039
2040
Pro
jecte
d p
eak p
ow
er
(MW
)
Peak power forecast on Creos Grid (MW) (without e-mobility or data centres)
Residential TertiaryIndustry Creos E-mobility (today)base peak power (without datacenters & E-mob)
The projection of the future electrical energy need of the ordinary load can be seen
hereafter: (Source: Creos Luxembourg)
Source: Creos Luxembourg
The related future peak power on the Creos grid can then be calculated with the
projected future electricity need and with given average usage hours.
Source: Creos Luxembourg
However, extraordinary loads such as E-mobility, data centres and all other projects
with extraordinary energy needs must not be forgotten and have to be added to the
projection. Those extraordinary loads are described in detail in the following chapters.

16
Voltage level Locality Adress Name of partner or project power requested n° project Comments
220kV Flebour / CFL 30MVA about 2019
65kV Luxembourg Kirchberg CFL 3MVA funicular railway
20kV (phase 1)
65kV (phase 2)
Luxembourg Kirchberg Luxtram
4MVA phase 1
6MVA phase 2
8,5MVA phase 3
10MVA phase 4
37092 railcar in the capital city
Subtotal37MVA short term
43MVA long term
Electrically driven transport on rail
Extraordinary loads
Transportation operated by electricity / E-mobility
The future need of electrical energy of the transportation sector is the most difficult to
predict. As ambitious political goals in emission limitations have been set, a decarbonisation
of the transport sector will lead to other propulsion technologies as used today. In
combination with electricity from renewable energies, electric vehicles could replace fossil
fuelled cars in the long term. The on-going evolution of electric vehicles will undoubtedly lead
to a lower energy need per inhabitant as in the past and present. Nonetheless, the electricity
needed in future for transportation of any kind, assuming there is a shift to E-mobility, will
have to be provided by the electrical grids. This has been utterly left open ended in the
projection scenarios of the Fraunhofer Institute.
A complete shift of the energy needs of the transport sector from fossil fuels to
electricity would exceed the present grid capacities on all voltage levels and would
lead to overloads. Optimized, smart charging of electric vehicles is a must and could lessen
the risks of congestions on the grids, but cannot prevent the necessity of further electrical
grid reinforcements. This situation could be aggravated by an ‘E-fuel tourism’, which would
be provoked by attractive inland electricity costs. Cross-border commuters could also want
to charge their electric cars during the working hours on their workplace in Luxembourg.
The coalescence of transport, electrical grid and communication infrastructure to a new
system is going to be a huge challenge, but could also offer the chance of a better utilization
of the infrastructures and more selective investments. Sustainable mobility is one of the
major challenges of the present and the future. Hybrid vehicles and electric cars could play a
central role in the achievement of a clean, future-viable individual transport, because carbon
dioxide emissions could be lowered and the dependency from fossil fuels could be reduced
due to the more energy efficient drive technologies of these vehicles. Paired with enough
electricity generation from renewable energy sources, an ecological energy cycle could be
formed, with which the fulfilment of the ambitious European climate targets could be
attempted.
Electrical transport on rail
It is important to note that the largest part of public passenger and goods transport on rail in
Luxembourg is already electrically driven. The electrical assets of the national railway
company, which increased by 25% in the last two years, are partly connected to the Creos
grid and partly to the Sotel grid, but a full connection to the Creos grid is planned in near
future.
In addition, a new funicular railway and a railcar network are to be built in the capital city.
(Source: Creos Luxembourg)

17
Locality Street / Place Partner / Customer Installed power (kVA)
Luxembourg Place de la Gare / 1600
Luxembourg rue de Cents / 1000
Bertrange rue de l'industrie / 400
Differdange rue M. Rodange / 1000
Differdange avenue de la Liberté / 1000
Alzingen rue Thionville/rue Roeser / 400
Bascharage Rue Laangwiss / 2000
Canach Rue d'Oetrange / 400
Luxembourg Merl près poste Belair / 2100
Luxembourg Hollerich / dépot bus VDL / 3000
Bettembourg Z.I. Scheleck / 2000
Luxembourg Bonnevoie / dépot bus CFL / 1250
Echternach dépot bus CFL / 1000
Total 17150
in 6 - 8 years
Luxembourg Cloche d'Or près nouv. Stade / 15000
E-Bus charging stations / projects
Electrical transport on road
Electric buses
Currently, there are about 2000 buses shuttling on the roads of the country, together making
approximately 60 million km per year. Recent practical experiences have shown that the
average energy consumption of electric buses is about 2.2 kWh per km.
In total, that would make an electrical energy consumption of:
Total electrical energy consumption e-Buses = 60.000.000 km x 2.2 kWh
km=132 GWh
Assuming, that energy has to be recharged overnight, i.e.from 22h to 6h, which would
represent an average charging power of:
Average power during night-charging e-Buses = 132 GWh
(8h x 365days)= 45 MW
In daily operation, E-buses may need to quickly recharge their batteries on their respective
routes with the aid of opportunity charging stations. The operating power of opportunity
charging stations ranges from 250kW to 550kW.
If only ten percent of all the buses would recharge their batteries during the day with these
stations, the cumulative power would be:
Power needed for opportunity charging e-Buses = 10% x 2000 buses x 300kW = 60 MW
Those power needs have been considered in the projection curves for the additional load of
e-mobility.
The use of electric buses for public transport is rising quickly, and a lot of projects for E-bus
charging stations are already planned:
Source: Creos Luxembourg
18
Year 2010 2011 2012 2013 2014 2015 2016 2017 s.f.
Cycles with auxiliary drive 25569 26339 27109 27998 8527 9385 9690 9768
electric 48 73 113 144 160 186 173 203
hybrid / / / / / / / /
Motorcycles 15551 15753 16225 16528 17226 17890 18569 19485
electric 2 6 8 9 11 16 23 29
hybrid / / / / / / / /
Passenger cars 191197 184633 207642 207902 205132 203926 202766 201732
electric 0 1 21 60 187 400 447 533
hybrid 357 486 713 879 980 1162 1178 1156
Commercial vehicles / mixed usage 139280 151812 137309 147456 157747 168612 178094 189004
electric 2 2 15 49 76 124 133 152
hybrid 235 313 318 588 677 845 1088 1324
Utility vehicles 1026 794 624 492 368 289 243 199
electric / / / / / / / /
hybrid / / / / / / / /
Buses and motor coaches 1623 1636 1703 1728 1759 1778 1857 1904
electric 0 0 2 2 4 2 2 2
hybrid 51 50 66 / / / 46 57
Light goods road vehicles 23837 24800 26089 27046 27635 28521 29668 31138
electric 7 5 6 30 70 85 84 102
hybrid / / / / / / / /
Trucks / Lorries 5354 5358 5368 5339 5298 5311 5404 5594
electric / / / / / / / /
hybrid / / / / / / / /
Agricultural tractors and machines 5550 5469 5356 4934 4726 4602 4502 4516
electric / / / / / / / /
hybrid / / / / / / / /
Special vehicles 2456 2560 2671 2764 2827 2936 3044 3132
electric 1 0 0 0 1 1 2 3
hybrid / / / / / / / /
Total (without bicycles or scooters) 385874 392815 402987 414189 422718 433865 444147 456704
Total (electric without buses) 12 14 50 148 345 626 689 819
Total (hybrid without buses) 592 799 1031 1467 1657 2007 2266 2480
Total (electric - buses) 0 0 2 2 4 2 2 2
Total (hybrid - buses) 51 50 66 / / / 46 57
Total electric 12 14 52 150 349 628 691 821
Total hybrid 643 849 1097 1467 1657 2007 2312 2537
5% of plug-in hybrid 32 42 55 73 83 100 116 127
10% of plug-in hybrid 64 85 110 147 166 201 231 254
Total electric & plug-in hybrid (10%) 76 99 162 297 515 829 922 1075
electric buses here included 0 0 2 2 4 2 2 2
hybrid buses here included 51 50 66 / / / 46 57
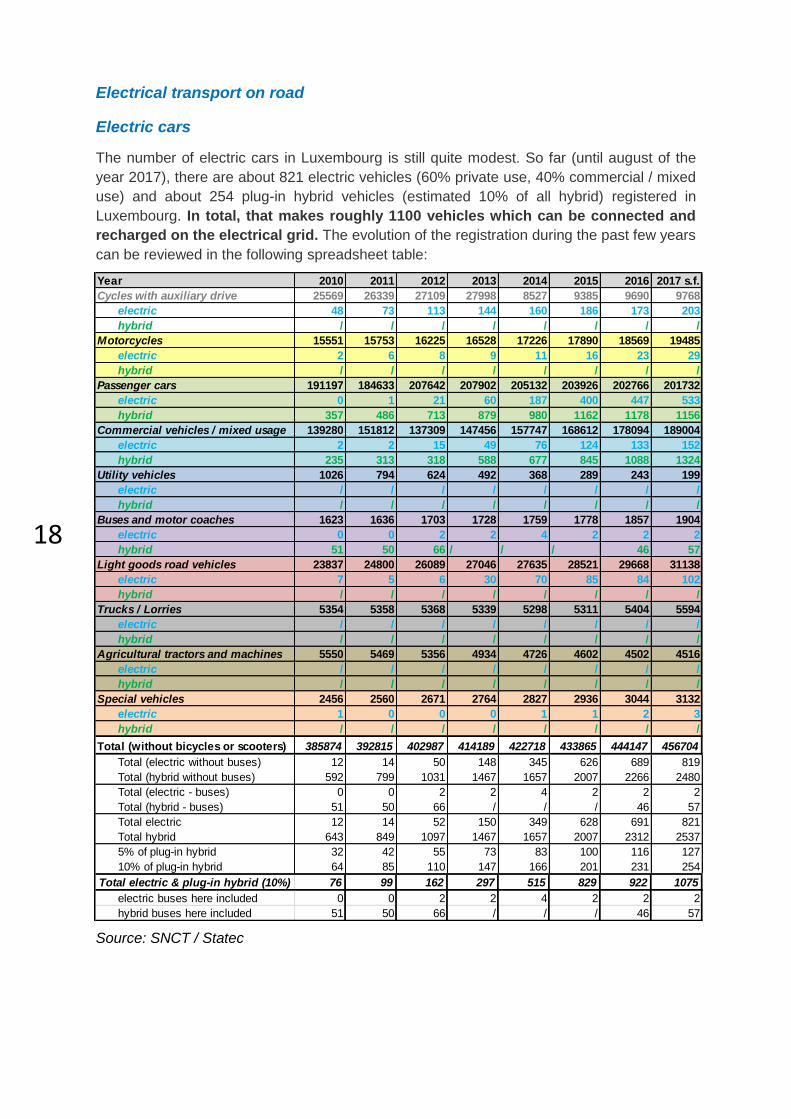
Electrical transport on road
Electric cars
The number of electric cars in Luxembourg is still quite modest. So far (until august of the
year 2017), there are about 821 electric vehicles (60% private use, 40% commercial / mixed
use) and about 254 plug-in hybrid vehicles (estimated 10% of all hybrid) registered in
Luxembourg. In total, that makes roughly 1100 vehicles which can be connected and
recharged on the electrical grid. The evolution of the registration during the past few years
can be reviewed in the following spreadsheet table:
Source: SNCT / Statec

19
In order to promote the E-mobility and to offer public recharging possibilities, eight hundred
public charging stations for electric vehicles (1600 charging points), under the label ‘Chargy’,
are currently being installed on public parking lots throughout the country.
Since January 2017, new tax incentives are offered for the acquisition of electric and hybrid
vehicles and even better incentives measures are planned for 2018. The very ambitious,
political target of attaining a share of 10% of electric and plug-in hybrid vehicles from the
total registrations (that means, over 40000 EV) in 2020 cannot be achieved any more, as the
high price and the limited range capabilities of these vehicles thwart the general acceptance.
However, the newly offered tax incentives seem to work, as the registrations for new
electric and hybrid vehicles are strongly rising in 2017. With better range capabilities
and better market prices in the future, there may be a broader acceptance with an
accelerated growth of the registrations.
As the power demand necessary for the cumulative charging of electric vehicles grows quite
severely with the number of EV, a few possible scenarios must be developed and their
impact on the grid has to be analysed. The future number of rechargeable vehicles will very
likely grow in a non-linear way. For this reason, a projected increase according to a second
degree polynomial curve has been assumed.
In this study, three different acceptance levels were taken into account:
a light acceptance with a total of about 110.000 EV
a medium acceptance with a total of about 275.000 EV
a high acceptance with a total of about 477.000 EV
Source: Creos Luxembourg
0
50000
100000
150000
200000
250000
300000
350000
400000
450000
500000
2010 2015 2020 2025 2030 2035 2040
Nu
mb
er
of
ele
ctr
ic v
eh
icle
s
Projected number of electric vehicles (battery EV and plug-in hybrid)
Number of EV - LIGHT number of EV - MEDIUM number of EV - HIGH
high acceptance
medium acceptance
light acceptance

20
Locality Street / Place Partner / Customer Installed power (kVA)
Munsbach 11, Rue Gabriel Lippmann / 630
Berchem Aire de Berchem / 2400
Livange / 1000
Wasserbillig Aire de Wasserbillig / 2500
Leudelange 2, Rue Jean Fischbach / 650
Howald 5, rue Peternelchen / 1250
Total 8430
Superchargers / projects
Cross-border commuters, which would like to recharge the batteries of their electric
vehicles on their work place in Luxembourg or with the help of superchargers, have
been partly considered in those projected figures.
The current state of technology gives a hint of the future supercharging possibilities of
electric vehicles. Anticipating a more pronounced use of electric vehicles, various fast
charging stations are already planned:
Source: Creos Luxembourg
Attractive inland electricity costs, compared to the prices of electricity in neighbouring
countries, could provoke a related extra load on the electrical grid, which would have to be
considered additionally. Superchargers on highways during summer travel period could
produce important peak loads that could neither be shifted in time, neither be flattened over
a certain time period. This could become a major issue on the higher voltage levels as the
simultaneous factor will be close to 1. Local energy storage might be favourable to reduce
peak demands but the economic viability of such a system is still unsure. It should be
noted, that this speculative additional load has not been included in the projections
hereafter.
The charging of the batteries of the electric vehicles will stress the electrical grids on all
voltage levels. In addition to the number of electric vehicles, their charging capacities and
the charging time are of importance for the overall additional electric load.
The highest relative additional load of the E-mobility will occur on the low-voltage
grids, because the simultaneity is much higher when a few EV are recharging during the
same time at home or on a public charging station on the low voltage grid. For example: a
typical electric car with a large battery has a charging capacity of 22kW.
Medium-voltage grids will benefit from the smaller probability of simultaneous charging of a
many EVs, and will therefore be, relatively viewed, less loaded.
The high-voltage grid will be relatively the least loaded, because of the interplay of the
numerous, various times of the recharges and of the power demands.
In 2014, the University of Stuttgart released the study ‘Implications of E-Mobility for the
energy system analysed with probabilistic grid calculations’ which provides values for
common charging capacities. With the analysis of commercial available vehicles (65
available on the market) and their charging capabilities, a stochastically calculated peak
power per car has been determined, which can be used to assess the cumulative load on
the high-voltage grid.

21
In fact, this study foresees that, because of frequency and the mix of different vehicles with
charging capabilities between 3,7kW and 22kW, the resulting average charging power per
car should be about 7,66kW in the year 2030, on the low voltage grid. Most vehicles are
expected to use only 3,7kW, roughly a quarter of the vehicles 11kW and about 10 percent a
charging power of 22kW or above.
Extrapolated on the high-voltage grid, this should lead a simultaneously occurring peak
power of only 1kW per car per day. According to the study, this rather low power can be
explained by a low daily energy consumption and the associated charging time.
In the Master thesis ‘E-mobility – Impacts on the energy supply system’ from the year 2010
and from the technical university HTW Saar, a higher peak power per car has been
determined, by means of a bottom-up analysis. It was supposed that higher charging
capacities will be used simultaneously in the future. Depending on the scenario, an
additional, average peak load, on the high voltage grid, of 1,66kW per car has been
calculated (with an average daily route of 50km).
Today, the real effects of the E-mobility on the electrical grids are still unknown,
because there are no practical experiences with high numbers of electric vehicles
charging simultaneously. For this reason, we decided to take the average peak load of
both impact studies to calculate the total peak power necessary for charging large numbers
of electric vehicles in Luxembourg (about 1,33kW peak power per car on the HV grid).
Recent studies and calculations from 2017 have determined that with a homogeneous
distribution of the charging points and electric vehicles, and with a mix of charging capacities
as available today, a light acceptance of electric vehicles should lead to very few or no
overloads on the low and medium voltage grids.
Nevertheless, the additional load of a light acceptance of electric vehicles would
almost use up the entire remaining power reserve of the existing high-voltage grid.
Without intelligent or coordinated charging management solutions, there will certainly be
overloads on the electrical grids with higher acceptances (Estimation: starting from a total of
150.000 to 200.000 EV’s).

22
147 MW
426 MW
695 MW
0
100
200
300
400
500
600
700
2010 2015 2020 2025 2030 2035 2040
Ad
dti
oo
na
l lo
ad
(M
W)
Projected number of electric vehicles (battery EV and plug-in hybrid) + E-Bus (full electric 2040) + Luxtram
Resulting additional load on the high voltage grid according to studies IEH Uni. Stuttgart & HTW HS Saarland
additional load (MW) LIGHT additional load (MW) MEDIUM additional load (MW) HIGH
high acceptance 477256 EV
medium acceptance 275339 EV
light acceptance 110710 EV
2040 60MW for E-buses included 15MW for Luxtram included
2040 30MW for E-buses included 15MW for Luxtram included
2040 15MW for E-buses included 10MW for Luxtram included
The total additional load on the high-voltage grid can be seen in this chart:
Source: Creos Luxembourg
Smart-charging solutions could reduce the power needed during peak times, with a
better usage throughout the day.
In regard to ‘vehicle to grid’ approaches, it has to be taken into consideration that E-vehicles
owners may not agree with a third-party use of the battery packs of their EVs for energy
storage purposes. Network operators could theoretically use the stored energy of the
batteries of the EVs to counter brief shortages or avoid possible overloads. But the durability
of the expensively acquired batteries of the E-vehicles owners, would suffer from the
additional charging cycles. Legal aspects would also have to be considered.
The ability of a bidirectional use of these storage capacities remains questionable.

23
Extraordinary loads
Data Centres with high energy needs
Contractually agreed power and actual peak power of the existing data centres
Since 2006, five major data centres, labelled as such, have been connected to the Creos
electrical grids. The consumption of other smaller data centres, which are integrated in
administrative or commercial buildings and banks, cannot be isolated clearly enough to be
considered here. The operators and the exact locations are not mentioned for confidentiality
reasons.
The high power demands, which the customers requested initially, do not match with the
more moderate actual power needs and the contractually agreed powers of these data
centres. We experienced that the initial high power requests and the contractually agreed
power demands have not (or not yet) been reached or used. However, Creos must still be
able to provide the agreed powers at any time and consider these given values during the
future grid planning.
Source: Creos Luxembourg
0
1
2
3
4
5
6
7
8
9
10
11
2006 2007 2008 2009 2010 2011 2012 2013 2014 2015 2016 2017
pe
ak p
ow
er
de
man
d (
MW
)
Data Center 1
total peak power (MW) difference to engaged power
0
1
2
3
4
5
6
7
8
9
10
11
2006 2007 2008 2009 2010 2011 2012 2013 2014 2015 2016 2017
pe
ak p
ow
er
de
man
d (
MW
)
Data Center 2
total peak power (MW) difference to engaged power

24
Source: Creos Luxembourg
0
1
2
3
4
5
6
7
8
9
10
11
2006 2007 2008 2009 2010 2011 2012 2013 2014 2015 2016 2017
pe
ak p
ow
er
de
man
d (
MW
)
Data Center 3
total peak power (MW) difference to engaged power
0
1
2
3
4
5
6
7
8
9
10
11
2006 2007 2008 2009 2010 2011 2012 2013 2014 2015 2016 2017
pe
ak p
ow
er
de
man
d (
MW
)
Data Center 4
total peak power (MW) difference to engaged power
0
1
2
3
4
5
6
7
8
9
10
11
2006 2007 2008 2009 2010 2011 2012 2013 2014 2015 2016 2017
pe
ak p
ow
er
de
man
d (
MW
)
Data Center 5
total peak power (MW) difference to engaged power

25
Summarising, the existing data centres have the following power needs:
Existing data centre
In operation since
Requested power
Contractually agreed power
Peak power 2006 - 2017
N°1 October 2006 10,5 MW 10,35 MW ~ 5,3 MW
N°2 March 2008 10 MW 6,51 MW ~ 4,6 MW
N°3 December 2009 21 MW 9,45 MW ~ 3,1 MW
N°4 August 2011 13,5 MW 4,4 MW ~ 2,1 MW
N°5 February 2012 21 MW 4,5 MW ~ 1,2 MW
Source: Creos Luxembourg
Common power densities of the existing data centres in Luxembourg vary between 0,8 –
2,5 kW/m2, with a rising tendency. A better energy efficiency, for instance for the cooling,
should counter this tendency.
As already mentioned, Creos must be able to provide the contractually agreed powers at any
time. The original high requests must not be forgotten, as these powers needs could occur
later on, with full operational readiness and extensive use or due to upgrades and
expansions.
Source: Creos Luxembourg
0,6
1
1,4
6
2,9
5
5,1
9
8,0
8
8,4
5
10,1
7
12,8
0
12,9
7
14,8
0
13,5
5
13,9
4
5,3
9
4,5
4 10,0
9
10,9
9
8,1
0
13,3
4
16,1
2
13,4
9
13,3
3
11,5
0
18,1
7
21,2
9
43,1
47,9
5
51,1
52,7
5
54,5
56,2
5
58,1
59,8
5
59,9
5
0
10
20
30
40
50
60
70
pe
ak p
ow
er
de
man
d (
MW
)
Total peak power and contractually agreed power of all data centers
total peak power (MW) total difference to engaged power total contractually engaged power

26
Future mega data centre
A project to install a massive data centre with very high energy needs is still unofficial and
unconfirmed. Based in Bissen / Roost, the projected surface should be close to 25 hectares
and the power request plan looks as follows:
Phase of project Requested power Desired date of power
supply readiness
Phase 1 100 MW (120 MVA) from 2020
Phase 2 180 MW (210 MVA) from 2025
Phase 3 260 MW (280 MVA) from 2030
Source: Creos Luxembourg
Such an enormous single power demand will considerably reduce the remaining
power reserves of the existing high voltage grid and will make extensive
reinforcements necessary to ensure a reliable future power supply. Even if this project
is still unconfirmed, this data should be included in the total projected peak power demand
as a possible scenario.
Additional data centres projects
In order to consider other future data centres, which are also planned (see list hereafter), a
total amount of 100MW of additional load has been projected.
Source: Creos Luxembourg
That value of 100MW includes the remaining, still unused power of the existing data centres
and a certain amount of new facilities. (mega data centre excluded)
Voltage level Locality Adress Name of partner or project power requested n° project Comments
220kV Roost / /
120MVA phase 1
210MVA phase 2
280MVA phase 3
mega datacenter
on hold / awaiting confirmation
65kV
Bissen
ou
Bettembourg
Z.A.C. Klengbousbierg
Z.I. Krakelshaff/
10MVA phase 1
20MVA phase 2
datacenter
65kV Bofferdange 164, Rte de Luxembourg / 12MVA datacenter
65kV Findel Parking Aerogare / 20MVAdatacenter
oral inquiry
20kV Grass Z.I. Zaro /1,25MVA phase 1
2,5MVA phase 2
17-00017 datacenter
Subtotal163,25MVA short term
334,5MVA long term
Data Centers

27
The full operational readiness of the existing data centres and the construction of future ones
have been taken into account with the following additional load projections:
Source: Creos Luxembourg
0
50
100
150
200
250
300
350
400
ad
dit
ion
al lo
ad
(M
W)
Projected additional load due to future data centers
mega data centre phase 1
mega data centre phase 2
mega data centre phase 3
additional projected load without mega data centre
additional projected load with
mega data centre

28
Forecast of the future electricity need and peak power demand (p.2)
Ordinary and Extraordinary loads
The future peak power can be calculated with the projected future electricity need and
with given average usage hours. The peak powers for the e-mobility scenarios and for
data centres can then be added to that base peak power curve.
Source: Creos Luxembourg
0
500
1000
1500
2000
2500
2000
2001
2002
2003
2004
2005
2006
2007
2008
2009
2010
2011
2012
2013
2014
2015
2016
2017
2018
2019
2020
2021
2022
2023
2024
2025
2026
2027
2028
2029
2030
2031
2032
2033
2034
2035
2036
2037
2038
2039
2040
Pro
jecte
d p
eak p
ow
er
(MW
)
Peak power forecast on Creos Grid (MW) -- without mega data center
Residential Tertiary Industry Creos
E-mobility (today) E-mobility (light) Datacenters (other)
with datacenters (other) and light E-mobility with datacenters (other) and medium E-mobility with datacenters (other) and high E-mobility
base peak power (without datacenters & E-mob) with datacenters (other) and light E-mobility
Datacenters (other) +
E-mob light
Datacenters (other) +
E-mob medium
Datacenters (other)
+ E-mob high
0
500
1000
1500
2000
2500
2000
2001
2002
2003
2004
2005
2006
2007
2008
2009
2010
2011
2012
2013
2014
2015
2016
2017
2018
2019
2020
2021
2022
2023
2024
2025
2026
2027
2028
2029
2030
2031
2032
2033
2034
2035
2036
2037
2038
2039
2040
Pro
jecte
d p
eak p
ow
er
(MW
)
Peak power forecast on Creos Grid (MW) -- with mega data center
Residential TertiaryIndustry Creos E-mobility (today)E-mobility (light) Datacenters (other)Mega dc with datacenters (mega dc incl) and light E-mobilitywith datacenters (mega dc incl) and medium E-mobility with datacenters (mega dc incl) and high E-mobility
Mega dc + E-mob light
Mega dc + E-mob med
Mega dc + E-mob high

29
The loads considered in this study do not include potential additional loads presently
connected via the Sotel grid to Belgium and France. Furthermore, the interconnection
capacity between Creos and the Belgian grid is not considered in the study. Both
together represent an additional load of 480 MW to 680 MW. This additional load has
to be considered in any major grid extension project as it would allow the Sotel load
to be switched away from the BE and FR markets to the more attractive DE-LU market
and avoid costly redispatch measures on cross border flows in case of high flows
from Germany through Luxembourg to Belgium. Furthermore, these additional loads
and flows are likely to contribute to the financing of such new infrastructure.
With a forecast of the future inland electrical energy generation, an assessment of the
remaining import can be established.

30
107 107 106 106
0 3 3 14 21 21 21 21 11 11 12 12
38 38 38 38
57 64
121 121
114 119
125 130
0
50
100
150
200
250
300
350
400
450
500
2014 2015 2016 2017
To
tal in
sta
lled
po
wer
(MW
)
Detail of installed power of electrical energy production (MW) 2014 - 2017
cogeneration biomass waste burning biogas, water purification hydroelectric windpower photovoltaic
348 MW 364 MW
427 MW
442 MW
Installed power
Electrical energy generation and renewables energies
Current electricity generation and its contribution during peak demand
The evolution of the annual electricity volume which was generated and its source is
interesting, but of secondary importance for the dimensioning of the electrical grid. The
generation at the moment of the peak demand is the most important. The dimensioning
of the electrical lines is dictated by the moment, during which the greatest currents occur on
those lines.
In this chapter, the influence of the generation during the peak demand shall be analysed
and which remaining power must be imported.
The total installed power of all generation units on the Creos grid has risen from 348MW in
2014 to 442MW to this day, with the following segmentation:
Source: Creos Luxembourg
The share of the installed generation capacity based on renewable energy sources passed
from 63 percent in 2014 to 71 percent nowadays.
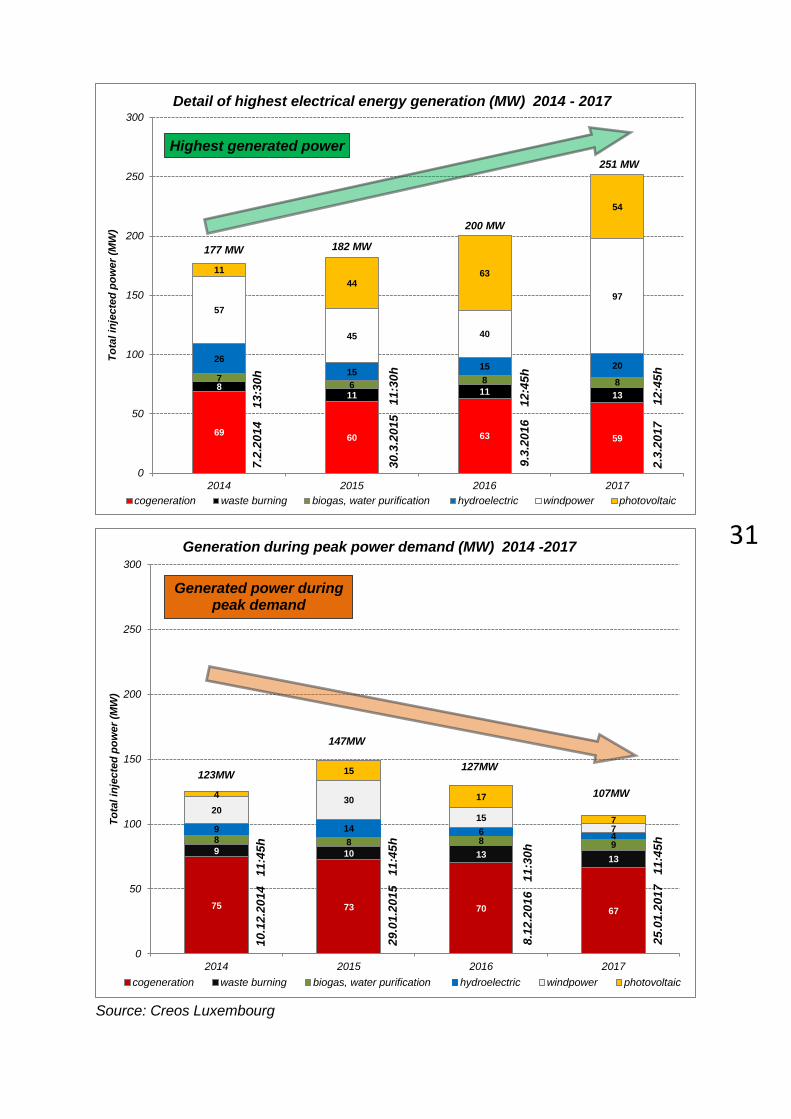
Although, the real, delivered power of all generation units combined is rising, the total
generation during the peak demand is decreasing, as can be seen in the following
charts:
31
Source: Creos Luxembourg
69 60 63 59
8 11 11 13
7 6
8 8
26
15 15 20
57
45 40
97
11
44 63
54
0
50
100
150
200
250
300
2014 2015 2016 2017
To
tal in
jecte
d p
ow
er
(MW
) Detail of highest electrical energy generation (MW) 2014 - 2017
cogeneration waste burning biogas, water purification hydroelectric windpower photovoltaic
7.2
.20
14
1
3:3
0h
30
.3.2
01
5 1
1:3
0h
9.3
.20
16
1
2:4
5h
2.3
.20
17
1
2:4
5h
177 MW 182 MW
200 MW
251 MW
Highest generated power
75 73 70 67
9 10 13 13
8 8 8 9
9 14 6 4
20 30
15
7
4
15
17
7
0
50
100
150
200
250
300
2014 2015 2016 2017
To
tal in
jecte
d p
ow
er
(MW
)
Generation during peak power demand (MW) 2014 -2017
cogeneration waste burning biogas, water purification hydroelectric windpower photovoltaic
123MW
147MW
127MW
107MW
10
.12
.20
14
1
1:4
5h
29
.01
.20
15
1
1:4
5h
8.1
2.2
01
6 1
1:3
0h
25
.01
.20
17
1
1:4
5h
Generated power during peak demand

32
As can be seen, the increase of the installed generation capacity during the last years, which
was mainly an increase of wind power and photovoltaic generation, did not help reduce the
import need during the peak demand. The day of the greatest electrical power demand is
typically a cold winter day, during which there is no wind and no sunshine. The only
remaining reliable electrical generation on those days comes from cogeneration units.
The difference in generation between the day with the highest electrical generation and the
day with the highest electrical demand is enormous. The part of the generation based on
renewables energies is highly volatile and about 6.5 times smaller during the day of the
peak demand than on the day with the highest generation. In fact, during the last years,
volatile generation (wind, hydro, pv) contributed between 17 and 38 percent to the lowering
of the total peak; generation units with high yield (cogeneration, waste burning, biogas,
biomass) contributed up to 72 percent to the reduction of the peak demand.
So, the expansion of renewable energy sources is not preventing grid reinforcements,
but could make them even necessary on all voltage levels. For example, if the
generation capacities exceed the grid capacities of the electricity demand.
The generation varies strongly throughout the year, and is generally greatest during spring
and summer months, at times where the electricity demand is not at its peak. ‘Smart grids’,
with intelligent communication and energy storage capabilities could help smooth the
discrepancy between highest generation and highest demand, but cannot prevent it
completely.

33
The inland electricity generation has increased during the past 4 years, with a total share
from renewable energy sources surpassing the conventional generation for the first time in
2016. Even so, compared to the total electricity consumption, the yearly contribution of the
total inland generation was only 14.5 percent in 2016 and is estimated to be 15.9 percent in
2017. The rest of the consumed electricity has to be imported. Please note that recent
cogeneration units using biomass as primary energy form are included in the cogeneration
figures.
Source: Creos Luxembourg
4314GWh 85,5%
275,7GWh 5,5%
93,6GWh 1,9% 99,1GWh 2%
63,3GWh 1,3%
101,3GWh 2%
101,5GWh 2%
Energy contribution of the inland generation on Creos grid
electricity import (GWh) cogeneration
waste burning hydroelectric
biogas, water pur. windpower
photovoltaic
2016
4287GWh 84,1%
270GWh 5,3%
93GWh 1,8% 93GWh 1,8%
67GWh 1,3%
180GWh 3,5%
110GWh 2,2%
Energy contribution of the inland generation on Creos grid
electricity import (GWh) cogeneration
waste burning hydroelectric
biogas, water pur. windpower
photovoltaic
2017 E
sti
ma
tio
n
312,6 280,3 275,7 270
72,4 89,4 93,6 93
54,9 54,3 63,3 67
97,3 86,1
99,1 93
82,5 102,2
101,3
180
60,6 59,3
101,5
110
0
100
200
300
400
500
600
700
800
900
2014 2015 2016 2017
To
tal ele
ctr
icit
y g
en
era
tio
n (
GW
h)
Inland electricity generation (GWh) 2014 -2017
cogeneration waste burning biogas, water purification hydroelectric windpower photovoltaic
680 GWh 672 GWh
734 GWh
813 GWh
Es
tim
ati
on
Generated electricity
34
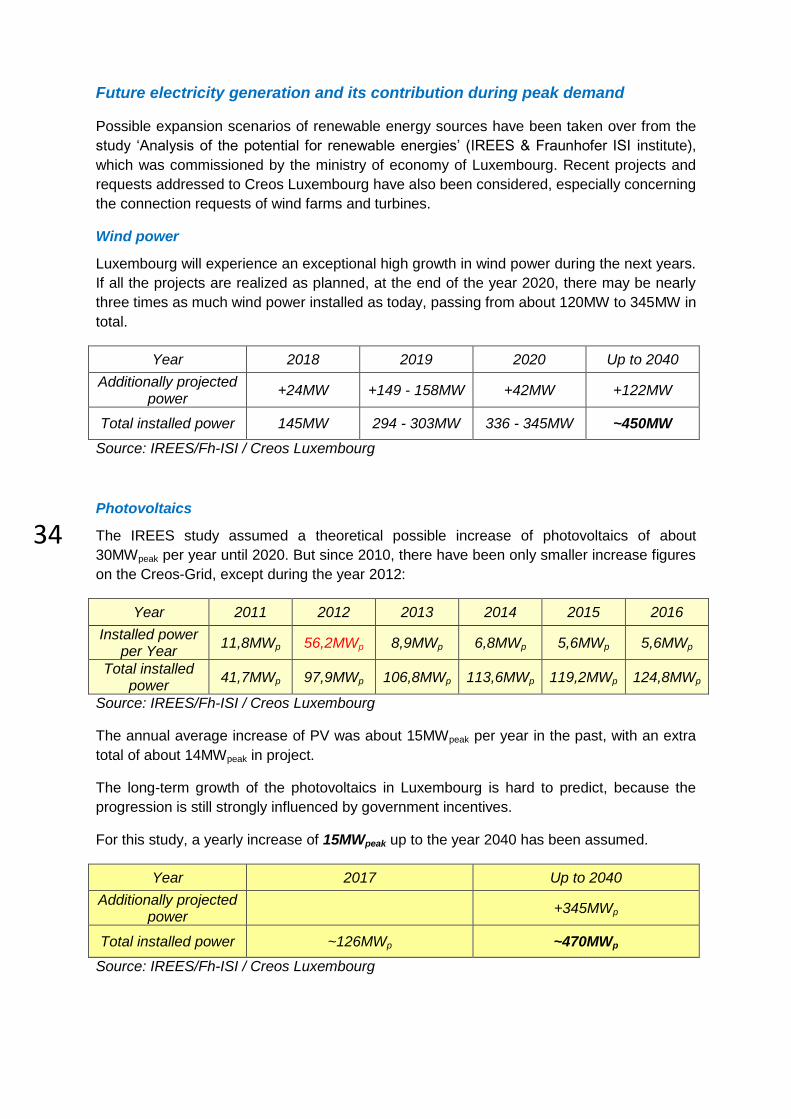
Future electricity generation and its contribution during peak demand
Possible expansion scenarios of renewable energy sources have been taken over from the
study ‘Analysis of the potential for renewable energies’ (IREES & Fraunhofer ISI institute),
which was commissioned by the ministry of economy of Luxembourg. Recent projects and
requests addressed to Creos Luxembourg have also been considered, especially concerning
the connection requests of wind farms and turbines.
Wind power
Luxembourg will experience an exceptional high growth in wind power during the next years.
If all the projects are realized as planned, at the end of the year 2020, there may be nearly
three times as much wind power installed as today, passing from about 120MW to 345MW in
total.
Year 2018 2019 2020 Up to 2040
Additionally projected power
+24MW +149 - 158MW +42MW +122MW
Total installed power 145MW 294 - 303MW 336 - 345MW ~450MW
Source: IREES/Fh-ISI / Creos Luxembourg
Photovoltaics
The IREES study assumed a theoretical possible increase of photovoltaics of about
30MWpeak per year until 2020. But since 2010, there have been only smaller increase figures
on the Creos-Grid, except during the year 2012:
Year 2011 2012 2013 2014 2015 2016
Installed power per Year
11,8MWp 56,2MWp 8,9MWp 6,8MWp 5,6MWp 5,6MWp
Total installed power
41,7MWp 97,9MWp 106,8MWp 113,6MWp 119,2MWp 124,8MWp
Source: IREES/Fh-ISI / Creos Luxembourg
The annual average increase of PV was about 15MWpeak per year in the past, with an extra
total of about 14MWpeak in project.
The long-term growth of the photovoltaics in Luxembourg is hard to predict, because the
progression is still strongly influenced by government incentives.
For this study, a yearly increase of 15MWpeak up to the year 2040 has been assumed.
Year 2017 Up to 2040
Additionally projected power
+345MWp
Total installed power ~126MWp ~470MWp
Source: IREES/Fh-ISI / Creos Luxembourg

35
Hydroelectric power
According to the IREES/Fh-ISI study, an increase of the electricity generated by
hydroelectric power plants up to 137GWh per year may be possible. The existing power
plants with a total installed power of 38MW are generating about 121GWh of energy per
year. That should make a growth of 13 percent. (+ 5MW power)
Currently there are no specific projects or inquiries to build new hydroelectric power plants or
to modernize existing plants.
Year 2017 Up to 2040
Additionally projected power
+5MW
Total installed power 38MW 43MW
Source: IREES/Fh-ISI / Creos Luxembourg
Cogeneration of heat and electricity (conventionally fuelled and solid biomass)
Besides hydro and biomass plants, conventional thermal plants are usually the major
contributors to a secured peak generation capacity. The only major thermal plant in
Luxembourg has been shut down recently for economic reasons. Therefore it is unlikely that
in the short or medium term, additional conventional thermal capacity will be added to the
generation park in Luxembourg. Even if such capacity would be added, at least two plants
were required in order to contribute to security of supply in case of saturated transmission
lines. As it is very unlikely that two major conventional plants are being built within the limited
timeframe until the available transmission capacity is exceeded, this option has not been
further pursued in this study.
Current smaller cogeneration units, fuelled by natural gas or oil, are already getting
unprofitable to operate, and are no longer desired, due to ecological aspects and the related
political engagements. That’s why more and more older installations are put out of service,
when major failures or defects occur.
Without attractive incentives which encourage the construction and operation of
environment friendly cogeneration units, the reliable electricity generation by those
units may be decreasing severely and rapidly in near future.
The simultaneous generation and use of heat and electricity still makes sense, as the
primary energy source is optimally exploited. Only a few cogeneration units have recently
been replaced by units using renewable energy sources, like biomass (for ex.: waste wood
or pellets).
According to the IREES/Fh-ISI study, the feasible potential for energy generation using solid
or liquid biomass is supposed to be about 1800GWhth per year. Between 25 and 38 percent
of that thermal energy could be used electrically, which means about 500GWhel per year.
That represents 1.7 times the current electricity generation by cogeneration units, and just as
much installed power in the future.
At this day, specific projects for new biomass cogeneration units with a total power of about
30MW exist. On middle and long term, the installed power of newly build units could
counterbalance the power of the units which are put out of service.

36
Year 2017 Up to 2040
Additionally projected power
+30-75MW
Total installed power 106MW (+14MW biomass) 136-180MW
Source: IREES/Fh-ISI / Creos Luxembourg
Biogas
The total installed power of all biogas installations is about 12MW today. The achievable
target for this form of energy utilisation is approximately 370GWhth or 111GWhel per year
(IREES / Fh-ISI). That corresponds to a final capacity of 22MW.
The full feasible biogas potential may not entirely be used to generate electricity. Bigger
collective plants may inject the produced gas directly into the local gas lines. A share of 75
percent of the potential, being used to generate electricity, would correspond to an additional
power of 7MW.
Year 2017 Up to 2040
Additionally projected power
+7-10MW
Total installed power 12MW 19-22MW
Source: IREES/Fh-ISI / Creos Luxembourg
Waste incineration
The modernisation of the waste incineration plant Sidor a few years ago has led to an up-to-
date waste processing facility with a performant energy recovery system, which fulfils strict
environmental regulations. The process heat can be better used and is to be fed into the
local heating network. Furthermore, more electricity can be generated.
Despite the clear trend towards more waste prevention and higher recycling rates, it can be
assumed that waste incineration will still be unavoidable and necessary in future in
Luxembourg. But an expansion or an additional waste treatment facility is currently not
planned.
Year 2017 Up to 2040
Additionally projected power
Total installed power 21MW 21MW
Source: IREES/Fh-ISI / Creos Luxembourg
Theoretically, assuming all the feasible potential from the IREES study would be realized,
the total installed power of all the generation units could rise considerably until 2040:

37
120 160
21 21
12 20
38
43 121
450
130
470
0
200
400
600
800
1000
1200
1400
2017 2040
To
tal in
sta
lled
po
wer
(MW
) Detail of installed power of electrical energy production (MW)
2017 & 2040 (estimation)
cogeneration & biomass waste burning biogas, water purification hydroelectric windpower photovoltaic
442 MW
Installed power
1164 MW
Source: Creos Luxembourg
According to the IREES study, a possible inland potential of over 1100MW generation
capacity in the year 2040 could suffice to cover a big part of the consumption needs,
provided that all those generation units would actually inject 100 percent of their capabilities
at the same time.
As all generation units are not injecting with their maximum power at the same time (i.e. in
2017 maximal of 57 percent of the installed power), it can be assumed that in 2040 the
consumption will still be the biggest and most important component, and will be decisive for
the network development.
The Creos grids must be dimensioned for the maximum total power which could
occur at any time. In the year 2040, the maximum total power on the high voltage grid
will very probably manifest during a winter day, where only a moderate electricity
generation will occur.
Regionally or locally, the situation could be quite different: The massive increase in
wind turbines in the north of Luxembourg is already dictating the high voltage
reinforcements for that region. And the future expansion of photovoltaics will surely
require regional and local reinforcements on the low- and medium voltage grids.
Eventually, the discrepancy between generation and demand could be smoothed out
partially by an intelligent demand-side management and new storage technologies.
Substantial investments and an appropriate legislative framework would be necessary
on those issues. Considering the vast projected expansion of photovoltaics (470MWp
representing a 100.000 households with a 4 – 5 kWp solar installation), the vision of a self-
sufficient ‘prosumer’ as mentioned in the Rifkin study has been taken into account.

38
With the projected installed generation capacity for the year 2040, and the actual generation-
during-peak values and experiences, the following estimated scenarios have been created:
Source: Creos Luxembourg
According to our estimates, the total generation during peak demand could rise up to
240MW in 2040. Worst case would be that the generation would stay at the same level as it
is today, or would even decrease.
To complement, the projected evolution of the energetic contribution form the year 2017 to
the year 2040 is illustrated hereafter:
Source: Creos Luxembourg
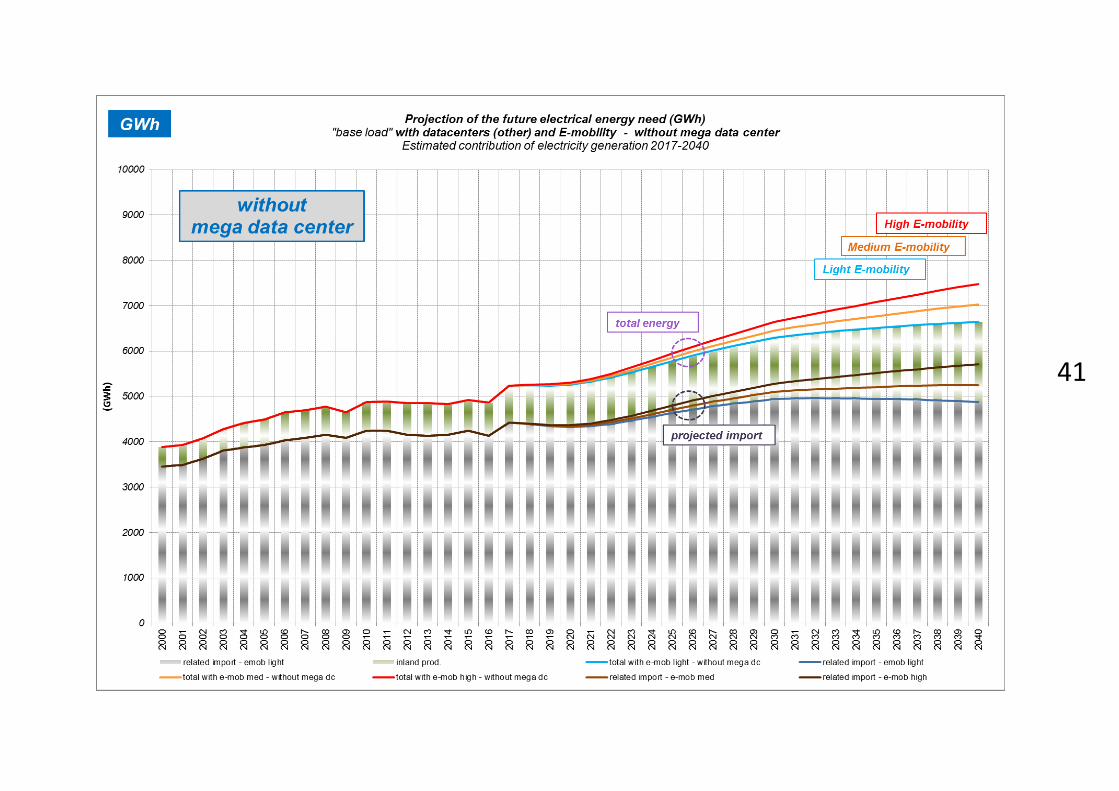
Finally the import projections up to 2040 have been completed with the estimated
contribution of the generation (see next pages):
1300MW 84%
98MW 6,4%
13MW 0,9%
12MW 0,8% 11MW
0,7%
88MW 5,7%
18MW 1,2%
Estimated generation during peak power demand
import (MW) cogeneration waste burningbiogas, water pur. hydroelectric windpowerphotovoltaic
2040
Low import
with mega dc & light e-mob
240MW generation during peak
1400MW 92%
79MW 5,2%
13MW 0,9%
9MW 0,6%
6MW 0,4%
7MW 0,5%
7MW 0,5%
Estimated generation during peak power demand
import (MW) cogeneration waste burningbiogas, water pur. hydroelectric windpowerphotovoltaic
2040
High import
with mega dc & light e-mob
120MW generation during peak
4287GWh 84,1%
270GWh 5,3%
93GWh 1,8% 93GWh 1,8%
67GWh 1,3%
180GWh 3,5%
110GWh 2,2%
Energy contribution of the inland generation on Creos grid
electricity import (GWh) cogeneration waste burning
hydroelectric biogas, water pur. windpower
photovoltaic
2017
6691GWh 79,1%
407GWh 4,8%
93GWh 1,1% 100GWh 1,2%
99GWh 1,2%
650GWh 7,7%
423GWh 5%
Energy contribution of the inland generation on Creos grid
electricity import (GWh) cogeneration waste burning
hydroelectric biogas, water pur. windpower
photovoltaic
2040
with mega dc & light e-mob


39

40
41

42

43
Summary and Recommendations
The 220kV supply lines coming from Bauler/Niederstedem and Trier/Quint have a secured
transmission capacity of about 1000MW.
Today about 75% to 85% of this total transmission capacity is already used.
Even with better energy efficiency, the growth of the economy and of the population will
undeniably lead to more electricity needs.
The development of electrical transportation will also imply a huge increase of the
electrical energy needs.
According to our projections, a high acceptance of e-mobility could double the peak load on the electrical grid.
Further investments in renewable energies will not result in relevant reductions of the
peak loads on the electrical grids.
The reliable, steady part of the electricity generation during the peak demand is declining, which further aggravates the situation.
The extraordinary load due to an interconnection between the Creos high voltage grid
and the industrial electrical grid of Sotel, and a surplus load due to an energy transit
from Germany to Belgium over the national high-voltage network have not been
integrated in the projection curves. Both would be beneficial for transport cost
reduction.
According to our assessment, with the steady increase of the electricity consumption and
with the commitment to supply the promised needs of the Mega Datacenter,
The cross-border interconnection capacities will be depleted from the year 2025 on.
Without the Mega Datacenter, the capacities will still be depleted 3 to 4 years later.
So, as the construction and operation of at least two conventionally fuelled, major
power plants are not desired, it is clearly necessary to increase the transmission
capabilities of the existing high-voltage supply lines and/or to build a new additional
supply line with enough capacity for future needs.
In order to secure the electrical power supply of Luxembourg in the mid and long
term, and to avoid any unnecessary double investments, we therefore propose to:
Replace the existing 220kV lines from Trier/Quint by stronger higher voltage level
lines (400kV)
Reinforce the existing 220kV lines coming from Bauler/Niederstedem
Extend, on the long term, the new 400kV grid towards the neighbouring countries
(Belgium)
With a strong additional 400kV injection and a grid extension towards Belgium, the
extraordinary load of Sotel with 280MW could be connected and a cross-border transit of
200MW to 400MW could be tolerated. Both would have a positive impact on the network
fees.


