Chapter 6 Effects of salinity on germination Chapter 6 EFFECTS OF SALINITY LEVELS AND SEED MASS ON GERMINATION IN AUSTRALIAN SPECIES OF FRANKENIA L. (FRANKENIACEAE). Lyndlee C. Easton & Sonia Kleindorfer ABSTRACT Easton, L.C. & Kleindorfer, S. (In press) Effects of salinity levels and seed mass on germination in Australian species of Frankenia L. (Frankeniaceae). Environmental and Experimental Botany. Halophyte species demonstrate differing levels of salt tolerance. Understanding interspecific variation to salinity levels is of value from both the scientific perspective, which includes the identification of traits associated with salinity tolerance, as well as from an applied perspective, which includes identifying plant species for specific salinity restoration and remediation projects. This paper investigates the effects of salinity on germination of 12 Australian species of the plant genus Frankenia L. (Frankeniaceae). We use saline solutions that corresponded to the average soil-water salinity concentrations in the arid zones of inland Australia. These solutions consisted of 10mM calcium chloride, 30mM magnesium sulphate, and 450mM sodium chloride. The aims of our study were: (1) to investigate germination (germination rates, germination success) of Frankenia seeds to four salinity levels (0%, 10%, 20%, 30%), (2) to test for possible interaction effects between seed mass, germination, and salinity, and (3) to examine the effect of salinity levels on the inhibition of germination and/or seed damage. Species varied in their salt tolerance for germination rates and success. Species with larger seeds had higher germination rates and germination success for high salinity levels. Several species did not germinate well at any salinity level. Finally, no seeds were adversely affected by exposure to high salinity levels pre-germination. There is potential for including some Frankenia species in remediation and revegetation projects in areas affected by salinity, and also as garden plants in saline regions. Key words: Australian arid zone plants, germination rates, germination success, salinity 99
Transcript
Chapter 6 Effects of salinity on germination
Chapter 6
EFFECTS OF SALINITY LEVELS AND SEED MASS ON GERMINATION
IN AUSTRALIAN SPECIES OF FRANKENIA L. (FRANKENIACEAE).
Lyndlee C. Easton & Sonia Kleindorfer
ABSTRACT
Easton, L.C. & Kleindorfer, S. (In press) Effects of salinity levels and seed mass on germination in Australian species of Frankenia L. (Frankeniaceae). Environmental and Experimental Botany.
Halophyte species demonstrate differing levels of salt tolerance. Understanding interspecific
variation to salinity levels is of value from both the scientific perspective, which includes the
identification of traits associated with salinity tolerance, as well as from an applied
perspective, which includes identifying plant species for specific salinity restoration and
remediation projects. This paper investigates the effects of salinity on germination of 12
Australian species of the plant genus Frankenia L. (Frankeniaceae). We use saline solutions
that corresponded to the average soil-water salinity concentrations in the arid zones of inland
Australia. These solutions consisted of 10mM calcium chloride, 30mM magnesium sulphate,
and 450mM sodium chloride. The aims of our study were: (1) to investigate germination
(germination rates, germination success) of Frankenia seeds to four salinity levels (0%, 10%,
20%, 30%), (2) to test for possible interaction effects between seed mass, germination, and
salinity, and (3) to examine the effect of salinity levels on the inhibition of germination and/or
seed damage. Species varied in their salt tolerance for germination rates and success. Species
with larger seeds had higher germination rates and germination success for high salinity
levels. Several species did not germinate well at any salinity level. Finally, no seeds were
adversely affected by exposure to high salinity levels pre-germination. There is potential for
including some Frankenia species in remediation and revegetation projects in areas affected
by salinity, and also as garden plants in saline regions.
Key words: Australian arid zone plants, germination rates, germination success, salinity
99
Chapter 6 Effects of salinity on germination
INTRODUCTION
In 1995, global estimates indicated that at least 1.5 billion hectares of land were
affected by salinity (Yenson 1995). The National Land and Water Resources audit found that
in Australia, approximately 5.7 million hectares were at risk or affected by salinity. This
report predicted that within 50 years, the land area in Australia affected by salinity would
increase to 17 million hectares. Soil salinization results from brine contamination associated
with oil and gas production, a build up of ions in irrigated regions, excessive land clearance,
and coastal incursions (Keiffer & Ungar 2001). Plant growth is detrimentally impacted by
salinity. Regions affected by salinity may become unvegetated if not remediated, due to the
unfavourable properties of saline soil and the consequent soil erosion (Keiffer & Ungar 2001).
However, salinity is not detrimental to all plants, and some plant species known as
halophytes, grow naturally on saline soils. Boyko (1966) was the first to suggest that
halophytic plants could be used to rehabilitate saline soils (i.e. phytoremediation). Ravindran
et al. (2007) demonstrated that soil salinity levels, as measured by electrical conductivity
(EC), can be reduced by the cultivation of halophytes on soils affected by salinity by
accumulating salts in their plant tissues. Halophytes can also lower water tables, and their
roots bind soil thus preventing soil erosion (see www.crcsalinity.com).
Halophytes are exposed to enormous variations in temperature and salinity. Surface
soils have salinity levels ranging from 2 – 100 times that of the subsoil, and present an even
more extreme environment to seeds than to the established plant (Ungar 1978). Thus, the
critical stages in the life histories of halophytes are germination and seedling establishment.
The success of a plant species depends on its seeds remaining viable during times of high
salinity levels, and its ability to germinate readily when salinity stress is reduced (Khan et al.
2006). However, seed germination, even for most halophytes, is extremely sensitive to soil
salinity, and maximum germination occurs under non-saline conditions (Vicente et al. 2004).
An increase in salinity levels causes both a reduction in percentage of seeds germinating and a
delay in the initiation of the germination process, which can cause complete inhibition of the
germination process (Pujol et al. 2000).
Timing of germination is crucial in the life cycle of halophytes. Germination in a salt-
stressed environment exposes seedlings to high risks of mortality. Excess salt reduces a
seedling’s ability to extract water from the soil, causing wilting and eventual death (Woodell
Some salts (e.g. sodium and magnesium) are also toxic to plants (Ungar 1991). In Australia,
100
Chapter 6 Effects of salinity on germination
seeds of halophytic species typically germinate early in the spring when soil salinity levels are
reduced, which promotes seedling establishment prior to the high salt-stressed conditions
caused by hot, dry summers. However, many halophytes have the potential to germinate at
any time of the year under favourable conditions (rainfall, optimum temperatures, and
reduced salinity).
Germination has also been linked to seed mass. Large seeds tend to have faster
germination rates when compared to small seeds (e.g. Fenner 1983, 1992; Milberg et al. 1996;
Easton & Kleindorfer 2008a, 2008b). As a consequence, seedlings from larger-seeded species
should be able to establish under a range of environmental conditions that cannot be exploited
by smaller-seeded species. Large-seededness in plants may be an adaptive strategy in drought
prone regions (see Baker 1972; Salisbury 1974; Wulff 1986; Mazer 1990; Geritz et al. 1999;
Susko & Lovett Doust 2000; Westoby et al. 2002). Increased salinity, which results in a
physiologically induced drought, may also induce larger seed masses (Fenner 1992). Rapid
seed germination, often characteristic of halophytes, may be an adaptive strategy to utilize any
soil water with reduced salinity levels – even of short duration (Khan & Ungar 1996).
However, the correlation between germination rates in halophytes and seed mass has received
limited investigation (Leishman & Westoby 1994).
Halophyte species exhibit different levels of salt tolerance (Vicente et al. 2004). A
better understanding of interspecific variation to salinity stress is constructive from both the
scientific perspective, which includes the identification of traits associated with salinity
tolerance, as well as from an applied perspective, which includes identifying plant species for
specific restoration and remediation projects (Hester et al. 2001). This paper investigates the
effects of salinity on germination in Australian species of Frankenia L. (Frankeniaceae).
Frankenia is a cosmopolitan halophytic plant genus that occurs in Mediterranean, semi-arid,
and arid regions. Ecological data on Frankenia as a taxon, and specifically the 47 species of
Australian Frankenia, are limited. Published data on Frankenia germination are limited to
Brightmore’s (1979) study of F. laevis L. (a European species), and botanical tomes (e.g.
Elliot & Jones 1986; Wrigley & Fagg 2003). Only a few Australian species are currently
cultivated (e.g. F. pauciflora, F. connata) despite their recognized tolerance to soil salinity
and drought conditions. There is also potential for including Frankenia in remediation and
revegetation projects in areas affected by increasing salinity.
We compare seed germination in 12 Australian Frankenia species that have been
subjected to various levels of salinity. We test for interspecific variation in germination rates
and germination success, also in relation to large- and small-seededness. Six of these 12
101
Chapter 6 Effects of salinity on germination
species have low numbers of ovules per flower and thus produce low numbers of larger seeds
per fruit (‘larger-seeded species’ sensu Easton & Kleindorfer 2008a) and six species have
high numbers of ovules per flower and produce many smaller seeds per fruit (‘smaller-seeded
species’ sensu Easton & Kleindorfer 2008a). Larger- and smaller-seeded Frankenia species
often occur in close geographical proximity, even within the same community. This provides
a good opportunity to examine selective pressures that have shaped these geographically co-
occurring reproductive strategies.
The aims of our study were: (1) to investigate germination (germination rates,
germination success) of Frankenia seeds at four salinity levels (0%, 10%, 20% 30%), (2) to
test for possible interactions between seed mass, salinity, and germination, and (3) to examine
the effects of salinity levels on inhibition of germination and/or seed damage. We predicted
higher germination rates and germination success in larger-seeded species overall and notably
at higher salinities. We also predicted high recovery rates in Frankenia species after exposure
to high salinities.
MATERIALS AND METHODS
Test species
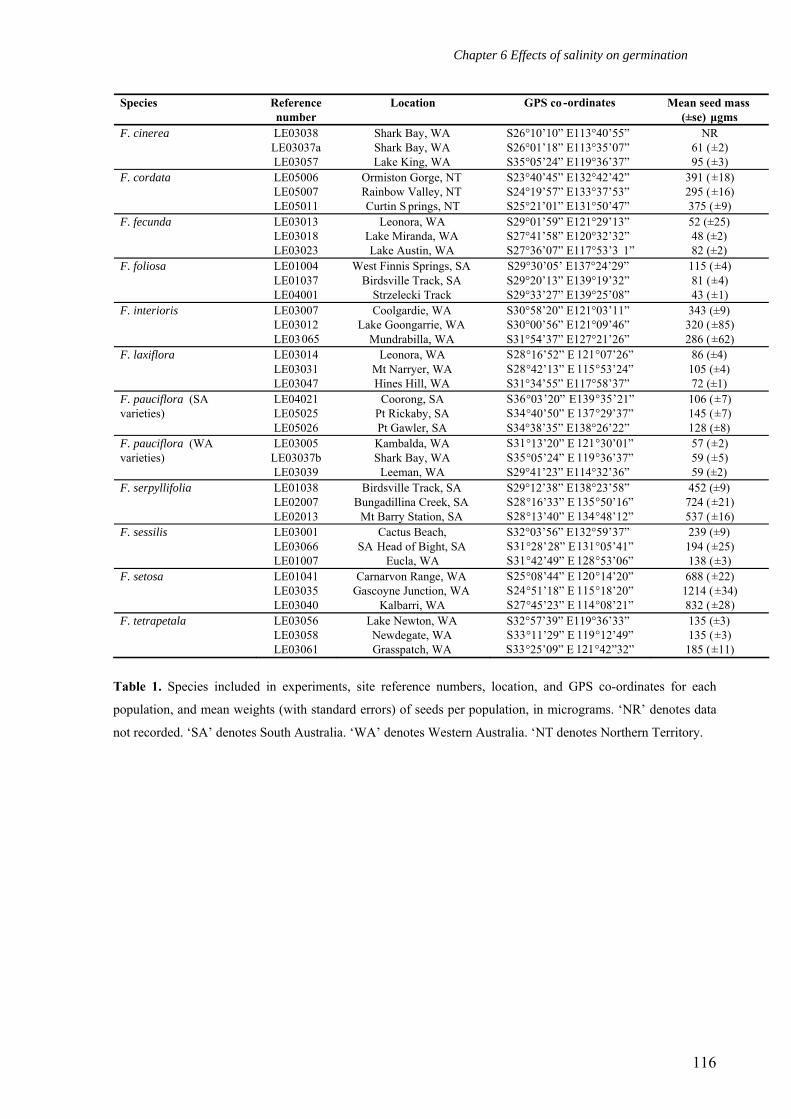
Table 1 lists the population locations, and the mean seed mass of the species included
in this study. We follow the taxonomic descriptions proposed by Summerhayes (1930), and
revised by Barnsley (1982). Mean seed mass was calculated by individually weighing 150
seeds per population on a Mettler Toledo MX/UMX microbalance. Twelve Frankenia species
were included in this study, six species with a low number of ovules per flower and larger
seeds (F. cordata J.Black, F. interioris Ostenf., F. serpyllifolia Lindl., F. sessilis Summerh.,
F. setosa W.Fitzg., F. tetrapetala Labill.), and six species with a high number of ovules per
flower and smaller seeds (F. cinerea A. DC., F. fecunda Summerh., F. foliosa J.Black, F.
laxiflora Summerh., and two varieties of F. pauciflora DC). A recent revision of F. pauciflora
demonstrated that two varieties of F. pauciflora, one from South Australia and the other from
Western Australia, are sufficiently unrelated to warrant their inclusion as two separate species
in this study (Craigie 2007).
102
Chapter 6 Effects of salinity on germination
Seeds were collected from naturally occurring populations in early autumn from 2001
to 2005,1 and stored in air tight containers at optimal seed storage conditions (see Wrigley &
Fagg 2003). Seeds from all species were periodically germinated over time to check for loss
of viability. No degradation in seed germinability, or indication of seed dormancy was found
during this time period. Frankenia seeds have been demonstrated to retain viability for at least
seven years (Easton & Kleindorfer 2008a).
Pilot study
A preliminary trial by T. Playford and L. Easton (2003, Flinders University,
unpublished data) tested the effects of four levels of salinity (0%, 25%, 50% and 75%
seawater) at three temperatures (16°C, 24°C, 30°C) on germination in two species of
Australian Frankenia, one larger-seeded species (F. serpyllifolia), and one smaller-seeded
species (F. foliosa). These two species co-occur along the Oodnadatta Track in the ‘Far
North’ of South Australia. There were statistically significant differences in the germination
rates between these two species, (Students t-test: t = 4.42, df = 47, P<0.001), with higher
germination rates at all temperatures per salinity levels in the larger-seeded species.
Salinity experiments
Germination experiments followed the protocols of the Integrated Screening
Programme (Hendry & Grime 1993). To examine the effects of salinity on germination rates
and germination success, replicates of 15 seeds were sown on Whatman Number 1 filter paper
in 500 ml plastic containers. The filter papers were placed on round perforated PVC disks
supported by 10 mm legs, thus suspending the filter paper and seeds over a 100 ml reservoir
of solution (adapted from Zubrinich 1990). The filter paper and the seeds were thus constantly
base-watered (see Ahmad & Ismail 1995). Containers were sealed to prevent evaporation and
maintained at 20°C (as per Ransom Seed Laboratory 2003, and see Chapter 4) in a growth
cabinet illuminated with Silvanian Gro-lights (25 μmol m-2s-1, 400–700 nm) on a 14-hour
day/10-hour night regime. Seeds were checked every second day, at which time germinated
seeds were counted and removed. Seeds were considered germinated with the emergence of
the radicle. Any seeds affected with fungal infection were scored as non-viable and removed
to prevent the fungal spores from spreading to other seeds.
1 Herbarium specimens and collection details, including month and year of seed collection, and number of plants sampled per population, are available from the authors at Flinders University, School of Biological Sciences.1
103
Chapter 6 Effects of salinity on germination
The main salt components in saline soils are Na+, Mg2+, Ca2+, Cl- and SO4- (Shanberg
1975). However, many studies examining the effects of salinity on plants have been carried
out using only sodium chloride (NaCl) or dilutions of seawater (Tobe et al. 2000). We used
saline solutions that corresponded to the average soil-water salinity concentrations in the arid
zones of inland Australia (see Kroker 1996). These solutions consisted of 10mM calcium
chloride, 30mM magnesium sulphate, and 450mM sodium chloride. Four salinity
concentrations (0%, 10%, 20%, 30%) were tested, based on preliminary studies for salt
tolerance limits of several Frankenia species (Kroker 1996; T. Playford & L. Easton,
unpublished data), and demonstrated by Brightmore (1979) with F. laevis. Electrical
conductivities of the solutions are 0.4 dS/cm, 15.5 dS/cm, 26.2 dS/cm, and 38.9 dS/cm
respectively.
Germination rates
Experimental design followed a completely randomized block design (see Khan &
Rivzi 1994). We tested for the following effects: population and species (three populations
with four replications each for each of the 12 species), seed mass (assigned into two seed
categories of ‘larger-seeded’ and ‘smaller-seeded’ species), and treatment (0%, 10%, 20%,
30% saline solutions). This experimental design produced a total of 576 units (containers).
Statistical analyses utilized SPSS Version 14. To satisfy the requirements of
normality, data were arc-sine transformed. The germination rate for each species was
estimated using a modified Timson Index;
Germination rate =∑[(G1/t)+ (G2/t)…….+(Gt/t)]
where G is the percentage of seed germination at 2–day intervals, and t is the total number of
days of the germination period. A greater value of G indicates a faster germination rate. We
used a Nested (Hierarchical) Design ANOVA to calculate differences in germination rates
between species at each of the four salinity levels on Day 2, Day 4, Day 6 and Day 8.
Germination success
Germination success for each species was calculated using the ‘Time (in days) to
50% germination (T50)’ index (Trudgill et al. 2000). A Nested Design ANOVA calculated
differences in T50 between species at the four salinity levels.
104
Chapter 6 Effects of salinity on germination
Recovery experiments
After 28 days, solutions were discarded and ungerminated seeds were placed over a
reservoir of distilled water for a further 14 days to test whether the saline solutions had
inhibited germination (Khan & Ungar 1996; Pujol et al. 2000; Rubio-Cas et al. 2003). We
used 14 days as a cut-off because little additional germination occurred after 10 days from
transfer to distilled water (also see Khan & Ungar 1996; Ramírez-Padilla & Valverde 2005).
It was not necessary to do viability tests (e.g. using tetrazolium) on ungerminated seeds at the
end of experiment since most of the seeds that remained ungerminated showed clear signs of
rotting or fungal infection.
Percentage recovery germination was calculated using the following formula;
Recovery % = [a/(c-b)].100
where a is the total number of seeds germinated after being transferred to distilled water, b is
the total number of seeds germinating in the saline solution, and c is the total number of seeds
(modified from Khan & Gulzar 2003).
Effect of seed mass
Analyses testing for the effect of seed mass on germination rates followed the protocol
outlined in Chapter 3. We used a Nested (Hierarchical) Design ANOVA to investigate
differences in germination rates between larger-seeded and smaller-seeded species every two
days over a 28–day period, using temperature and seed mass as fixed factors, and species as a
random factor. Type III Sum of Squares were calculated for each test to adjust for the effect
of different species that were nested within each seed mass category.
Partial Eta Squares (ηp2) – a measure of effect size – were calculated. Measures of
effect size quantify the degrees of association or correlation between an effect (e.g. a main
effect or an interaction) and the dependent variable (Becker 2000). If the value of the measure
of association is squared, as it is for ηp2 it can be interpreted as the proportion of variance in
the dependent variable (i.e. germination) that is attributed to each effect, and is calculated as;
ηp2 = SS effect /(SS effect + SS error).
Statistically, ηp2 is the proportion of the Sum of Squares effects plus Sum of Squares error
variances that are attributed to the effects.
Finally, standard linear regression analyses assessed the relationship between mean
seed mass per species and germination rates (using the modified Timson Index) at each
105
Chapter 6 Effects of salinity on germination
salinity level, to test the null hypothesis of no relationship between seed mass and germination
rate.
RESULTS
Germination rates
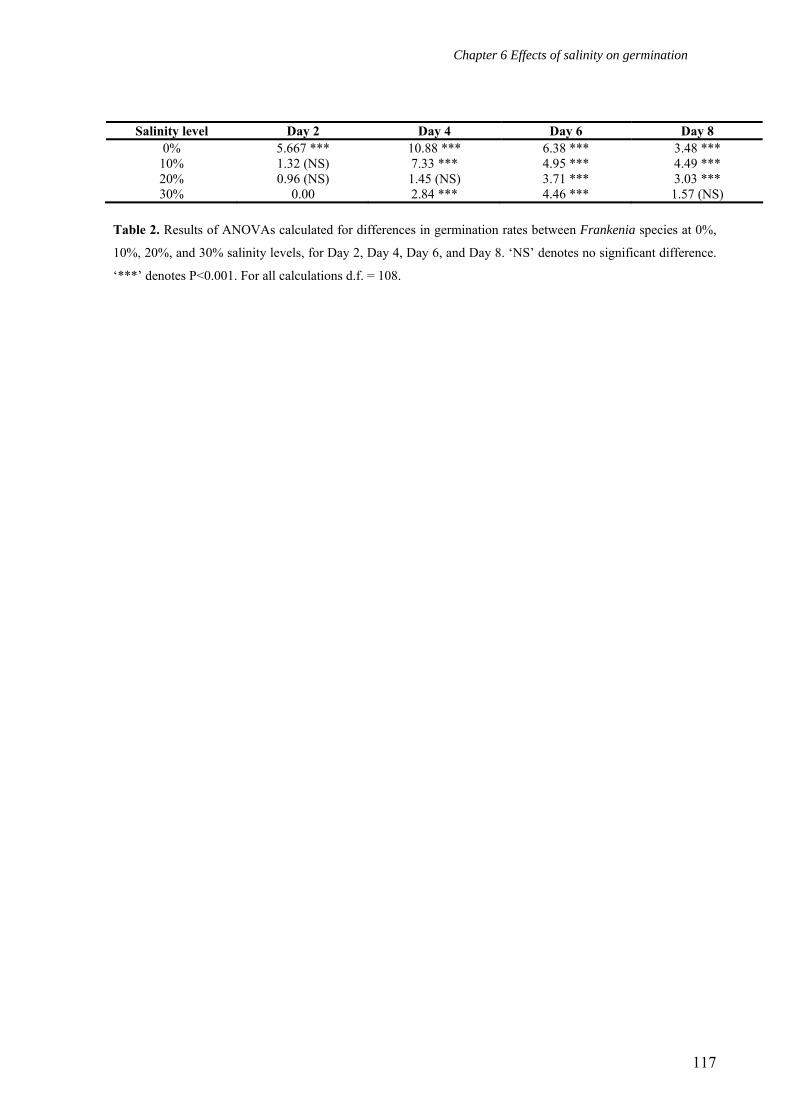
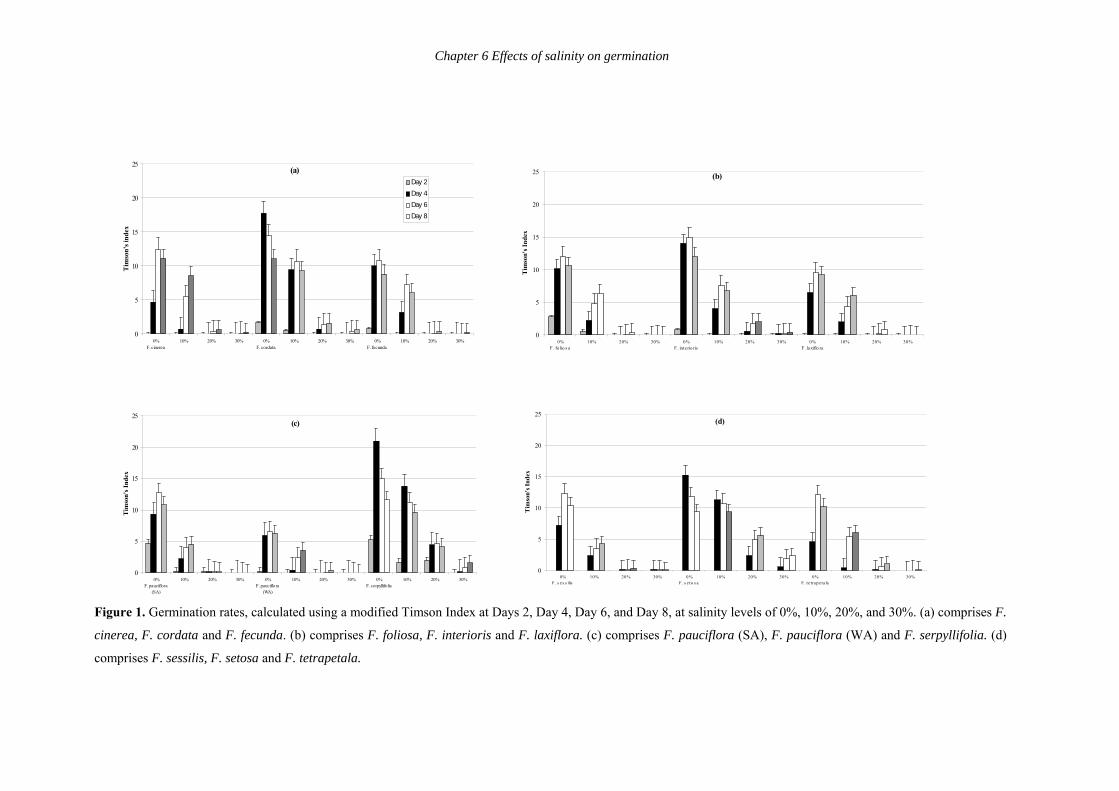
Figure 1 shows germination rates per species as calculated by a modified Timson
Index at Day 2, Day 4, Day 6, and Day 8 per salinity level (0%, 10%, 20%, and 30%).
Germination rates were significantly different (at P<0.001 – see Table 2) between species per
salinity level at P<0.001 at each 2-day interval except Day 2 at 10%, 20%, and 30%, Day 4 at
20%, and Day 8 at 30%, where germination rates were not significantly different (see Table
2). Species varied in their germination rates per salinity level. For example, F. cordata had the
highest germination rate on Day 4 at 0% salinity, on Day 6 at 10% salinity, and on Day 8 at
20% and 30% salinity, whereas F. foliosa had the highest germination rates on Day 6 at 0%,
on Day 8 at 10%, and had nominal germination at 20% and 30%. Only a few F. laxiflora
seeds germinated for any salinity levels until Day 4 or later. Frankenia cordata, F. interioris,
F. serpyllifolia and F. setosa had the highest germination rates for all salinity levels.
Frankenia setosa had the highest germination rates at 20% and 30% of all the Frankenia
species being tested. Frankenia pauciflora (WA), F. laxiflora and F. fecunda had consistently
low germination rates. Interestingly, F. foliosa had amongst the highest germination rates at
Day 2 for 0% and 10% salinity, but amongst the lowest germination rates for 20% and 30%
salinity levels. Also, F. pauciflora (SA) had high germination rates at Day 2 for 0% salinity
but among the lowest germination rates for all other salinity levels.
A further notable trend was that species with high germination rates were larger-
seeded species. Larger-seeded species had high germination rates for up to 30% salinity
levels. Smaller-seeded species had relatively lower germination rates. Frankenia sessilis and
F. tetrapetala had slower germination rates than the other larger-seeded species. The latter
two species have a coastal distribution, and appeared to respond to salinity levels similarly to
F. pauciflora (SA) and F. pauciflora (WA), which are also coastal species (see below).
Germination success
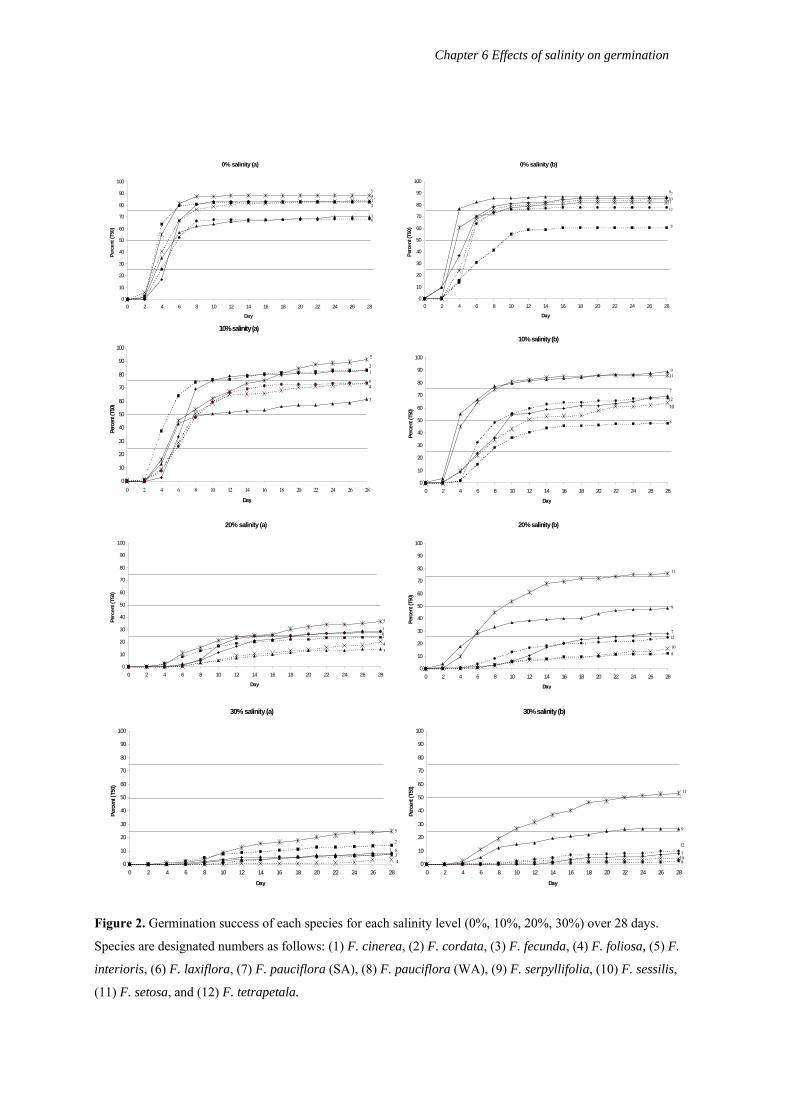
Figure 2 shows the germination success of the 12 species calculated over 28 days at
the four salinity levels. There were significant differences in germination success between
106
Chapter 6 Effects of salinity on germination
species (measured as time in days to reach 50% germination; T50) for all salinity levels. At 0%
salinity, time to T50 ranged from Day 4 (F. cordata, F. interioris, F. serpyllifolia, F. setosa) to
Day 10 (F. pauciflora (WA)) (ANOVA: F = 2.27, df = 11, P<0.01). In addition, T75 (time to
75% germination) was reached by nine of the 12 species by Day 28. At 10% salinity, time to
T50 ranged from Day 4 (F. serpyllifolia) to Day 12 (F. sessilis), with the exception of F.
pauciflora (WA) which had not reached T50 by Day 28 (only 48.7%) (F = 3.94, df = 11,
P<0.001). Only five of the 12 species reached T75 by Day 28.
At 20% salinity, only F. setosa reached T50 (by Day 10) (F = 20.69, df = 11, P<0.001),
and also reached T75 within the 28 day period. However F. serpyllifolia had 48% germination
success. Five further species (F. cinerea, F. interioris, F. laxiflora, F. pauciflora (SA), F.
tetrapetala) reached T25 by Day 28. At 30% salinity only F. setosa reached T50 (by Day 22) (F
= 24.4, df = 11, P<0.001), and a further two species (F. interioris, F. serpyllifolia) reached T25
by Day 28. Frankenia foliosa and F. pauciflora (WA) had very low germination (3.33% and
2.78% by Day 28 respectively).
Recovery
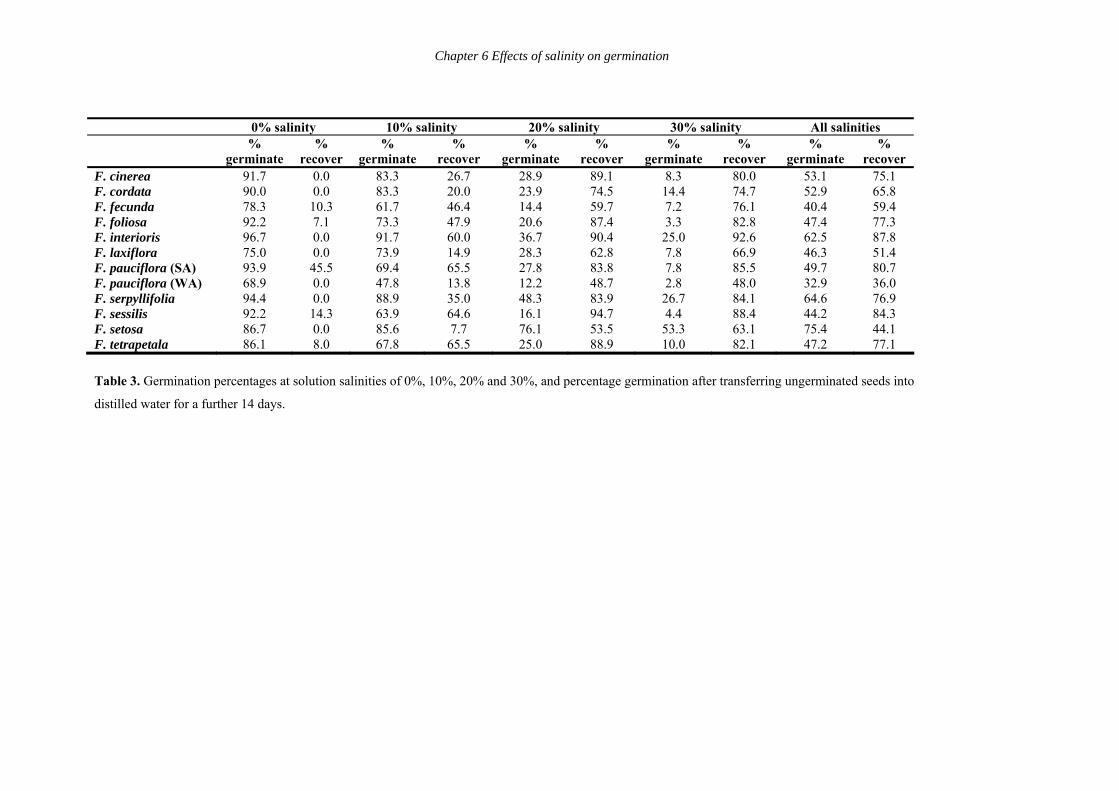
Table 3 lists the percentage of seeds that germinated per species per salinity level by
Day 28, and the percentage of ungerminated seeds that germinated in distilled water over 14
days after being transferred from the saline solutions. Overall, germination to Day 28 (i.e. the
combination of all the salinity levels) ranged from 32.9% (F. pauciflora (WA)) to 75.4% (F.
setosa). Percentage recovery after transfer of ungerminated seeds to distilled water ranged
from 36% (F. pauciflora (WA)) to 87.8% (F. interioris) with an average recovery of 68%.
This suggests that seed viability is not adversely affected by exposure to highly saline water,
and germination rates may be enhanced by exposure to high salinity for some species.
In 0% salinity, all species had greater than 69% germination by Day 28, and six
species had greater than 90% germination. With the exception of F. pauciflora (SA), there
was generally no recovery after transferring ungerminated seeds to distilled water as expected.
At 10% salinity, all species had between 60% and 92% germination, with the exception of F.
pauciflora (WA) (47.8%). Five species had greater than 80% germination, notably F.
interioris (91.7%). Recovery after transfer to distilled water ranged from 7.7% for F. setosa
(but note the original high germination of 85.6%) to 65% for F. pauciflora (SA), F.
tetrapetala and F. sessilis. At 20% salinity, all but three species had greater than 20%
germination by Day 28, notably F. setosa (76.1%) and F. serpyllifolia (48.3%). Recovery
after transfer to distilled water was greater than 48% for all species (i.e. higher than recovery
107
Chapter 6 Effects of salinity on germination
after exposure to 10% salinity). At 30% salinity, germination ranged between 2.8% (F.
pauciflora (WA)) and 53.3% (F. setosa). All but four species had less than 10% germination.
All species with high germination were larger-seeded species. Recovery was greater than 48%
for all species, and three species had greater than 70% recovery, notably F. interioris (92.6%).
Effect of seed mass
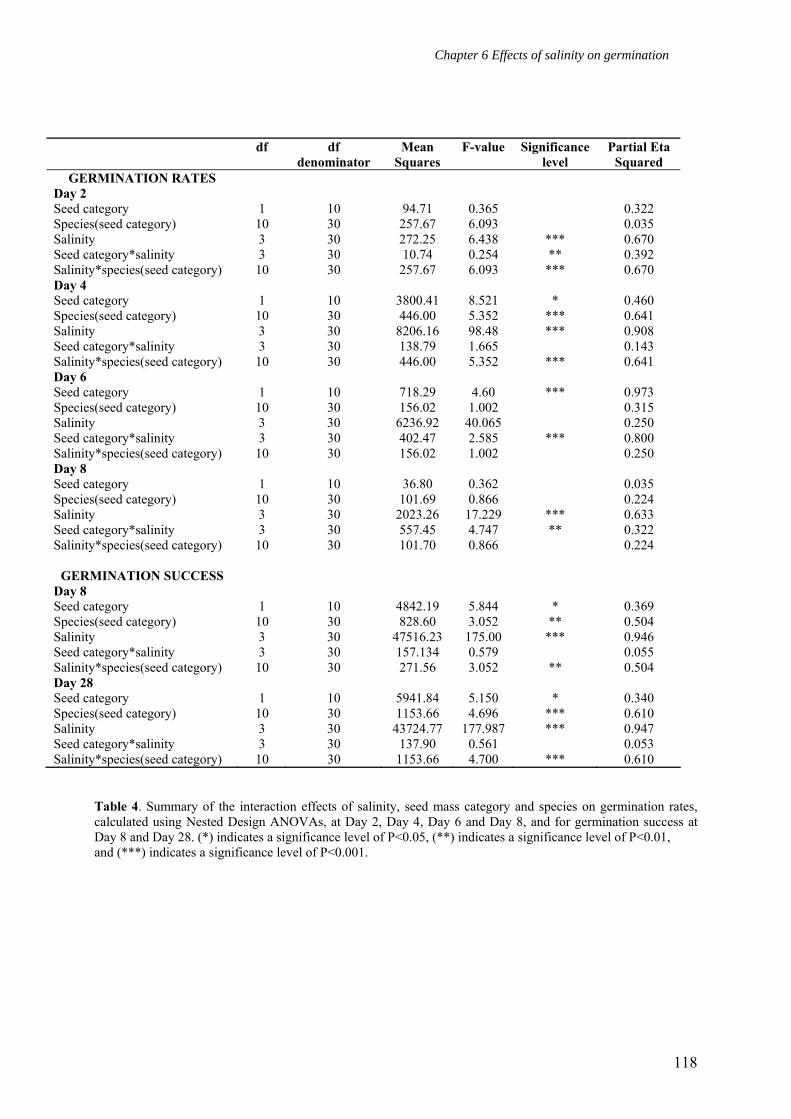
Table 4 lists the effect of the interaction between salinity*species(seed mass category)
on germination rates for Day 2, Day 4, Day 6, and Day 8, and on germination success for Day
8 and Day 28. Notable are the significant differences in germination rates at Day 2 and Day 4,
and in germination success at Day 8 and Day 28. Table 5 lists the differences in germination
rates between species(seed mass category) (henceforth called the SSM) at Day 2, Day 4, Day
6 and Day 8, and in germination success at Day 28 for each salinity level. Germination rates
were significantly different between SSM on Day 2 at 10% salinity, Day 2 at 20% salinity,
and Day 8 at 30% salinity.
We examined the Partial Eta Squared (ηp2) values to identify the degree of association
between germination and SSM. First we examined differences in germination between larger-
seeded and smaller-seeded species by combining the results of all four salinity categories (see
Table 5). The largest interaction occurred on Day 2, accounting for 67% of the total variance
in the performance scores (i.e. germination).
Next we examined differences in germination rates that could be attributed to the SSM
effect within each of the four salinity levels (0%, 10%, 20%, 30%). The days for which
germination was influenced by SSM varied between salinity levels. At 0% salinity, the
highest SSM effect occurred on Day 6 (44%). At 10% salinity, the highest SSM effect
occurred on Day 2 (60%). At 20% salinity, the highest SSM effect occurred on Day 2 (84%).
At 30% salinity, the highest SSM effect occurred on Day 8 (66%). The importance of seed
mass for germination success increased with salinity levels. Germination success at Day 28
attributable to SSM effect was most pronounced for 20% salinity (61%) and 30% salinity
(78%).
Finally, standard linear regression analyses calculated the relationship between mean
seed mass per species and germination rates (Timson Index at Day 28) for each salinity level,
to test the null hypothesis of no relationship between seed mass and germination rate. The null
hypothesis was supported for 0% salinity (r2 = 0.13, F = 1.42, P = 0.26), and 10% salinity (r2 =
0.30, F = 4.33, P = 0.06). This finding suggests that only 13% and 30% respectively of the
increase in germination rates could be explained by an increase in seed mass during the 28-
108
Chapter 6 Effects of salinity on germination
day period. Examination of residual plots revealed that within the smaller-seeded species, an
increase in seed mass did not necessarily correlate with an increase in germination rates.
However, there was a significant relationship between seed mass and germination rates for
20% salinity (r2 = 0.77, F = 32.43, P<0.001), and 30% salinity (r2 = 0.85, F = 55.89, P<0.001),
indicating that 77% and 85% respectively of the increase in germination rates could be
explained by an increase in seed mass at these higher salinity levels during the 28–day period.
DISCUSSION
This study provides evidence that germination in Frankenia species varies in relation
to salt tolerance and seed mass. Some species did not germinate well at any salinity level (e.g.
F. pauciflora (WA)). In contrast, several species had high germination rates and success for
salinity levels ranging from 10% – 30% (EC: 15.45 dS/m – 38.87 dS/m) (e.g. F. setosa, F.
interioris), and others showed delayed germination until seeds were in contact with the saline
water for up to eight days (e.g. F. cinerea, F. laxiflora). This study also found an effect of
seed mass on germination rate in relation to salinity levels: larger-seeded species had higher
germination rates and germination success in general, but notably at higher salinity levels. No
seeds of Frankenia species were adversely affected by exposure to high salinity levels pre-
germination.
Germination rates and germination success decreased as salinity levels increased (as
expected), although there was statistically little difference in germination success between 0%
and 10% salinity for most species. The notable exception was F. pauciflora (WA). We have
previously documented this species as having poor germination success (see Chapter 4), and
suggested that temperatures less than 17°C may be necessary for optimal germination activity.
The constant temperature of 20°C applied in this study may not be conducive for successful
germination in F. pauciflora (WA). Temperature has been reported to modulate seed
germination under saline conditions (Khan & Gulzar 2003).
Frankenia seeds remained viable after exposure to high salinities. In this study, the
overall germination percentage (the sum of all germination in all salinities) was greater than
40% for all species except F. pauciflora (WA), and there was a high percentage of
germination recovery when ungerminated seeds were transferred to distilled water (>50% per
species, and up to 88% in F. interioris). Specifically, seeds germinated quickly when salinity
109
Chapter 6 Effects of salinity on germination
stress was removed. Exposure to high salinity is documented to prime seeds in many salt
tolerant species before germination (Ungar 1996) and may be occurring here.
Halophytes have developed strategies to delay germination until conditions are
suitable for seedling establishment. Some species restrict germination at salinities less
favourable for seedling establishment, but do not prevent germination. Alternately, halophytes
can inhibit all germination at salinities beyond the tolerance of the species (Ungar 1978). It
appears that in most Australian Frankenia species, germination is restricted by salinity
although the germination rates are species specific and vary with salinity levels. Only F.
pauciflora (WA) appears to have some mechanism to inhibit germination when subjected to
salinity. A study by Brightmore (1979) on the European species F. laevis (the only other
published account on the effects of varying salinity levels on germination in Frankenia)
demonstrated 75% germination at 0% salinity, 30% germination at 20% salinity, and 15%
germination at 25% salinity, but only 1% at greater than 33% salinity. We also noted 75%
germination or greater at 0% salinity (i.e. no salinity stress) in all species except F. pauciflora
(WA) (69%), and peaked at 97% for F. interioris. At 30% salinity, most species had greater
than 5% germination (except F. pauciflora (WA) 2.8%, F. foliosa 3.3%, F. sessilis 4.4%), and
three species had greater than 25% germination (F. interioris 25%, F. serpyllifolia 27%, F.
setosa 53%).
Also noteworthy are the slow germination rates of F. foliosa, F. pauciflora (SA), F.
pauciflora (WA), F. sessilis and F. tetrapetala at the higher salinity levels. These are all
coastal species (often found in saltmarshes) except for F. foliosa (found around the edges of
inland salt lakes) and are thus all subjected to highly saline conditions (note that seawater has
an EC of approximately 55 dS/m). Slow germination rates may be linked to seed dispersal. It
is suggested that the main mode of seed dispersal in Frankenia is by water, and in the case of
the above mentioned species, seawater (Brightmore 1979). Seeds of these species would need
to remain dormant while dispersal occurs. Presumably, the plesiomorphic Frankenia were
smaller-seeded coastal species, which were globally dispersed by water – specifically, across
oceans (see Summerhayes 1930; Brightmore 1979). Their seeds would have needed
mechanisms to prevent them from germinating in saline water and to remain viable when
subjected to high salinity over long periods of time. Frankenia pauciflora (WA) is considered
the ancestral Australian Frankenia species (Summerhayes 1930). The poor germination in this
species and the implied narrower window for germination success may be an ancestral
characteristic.
110
Chapter 6 Effects of salinity on germination
Effect of seed mass
Our study supports the hypothesis that germination is correlated with seed mass under
saline (or physiologically induced drought) conditions. The largest seeded Frankenia species
F. setosa, F. serpyllifolia, F. cordata, and F. interioris had the highest germination rates and
the highest germination success, which was most pronounced at the higher salinity levels
(greater than 25% germination at 30% salinity). This would be beneficial if rainfall events
were small or of short duration, and dilution of salinity levels of the soil-water would be
minimal. However, this bet-hedging strategy assumes that seedlings will be able to establish
quickly. Rapid soil-water loss through evaporation and infiltration, and the equally rapid
return to high salinity levels would follow minor rainfall events (in maybe just hours). Any
germinating seeds could soon dehydrate and die.
However, the smaller-seeded Frankenia species (e.g. F. fecunda, F. foliosa, F.
laxiflora) are successful in inland arid regions and have not been outcompeted by the larger-
seeded species. They have slow germination rates and low germination success at 20% and
30% salinity. Frankenia foliosa has greatly reduced germination even at 10% salinity. A
prerequisite for low soil-water salinity to induce germination would ensure that minor rainfall
events would not trigger germination, and the problems encountered by rapidly establishing
seedlings in rapidly drying environments would be moderated.
Seedling survival may depend on the concentration of salinity levels across the soil
profile (Gul et al. 2001). Salt concentrations in the soil surface layers around clay pans,
gilgais, and dry water courses are often considerably higher than the concentration in the sub-
surface soil layers. Thus, while soil surface layers may be encrusted with salt, the rooting
zones are less saline (Badman 1999; Gul et al. 2001). Larger-seeded Frankenia species are
commonly found near clay pans, gilgais and dry water channels (see Chapter 5). The rapid
germination rates associated with these larger-seeded species would enable developing
seedlings to establish quickly into the less saline sub-surface layers. Higher salinity in the
crustal layers at the germination stage would not necessarily signify adverse conditions for
seedling establishment. Frankenia species found around salt lakes, saltmarshes and salt-pans
are generally smaller-seeded species (see Chapter 5). Evaporation and soil-water infiltration
results in a return to concentrated salt crusts or depressions of the extremely highly saline
water. The sub-surface layers would continue to be highly saline. Slow germination rates and
low tolerance to salinity at the germination stage would favour these species. Only significant
rainfall events would dilute soil-water salinity levels for the period of time needed for plants
to establish beyond the early seedling stage to a more salt tolerant stage.
111
Chapter 6 Effects of salinity on germination
Conclusion
Arid, drought prone areas are often claimed to favour large-seededness. Here we show
that even within arid zones, micro-habitats may be important in determining optimal seed
mass. Variation in salt tolerance for germination may be important in explaining small-scale
variation in vegetation patterns among Frankenia species within close geographical
proximity. The results of this study provide indirect evidence that selection in some
Australian Frankenia species to develop larger seeds (a result of the reduction in ovule
number) has facilitated their establishment and reproduction under conditions that were less
favourable for smaller-seeded Frankenia species.
ACKNOWLEDGEMENTS
A Flinders University undergraduate project by T. Playford (2003) provided preliminary data of
Frankenia germination. D. Allen, T. Chapman, A. Craigie, R. Davies, G. and G. Easton, D. Mackay, and D.
Nicolle assisted with seed collection. Thanks to R. Crozier of Anna Creek Station and P. Barnes of Murnepeowie
Station for permission to collect seeds, to F. Badman and D. Albrecht for providing their localities for Frankenia
populations. Seeds was collected with permission in SA (DEHAA permit #Z24947 3), NT (Parks and Wildlife
Commission permit # 20216), WA (Conservation and Land Management), and NSW (National Parks and
Wildlife Services permit # B2368). This study was funded to LCE by the following: Australian Flora Foundation
Grant, Mark Mitchell Research Foundation Grant, Nature Foundation SA Postgraduate Scholarship Grant,
Native Vegetation Grant, Wildlife Conservation Foundation Grant, and the Flinders University Post-Graduate
Development program. This study is part of a PhD thesis undertaken by LCE at Flinders University, Adelaide,
South Australia.
REFERENCES
Ahmad, R. & Ismail, S. (1995) Rehabilitation of salinity tolerant plants under saline conditions. In: Biology of
salt tolerant plants. Khan, M.A. & Ungar, I.A. (eds.). Book Crafters, USA.
Badman, F.J. (1999) The Lake Eyre South study: Vegetation. Gillingham Publishing, South Australia.
Baker, H.G. (1972) Seed weight in relation to environmental conditions in California. Ecology 53: 997-1010.
Barnsley, B. (1982) Frankeniaceae. In: George A.S. (ed.) Flora of Australia Volume 8. Australian Government
Table 4. Summary of the interaction effects of salinity, seed mass category and species on germination rates, calculated using Nested Design ANOVAs, at Day 2, Day 4, Day 6 and Day 8, and for germination success at Day 8 and Day 28. (*) indicates a significance level of P<0.05, (**) indicates a significance level of P<0.01, and (***) indicates a significance level of P<0.001.
Table 5. Summary of the interaction effect of seed mass and species on germination rates, calculated using Nested Design ANOVAs, at Day 2, Day 4, Day 6 and Day 8, and for germination success at Day 28, at 0%, 10%, 20%, and 30% salinity. (*) indicates a significance level of P<0.05, (**) indicates a significance level of P<0.01, and (***) indicates a significance level of P<0.001
Figure 1. Germination rates, calculated using a modified Timson Index at Days 2, Day 4, Day 6, and Day 8, at salinity levels of 0%, 10%, 20%, and 30%. (a) comprises F.
cinerea, F. cordata and F. fecunda. (b) comprises F. foliosa, F. interioris and F. laxiflora. (c) comprises F. pauciflora (SA), F. pauciflora (WA) and F. serpyllifolia. (d)
comprises F. sessilis, F. setosa and F. tetrapetala.
(d)
0
5
10
15
20
25
0%F. s e s s ilis
10% 20% 30% 0%F. s e to s a
10% 20% 30% 0%F . te tra pe ta la
10% 20% 30%
Tim
son'
s Ind
ex
(b)
0
5
10
15
20
25
0%F . fo lio s a
10% 20% 30% 0%F . inte rio ris
10% 20% 30% 0%F . la xiflo ra
10% 20% 30%
Tim
son'
s Ind
e
Chapter 6 Effects of salinity on germination
x
(a)
0
5
10
15
20
25
0%F. cinerea
10% 20% 30% 0%F. cordata
10% 20% 30% 0%F. fecunda
10% 20% 30%
Tim
son'
s ind
ex
Day 2Day 4Day 6
(c)
0
5
10
15
20
25
0%F. pauciflora
(SA)
10% 20% 30% 0%F. pauciflora
(WA)
10% 20% 30% 0%F. serpyllifolia
10% 20% 30%
Tim
son'
s Ind
e
Day 8
x
Chapter 6 Effects of salinity on germination
0% salinity (a)
0
10
20
30
40
50
60
70
80
90
100
0 2 4 6 8 10 12 14 16 18 20 22 24 26 28
Day
Perc
ent (
T50)
5
63
2
41
0% salinity (b)
0
10
20
30
40
50
60
70
80
90
100
0 2 4 6 8 10 12 14 16 18 20 22 24 26 28
Day
Perc
ent (
T50)
971011
12
8
10% salinity (a)
0
10
20
30
40
50
60
70
80
90
100
0 2 4 6 8 10 12 14 16 18 20 22 24 26 28
Day
Perc
ent (
T50)
5
21
64
3
10% salinity (b)
0
10
20
30
40
50
60
70
80
90
100
0 2 4 6 8 10 12 14 16 18 20 22 24 26 28
Day
Perc
ent (
T50)
911
7
1210
8
20% salinity (a)
0
10
20
30
40
50
60
70
80
90
100
0 2 4 6 8 10 12 14 16 18 20 22 24 26 28
Day
Perc
ent (
T50)
516243
20% salinity (b)
0
10
20
30
40
50
60
70
80
90
100
0 2 4 6 8 10 12 14 16 18 20 22 24 26 28
Day
Perc
ent (
T50)
11
9
712
108
30% salinity (a)
0
10
20
30
40
50
60
70
80
90
100
0 2 4 6 8 10 12 14 16 18 20 22 24 26 28
Day
Perc
ent (
T50)
5
2
43
1 6
30% salinity (b)
0
10
20
30
40
50
60
70
80
90
100
0 2 4 6 8 10 12 14 16 18 20 22 24 26 28
Day
Perc
ent (
T50) 11
9
8
12
710
Figure 2. Germination success of each species for each salinity level (0%, 10%, 20%, 30%) over 28 days.
Species are designated numbers as follows: (1) F. cinerea, (2) F. cordata, (3) F. fecunda, (4) F. foliosa, (5) F.
interioris, (6) F. laxiflora, (7) F. pauciflora (SA), (8) F. pauciflora (WA), (9) F. serpyllifolia, (10) F. sessilis,